📺 Watch the Full Video Analysis
This article was automatically generated by the NFC Market Live AI analysis system. (Updated: 2026-08-31 21:40 JST)
📄 Primary Source
NFC Market Live
https://www.meti.go.jp/statistics/tyo/iip/result/pdf/press/b2020_202607sj.pdf, https://www.meti.go.jp/statistics/tyo/iip/result/pdf/reference/b2020_202607refsj.pdf, https://www.meti.go.jp/statistics/tyo/iip/result/pdf/real/b2020_202607figsj.pdf
📊 Deep dive into Japan’s July 2026 Industrial Production Index (preliminary) released by METI.
Production rose 0.1% MoM, marking a 4th straight monthly gain, yet the official assessment remains “flat/directionless.”
💡 Beneath the surface weakness, semiconductor manufacturing equipment output surged +45.3% YoY, and capital goods shipments jumped +13.5% YoY—signaling robust capex momentum.
Meanwhile, operating ratio jumped +4.1% MoM even as production capacity fell for a 28th consecutive month—a structural shift in Japan’s manufacturing base.
⚠️ The forecast survey points to +6.4% for August, but realization ratios have persistently disappointed, and the business sentiment DI has deteriorated.
We unpack the strength-weakness crosscurrents and their implications for Japanese equities and BOJ policy.
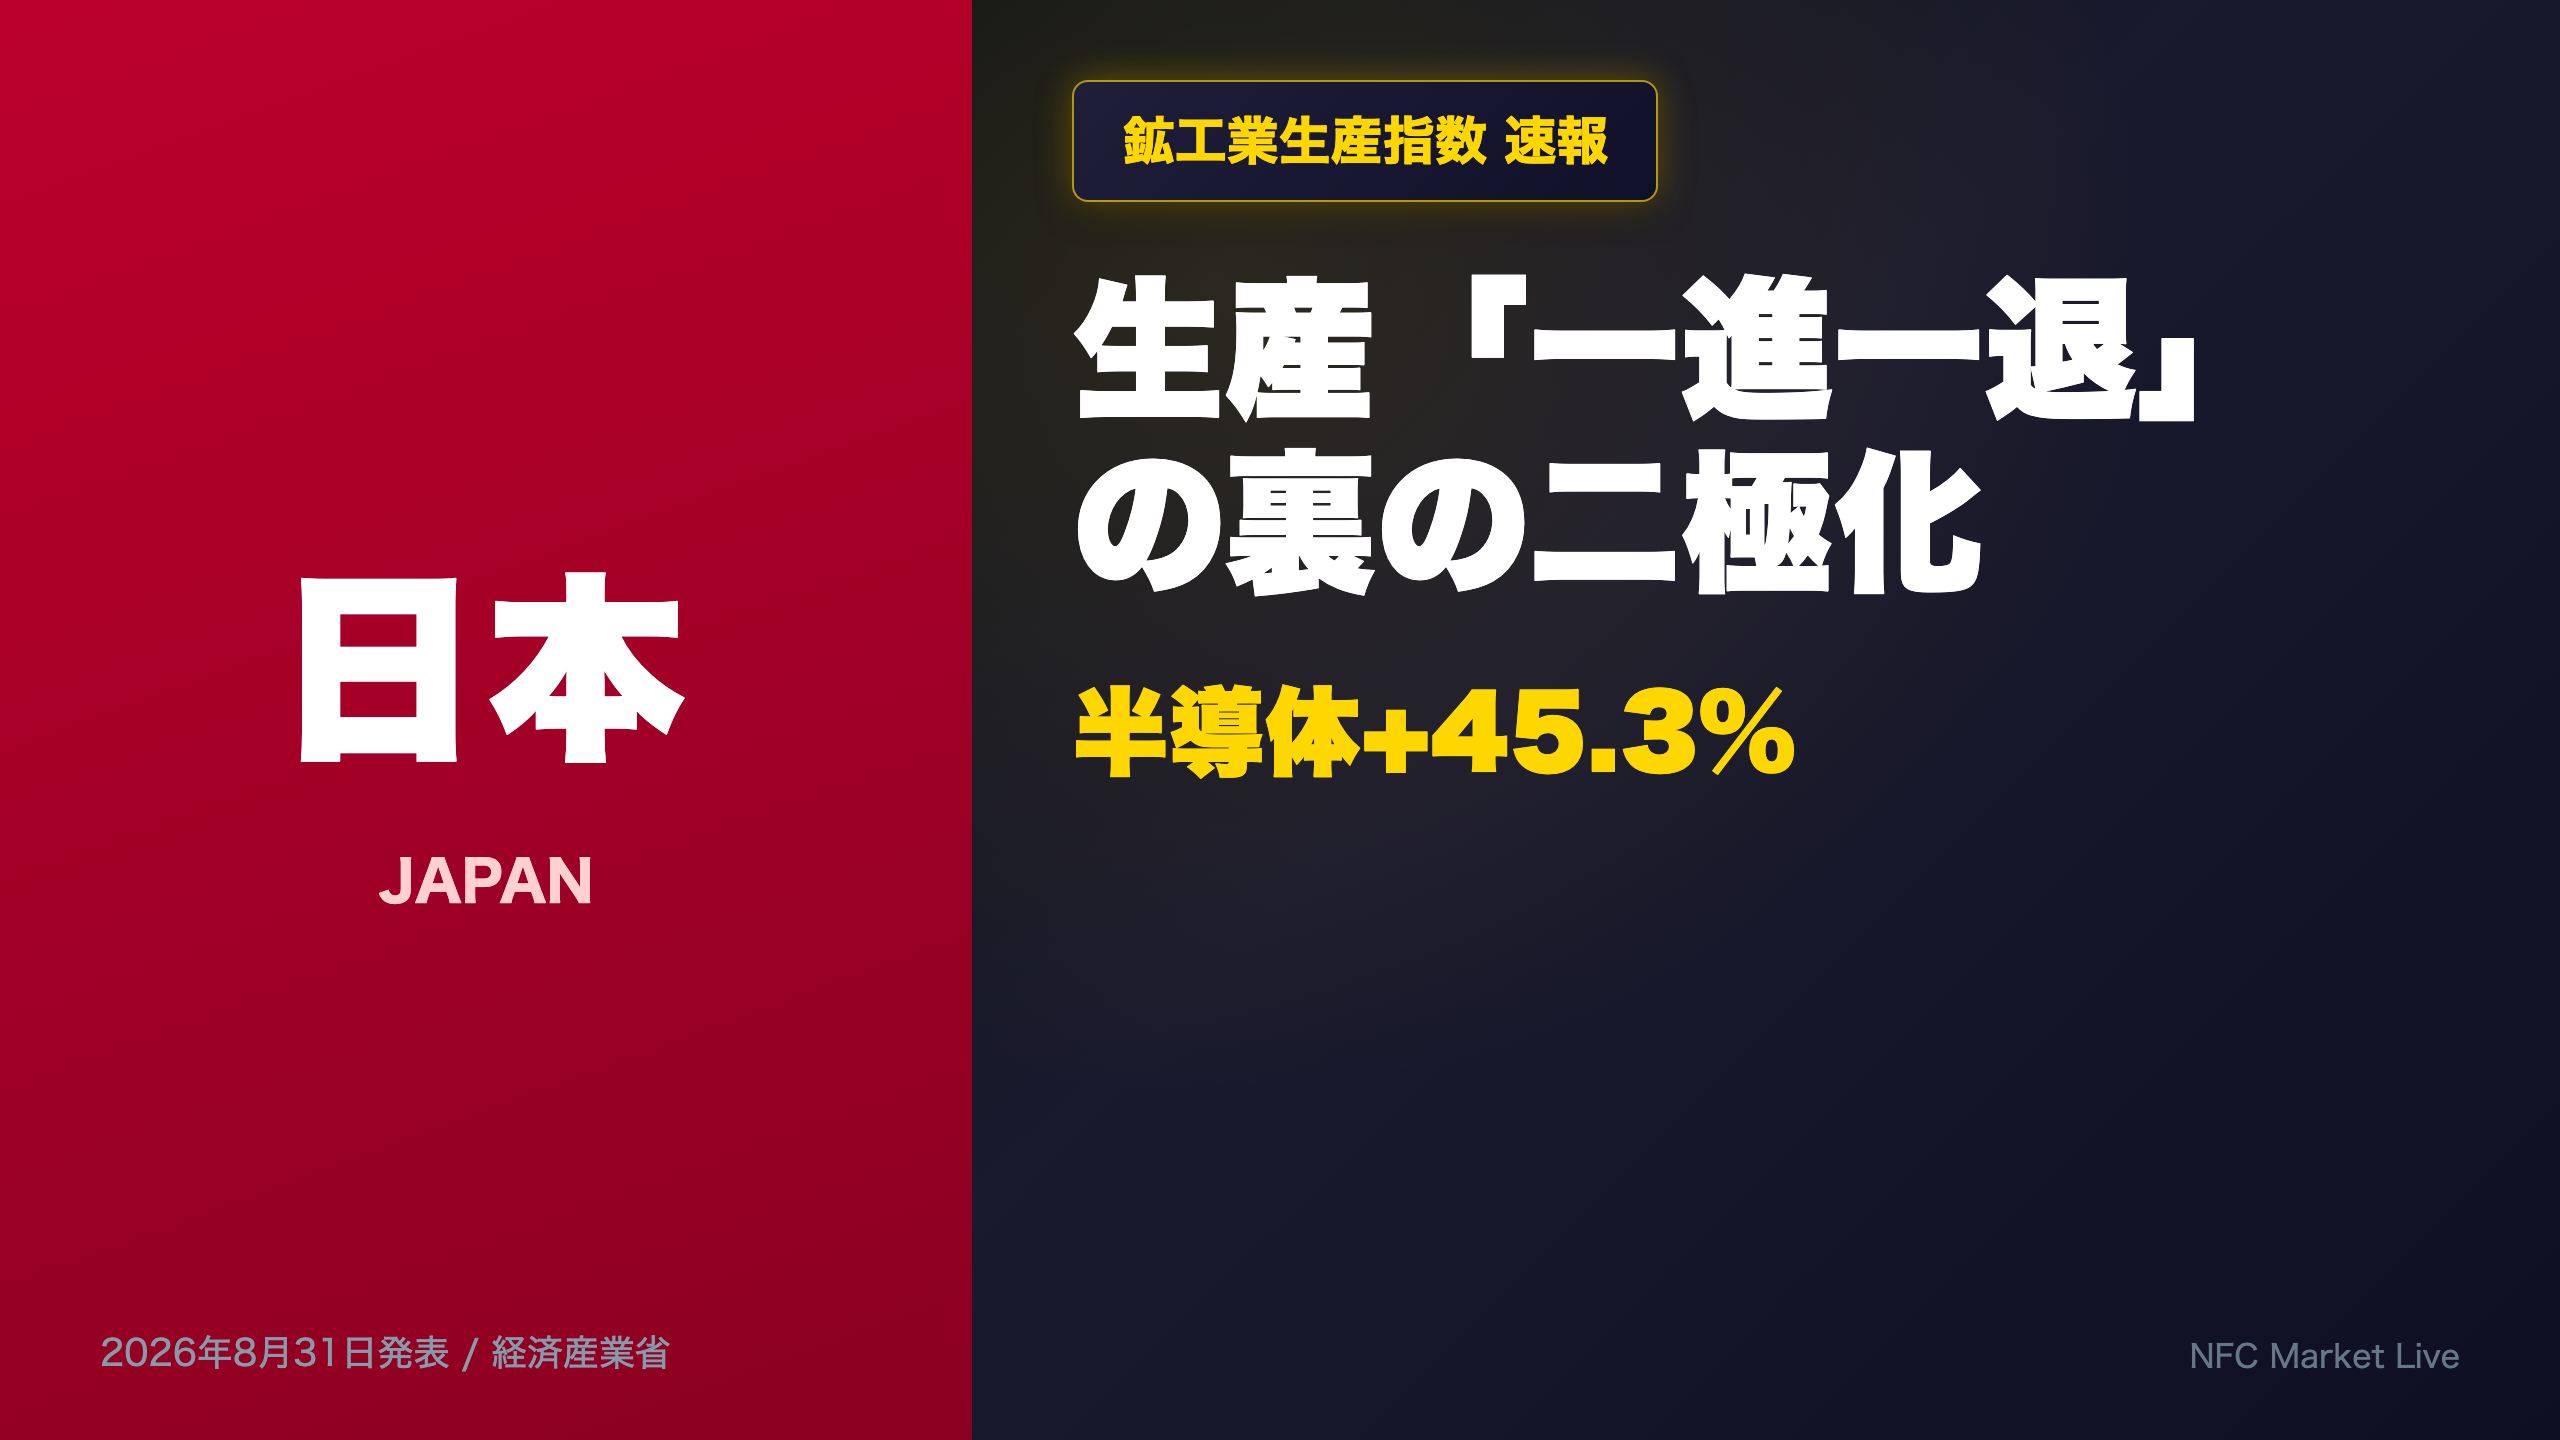
The Ultimate Summary:生産「一進一退」の裏の二極化
The Headline vs. The Undercurrent
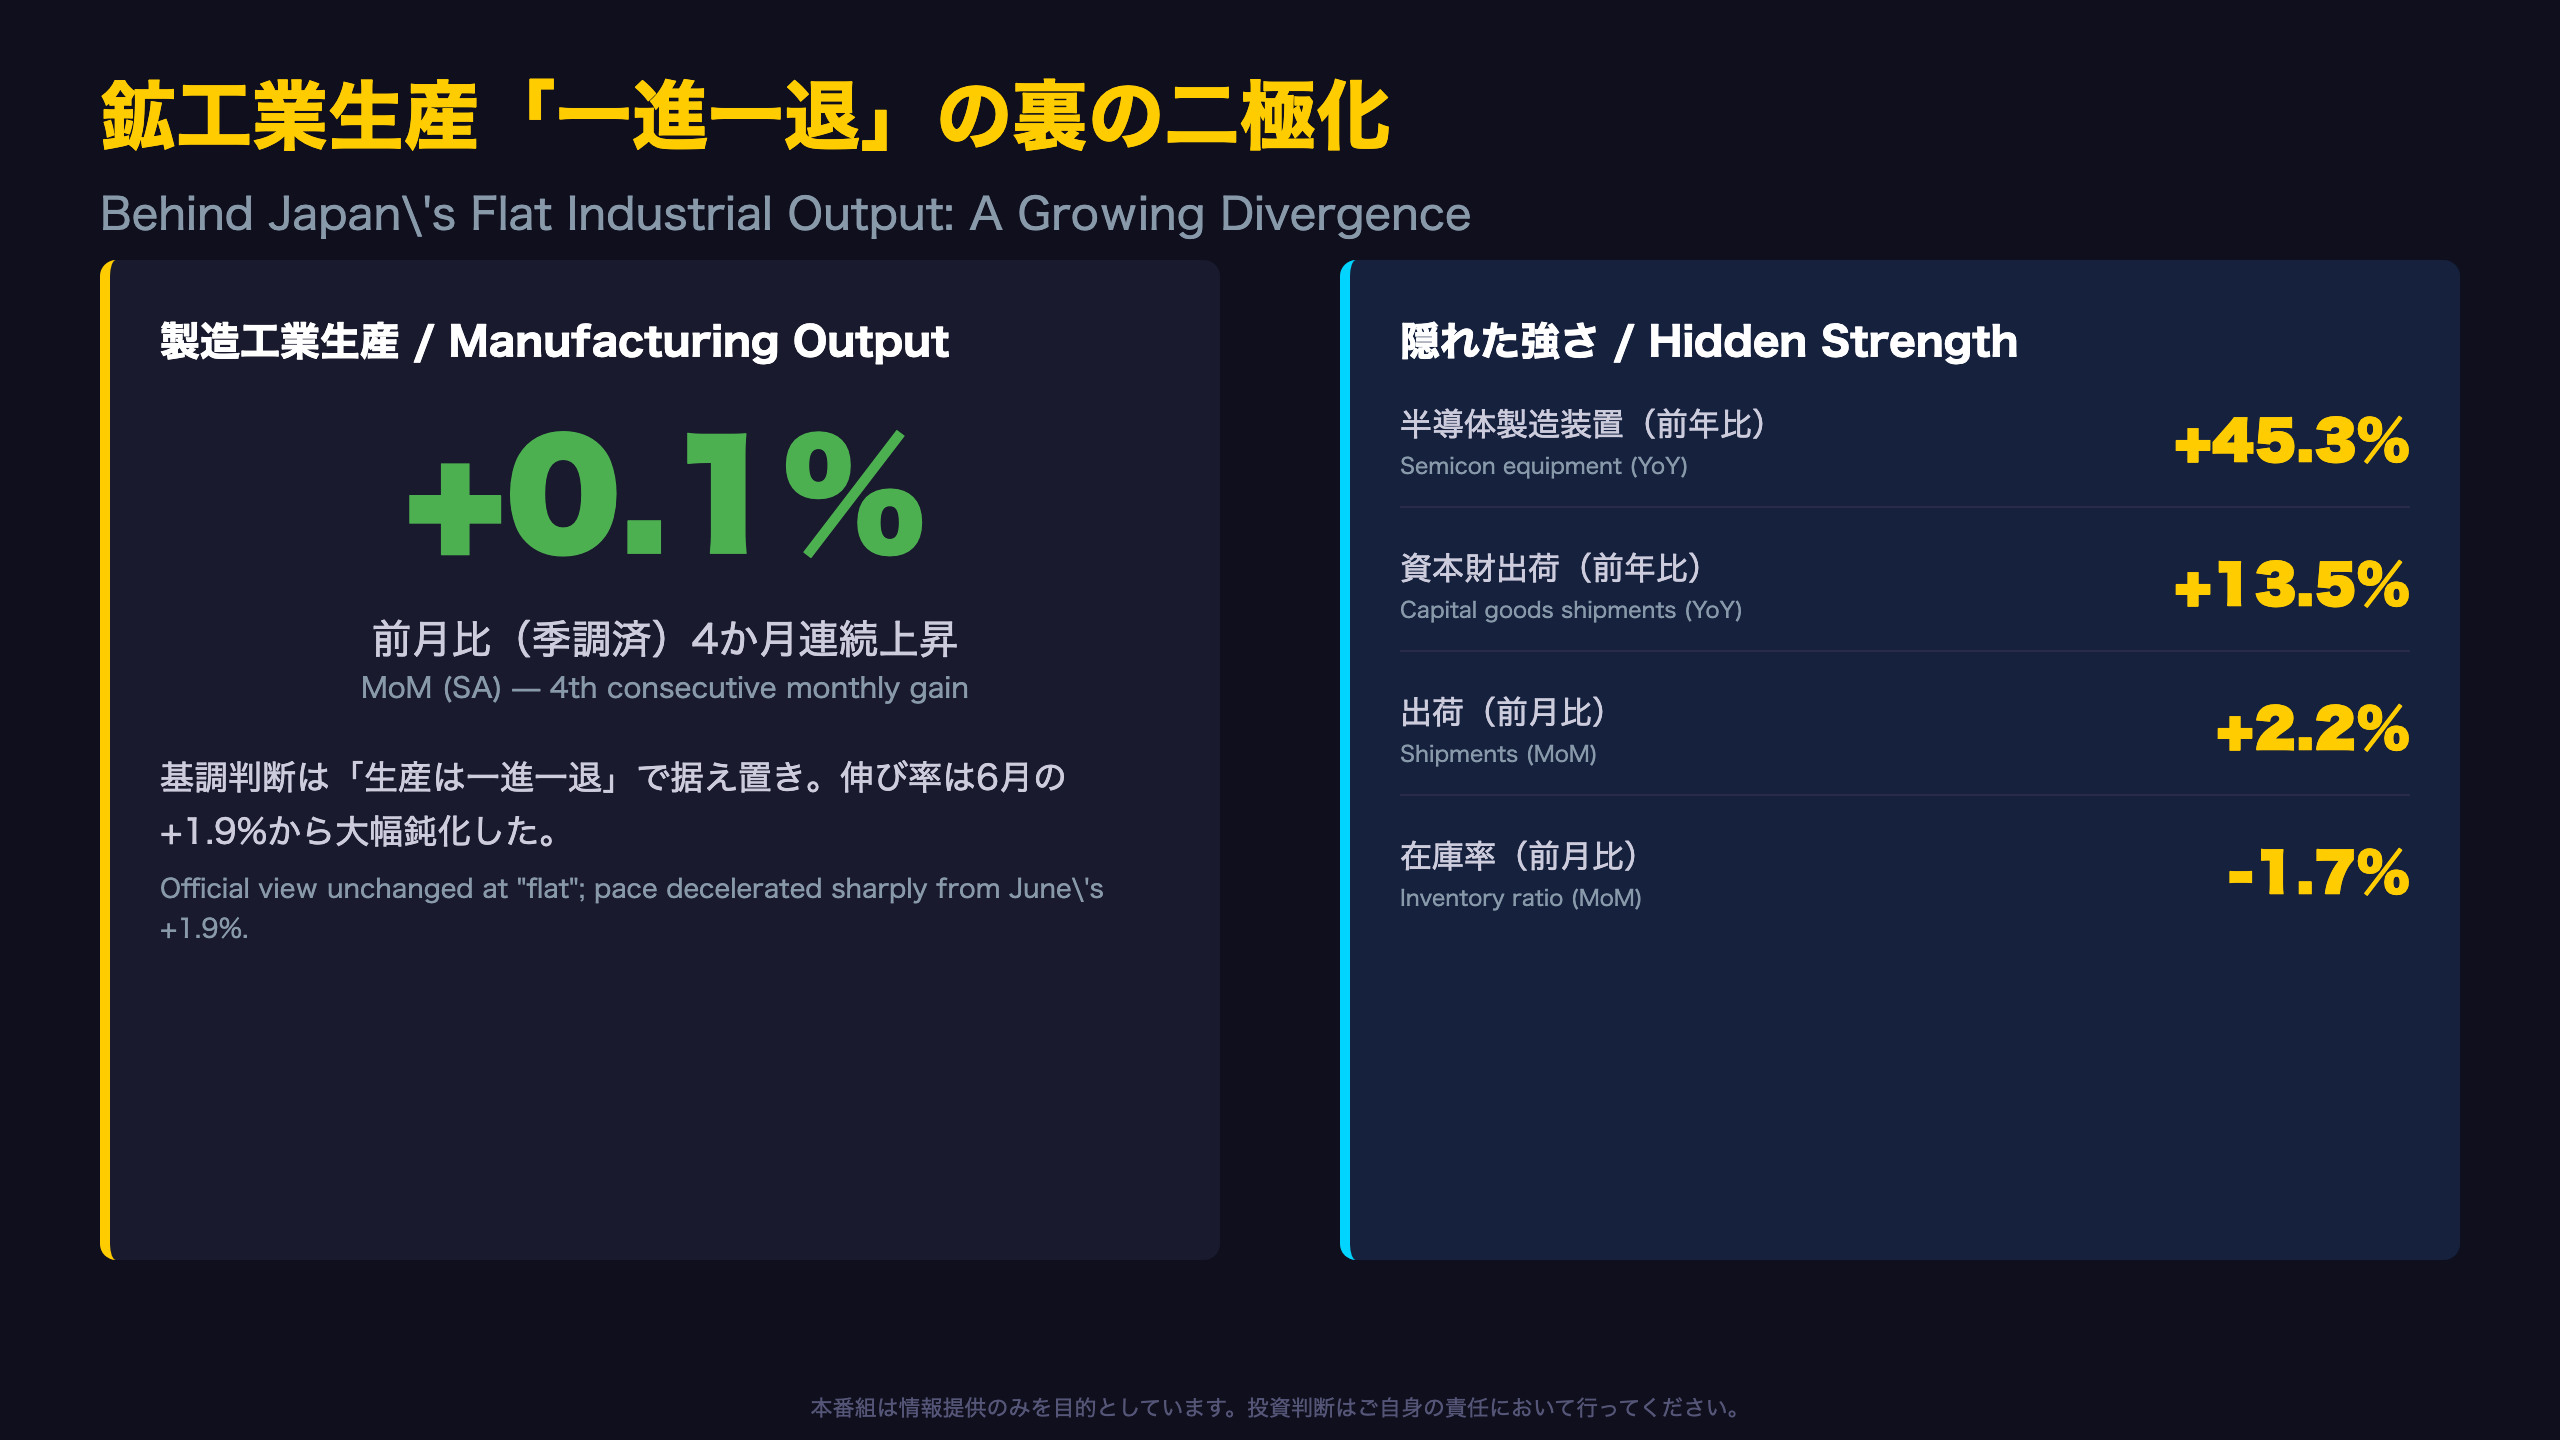
Japan’s Ministry of Economy, Trade and Industry (METI) released the preliminary Indices of Industrial Production for July 2026. The seasonally adjusted production index came in at 104.7, up 0.1% month-on-month — a fourth consecutive monthly increase, though the pace decelerated sharply from June’s +1.9%.
Direct quote from the report: “Production, Shipments and Inventories rose this month while the Inventory Ratio declined… Overall, production is moving sideways (“is fluctuating indecisively”).”
The Four Core Indices at a Glance (SA, MoM)
| Index | Level | MoM | Streak |
|---|---|---|---|
| Production | 104.7 | +0.1% | 4th straight gain |
| Shipments | 103.5 | +2.2% | First gain in 2 months |
| Inventories | 98.1 | +0.5% | 2nd straight gain |
| Inventory Ratio | 104.7 | -1.7% | First decline in 3 months |
For context, METI’s IIP is analogous to the U.S. ISM/Industrial Production Index but published with far more granular sub-industry and item-level detail — useful for cross-referencing against companies like Tokyo Electron or Disco Corp for semiconductor equipment exposure.
The Overlooked Strength
Capital goods (ex-transport equipment) shipments rose 13.5% YoY in original terms; production rose 11.2%. Semiconductor manufacturing equipment output jumped 10.7% MoM and a striking 45.3% YoY. Flat-panel display equipment surged 97.7% MoM.
This strength, however, is not the whole picture — the following slides unpack the weaknesses and structural shifts hidden beneath it.
Next release: September 30, 2026 (Final July data + August preliminary).
業種別の真の主役:半導体・資本財が牽引
Identifying the True Drivers at the Item Level
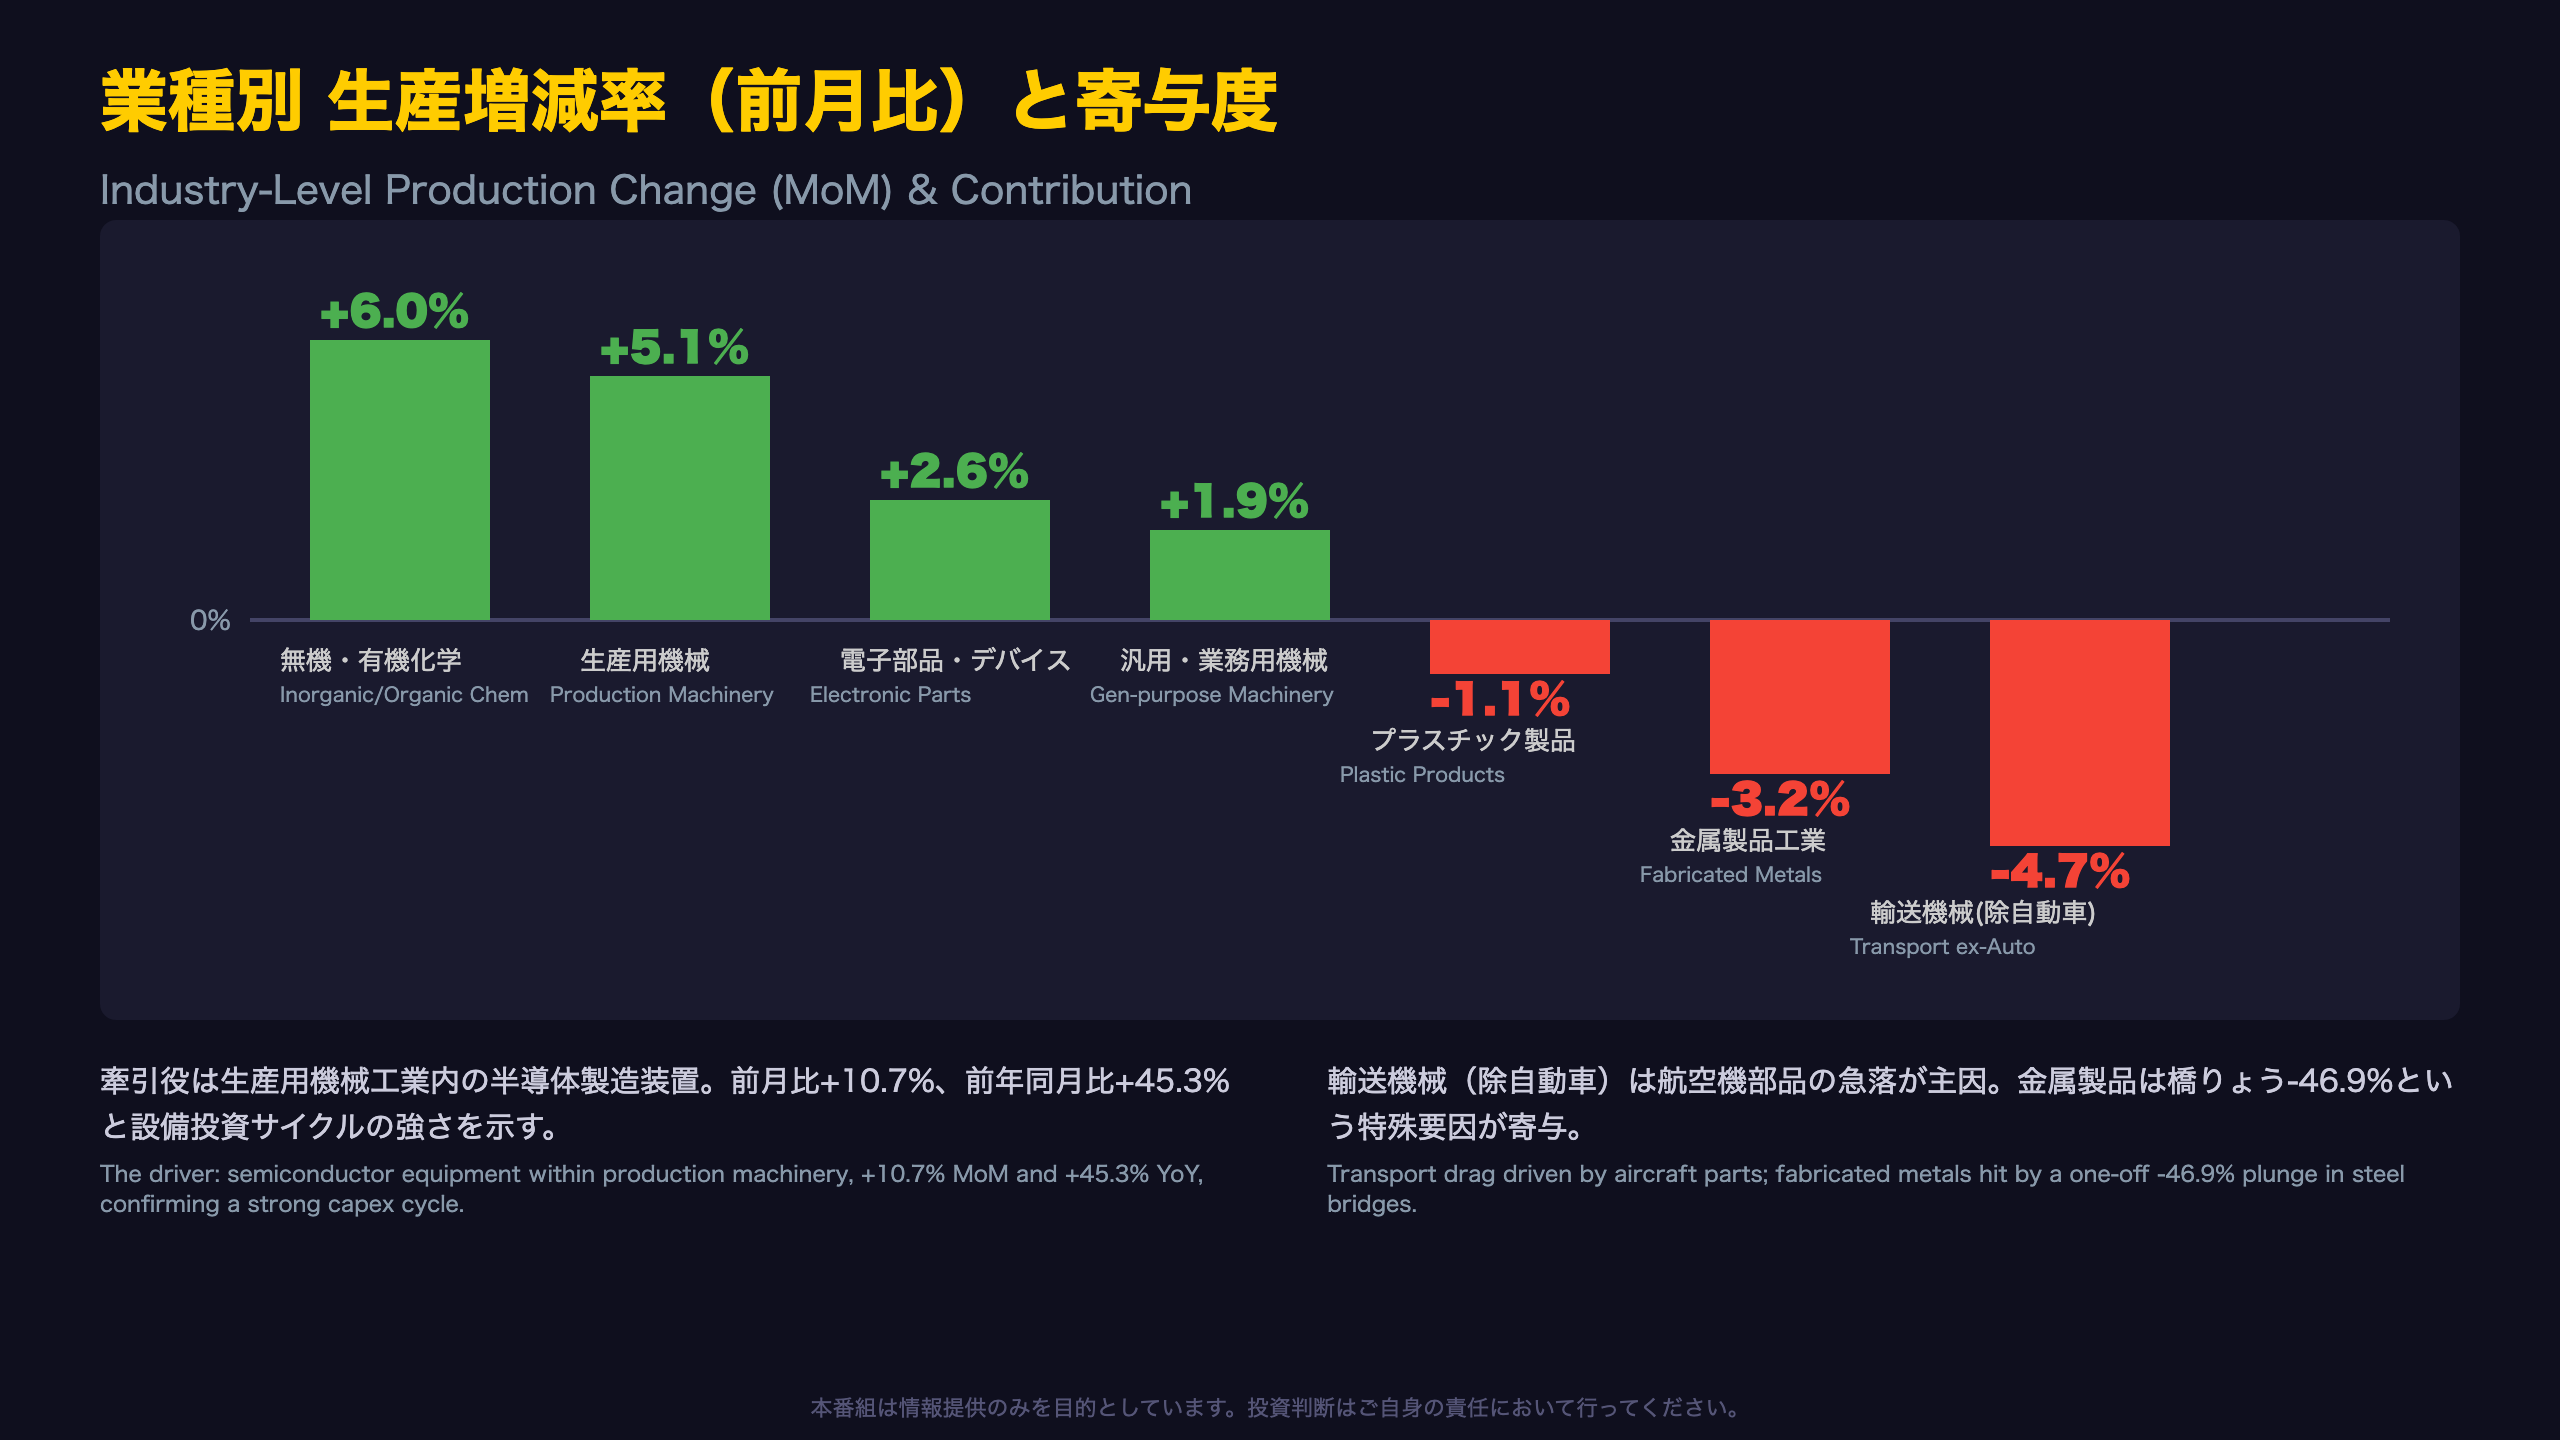
METI’s contribution analysis identifies the top three industries pulling production higher in July:
- Production machinery: +5.1% MoM (contribution +0.46pt), driven by semiconductor manufacturing equipment (+10.7% MoM, contribution +0.41pt) and flat-panel display equipment (+97.7% MoM).
- Inorganic and organic chemicals: +6.0% MoM (contribution +0.24pt), led by synthetic rubber (+21.7%) and polypropylene (+10.5%).
- Electronic parts and devices: +2.6% MoM (contribution +0.15pt), with MOS-type IC (memory) surging 53.1%.
The Drag Side
Conversely, the top three drags were:
- Transport equipment excl. motor vehicles: -4.7% MoM. Aircraft engine parts -12.3%, aircraft fuselage parts -9.5%.
- Fabricated metals: -3.2% MoM. Steel bridges plunged -46.9% in a single month.
- Plastic products: -1.1% MoM.
Direct quote: “By industry, Production Machinery, Inorganic and Organic Chemicals, and Electronic Parts and Devices increased, while Transport Equipment (excl. Motor Vehicles), Fabricated Metals, and Plastic Products decreased.”
Corroborating the Semiconductor Cycle
Inventories in the Electronic Parts and Devices sector fell a sharp -7.5% MoM, suggesting tightening supply-demand conditions — a pattern that aligns with the strength in equipment production. For context, this data series is the closest Japanese equivalent to tracking capex trends at companies like Tokyo Electron, Advantest, and Screen Holdings.
However, the -46.9% single-month plunge in steel bridges (a construction-goods item) likely reflects project-completion timing quirks rather than a structural downturn in construction demand — a distinction that matters for investors in construction-material names.
The August preliminary data (due September 30) will be the key test of whether this divergence widens or narrows.
在庫サイクルの精密診断:出荷主導の適正化
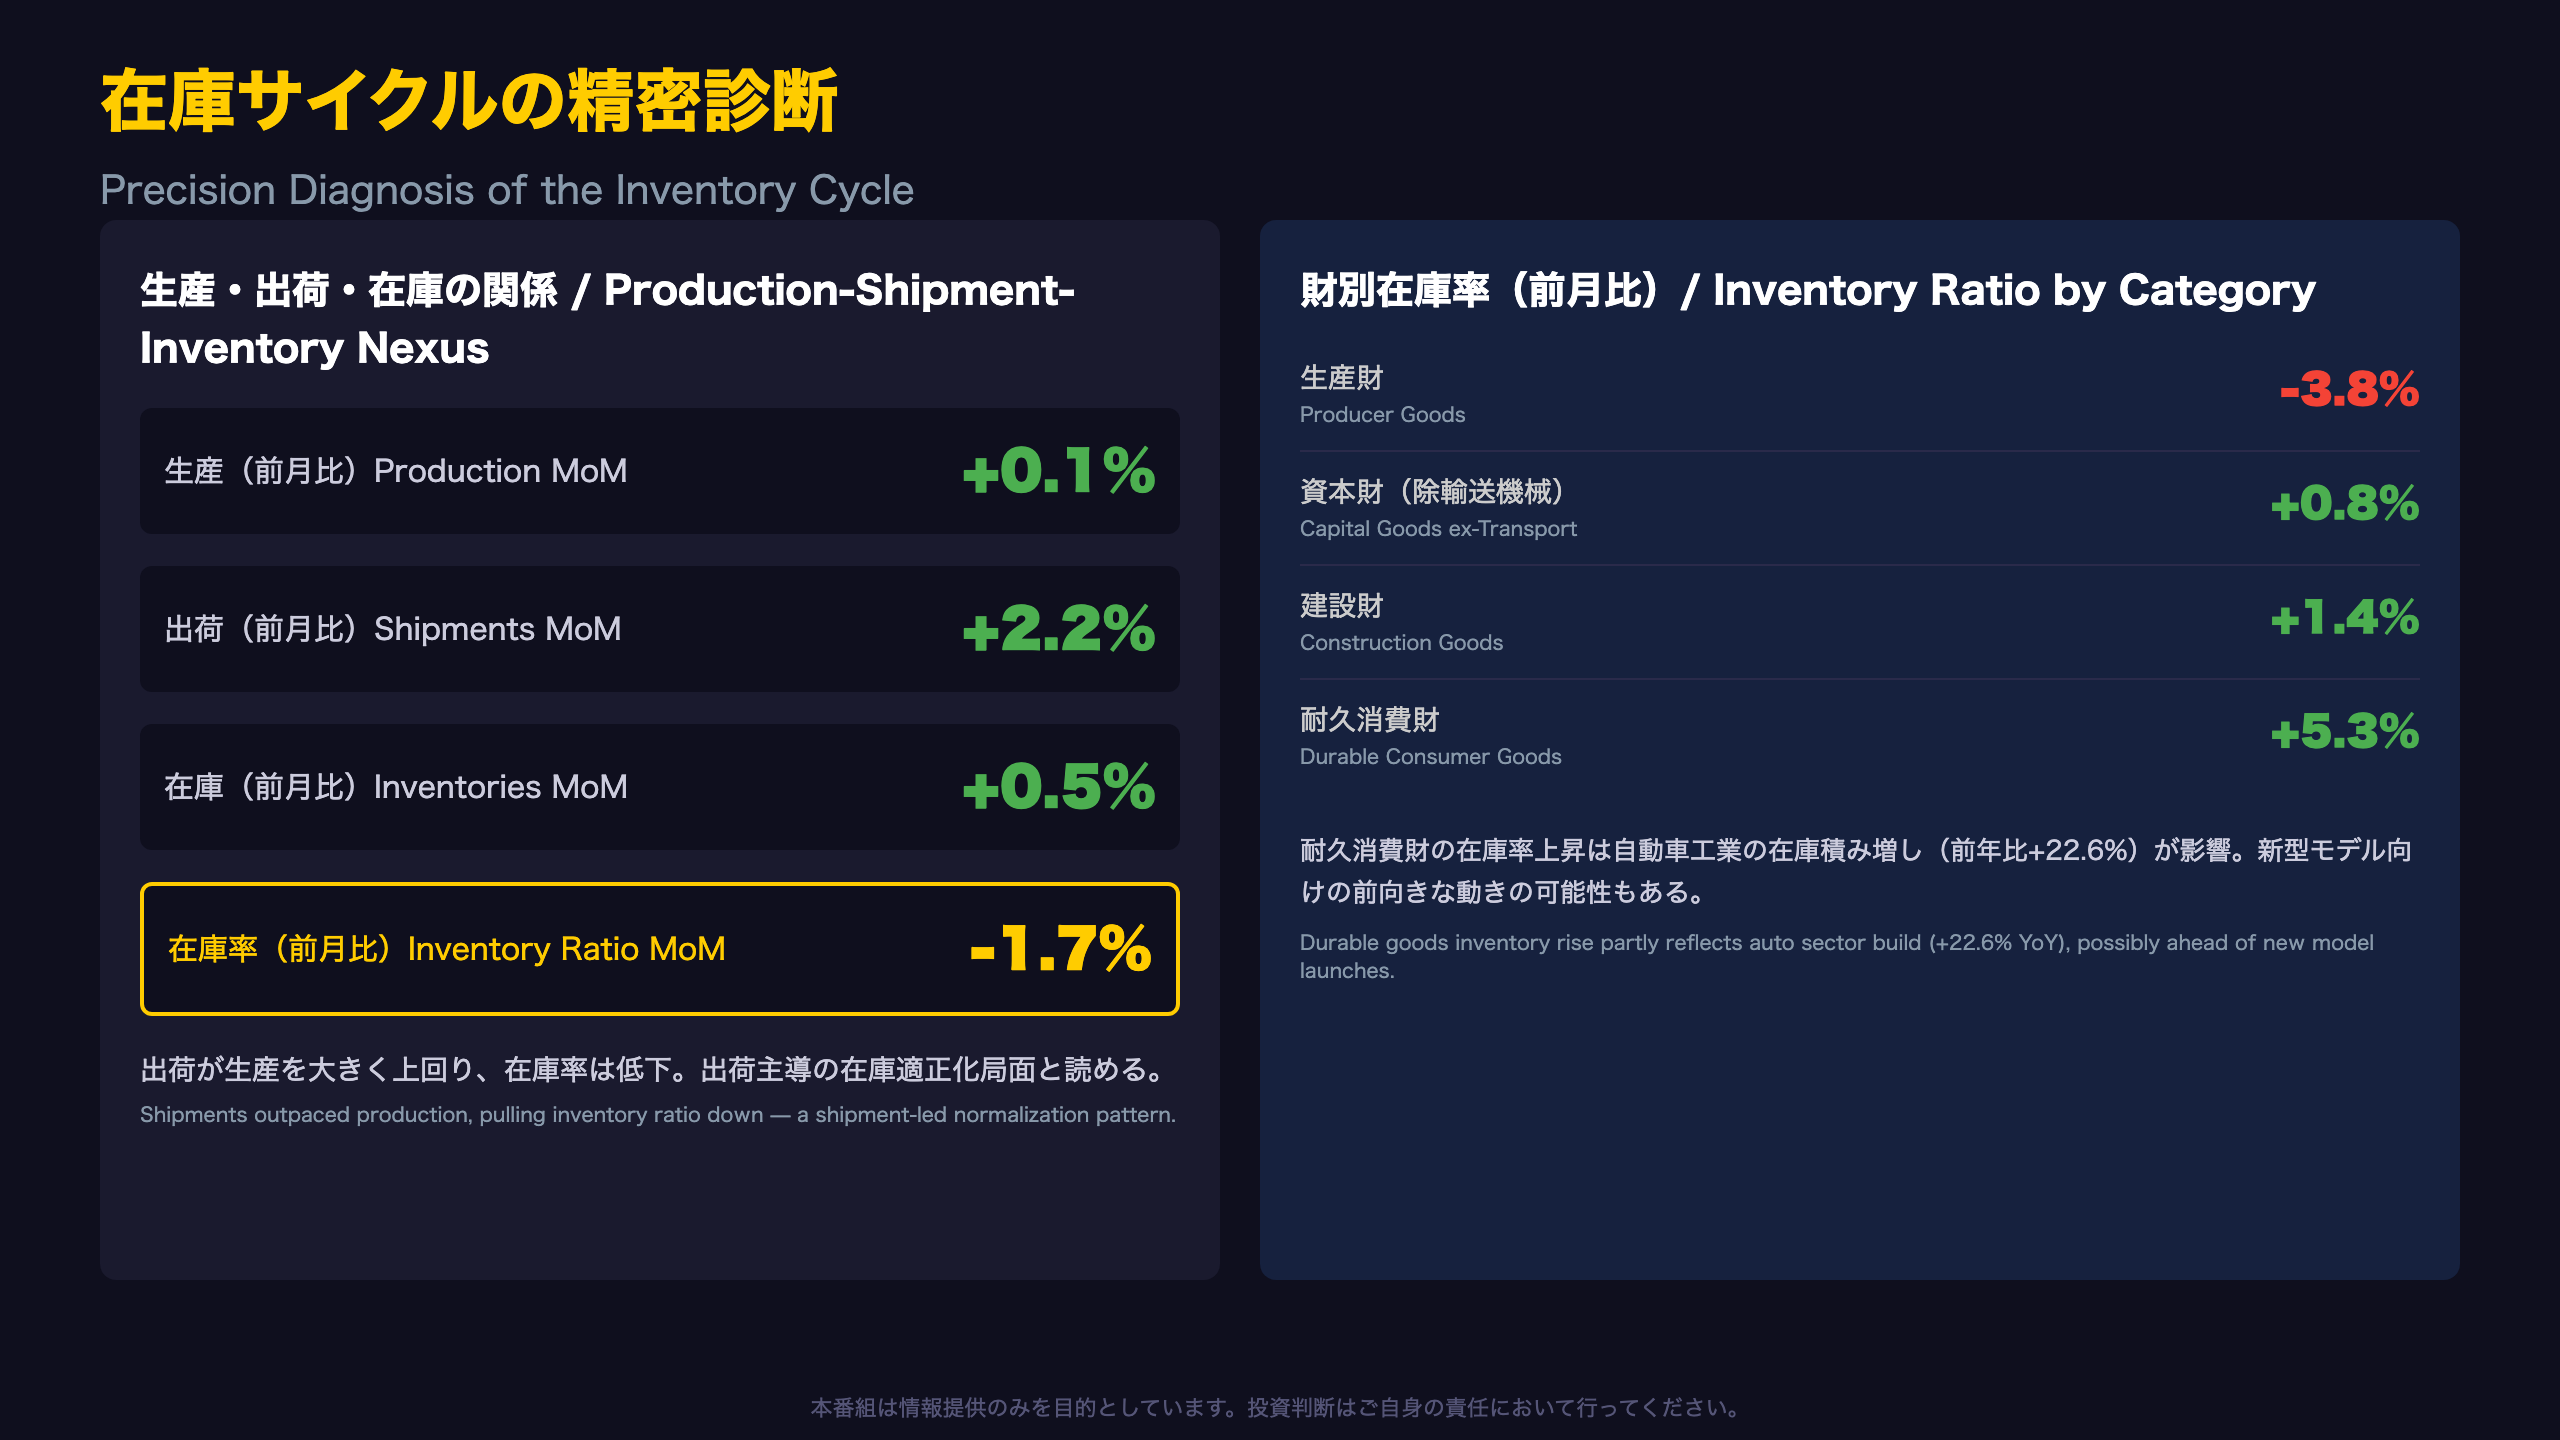
Decoding the Production-Shipment-Inventory Relationship
Inventory cycle theory allows analysts to distinguish between intentional inventory accumulation and unintended inventory buildup by comparing the growth rates of production and shipments.
In July, shipments (+2.2% MoM) far outpaced production (+0.1% MoM). This pattern — drawing down inventory to meet demand — is consistent with the observed decline in the inventory ratio (-1.7% MoM).
Inventory Ratio by End-Use Category (SA, MoM)
| Category | Inventory Ratio MoM | Assessment |
|---|---|---|
| Producer goods | -3.8% | Sharp improvement (normalization) |
| For mining & manufacturing | -3.6% | Sharp improvement |
| Capital goods (ex-transport) | +0.8% | Roughly flat |
| Construction goods | +1.4% | Slight deterioration |
| Durable consumer goods | +5.3% | Deterioration |
| Non-durable consumer goods | +0.1% | Flat |
Direct quote: “Inventories rose 0.5% MoM. By industry, Electrical Machinery/Information & Communication Electronics, Motor Vehicles, and Production Machinery rose, while Electronic Parts and Devices, Iron/Non-ferrous Metals, and Other Manufacturing declined.”
Interpreting the Durable Goods Inventory Rise
The rise in durable consumer goods inventory ratio (+5.3%) looks negative at first glance, but motor vehicle inventories rose 22.6% YoY in original terms — potentially reflecting a build-ahead phase tied to new model launch cycles rather than unsold stock accumulation. This is a single-month observation and should not be extrapolated into a firm structural conclusion.
What the Inventory Cycle Chart Suggests
METI’s inventory cycle diagram (comparing YoY production and inventory growth) positions the latest Q3 2026 preliminary reading (production averaged over May-July, inventory as of end-July) as one where producer-goods normalization is progressing even as certain sectors like autos and electrical machinery continue to build inventory — indicating the inventory cycle phase differs meaningfully by sector. This nuance matters for investors tracking Japan Inc.’s working capital dynamics, a topic less familiar to those accustomed to the U.S. ISM inventory subindex framework.
The August data (due September 30) will show whether this producer-goods-led normalization broadens across other categories.
構造変化:稼働率急騰と生産能力28か月連続減少
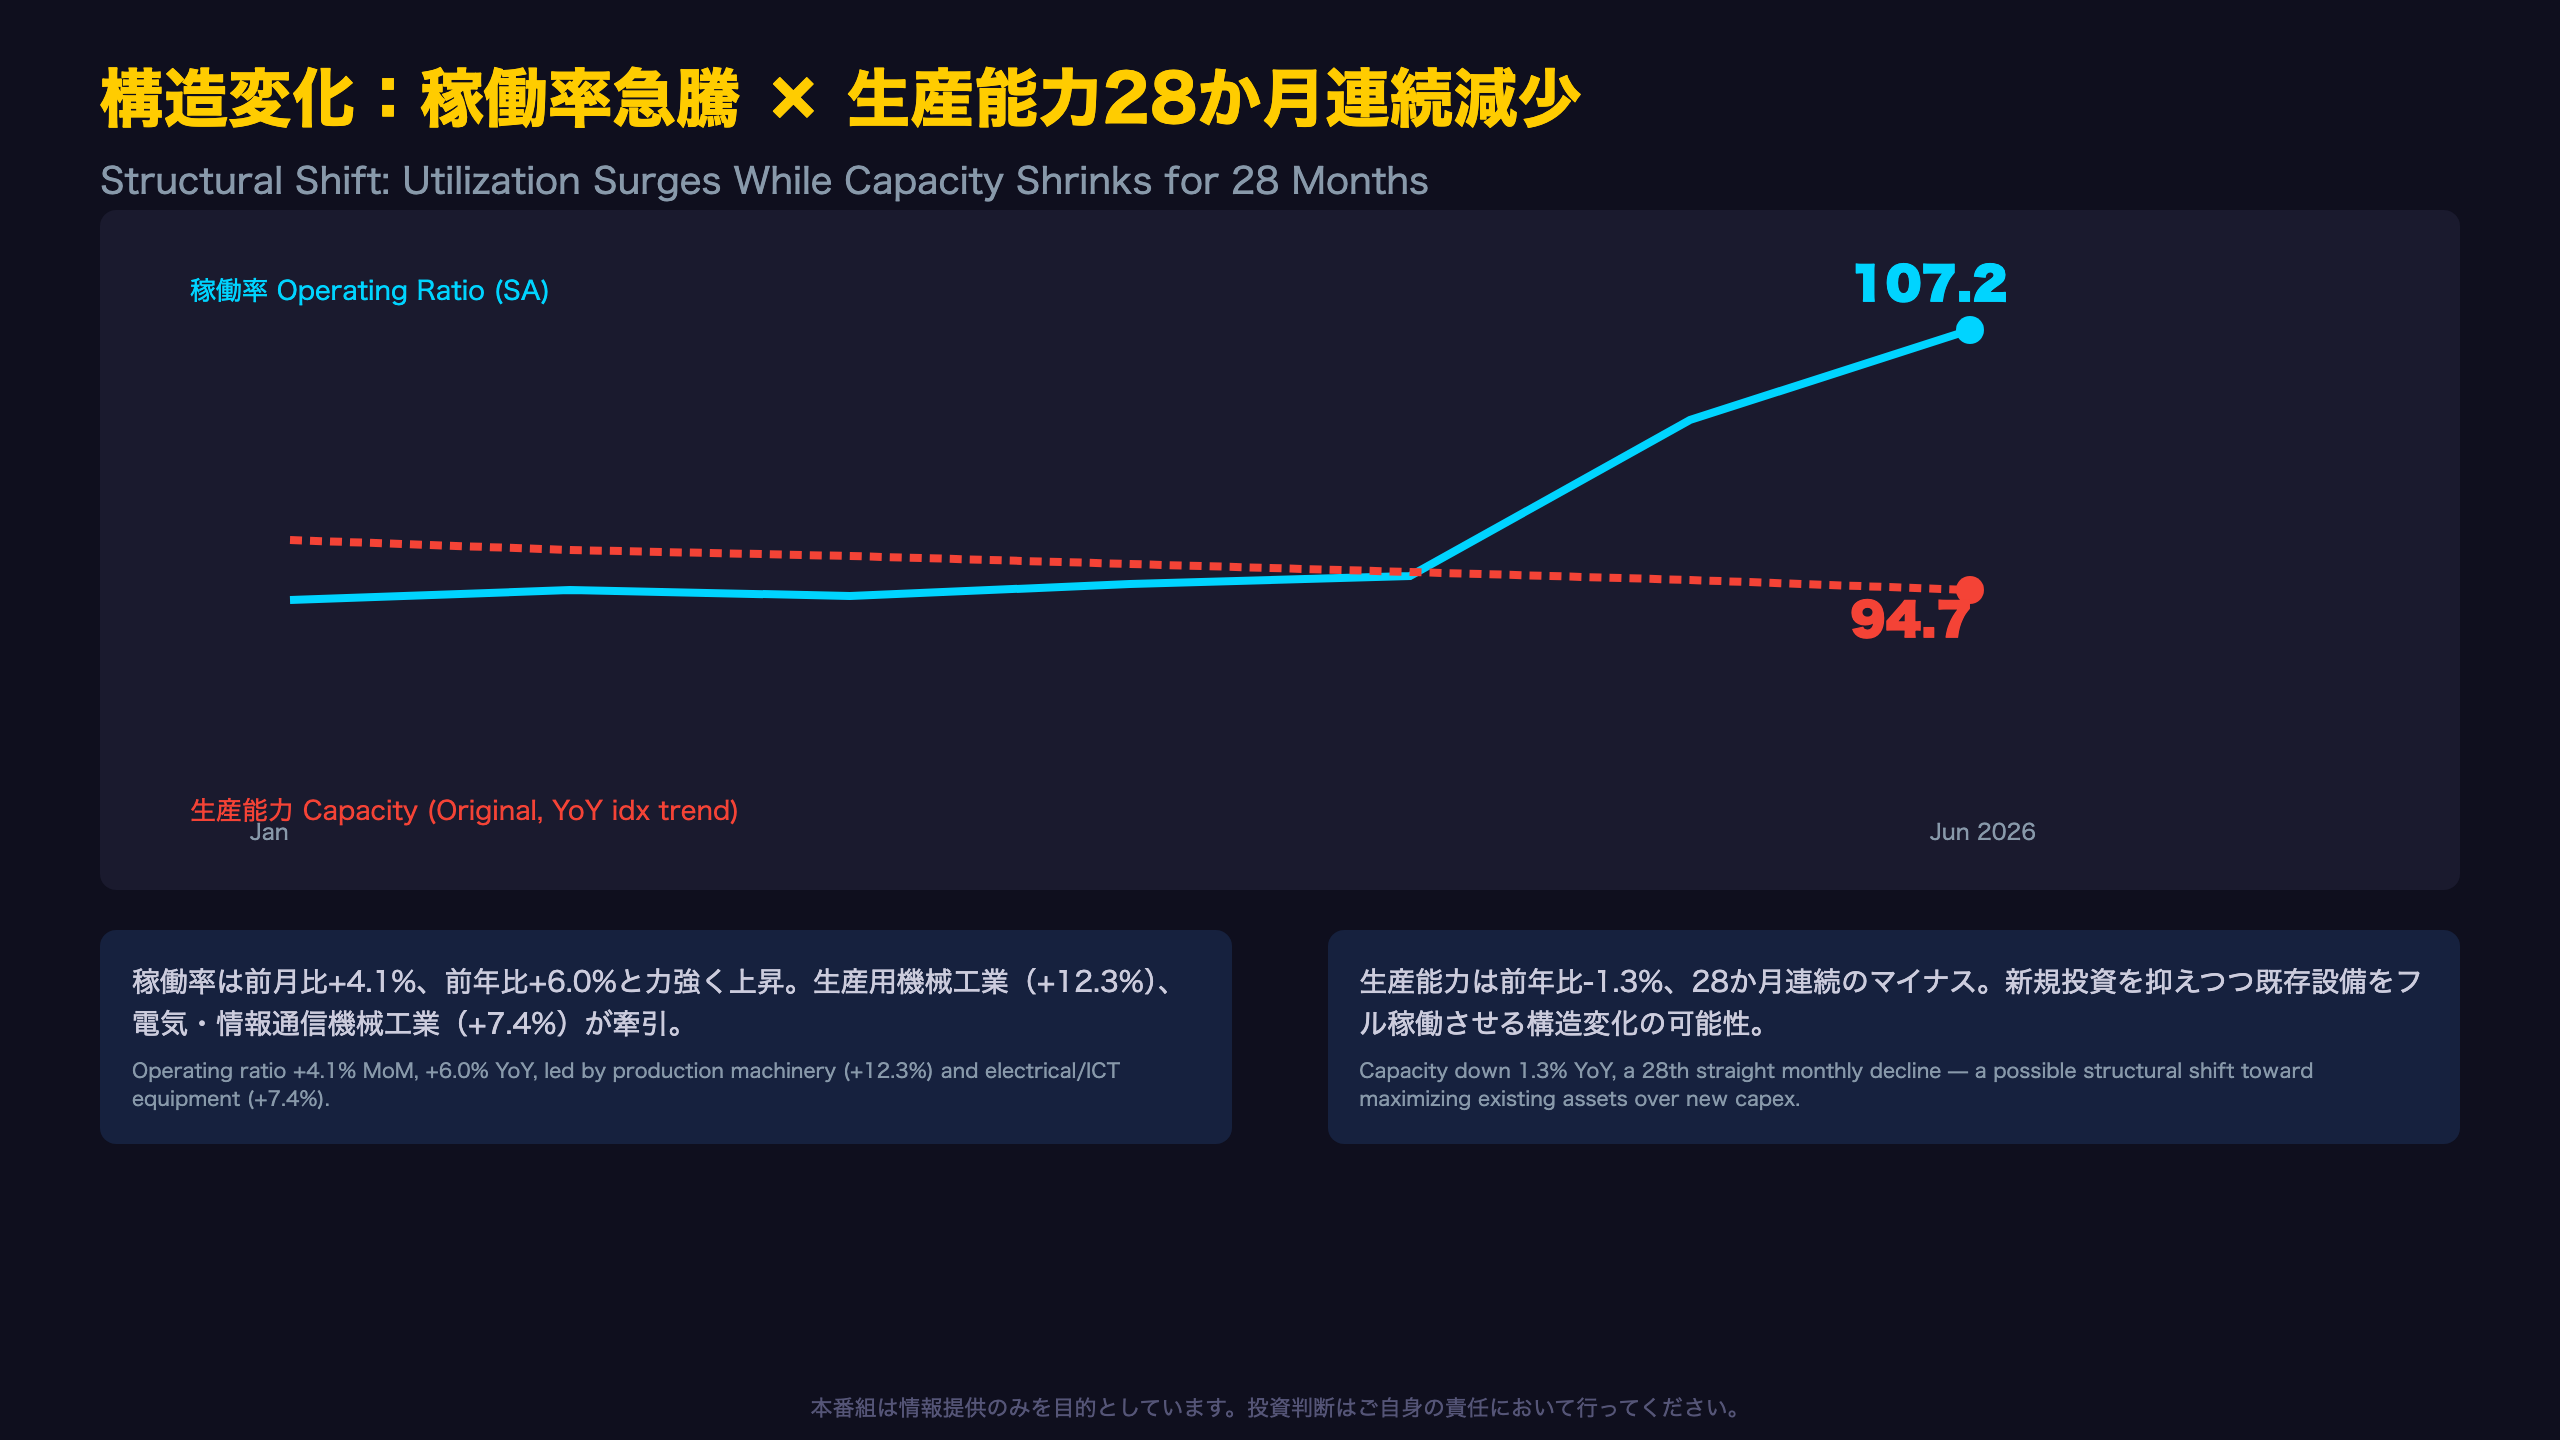
The Decoupling of Utilization and Capacity
A supplementary series included in this release — the Indices of Production Capacity and Operating Ratio (June final data) — offers a crucial structural signal about Japan’s manufacturing sector.
Direct quote: “The Production Capacity Index for June was 94.7, up 0.2% MoM.” “The Operating Ratio Index for June was 107.2, up 4.1% MoM.”
While the capacity index posted a marginal 0.2% MoM gain (its first in 9 months), it remains down 1.3% year-over-year — extending a streak of 28 consecutive months of YoY declines. Meanwhile, the operating ratio surged 4.1% MoM (a 2nd straight monthly gain) and 6.0% YoY.
Which Industries Are Driving the Utilization Surge
The operating ratio increase was led by production machinery (+12.3% MoM), electrical/information & communication equipment (+7.4% MoM), and general-purpose/business-oriented machinery (+4.7% MoM) — the same industries showing strength in the headline production data.
Two Ways to Read This Divergence
Running existing equipment harder without expanding capacity admits two interpretations. One is a structural shift: amid labor shortages and cautious capex appetite, Japanese manufacturers may be prioritizing efficiency gains (automation, digitalization) at existing plants over new capacity additions — a pattern supported by the persistent 28-month capacity decline (a multi-month trend, warranting a moderate-confidence “suggests” framing).
The alternative reading is more short-term: supply simply hasn’t caught up with a sudden demand surge (notably in semiconductor equipment, +45.3% YoY), and utilization is temporarily absorbing the gap — a single-indicator observation that should be framed as a possibility, not a conclusion.
For U.S. and European investors accustomed to tracking capacity utilization via the Federal Reserve’s G.17 release, this METI series offers a comparable but distinctly Japan-specific lens — one where capacity trends have been persistently negative even as cyclical utilization swings are pronounced. If utilization stays elevated, it should eventually translate into renewed capex — a dynamic worth cross-checking against Japan’s Machinery Orders statistics.
The next capacity/utilization update (July data) will accompany the next IIP reference chart release.
生産予測指数の「実現率」問題と企業マインドの陰り
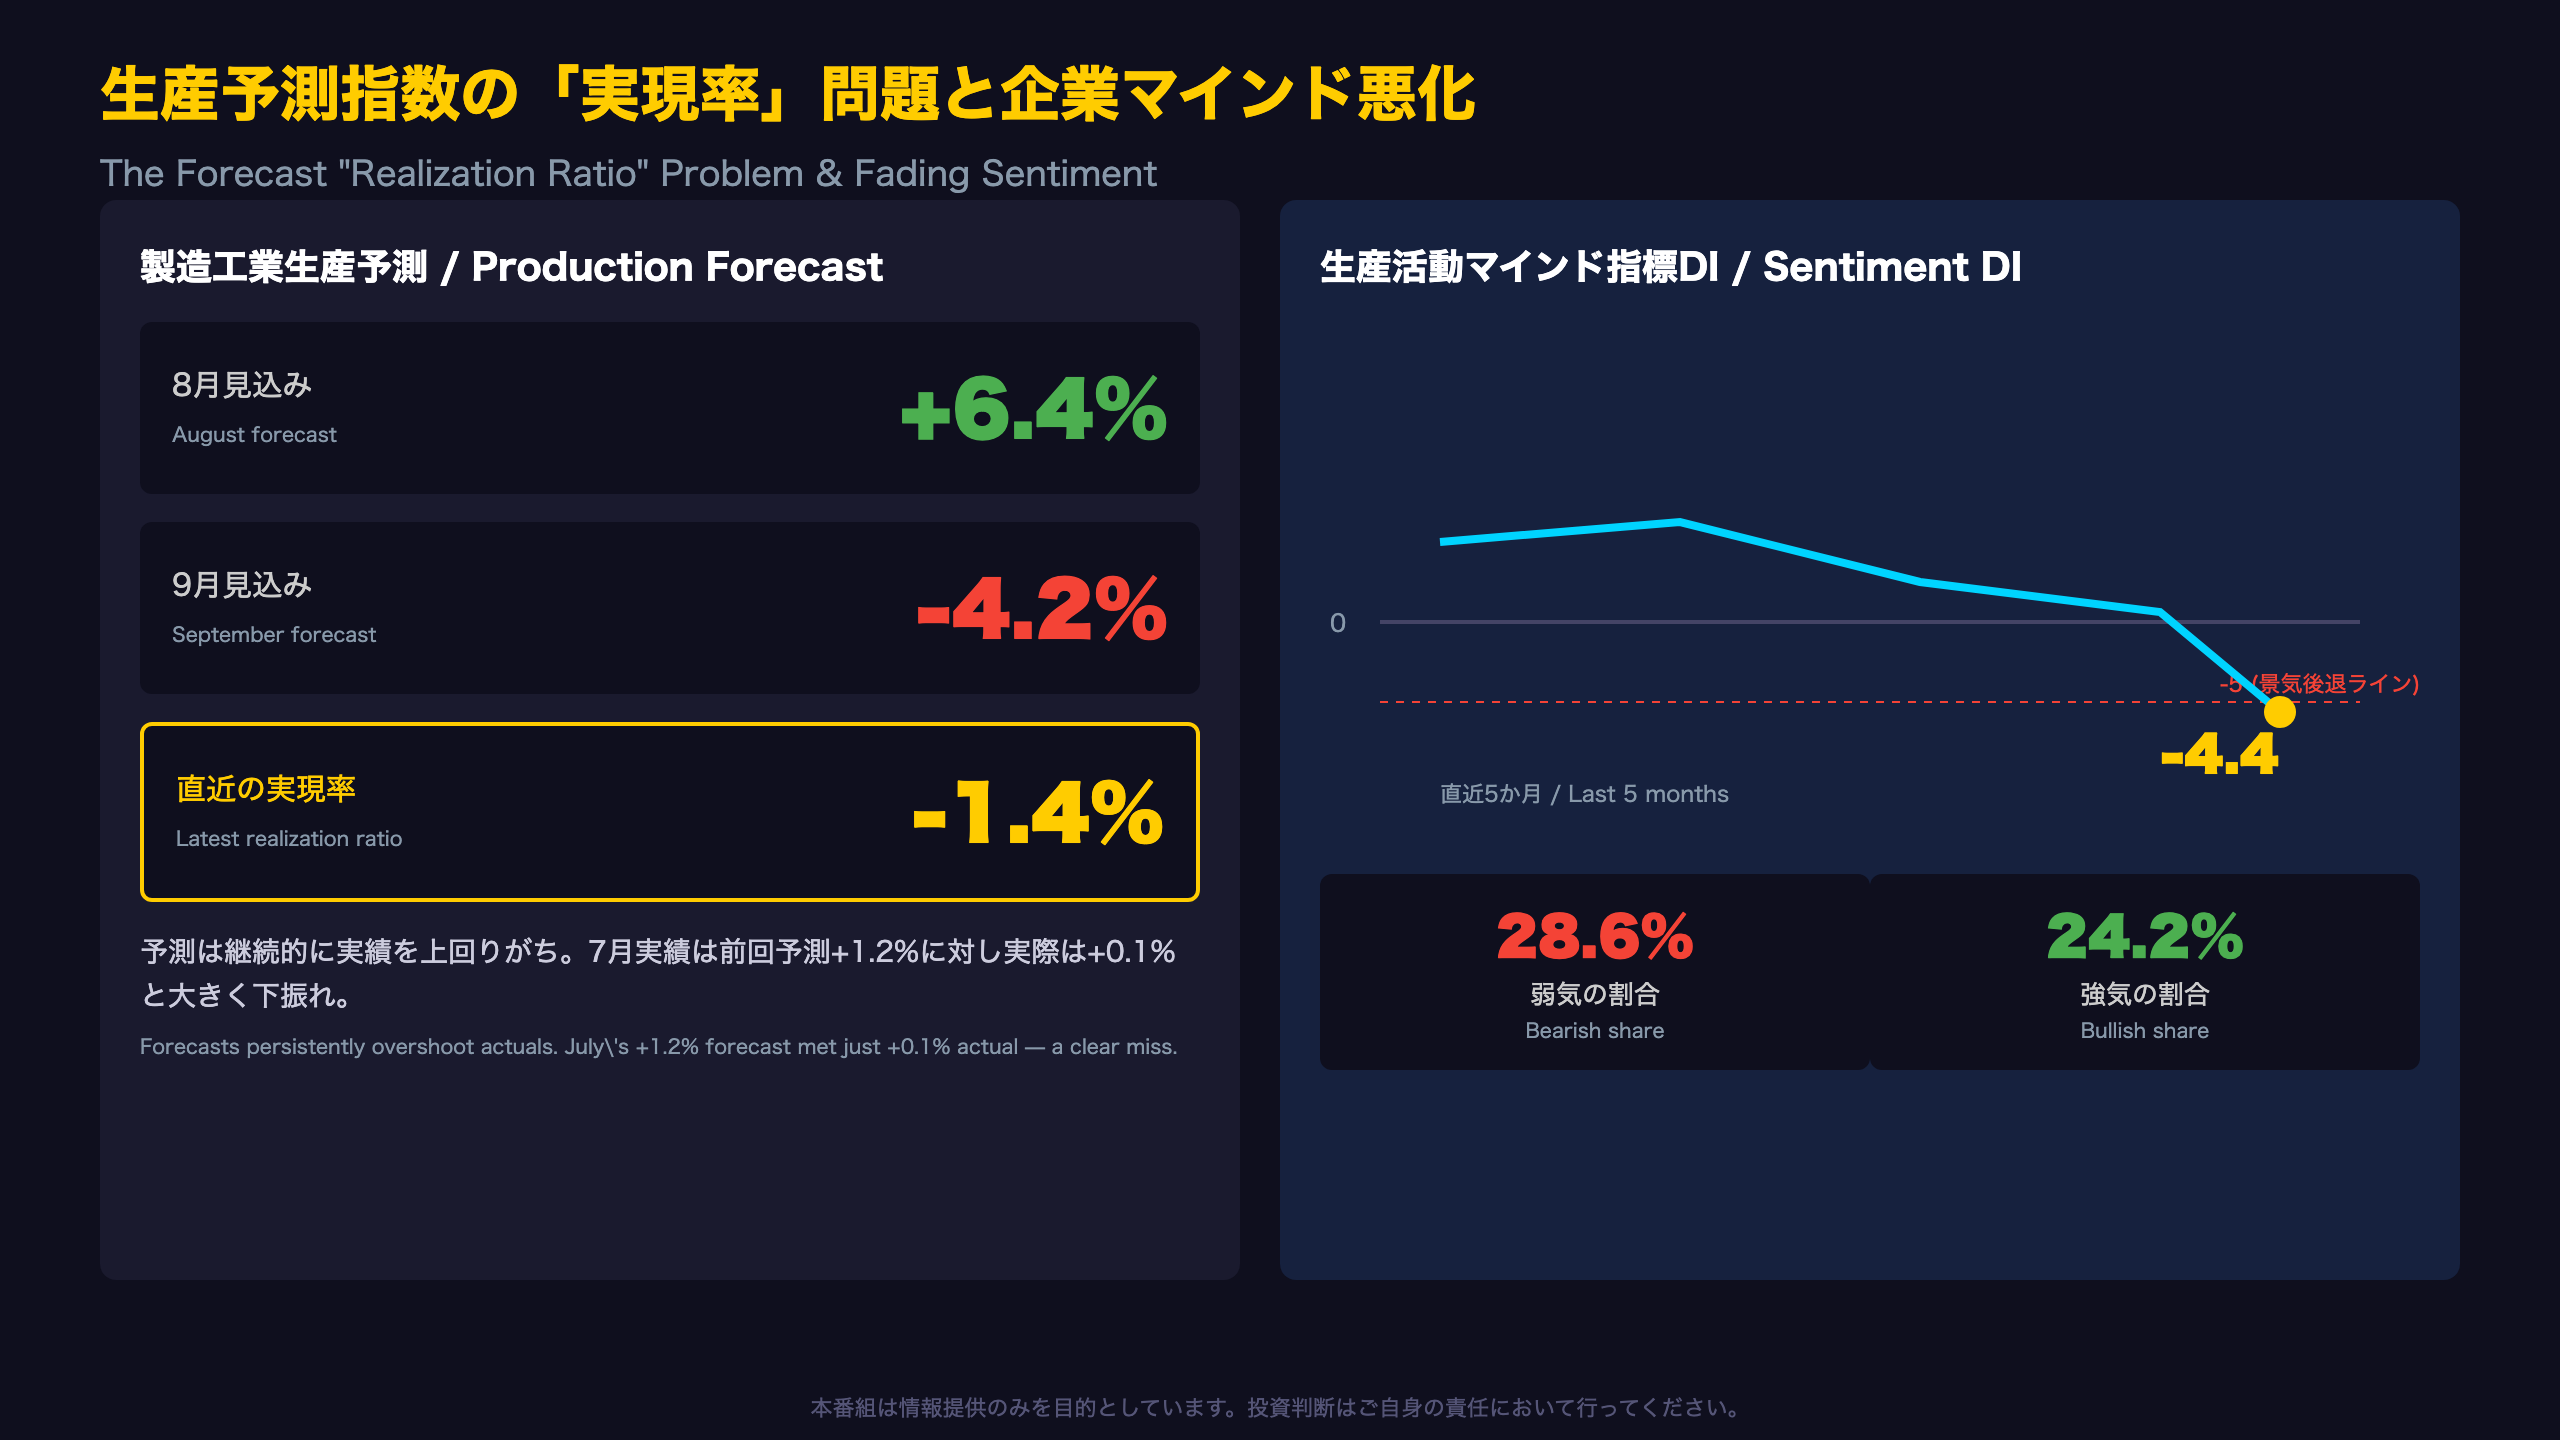
The “Cry Wolf” Pattern in Forecast Surveys
The Survey of Production Forecast in Manufacturing surveys major firms about next-month and month-after production plans. The August survey points to +6.4% MoM growth in August, followed by a -4.2% decline in September.
Direct quote: “According to the August survey, August is expected to rise 6.4% MoM and September to decline 4.2%. The August increase is attributed to Production Machinery, Electrical/ICT Equipment, and Transport Equipment.”
However, taking this forecast at face value would be a mistake. The report itself publishes a “Realization Ratio” — the gap between actual results and the previous survey’s forecast — and the latest reading was -1.4%. In other words, July’s production plan (forecast at +1.2% in the prior survey) came in at just +0.1% actual, a significant miss.
A Persistent Pattern of Overoptimism
Looking at the realization ratio time series over the past year-plus, most months registered negative readings, revealing a structural tendency for these forecasts to skew optimistic. This is a distinctly Japanese statistical quirk that international investors — accustomed to the U.S. ISM PMI’s forward-looking new orders index, which doesn’t carry an equivalent “realization ratio” — should keep in mind when reading Japan’s forecast survey headlines.
What the Deteriorating Sentiment DI Signals
The report also publishes a “Production Activity Sentiment DI,” calculated as the share of firms revising plans upward minus those revising downward. The August DI came in at -4.4, down from +4.2 the prior month. The share of bullish firms fell to 24.2% while bearish firms rose to 28.6%.
Direct quote: “If the DI trend falls below -5, it likely signals an economic downturn is underway. The August survey’s DI was -4.4 (down from 4.2 the prior month), with the trend at 0.4, still above the -5 threshold.”
While the trend line remains above the -5 recession threshold, the sharp single-month deterioration in the DI level warrants close monitoring — a useful complementary gauge for investors who track Japan’s Tankan survey but may be unfamiliar with this monthly, higher-frequency sentiment indicator.
Behind the September Pullback Forecast
The largest drag on the September forecast is Production Machinery (-8.0%, contribution -1.19pt), likely a payback effect after August’s sharp gain. This suggests August’s strength may partly reflect a one-off factor such as concentrated semiconductor equipment shipments — a single-month observation that should be framed cautiously rather than as a confirmed trend.
Next release: September 30, 2026 (August preliminary / July final data). The key question: will August actual production match the +6.4% forecast, or will the realization ratio miss again?
結論:強弱併存の局面、日本株・日銀政策への含意
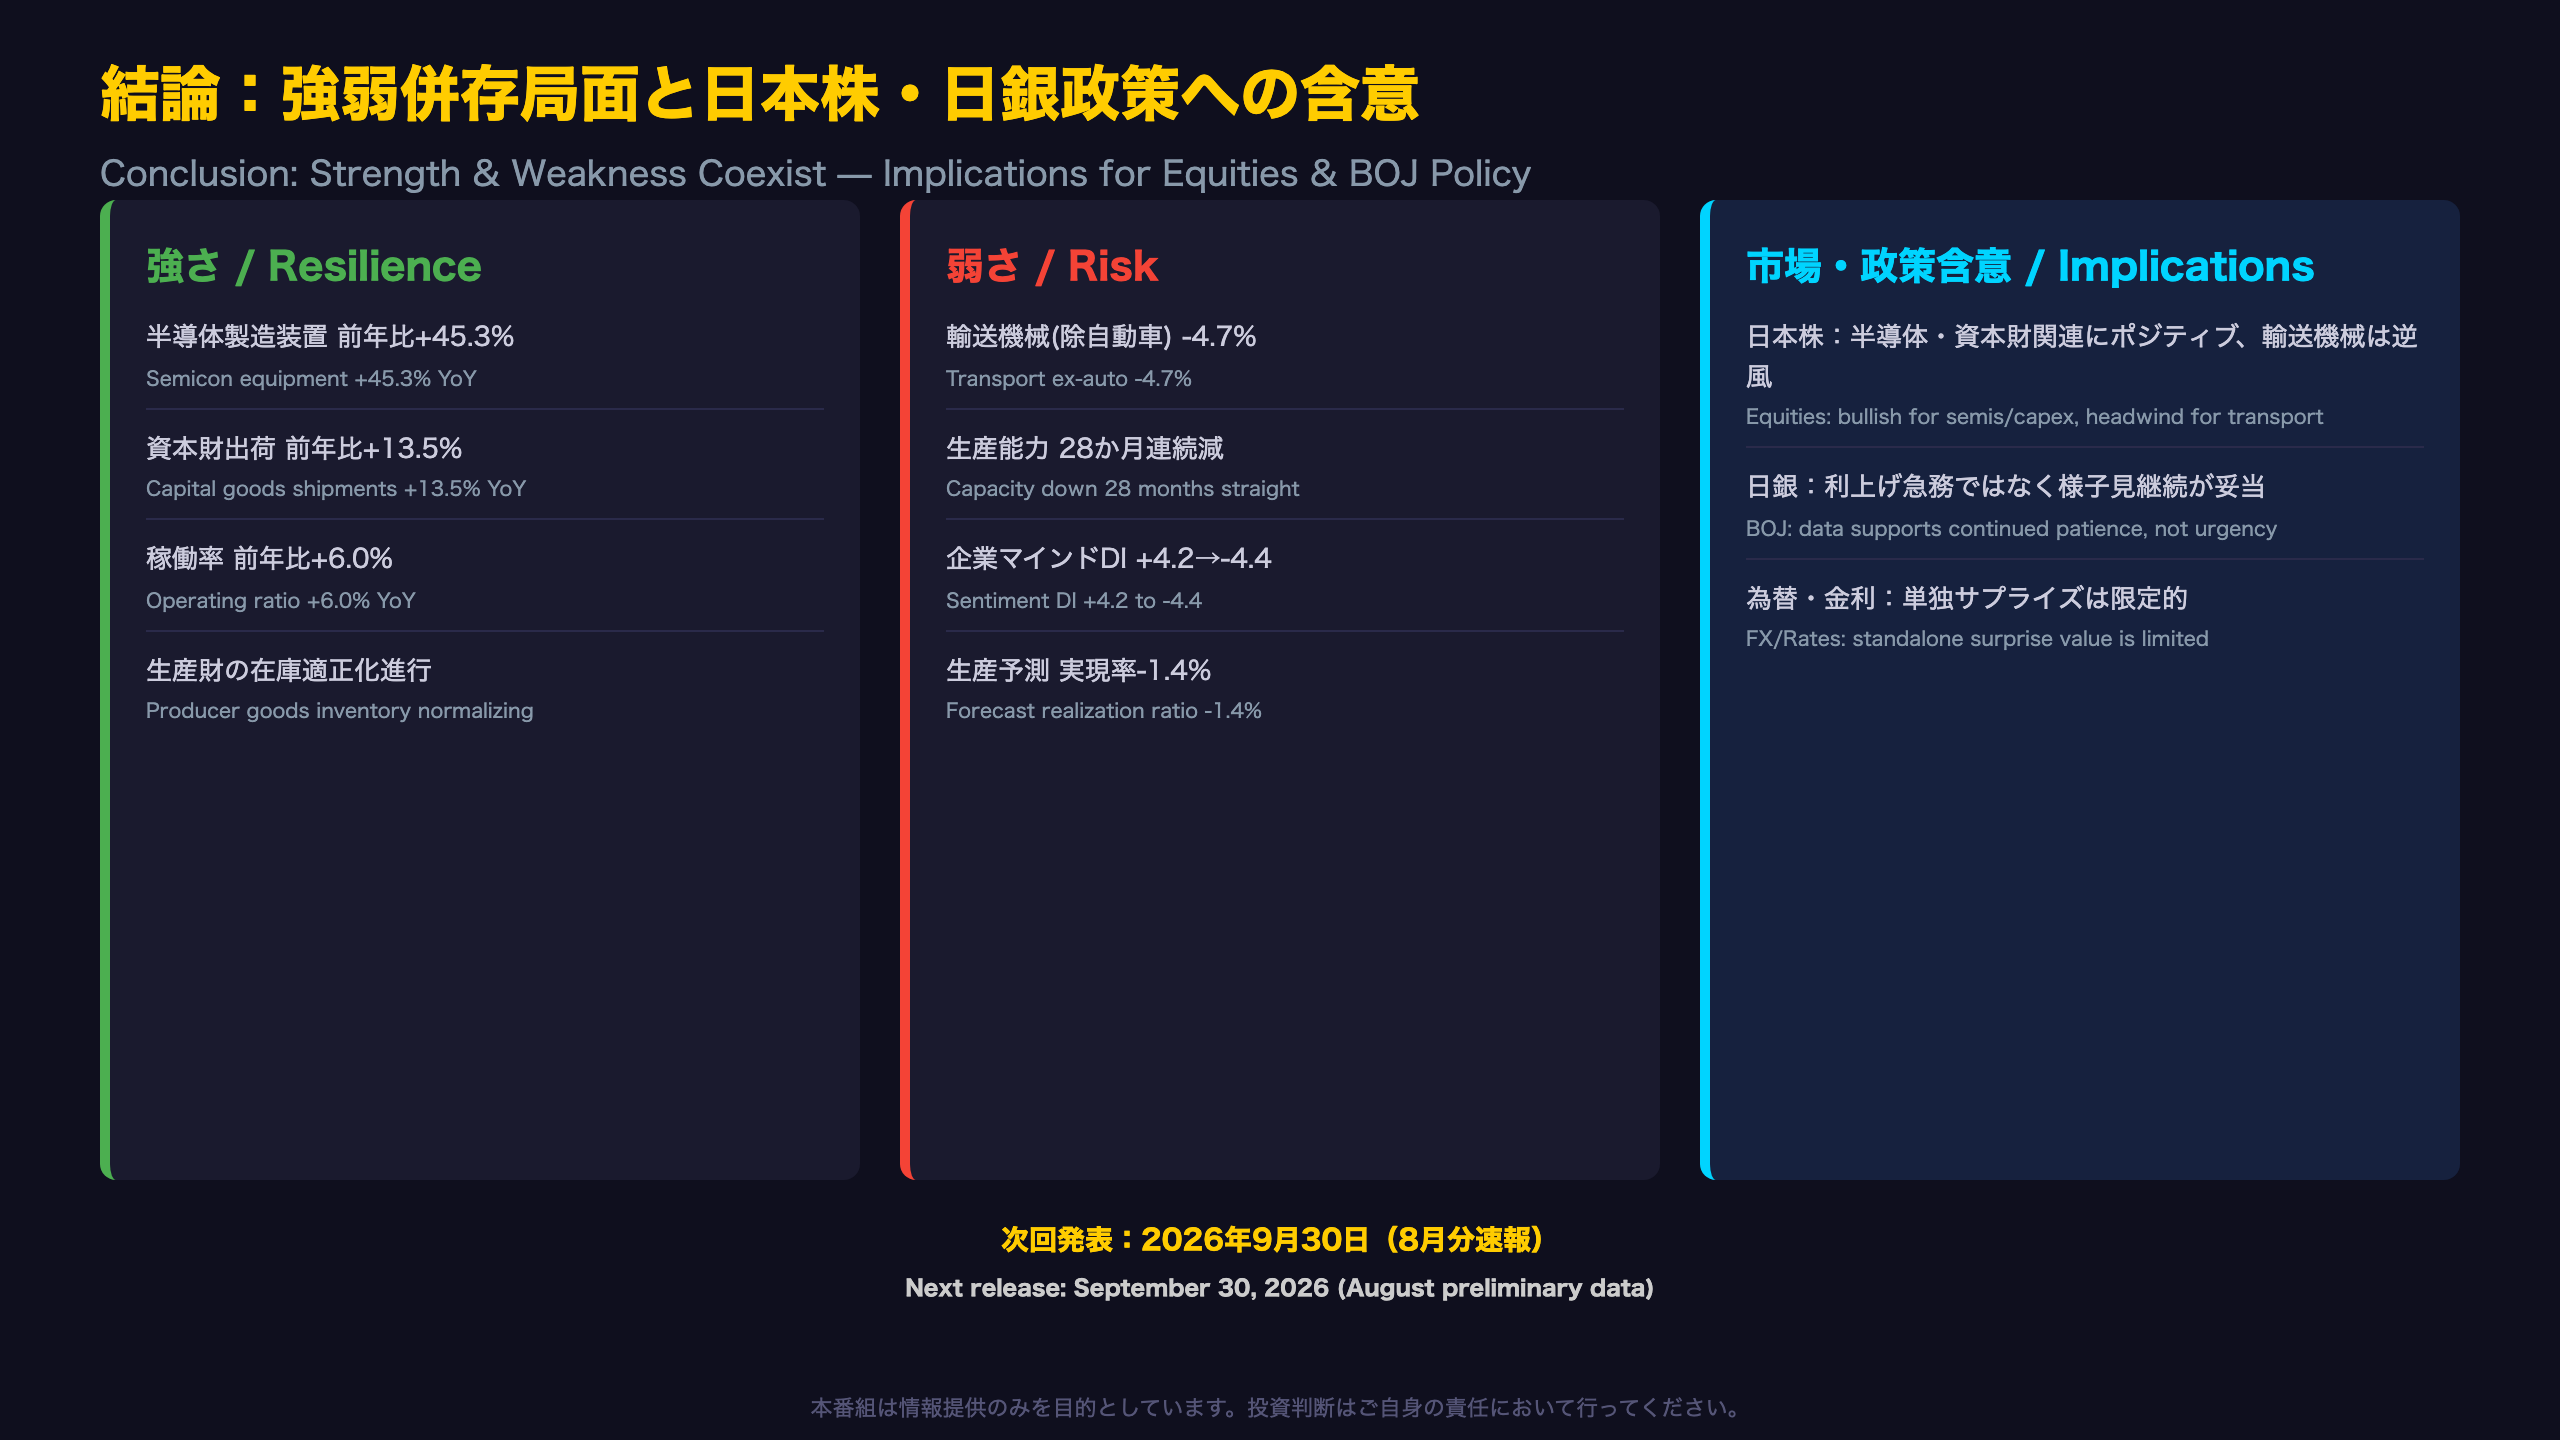
Overall Assessment: A Balance Sheet of Strength and Weakness
Summarizing Japan’s July 2026 preliminary Industrial Production data, the picture can be organized into a balance sheet of resilience and risk.
Resilience Factors
- Production rose for a 4th consecutive month (+0.1%)
- Shipments jumped +2.2%, the first gain in two months
- Producer-goods-led inventory normalization is underway (inventory ratio -1.7%)
- Semiconductor manufacturing equipment +45.3% YoY; flat-panel display equipment +97.7% MoM
- Capital goods (ex-transport) shipments +13.5% YoY
- Operating ratio +4.1% MoM, +6.0% YoY — a robust reading
Risk Factors
- Official assessment held at “flat/directionless”
- Transport equipment ex-autos -4.7%, fabricated metals -3.2%
- Production capacity index down YoY for a 28th consecutive month
- Forecast realization ratio persistently negative (latest -1.4%)
- Sentiment DI plunged from +4.2 to -4.4; bearish share at 28.6%
- September production plan points to a -4.2% MoM decline
Market and Policy Implications
Japanese Equities: Semiconductor equipment and capital goods names have received clear fundamental validation from this data. Transport equipment and materials-related sectors, however, may continue to face headwinds. With the headline index still stuck in “flat” territory, sector rotation — rather than broad index exposure — appears to be the more relevant investment lens for now. This dynamic is comparable to how U.S. investors distinguish semiconductor capex names (like Applied Materials or ASML) from broader industrials amid a similarly two-speed manufacturing recovery.
Bank of Japan Policy: For the BOJ under Governor Ueda, this data is unlikely to shift the policy trajectory meaningfully in either direction. With the production assessment held steady and corporate sentiment softening, there is little justification for an accelerated tightening path. At the same time, the strength of the semiconductor investment cycle offers some support for the sustained achievement of the inflation target — a nuance similar to how the Fed weighs manufacturing capex strength against broader softness when assessing policy stance.
FX and Rates: The standalone surprise value of this release is limited, since the persistently negative realization ratio is a well-known structural quirk rather than a fresh signal. Markets are likely to weigh this data alongside upcoming CPI prints and the BOJ Tankan survey for a fuller policy read.
Bridge to the Next Release
The next release is scheduled for September 30, 2026 (August preliminary, July final). Three things to watch:
- Whether August actuals converge toward the +6.4% forecast (a test of realization ratio improvement)
- Whether the strength in semiconductor equipment and capital goods persists
- Whether the sentiment DI trend deteriorates toward the -5 recession threshold
These will serve as the next checkpoints for gauging the durability of Japan’s manufacturing expansion.
Disclaimer: This article is for informational purposes only. All investment decisions are made solely at your own risk.