📺 Watch the Full Video Analysis
This article was automatically generated by the NFC Market Live AI analysis system. (Updated: 2026-09-14 09:43 JST)
📊 This week’s Global Bond Watch: US 2Y yield surged from 4.20% to 4.56% in one week, with 10Y climbing to 4.95%.
German Bund and UK Gilt yields rose in tandem, while Japan’s 10Y JGB stayed nearly flat at 2.92% and 30Y actually declined.
💡 US Treasury auctions saw indirect bidder participation hit 79% for both 10Y and 30Y—a sign of robust foreign demand.
⚠️ The US-Japan 10Y spread widened from 1.74pt to 2.03pt. NFC’s HMM model shifted the BOJ regime to “Hawkish,” consistent with short-end JGB moves.
Full analysis covers JGB auction tail dynamics and the real story behind narrowing OAT-Bund/BTP-Bund spreads.
グローバル金利スナップショット
The Week’s Biggest Move: Short-Rate-Led Bear Flattening
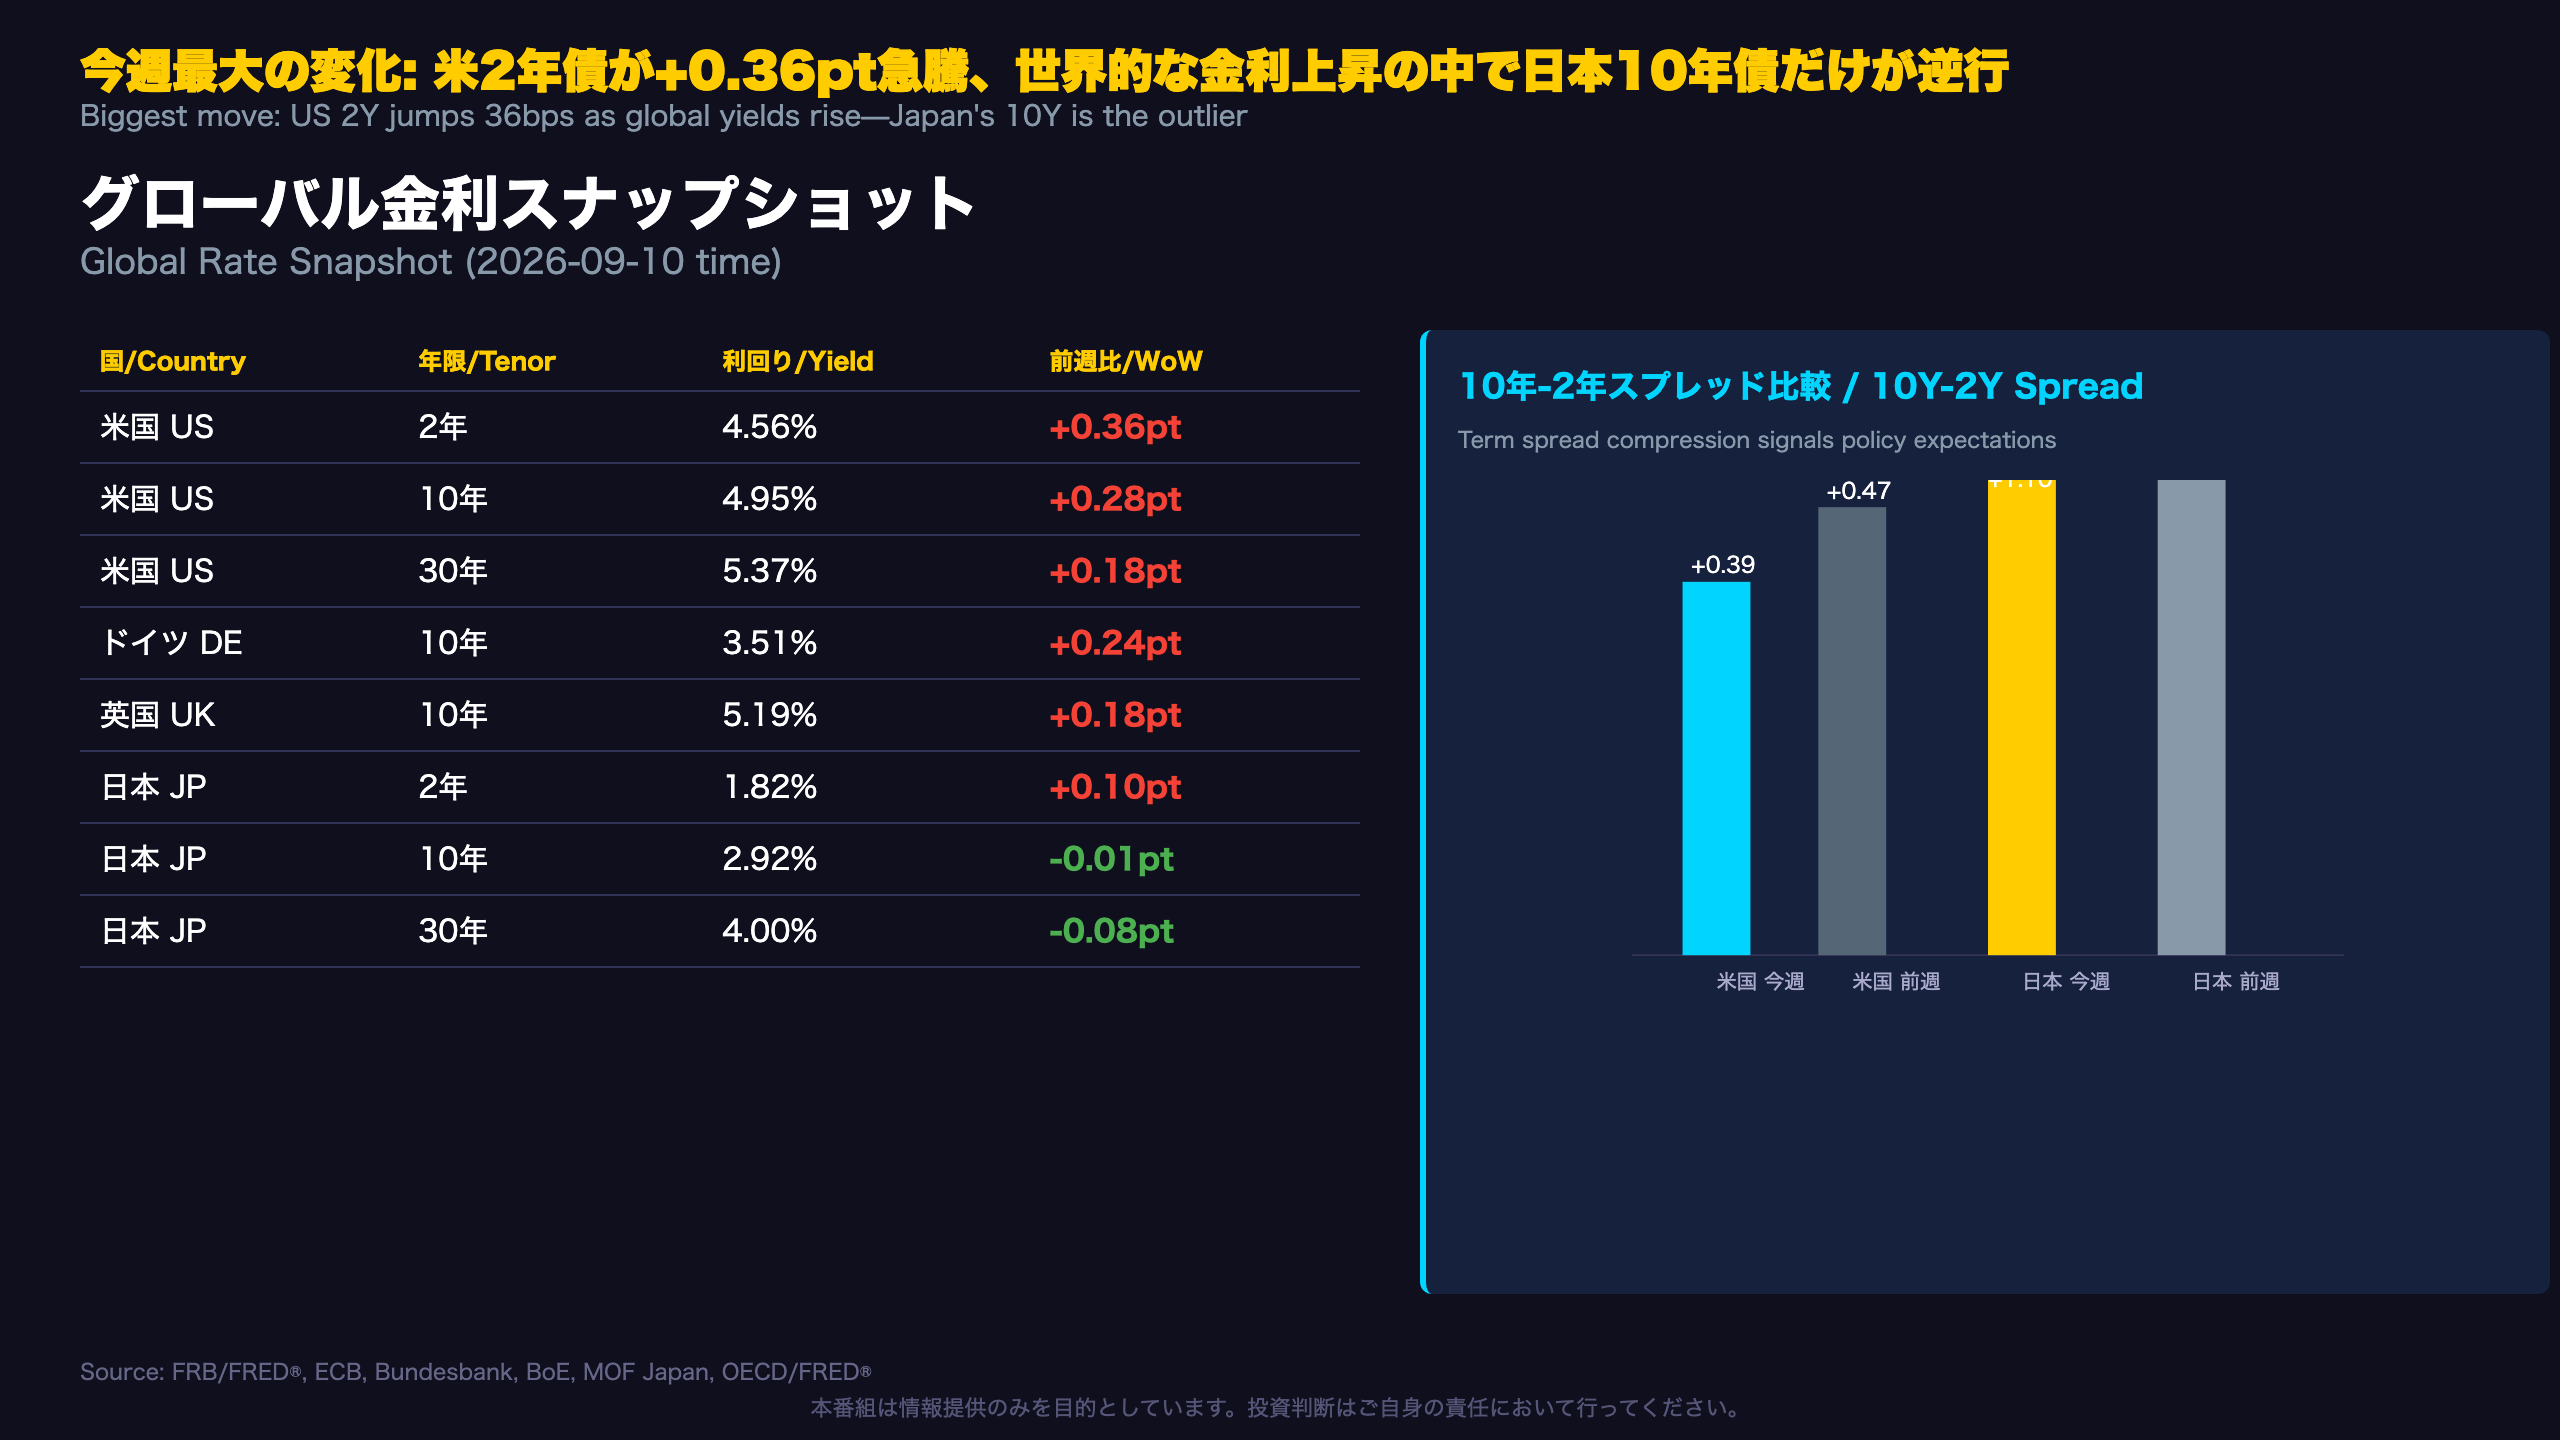
As of September 10, 2026, US Treasury yields stood at 4.56% (2Y), 4.95% (10Y), and 5.37% (30Y). Compared to the prior week (August 27), all tenors rose, but the shorter end moved more: +36bps on the 2Y versus +28bps on the 10Y and +18bps on the 30Y.
Curve Flattening in Progress
The US 10Y-2Y term spread narrowed from +47bps to +39bps. The curve remains normal (positively sloped), but the flattening suggests markets may be pricing in a longer period of elevated short-term rates (Level B inference).
Europe Followed Suit—Japan Didn’t
For readers unfamiliar with European sovereign benchmarks: the German Bund is Europe’s risk-free reference rate, while the UK Gilt reflects Bank of England policy expectations. Both rose alongside the US this week—Bund from 3.27% to 3.51% (+24bps), Gilt from 5.01% to 5.19% (+18bps), and the ECB’s Eurozone AAA composite from 3.70% to 3.95% (+25bps).
Japan told a different story. The 2-year JGB rose from 1.72% to 1.82% (+10bps), but the 10-year barely moved (2.93% to 2.92%), and the 30-year actually fell from 4.08% to 4.00% (-8bps). Japan’s own 10Y-2Y spread compressed from +121bps to +110bps.
Market Implications
For US-dollar investors, the synchronized rise in US, German, and UK yields points to broadly tightening global financial conditions. For yen watchers, the divergence in JGB long-end yields—falling even as global peers rise—is the standout anomaly this week, though a single week of data isn’t enough to call it a trend.
米国債入札:海外需要の高まり
What 79% Indirect Bidder Participation Tells Us
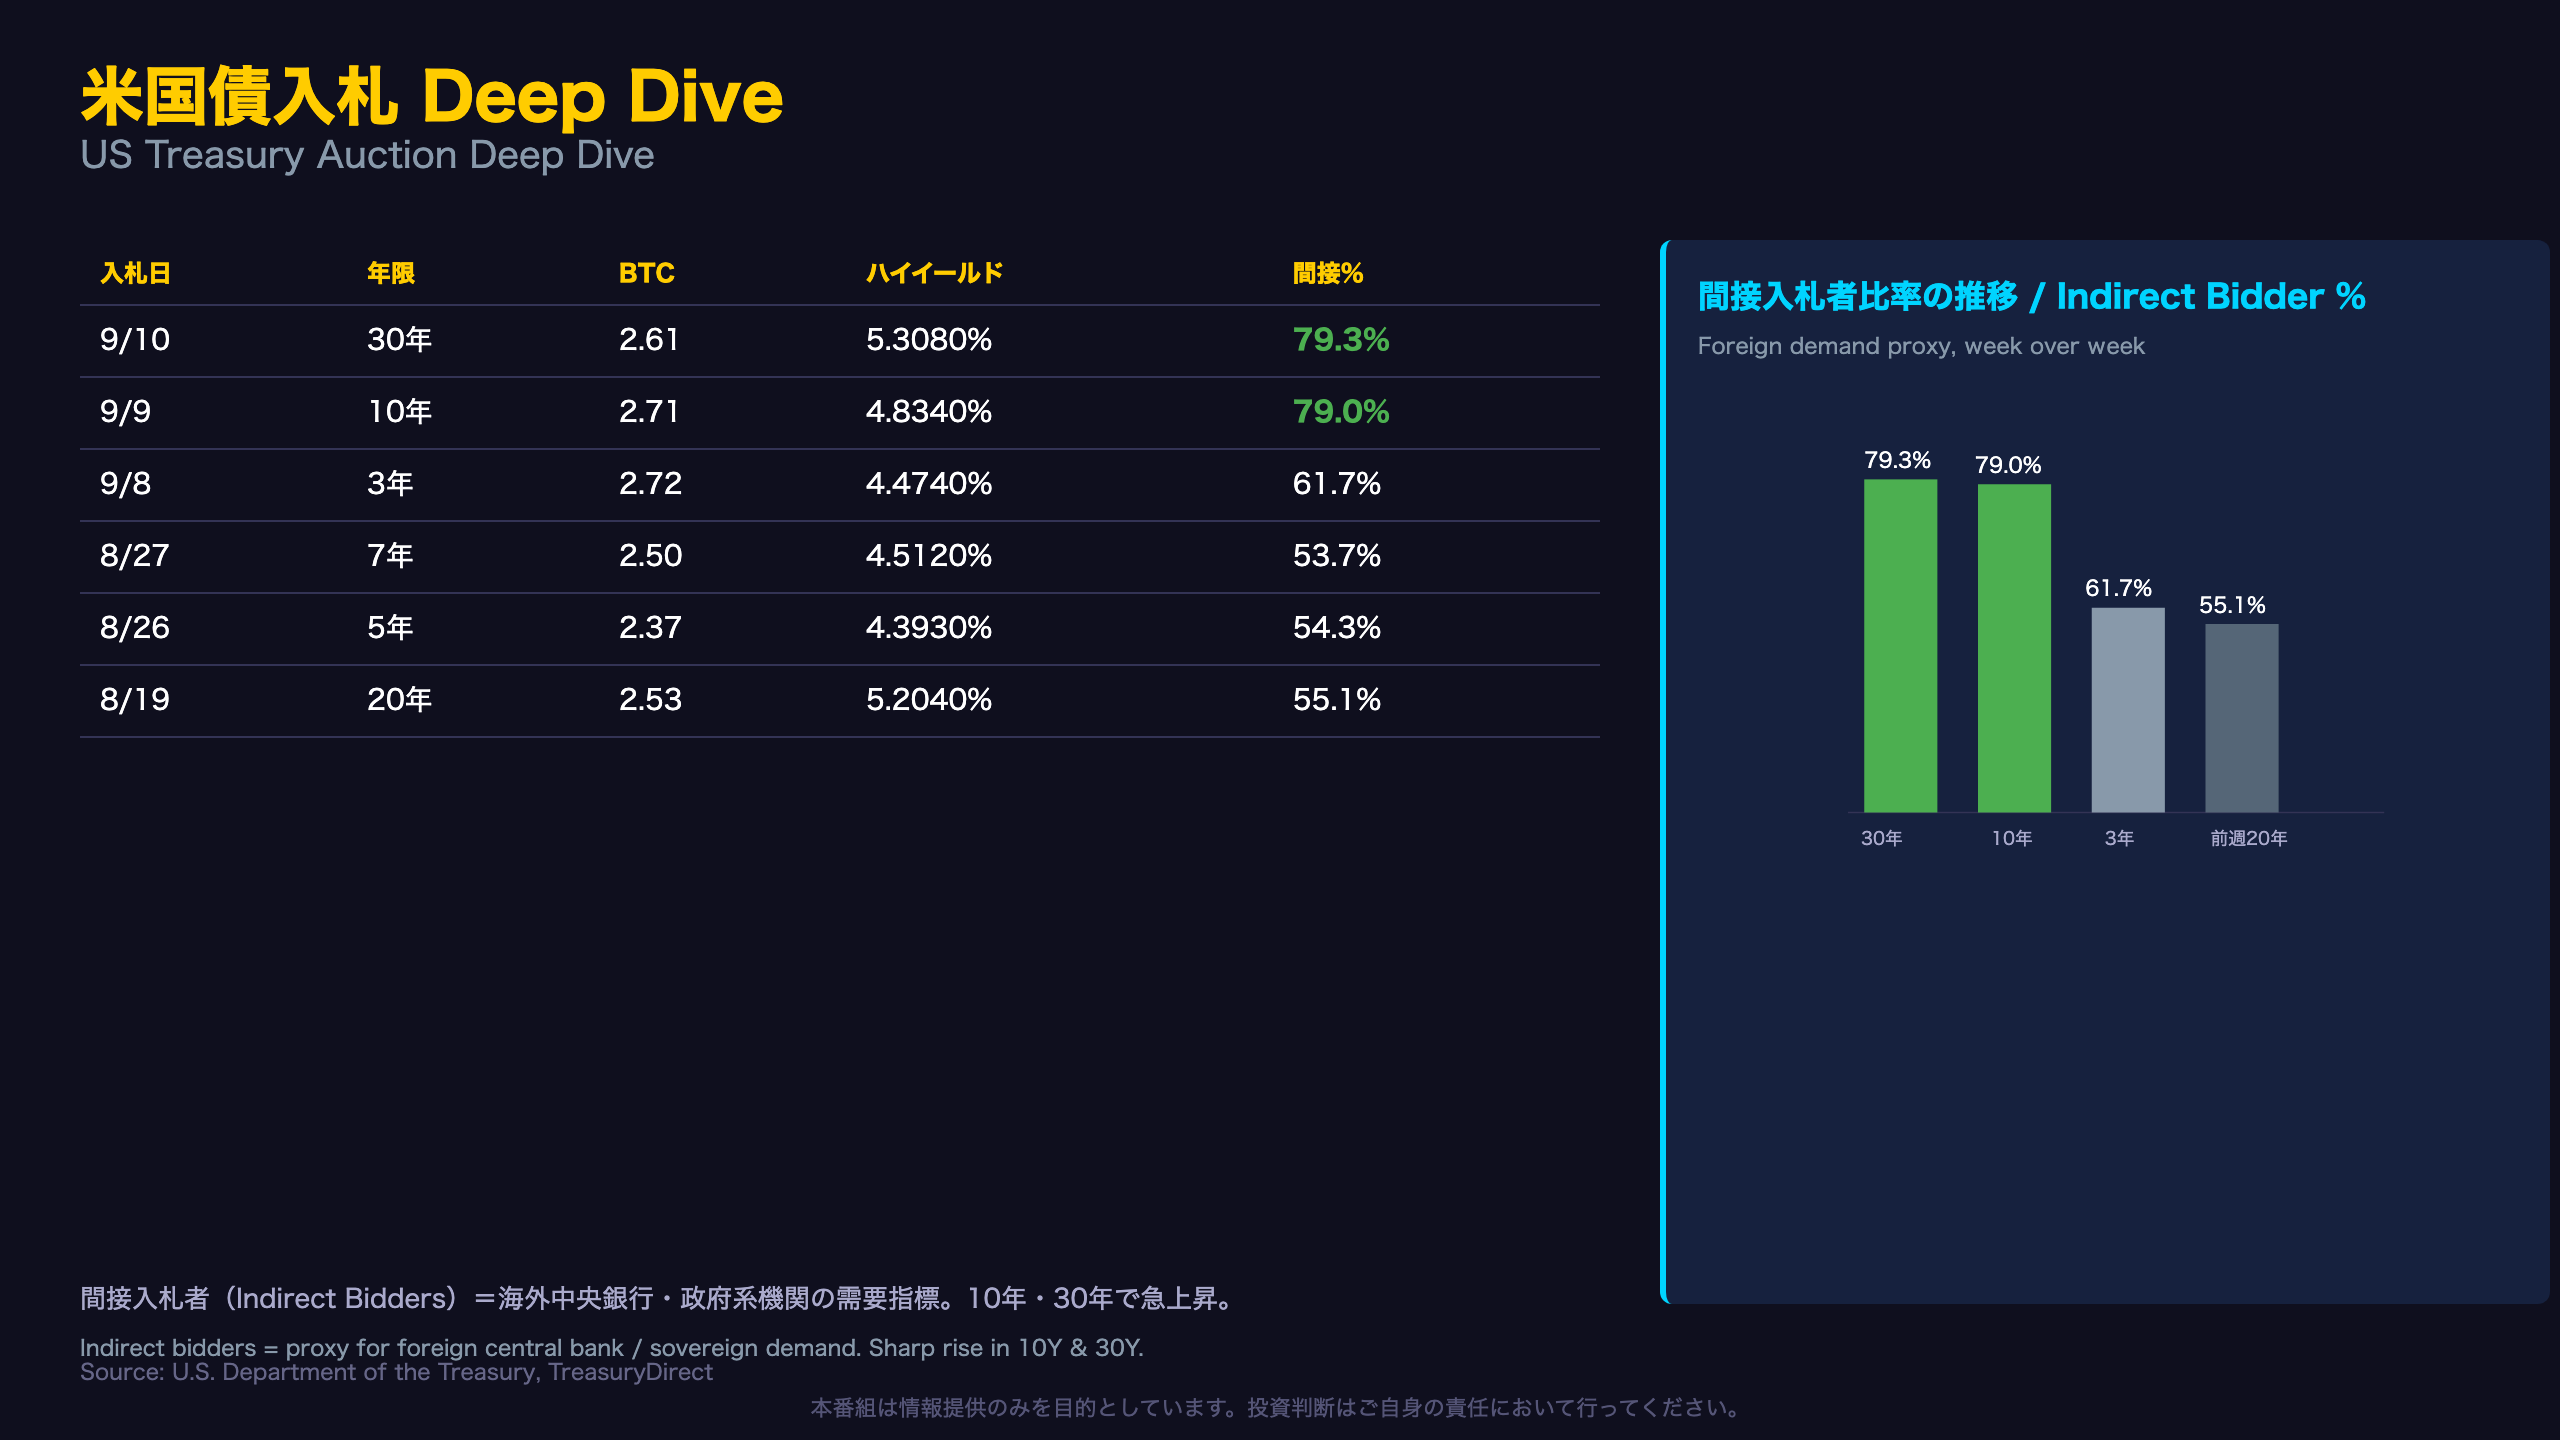
The standout figure from this week’s US Treasury auctions (September 8-10) is the indirect bidder share: 79.0% for the 10-year note (auctioned Sep 9) and 79.3% for the 30-year bond (Sep 10). That’s a jump of more than 20 percentage points from the prior week’s 20-year bond auction (Aug 19), which saw just 55.1% indirect participation.
Who Are “Indirect Bidders”?
For readers new to Treasury auction mechanics: indirect bidders are a category that includes foreign central banks, sovereign wealth funds, and other official institutions bidding through primary dealers. A rising indirect bidder share is often read as a proxy for foreign—particularly Asian central bank—demand for US debt, which matters directly for capital flows into the dollar.
Bid-to-Cover Held Steady
The bid-to-cover ratio (BTC) — total bids divided by amount awarded — came in at 2.71x for the 10-year, 2.61x for the 30-year, and 2.72x for the 3-year. That’s a modest improvement over the prior week’s 7-year (2.50x), 5-year (2.37x), and 2-year (2.37x) auctions, but not a dramatic shift. In other words, overall demand didn’t surge—but the composition of buyers appears to have tilted more foreign.
Market Implications
High stop-out yields (5.3080% for the 30-year, 4.8340% for the 10-year) combined with strong indirect participation suggest foreign buyers found current yield levels attractive enough to step in, even amid ongoing US fiscal deficit concerns. However, since auction tenors differ week to week (this week: 3Y/10Y/30Y vs. last week: 2Y/5Y/7Y/20Y), continued tracking of the same tenors over time will be needed to confirm this as a durable trend rather than a one-off.
欧州債券市場:スプレッド縮小の実相
Narrowing Spreads: Appearance vs. Reality
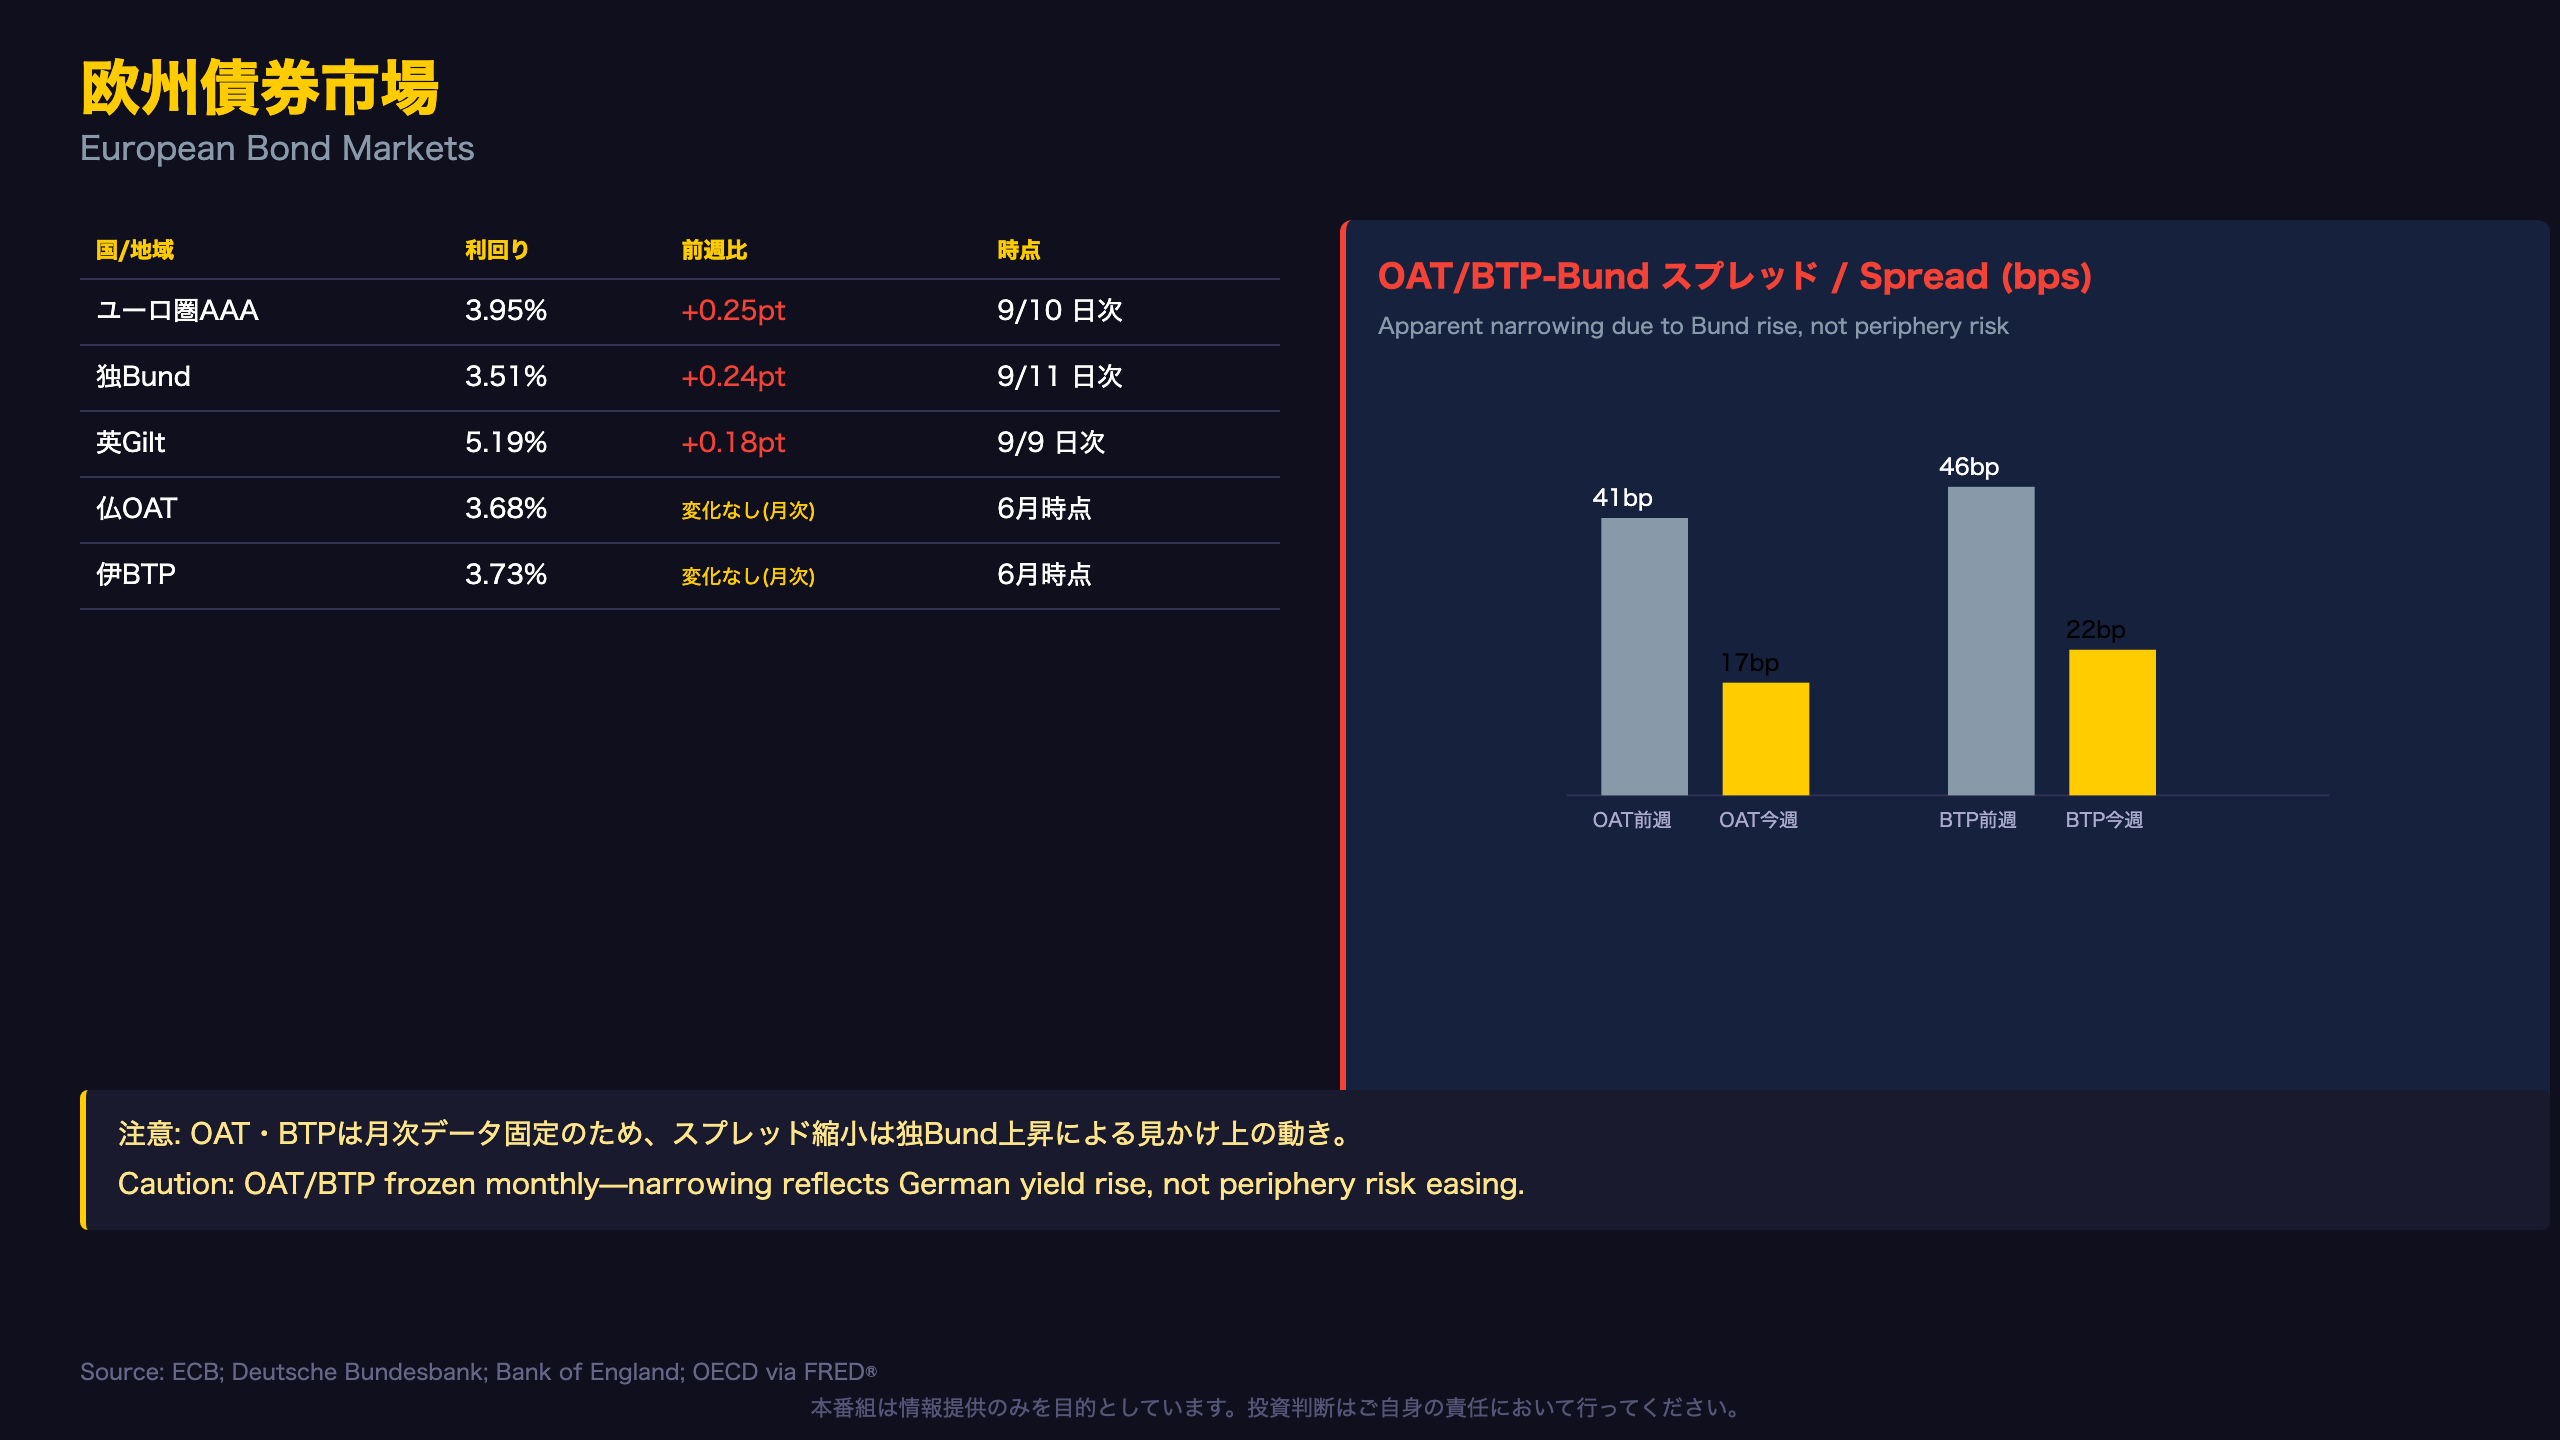
As of September 10, the ECB’s Eurozone AAA composite 10-year yield reached 3.95% (+25bps week-over-week). German Bund hit 3.51% (Sep 11, +24bps) and UK Gilt hit 5.19% (Sep 9, +18bps)—all three daily-frequency European benchmarks rose in step with the US Treasury move this week.
A Data Freshness Caveat
For context, French OAT (Obligations Assimilables du Trésor) and Italian BTP (Buoni del Tesoro Poliennali) yields in this dataset are sourced from OECD monthly statistics, last updated for June 2026 at 3.68% and 3.73% respectively—unchanged in this week’s report.
Because the German Bund yield (the denominator in these spread calculations) jumped sharply while French and Italian yields remained statically anchored to June levels, the OAT-Bund spread mechanically narrowed from 41bps to 17bps, and BTP-Bund from 46bps to 22bps.
Important: This is a Level A calculation based on the reported figures, but the interpretation requires care — this narrowing reflects Germany’s yield surge, not an actual improvement in French or Italian sovereign risk premiums.
Why This Matters for International Investors
US and European bond investors often watch OAT-Bund and BTP-Bund spreads as barometers of French political risk and Italian fiscal sustainability, respectively (comparable to how US high-yield spreads gauge corporate credit risk). Until updated monthly OAT/BTP data arrives, it would be premature to conclude eurozone periphery risk has actually eased (Level C caution).
UK Gilt Remains the Region’s Highest Yield
At 5.19%, UK Gilt yields remain the highest among major economies tracked here, consistent with the Bank of England’s “High-Rate Pause” policy stance—holding rates elevated rather than cutting.
日本国債・日銀政策:短期主導のフラット化
JGB Curve Flattening and the BOJ Tightening Cycle
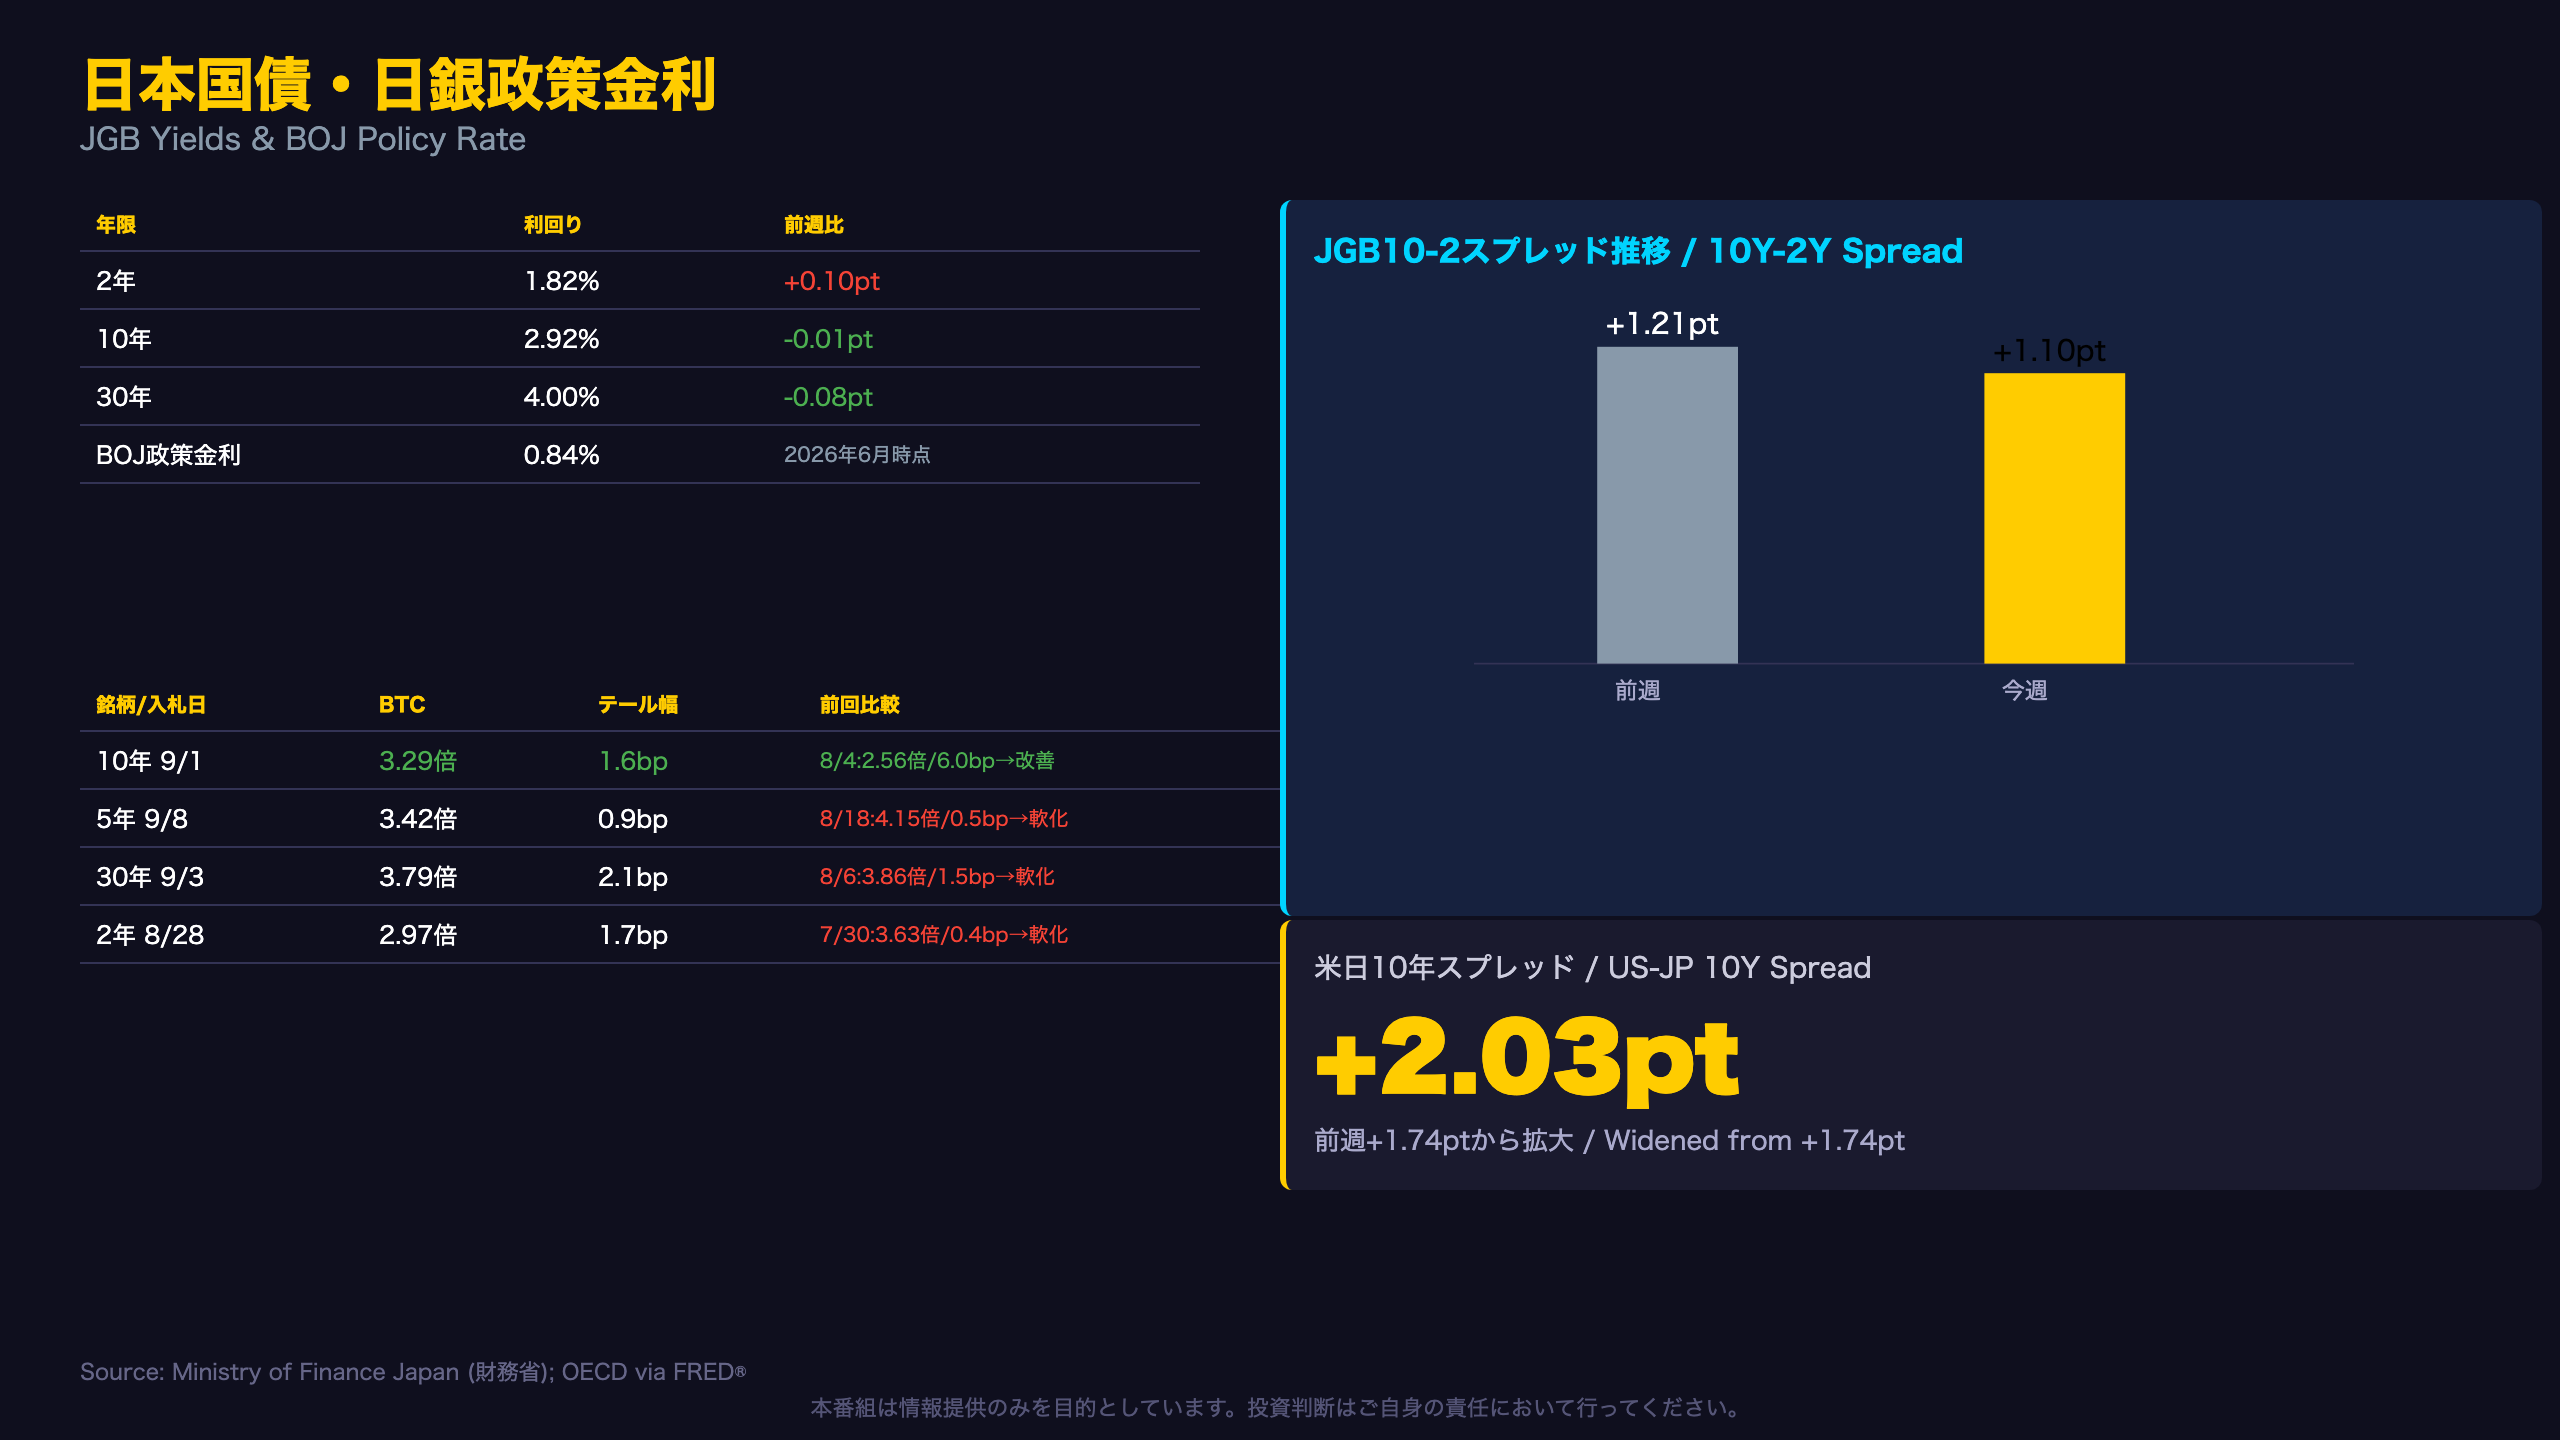
As of September 10, JGB yields were 1.82% (2Y), 2.92% (10Y), and 4.00% (30Y). The Bank of Japan’s policy rate stood at 0.84% as of June 2026 (OECD monthly data, the most recent available). The 10Y-2Y spread narrowed from +121bps to +110bps, meaning short-end yields rose faster than long-end yields—consistent with markets pricing in further BOJ rate hikes concentrated at the front end (Level B inference).
For International Readers: What Is the BOJ Doing?
The Bank of Japan spent years at near-zero or negative rates before beginning a tightening cycle. A policy rate of 0.84% and a rising 2-year yield both point to continued gradual normalization—a story quite different from the Fed or ECB, which are managing already-elevated rates.
US-Japan Spread Widened—Carry Trade Implications
The US-Japan 10-year spread widened from +174bps to +203bps, as the US 10-year rose 28bps while Japan’s barely moved. This widening spread is a key input for USD/JPY carry trade dynamics, though it should be read alongside Japan’s own short-end tightening, which works in the opposite direction.
Auction Demand: A Mixed Picture
Looking at the “tail” (stop-out yield minus average yield, a gauge of demand dispersion) across recent JGB auctions:
- 10-year (Sep 1): bid-to-cover improved to 3.29x from 2.56x (Aug 4); tail shrank sharply from 6.0bps to 1.6bps — a clear demand improvement.
- 5-year (Sep 8): bid-to-cover fell to 3.42x from 4.15x (Aug 18); tail widened slightly to 0.9bps from 0.5bps.
- 30-year (Sep 3): bid-to-cover fell to 3.79x from 3.86x (Aug 6); tail widened to 2.1bps from 1.5bps.
- 2-year (Aug 28): bid-to-cover fell to 2.97x from 3.63x (Jul 30); tail widened to 1.7bps from 0.4bps.
The 10-year stands out as the one tenor with clearly improving demand, while shorter and longer tenors show mild softening—suggesting demand may be concentrating in specific maturities rather than broadly improving across the curve.
FX・CFDへの含意:HMMレジームとの整合性
HMM Regime Shifts and Rate Data Consistency
NFC’s proprietary Hidden Markov Model (HMM) system tracks regime classifications for four major central banks. This week’s readings:
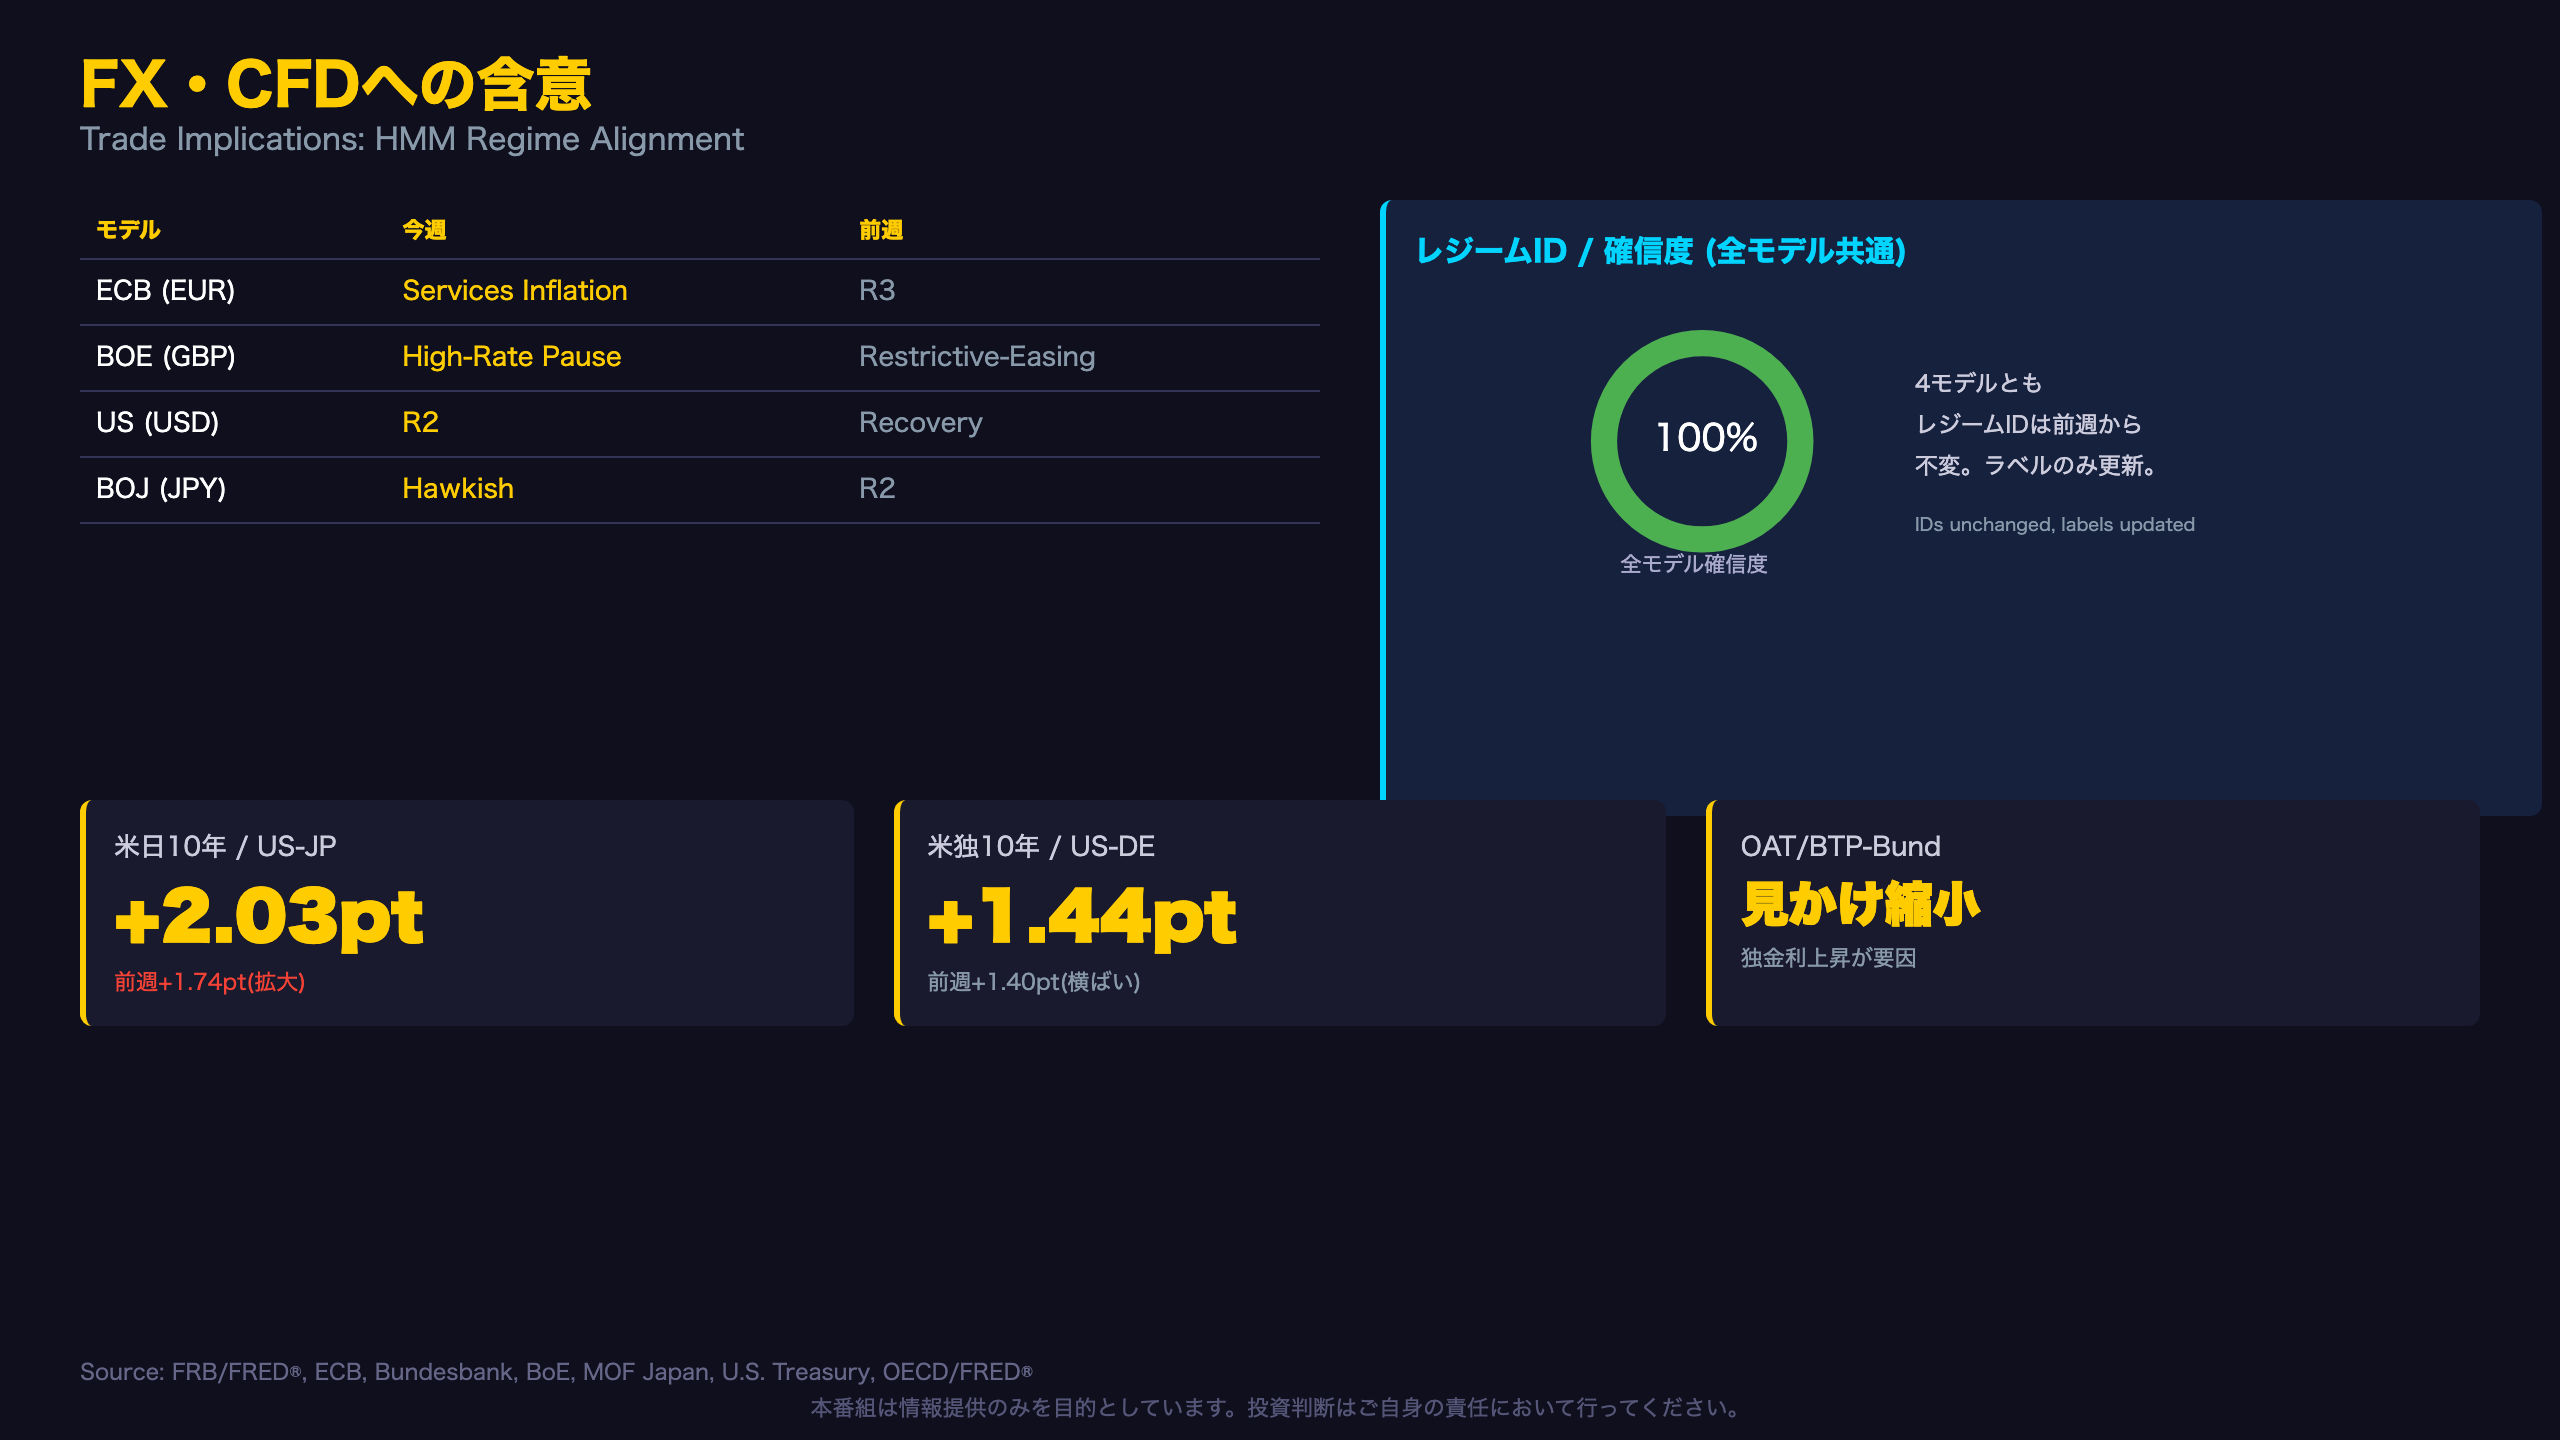
| Model | Currency | This Week | Last Week | Regime ID |
|---|---|---|---|---|
| ECB | EUR | Services Inflation | R3 | ID3→ID3 (unchanged, relabeled) |
| BOE | GBP | High-Rate Pause | Restrictive-Easing | ID2→ID2 (unchanged) |
| US | USD | R2 | Recovery | ID2→ID2 (unchanged) |
| BOJ | JPY | Hawkish | R2 | ID2→ID2 (unchanged) |
Notably, none of the four underlying regime IDs changed week-over-week—but the descriptive labels were updated, which can itself carry information about how the model interprets incoming data.
Why This Matters for International Readers
Unlike simple rate-differential trackers, NFC’s HMM approach classifies each central bank’s policy stance into a probabilistic regime state. A shift to “Hawkish” for the BOJ model — while the ID stayed at 2 — lines up with the observed 10bp rise in Japan’s 2-year JGB yield this week (Level B consistency check).
The BOE’s “High-Rate Pause” label is consistent with UK Gilt yields sitting at 5.19%, the highest among the economies tracked in this report — suggesting the model reads current BOE policy as “holding rates high” rather than actively cutting.
Three Key Spreads at a Glance
- US-Japan 10Y spread: +2.03pt (up from +1.74pt) — the key USD/JPY carry trade input
- US-Germany 10Y spread: +1.44pt (up from +1.40pt) — essentially flat, both economies’ yields rose together
- OAT-Bund / BTP-Bund: narrowed on paper, but driven by the German yield spike rather than reduced periphery risk (see Slide 3)
Reading the Overall Picture
Taken together, this week’s data shows a bond market with mixed signals rather than a single clear directional theme—rising short rates in the US and Japan, elevated but stable UK rates, and a German-led compression in eurozone periphery spreads. This suggests investors should weigh both hawkish (rate-driven) and risk-sentiment factors when assessing near-term FX and rates positioning, rather than assuming one dominant narrative.
Disclaimer: This article is for informational purposes only. All investment decisions are made solely at your own risk.