📺 Watch the Full Video Analysis
This article was automatically generated by the NFC Market Live AI analysis system. (Updated: 2026-09-14 13:58 JST)
📄 Primary Source
NFC Market Live
https://www.meti.go.jp/statistics/tyo/iip/result/pdf/press/b2020_202607kj.pdf, https://www.meti.go.jp/statistics/tyo/iip/result/pdf/press/b2020_202607nj.pdf
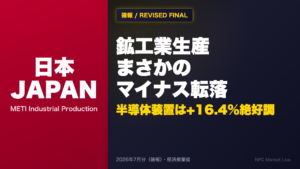
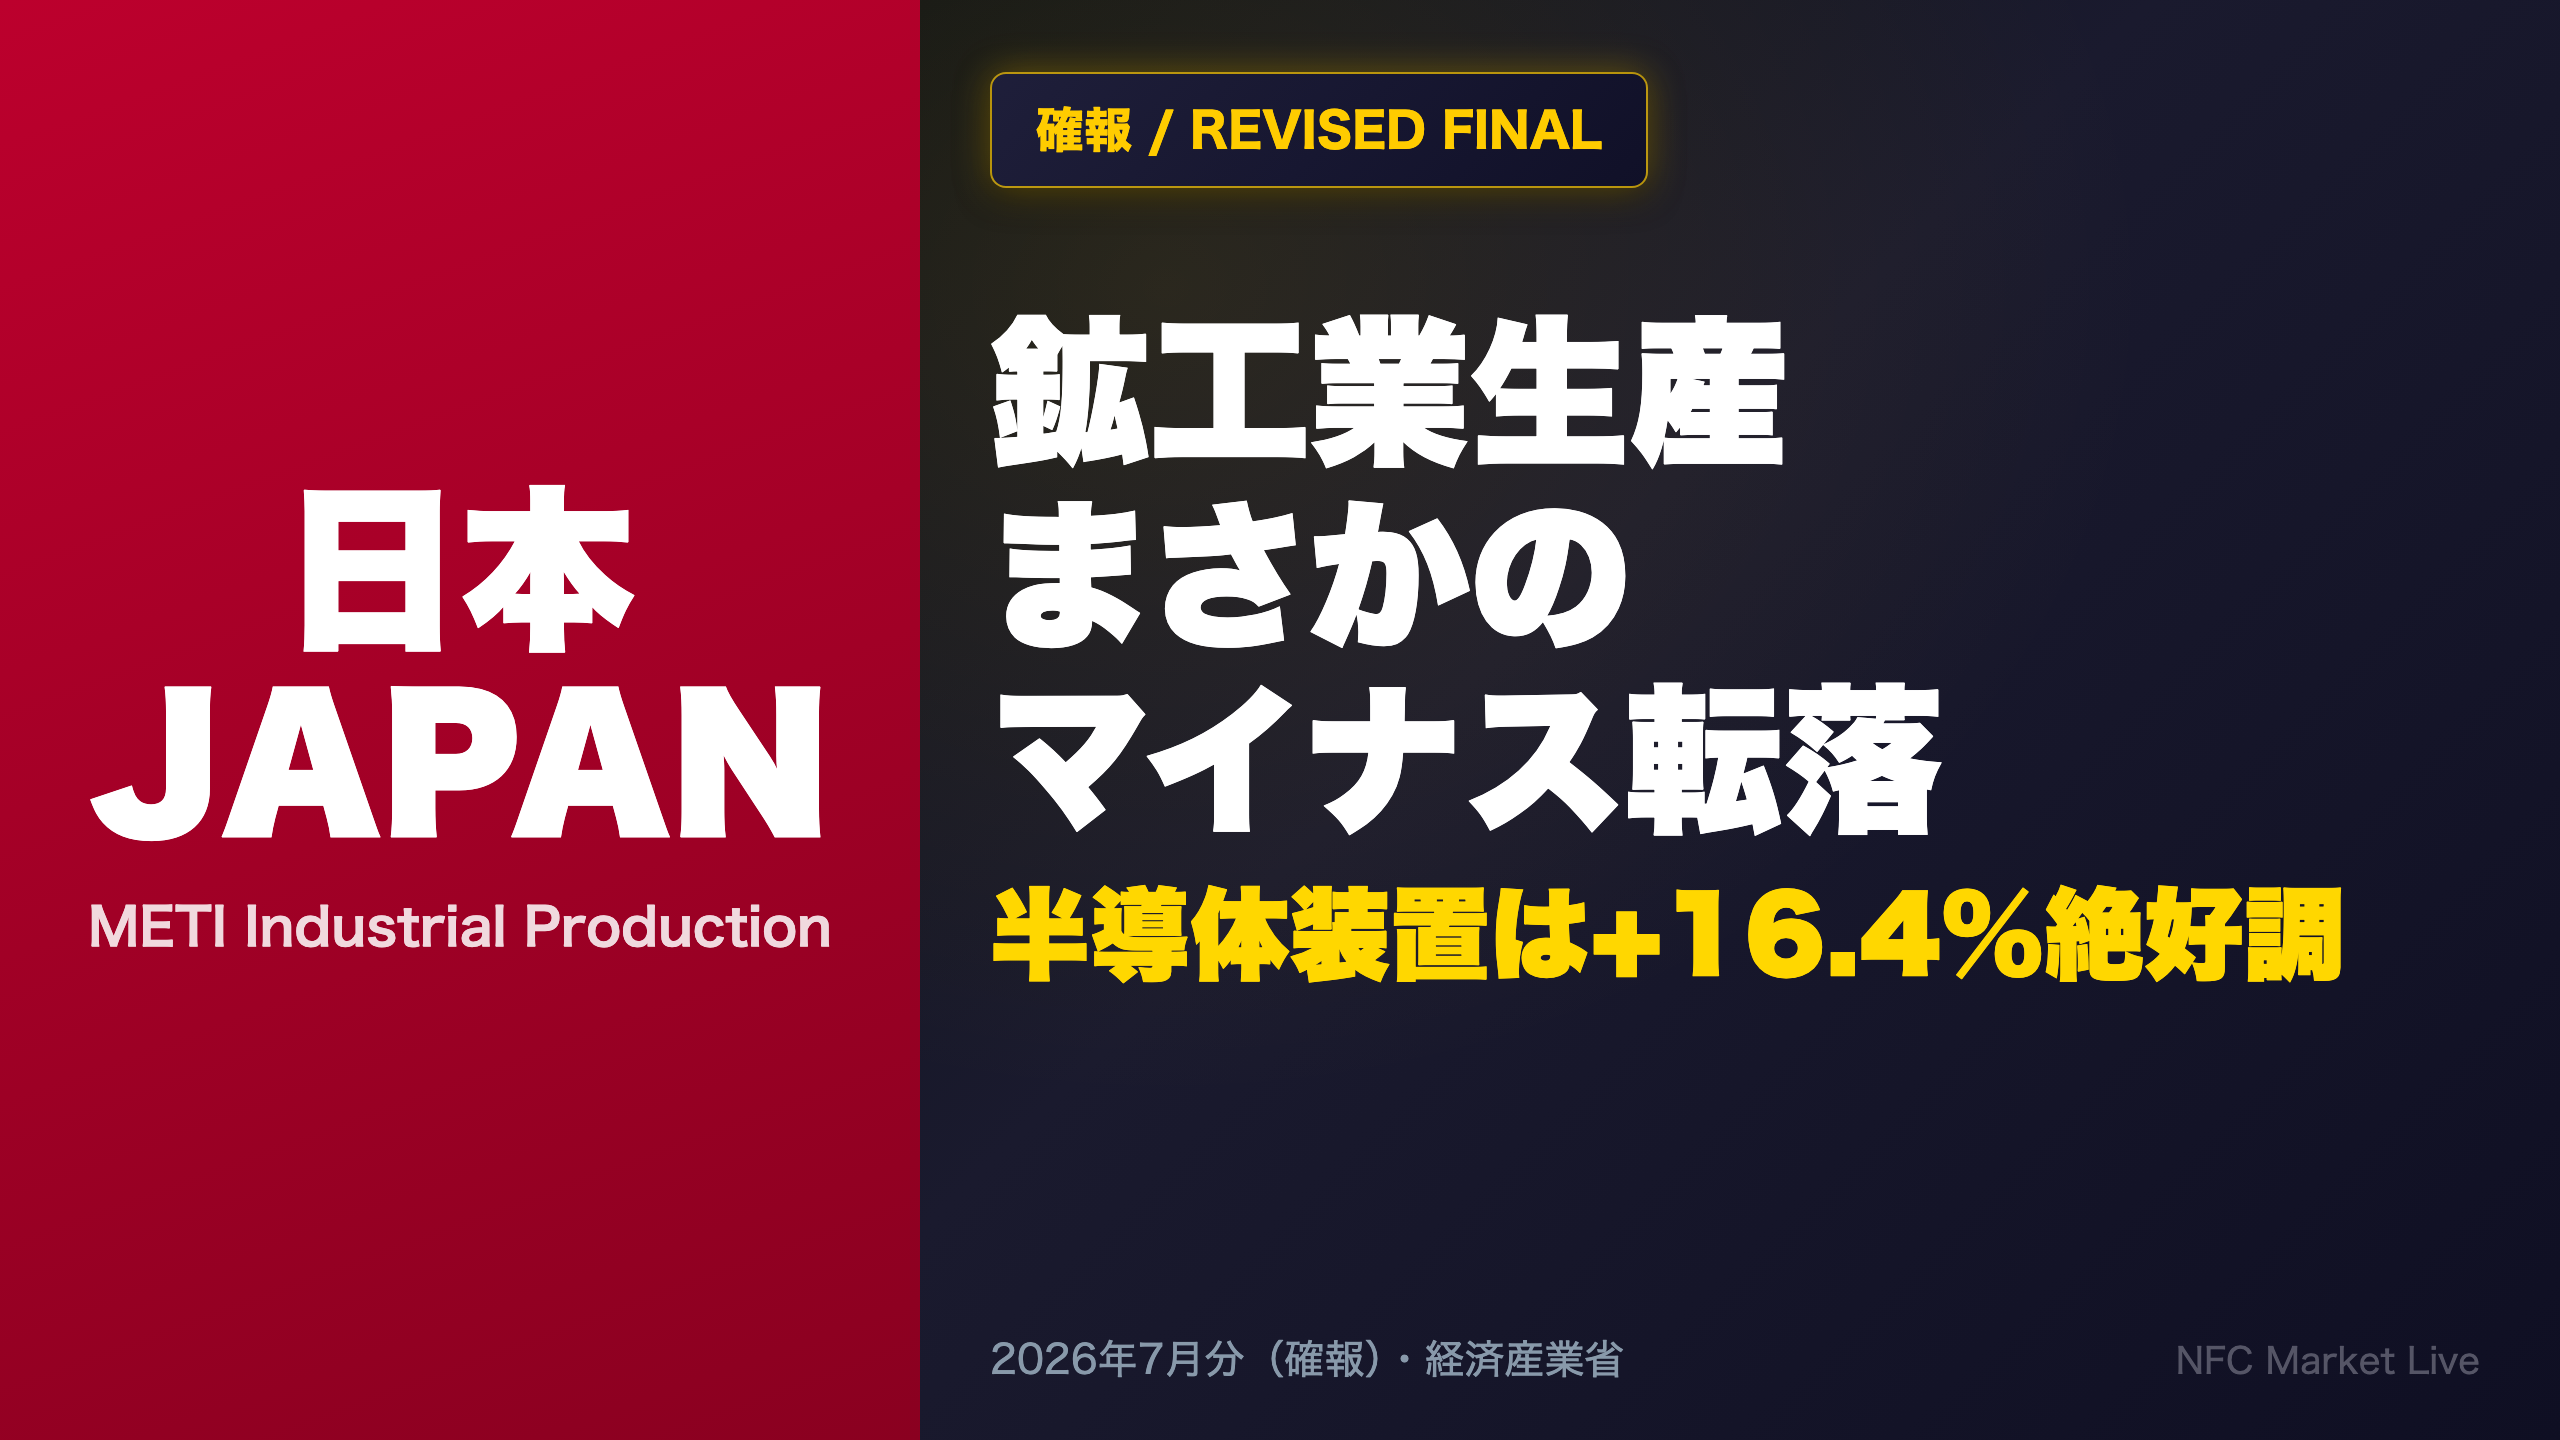
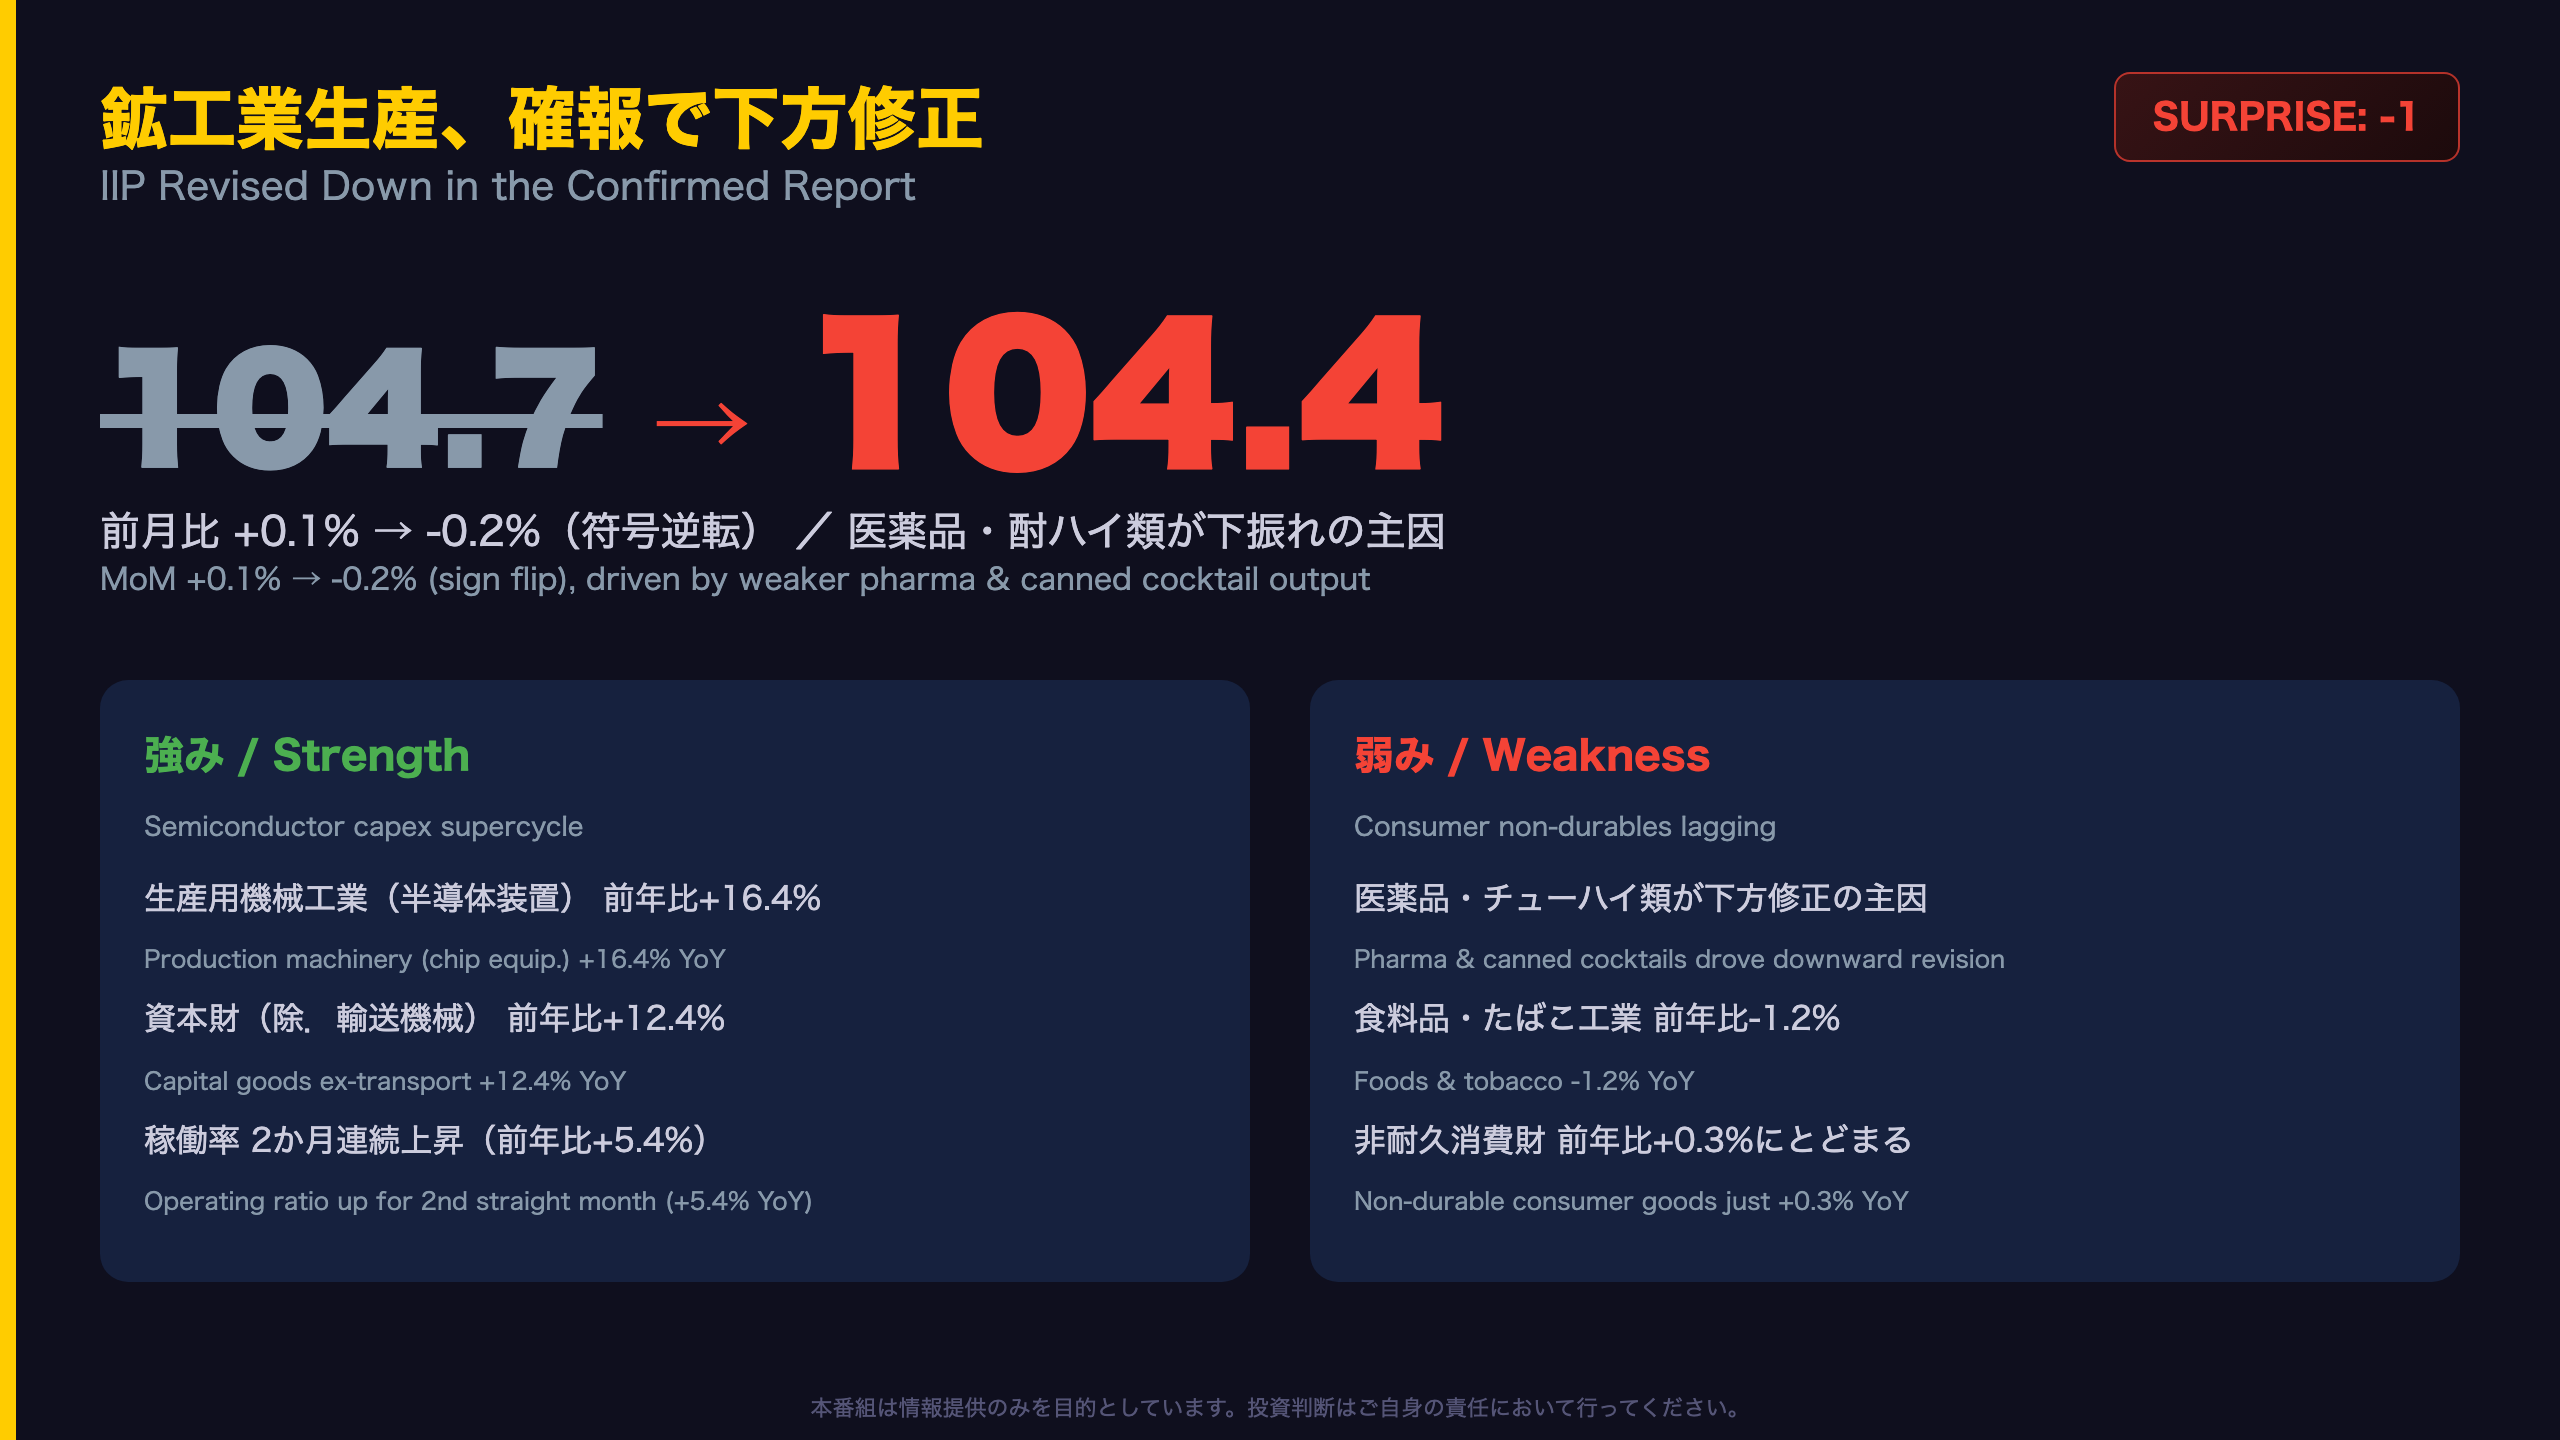
📊 Japan’s METI confirmed July’s Industrial Production Index at 104.4 (-0.2% MoM), revised down from a preliminary +0.1%.
💊 Pharmaceuticals and canned cocktails drove the downgrade.
⚙️ Yet production machinery, including semiconductor equipment, surged +16.4% YoY, and utilization kept rising.
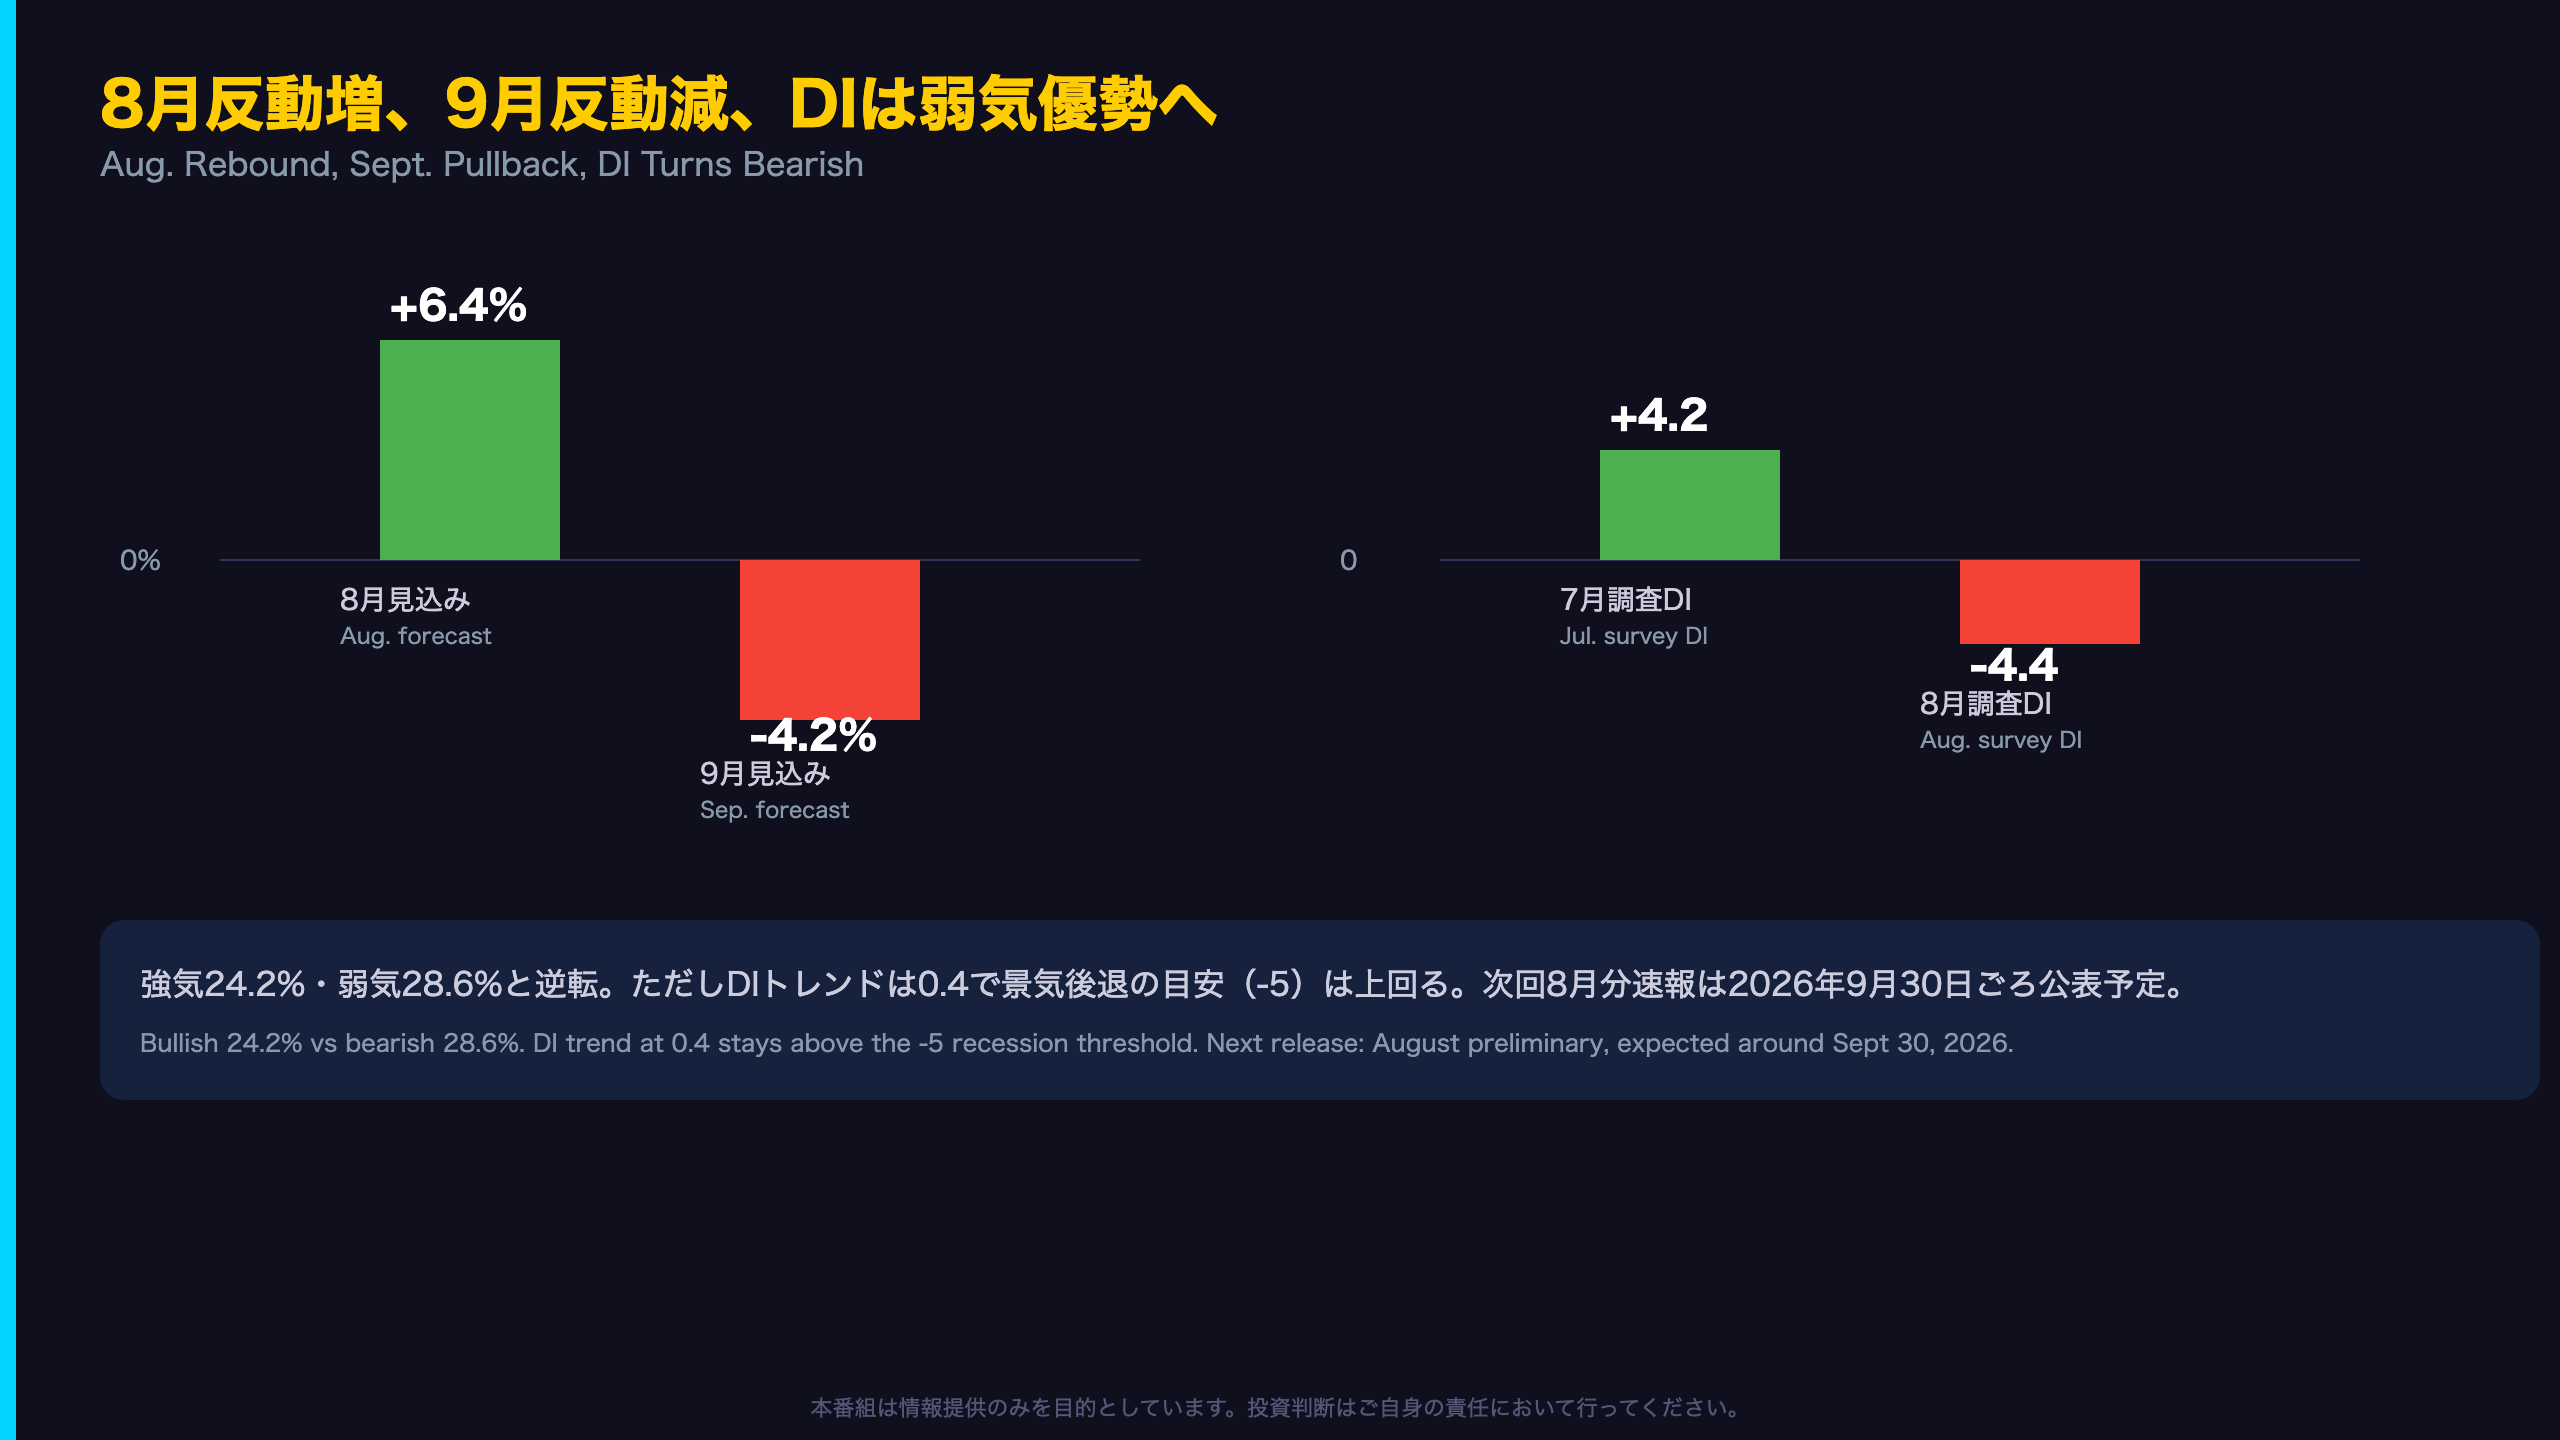
📉 August plans were revised up to +6.4%, but September forecasts a -4.2% pullback.
A deep dive into Japan’s two-speed manufacturing economy.
The Ultimate Summary:確報下方修正と二極化の実像
Understanding the Revision: What Japan’s METI Data Really Shows
Japan’s Ministry of Economy, Trade and Industry (METI) publishes the Indices of Industrial Production (IIP) in two stages: a preliminary release about a month after month-end, followed by a confirmed (“Kakuho”) figure roughly five weeks later. For investors unfamiliar with this process, the confirmed figure is generally the more reliable read on Japan’s factory-floor activity — comparable to the difference between a flash PMI and its final print.
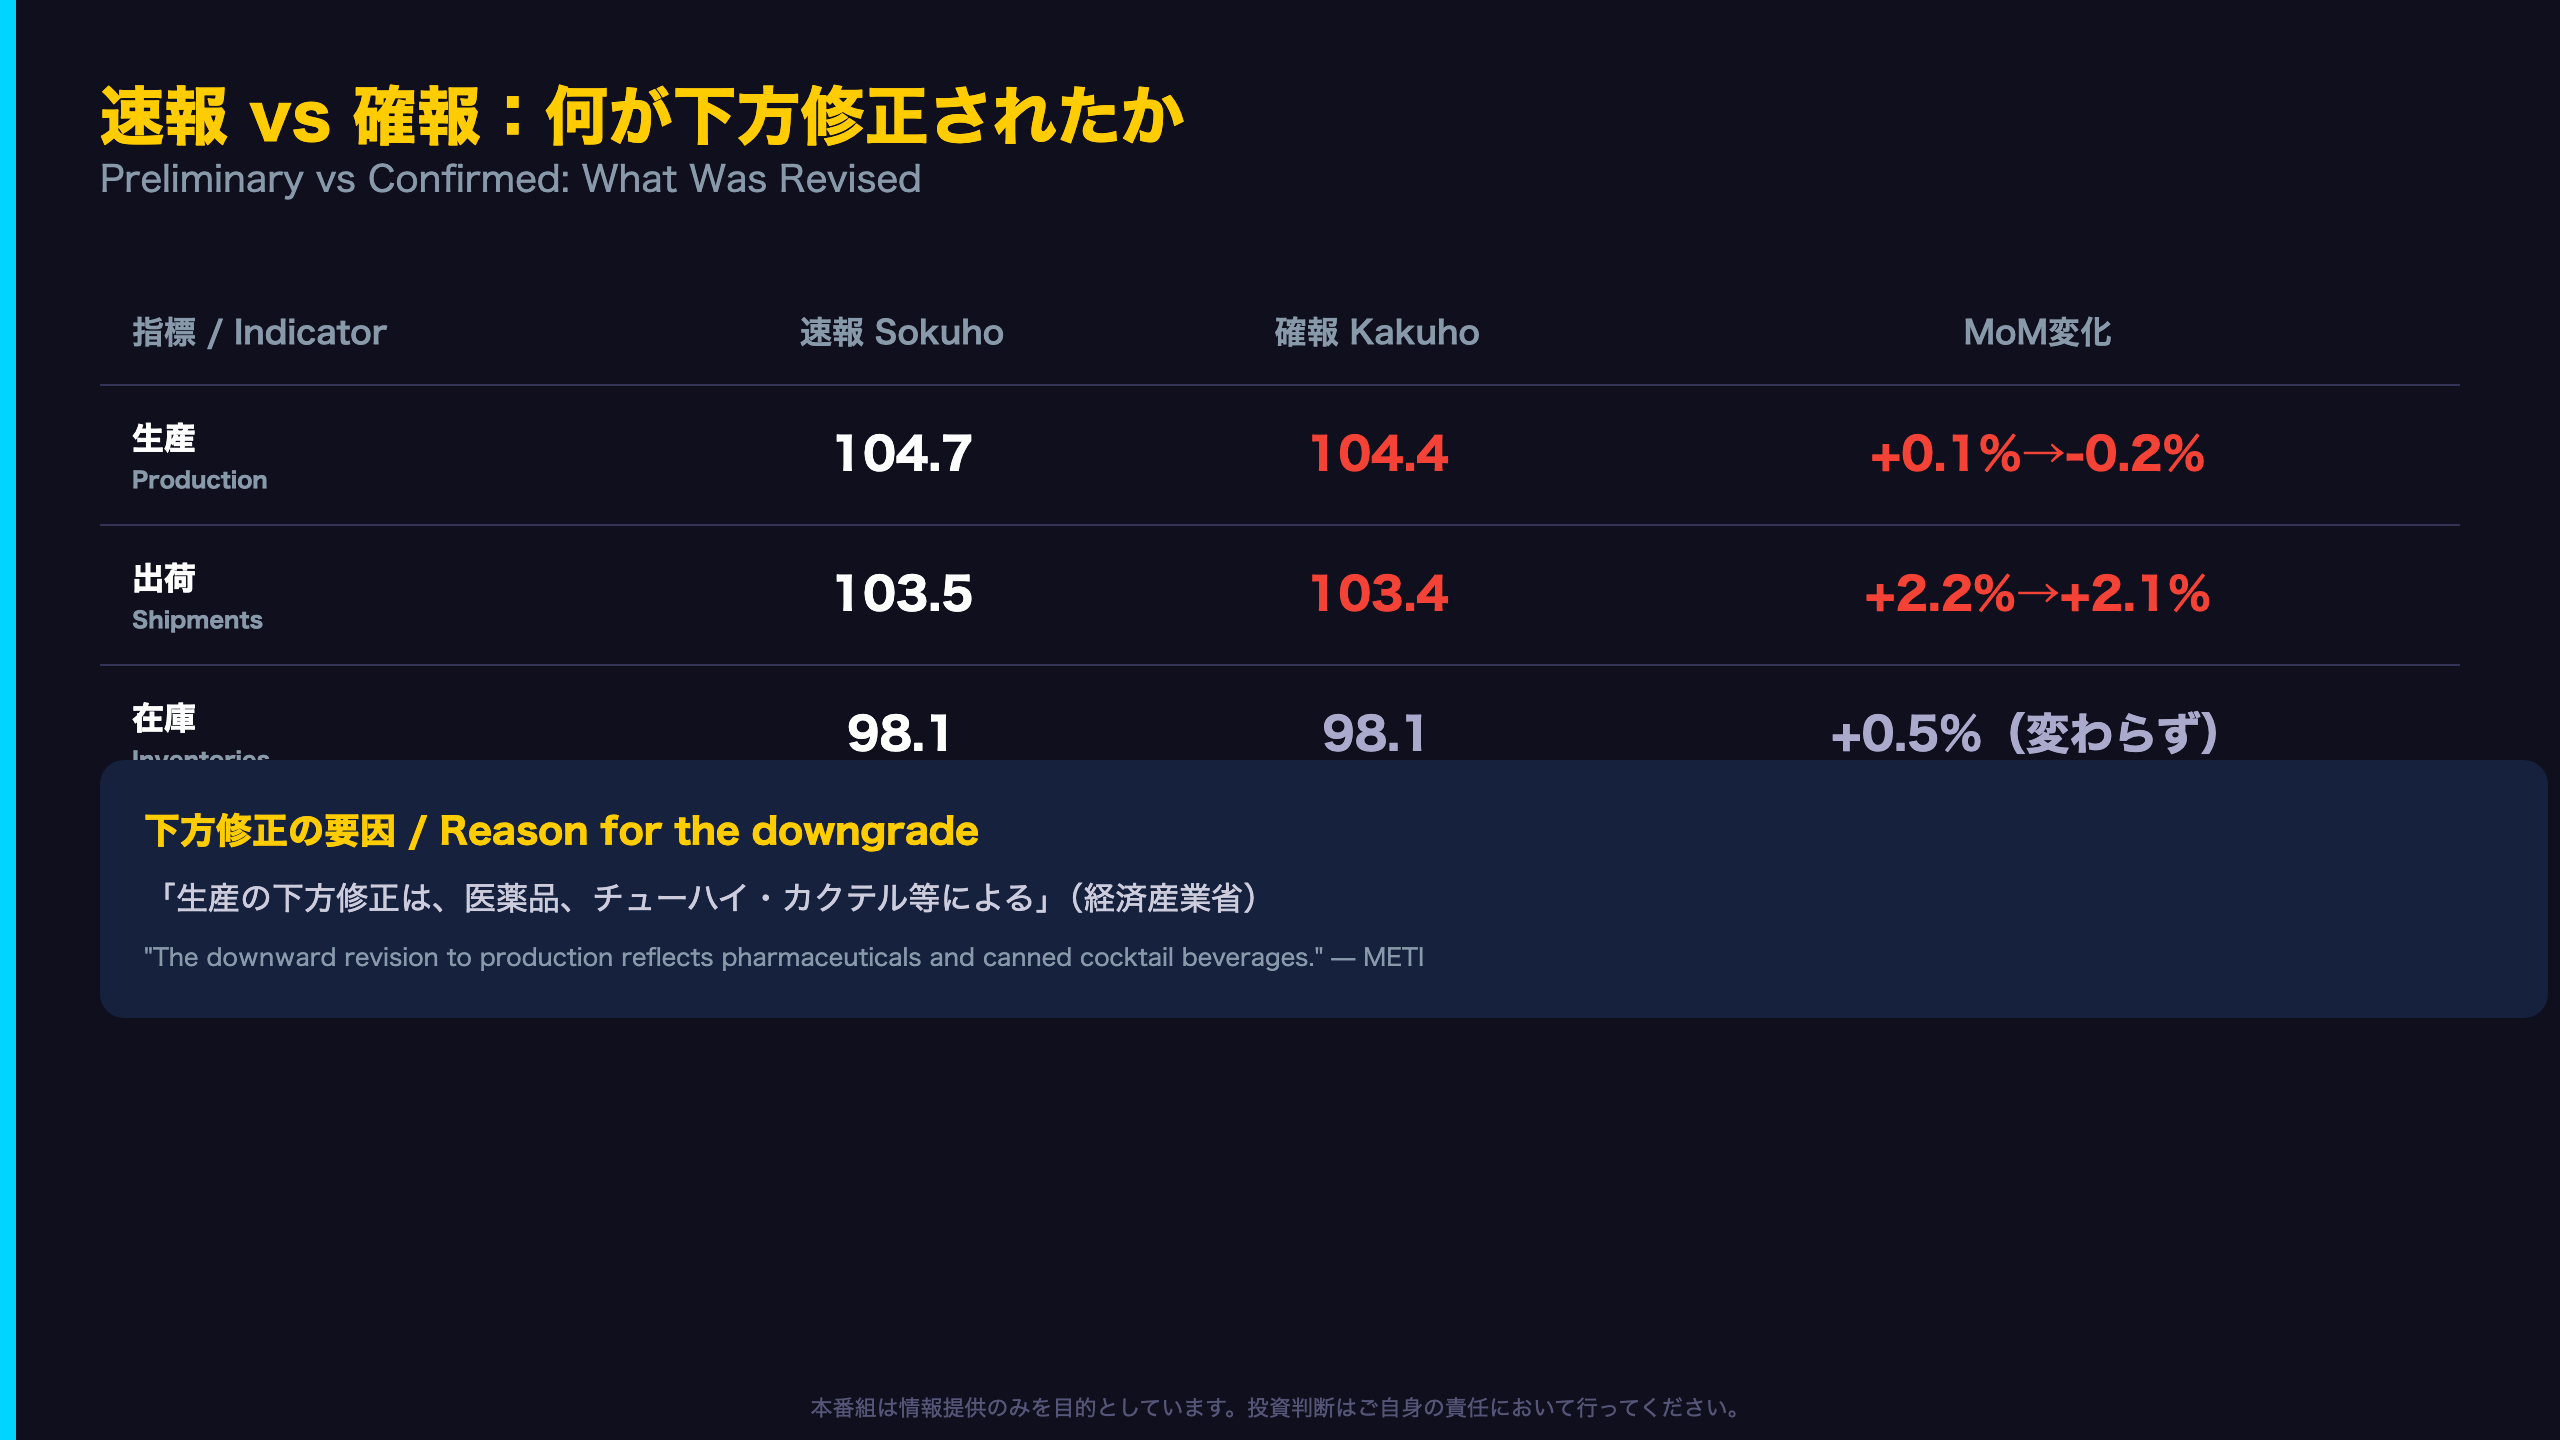
What changed and why: July’s preliminary IIP showed a modest +0.1% MoM gain (104.7). METI’s confirmed report revised this down to -0.2% (104.4), explicitly citing weaker-than-initially-reported output of pharmaceuticals and canned cocktail (chuhai) beverages — both domestic consumer non-durables, unrelated to trade or capex cycles.
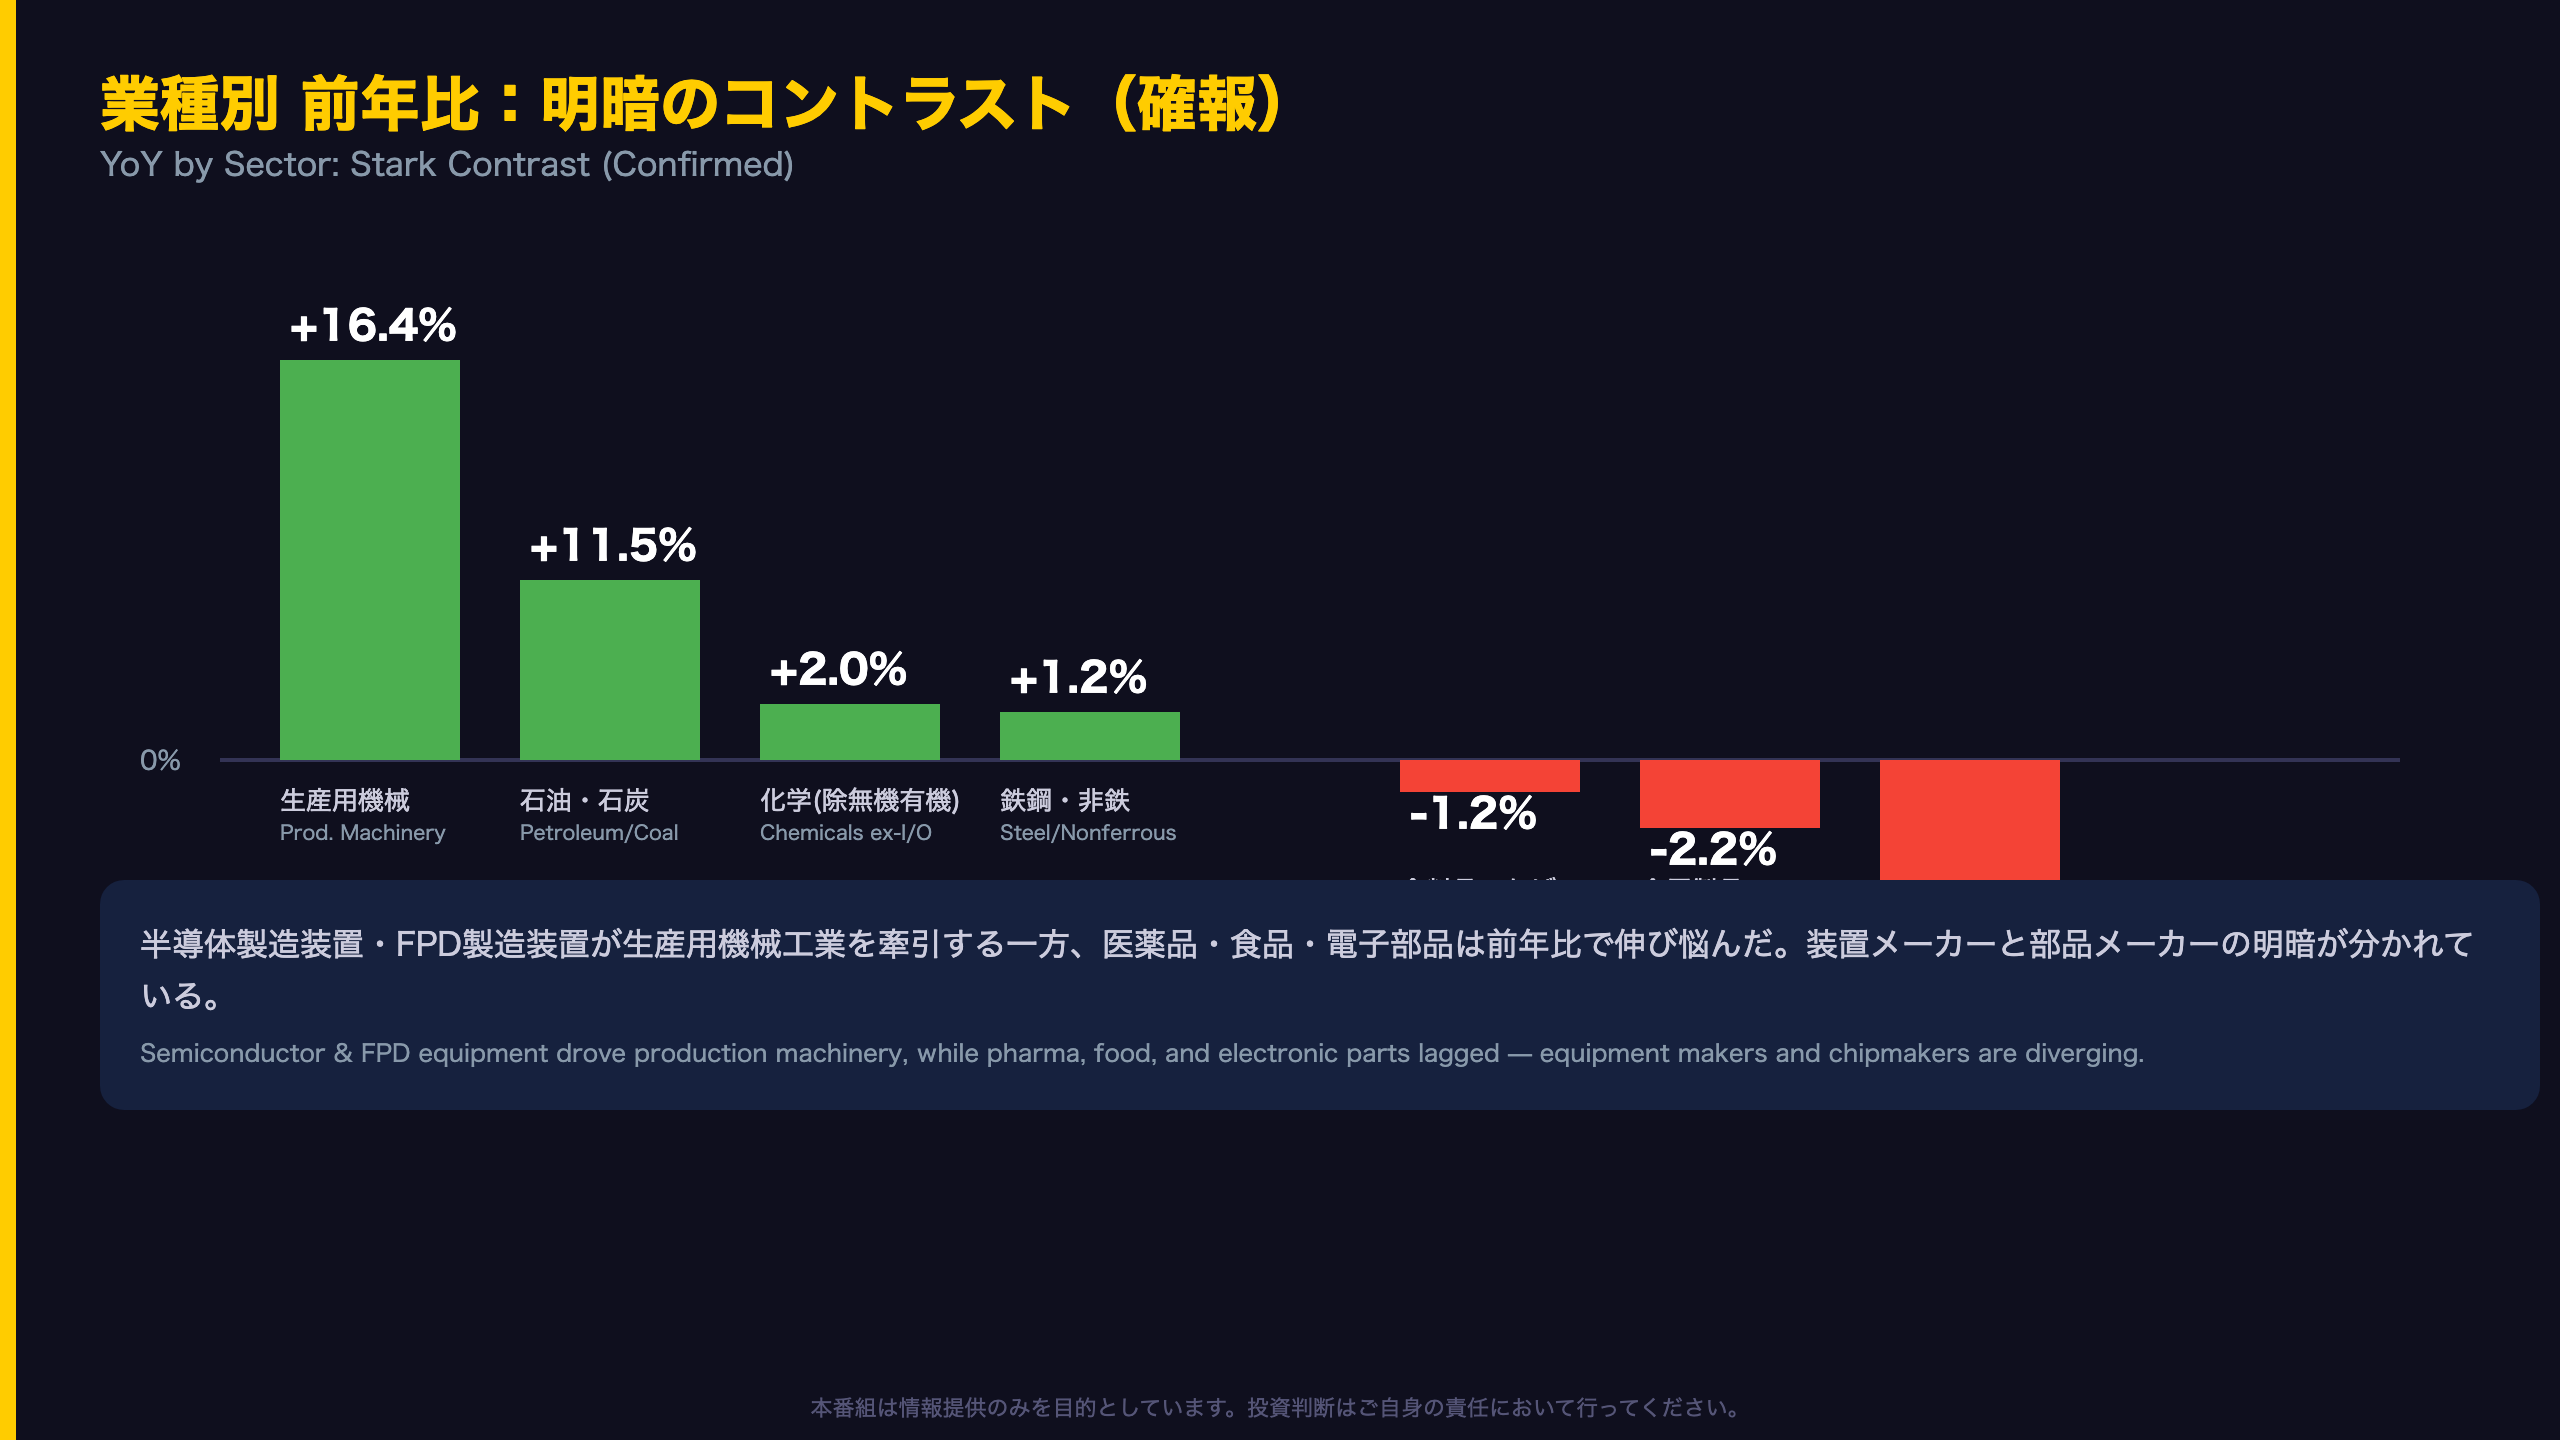
The bifurcation to watch: capital goods (ex-transport) output rose +12.4% YoY, powered by semiconductor and flat-panel-display manufacturing equipment (+16.4% YoY). Non-durable consumer goods, by contrast, grew just +0.3% YoY. This is not a broad-based recovery; it is an investment-led, semiconductor-supercycle story riding atop a stagnant consumer manufacturing base.
Market implication: this data alone does not strengthen the case for near-term BOJ tightening, since the revision cuts against the headline growth narrative even as capex fundamentals stay solid. Equity investors should differentiate semiconductor-equipment suppliers, which enjoy a genuine structural tailwind, from domestic consumer-goods manufacturers facing softer demand.
速報から確報へ:何が、なぜ修正されたのか
How Often Do Japan’s IIP Revisions Flip the Sign?
Revisions between Japan’s preliminary (Sokuho) and confirmed (Kakuho) Industrial Production Index typically run within a narrow ±0.5 point band. This month’s 0.3-point downward revision — enough to flip the monthly change from positive to negative — is a comparatively rare occurrence, akin to a flash PMI being revised from expansion into contraction in its final print.
Notably, METI’s qualitative assessment of the trend (“production is moving sideways”) was left unchanged despite the sign flip. This suggests the agency itself does not view a single month’s revision as signaling a change in trend — a useful caution against overreacting to one data point.
A key nuance for international investors: shipments were barely revised (103.5 to 103.4) and inventories were untouched at 98.1. Only production was revised meaningfully downward. This points to a production-side or reporting-side factor — specific factory output data arriving late from the pharmaceutical and beverage sectors — rather than a broad demand-side collapse, an important distinction when assessing consumer weakness versus a statistical artifact.
業種別の真の主役:半導体装置ブーム vs 消費財の下振れ
Behind the Semiconductor Equipment Boom
A 16.4% year-on-year jump in production machinery output is an unusually strong single-month reading. METI’s item-level commentary explicitly names “semiconductor manufacturing equipment” and “flat-panel display manufacturing equipment” as the drivers — consistent with the global AI-data-center-driven capex supercycle flowing through to Japanese equipment makers’ order books.
A nuance investors often miss: electronic parts and devices production itself — the industry that actually uses this equipment — was roughly flat, down 0.4% year over year. This gap suggests the current phase may be an early-cycle equipment-buying wave, ahead of an actual ramp in chip output. This argues for distinguishing between semiconductor equipment makers (Tokyo Electron, Screen Holdings, Disco) and chipmakers/parts producers, whose fundamentals have not yet caught up.
On the weaker side: foods and tobacco (-1.2% YoY) and chemicals excluding inorganic/organic categories (dragged by pharmaceuticals) point to softer domestic consumer demand. This should be read as a single-month signal, not a structural conclusion. Watch whether production machinery strength persists into August and September data.
在庫サイクル診断:積極的補充か、意図せざる減少か
Reading the Inventory Cycle Chart
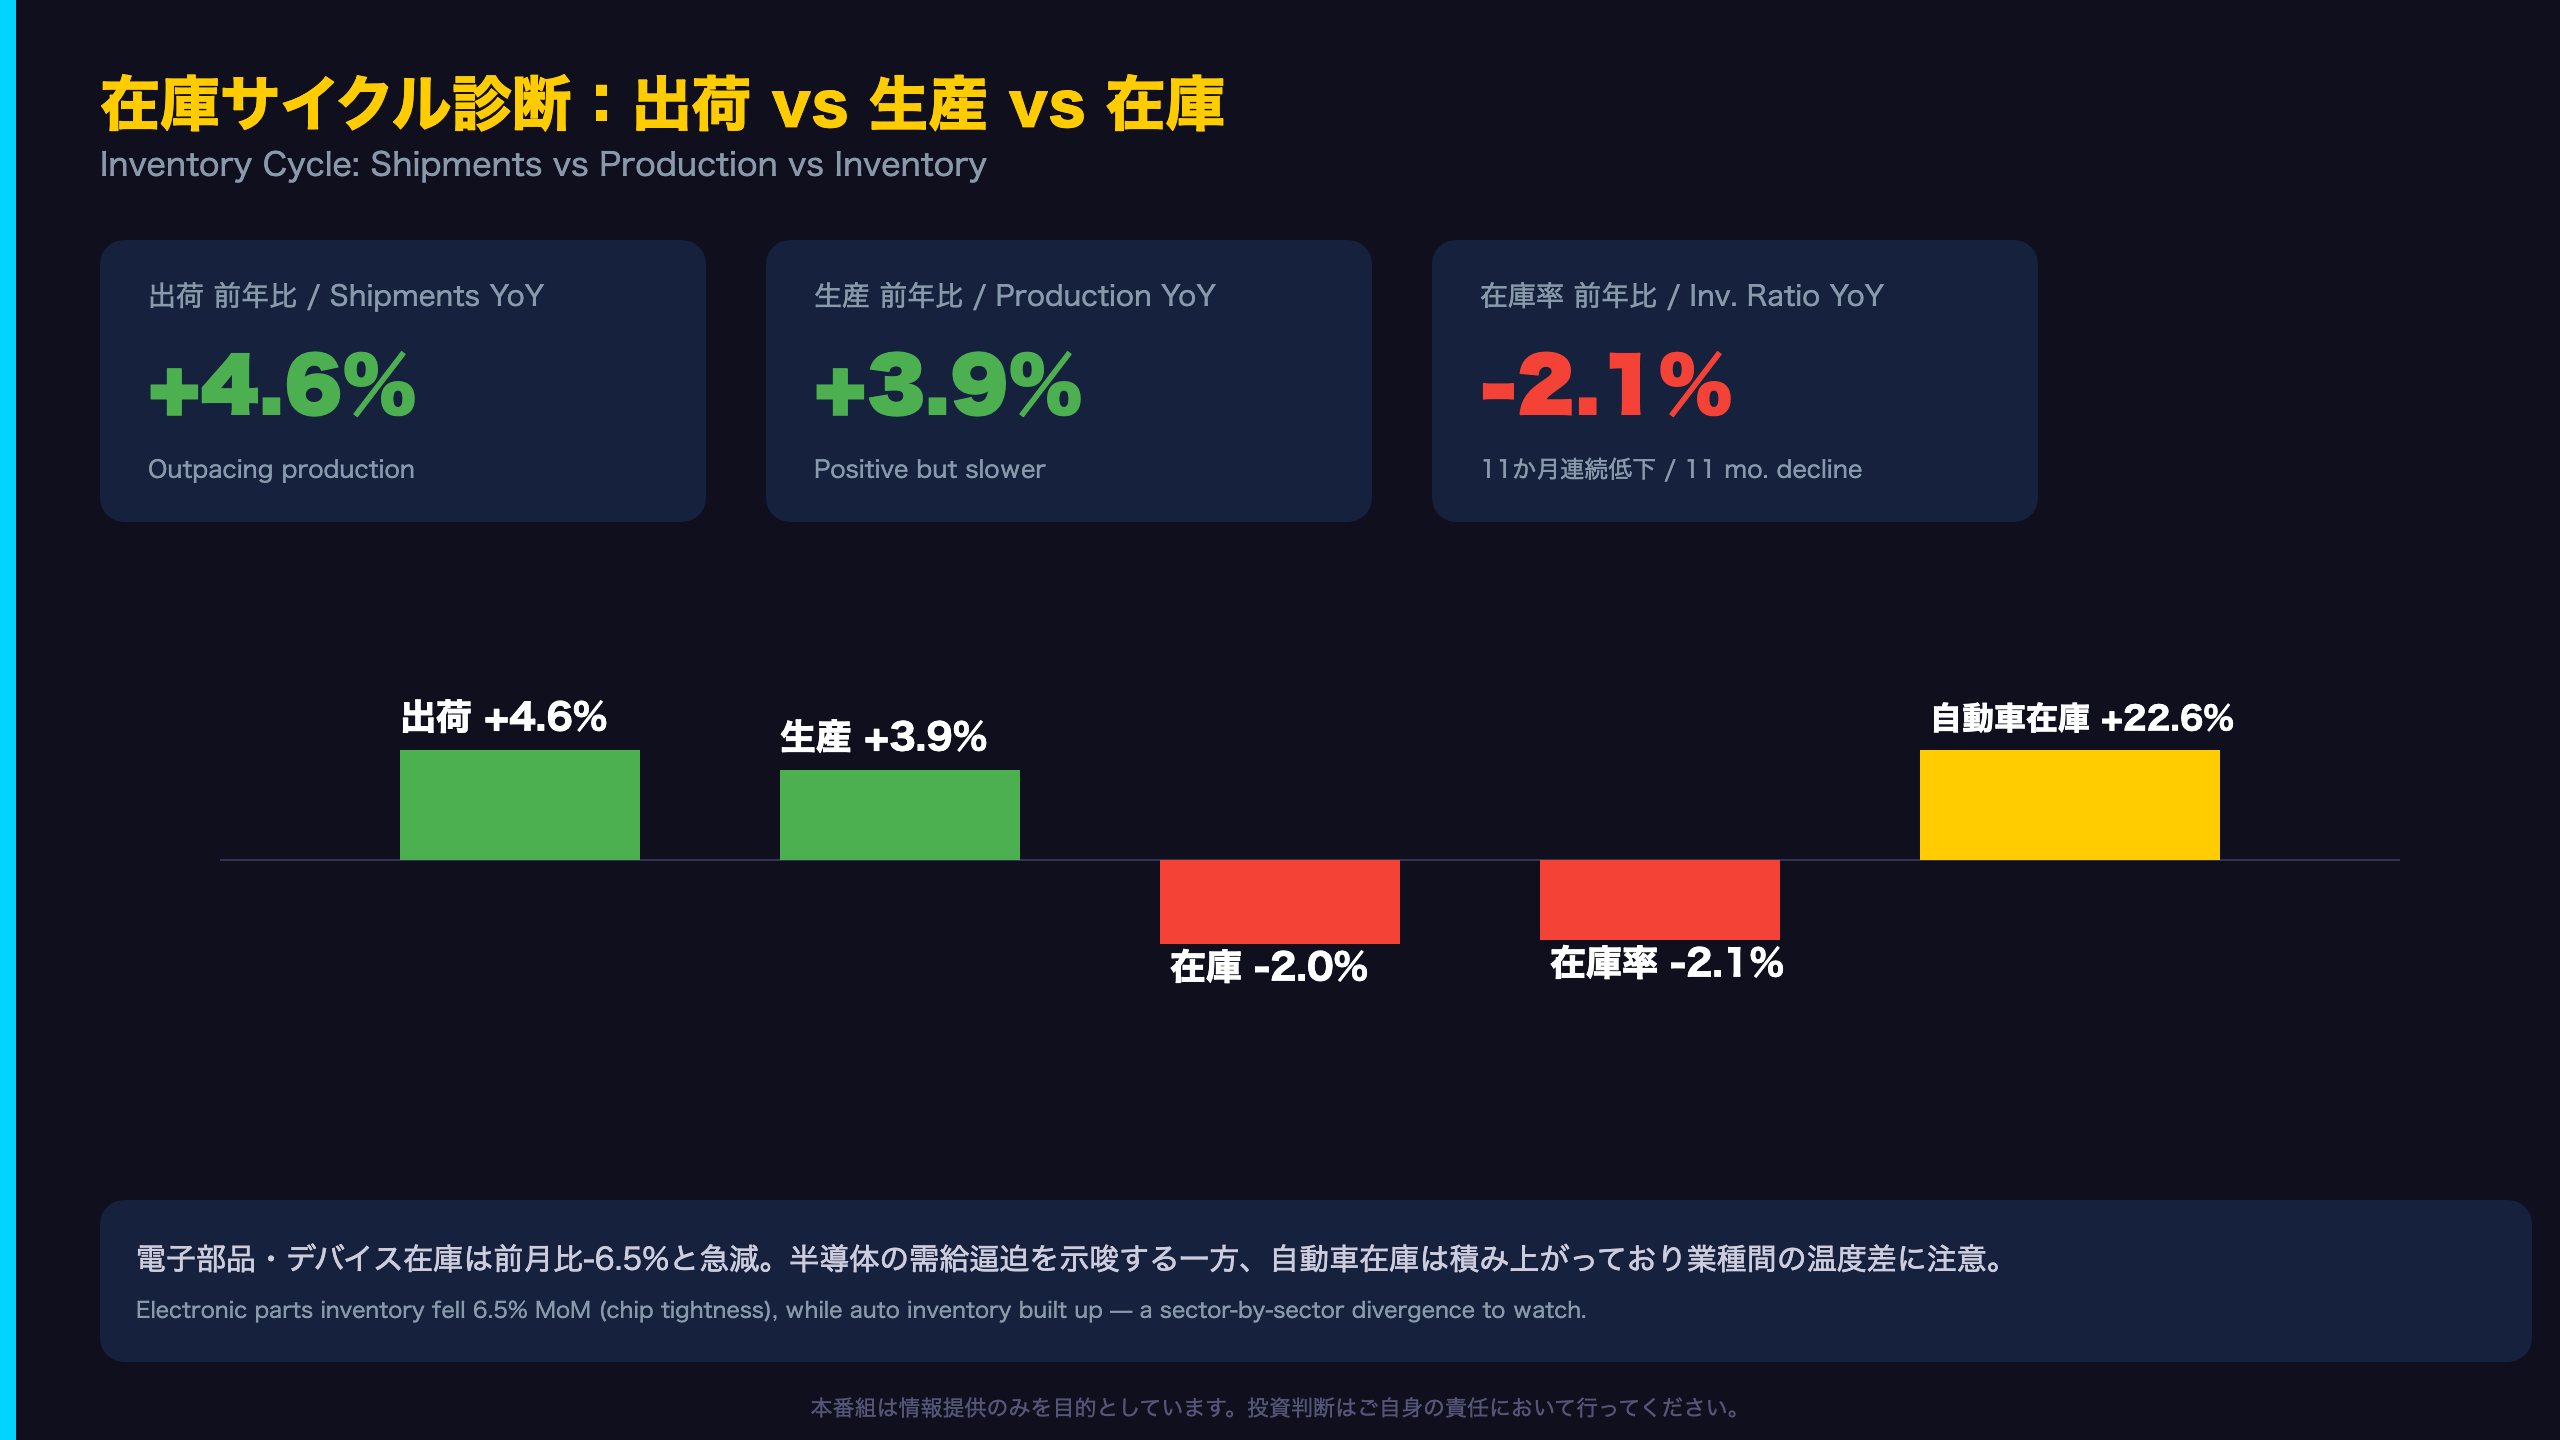
Across all mining and manufacturing, shipments (+4.6% YoY) are outpacing production (+3.9% YoY), while inventories have contracted year over year for 18 consecutive months. In the four-phase inventory cycle framework widely used by Japanese equity strategists, shipments growing faster than production alongside falling inventories typically sits at the boundary between an “unintended inventory drawdown” phase and a genuine “recovery” phase — generally constructive, though not definitive from a single month’s data.
Sector divergence is the key risk to this clean narrative. Electronic parts and devices inventories plunged 6.5% month over month — consistent with tight semiconductor supply-demand. But motor vehicle inventories rose 22.6% year over year, per METI’s detail citing small passenger cars, kei cars, and standard passenger cars. This could reflect either unintended stock buildup from soft sales, or deliberate pre-model-change stocking — the data alone cannot distinguish, so readers should avoid a single conclusion.
The inventory ratio index at 104.5 (down 2.1% YoY, an 11th straight monthly decline) remains well above historical extremes cited in METI’s own footnotes (e.g., 84.6 in February 2018), suggesting today’s drawdown, while persistent, is not yet historically severe.
供給サイドの逆説:生産能力は29か月連続減、稼働率は上昇
What the Capacity-Utilization Divergence Signals
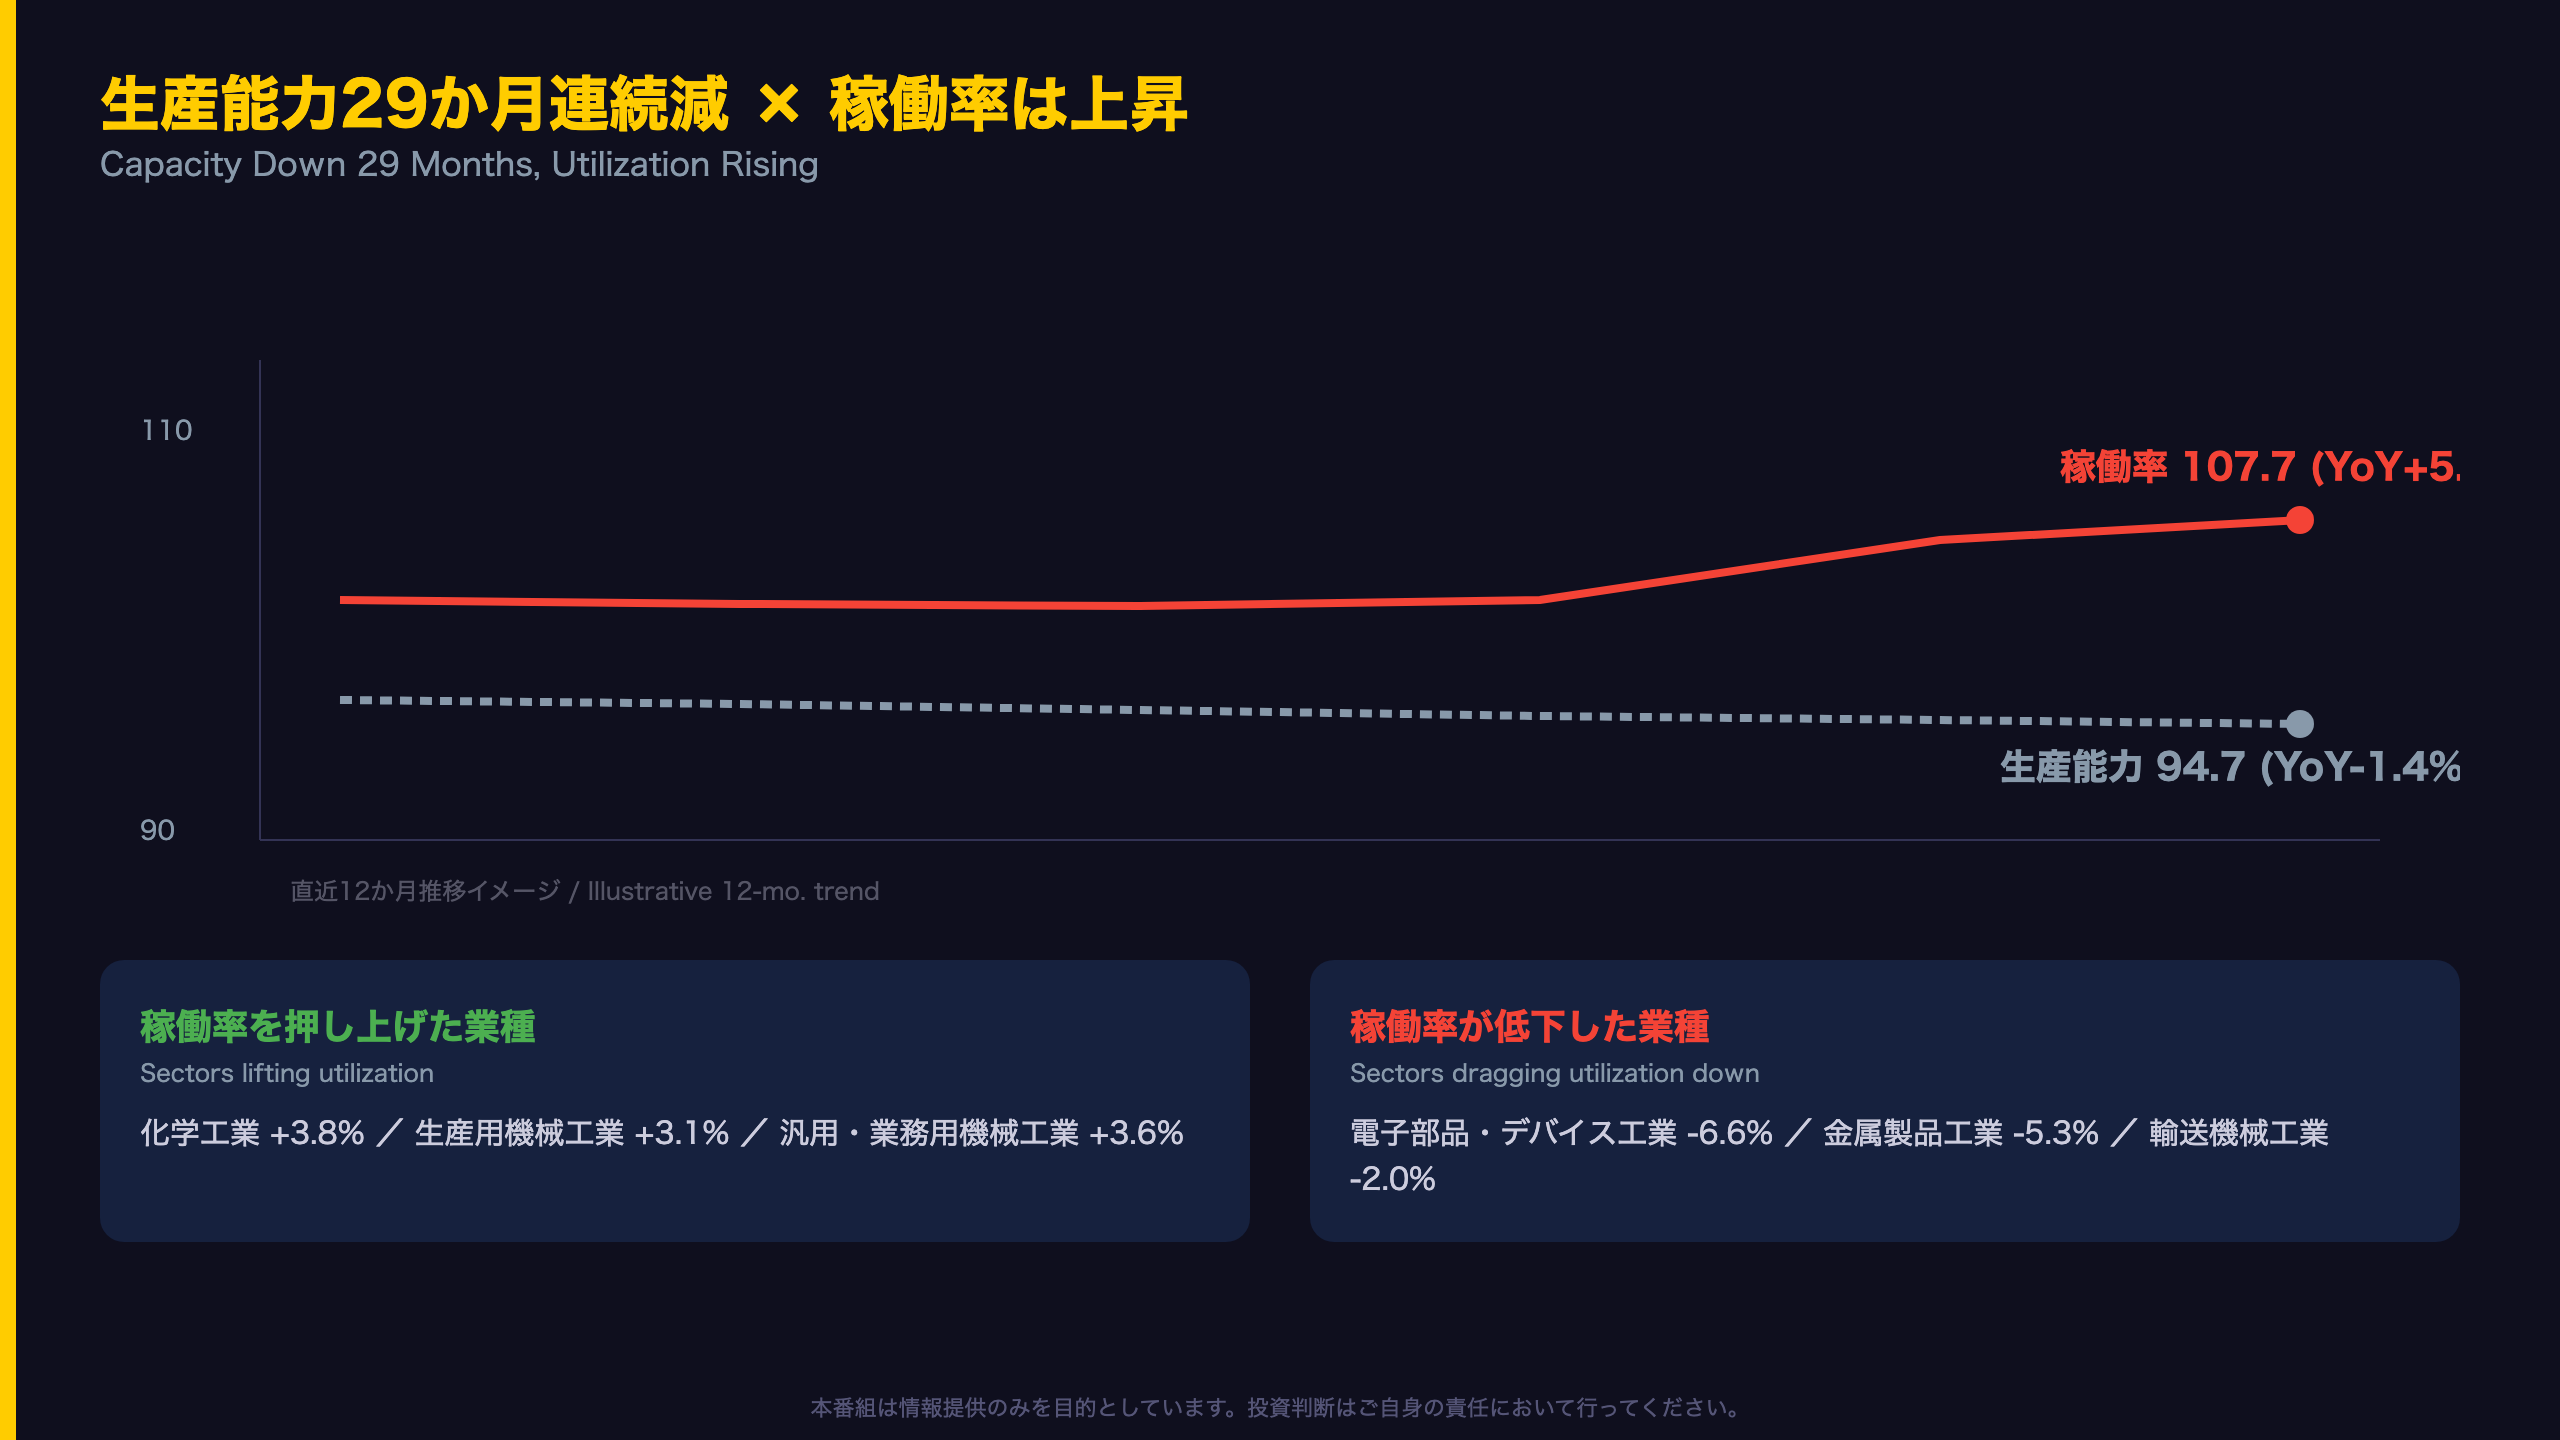
Japan’s production capacity index for manufacturing stands at 94.7, down for a 29th consecutive month year over year — meaning Japanese manufacturers have, for more than two years, prioritized scrapping and replacing aging equipment over net capacity expansion. METI’s report states capacity was flat month over month.
Meanwhile, the operating ratio climbed to 107.7, up 5.4% year over year for a second consecutive month of gains. Shrinking capacity paired with rising utilization is a classic signature of tightening spare capacity. Historically, sustained high utilization eventually becomes the catalyst for a fresh capital-expenditure cycle, as firms are forced to invest simply to keep pace with demand — a dynamic relevant to Japan’s broader capex-driven equity thesis.
Sector split: chemicals (+3.8%), production machinery (+3.1%), and general-purpose/business machinery (+3.6%) all lifted utilization, while electronic parts and devices (-6.6%), transport equipment (-2.0%), and fabricated metals (-5.3%) declined. Equipment-making capacity appears to be running hot even as downstream parts and transport-equipment production still has spare room — a divergence worth tracking by sub-sector.
For the Bank of Japan, a structurally shrinking capacity base alongside rising utilization is a modest, indirect argument for medium-term supply-side price pressure, though not a trigger for near-term policy action on its own.
先行きシグナル:8月反動増、9月反動減、DIは逆転
Reading the “Realization Ratio” and Forecast Revisions
METI’s Survey of Production Forecast includes a “Realization Ratio,” measuring how actual output compared with what firms had projected in the prior survey. July’s realization ratio came in at -1.4%, meaning actual production undershot firms’ own forecasts.
August revised up, September reversing: August production plans were revised up to +6.4% (from +4.5% previously). September plans call for a sharp -4.2% pullback, led by production machinery (-8.0%) and transport equipment (-5.3%). This pattern — a strong August followed by a September giveback — suggests a meaningful share of anticipated August strength may be a temporary rebound rather than a durable acceleration.
Sentiment flipped too: the business sentiment diffusion index fell to -4.4 in August from +4.2 in July, with bullish respondents dropping to 24.2% against 28.6% bearish. However, the DI trend of 0.4 remains above the -5 threshold METI itself flags as historically associated with recession risk, so this is not yet an alarm signal.
The next data point — August’s preliminary release, expected around September 30, 2026 — will show whether the anticipated production-machinery rebound materializes, or whether the September pullback and softer DI mark the start of a genuine slowdown.
Disclaimer: This article is for informational purposes only. All investment decisions are made solely at your own risk.