📺 Watch the Full Video Analysis
This article was automatically generated by the NFC Market Live AI analysis system. (Updated: 2026-09-10 09:01 JST)
Breaking down Japan’s Ministry of Finance weekly international securities flow data. 📊
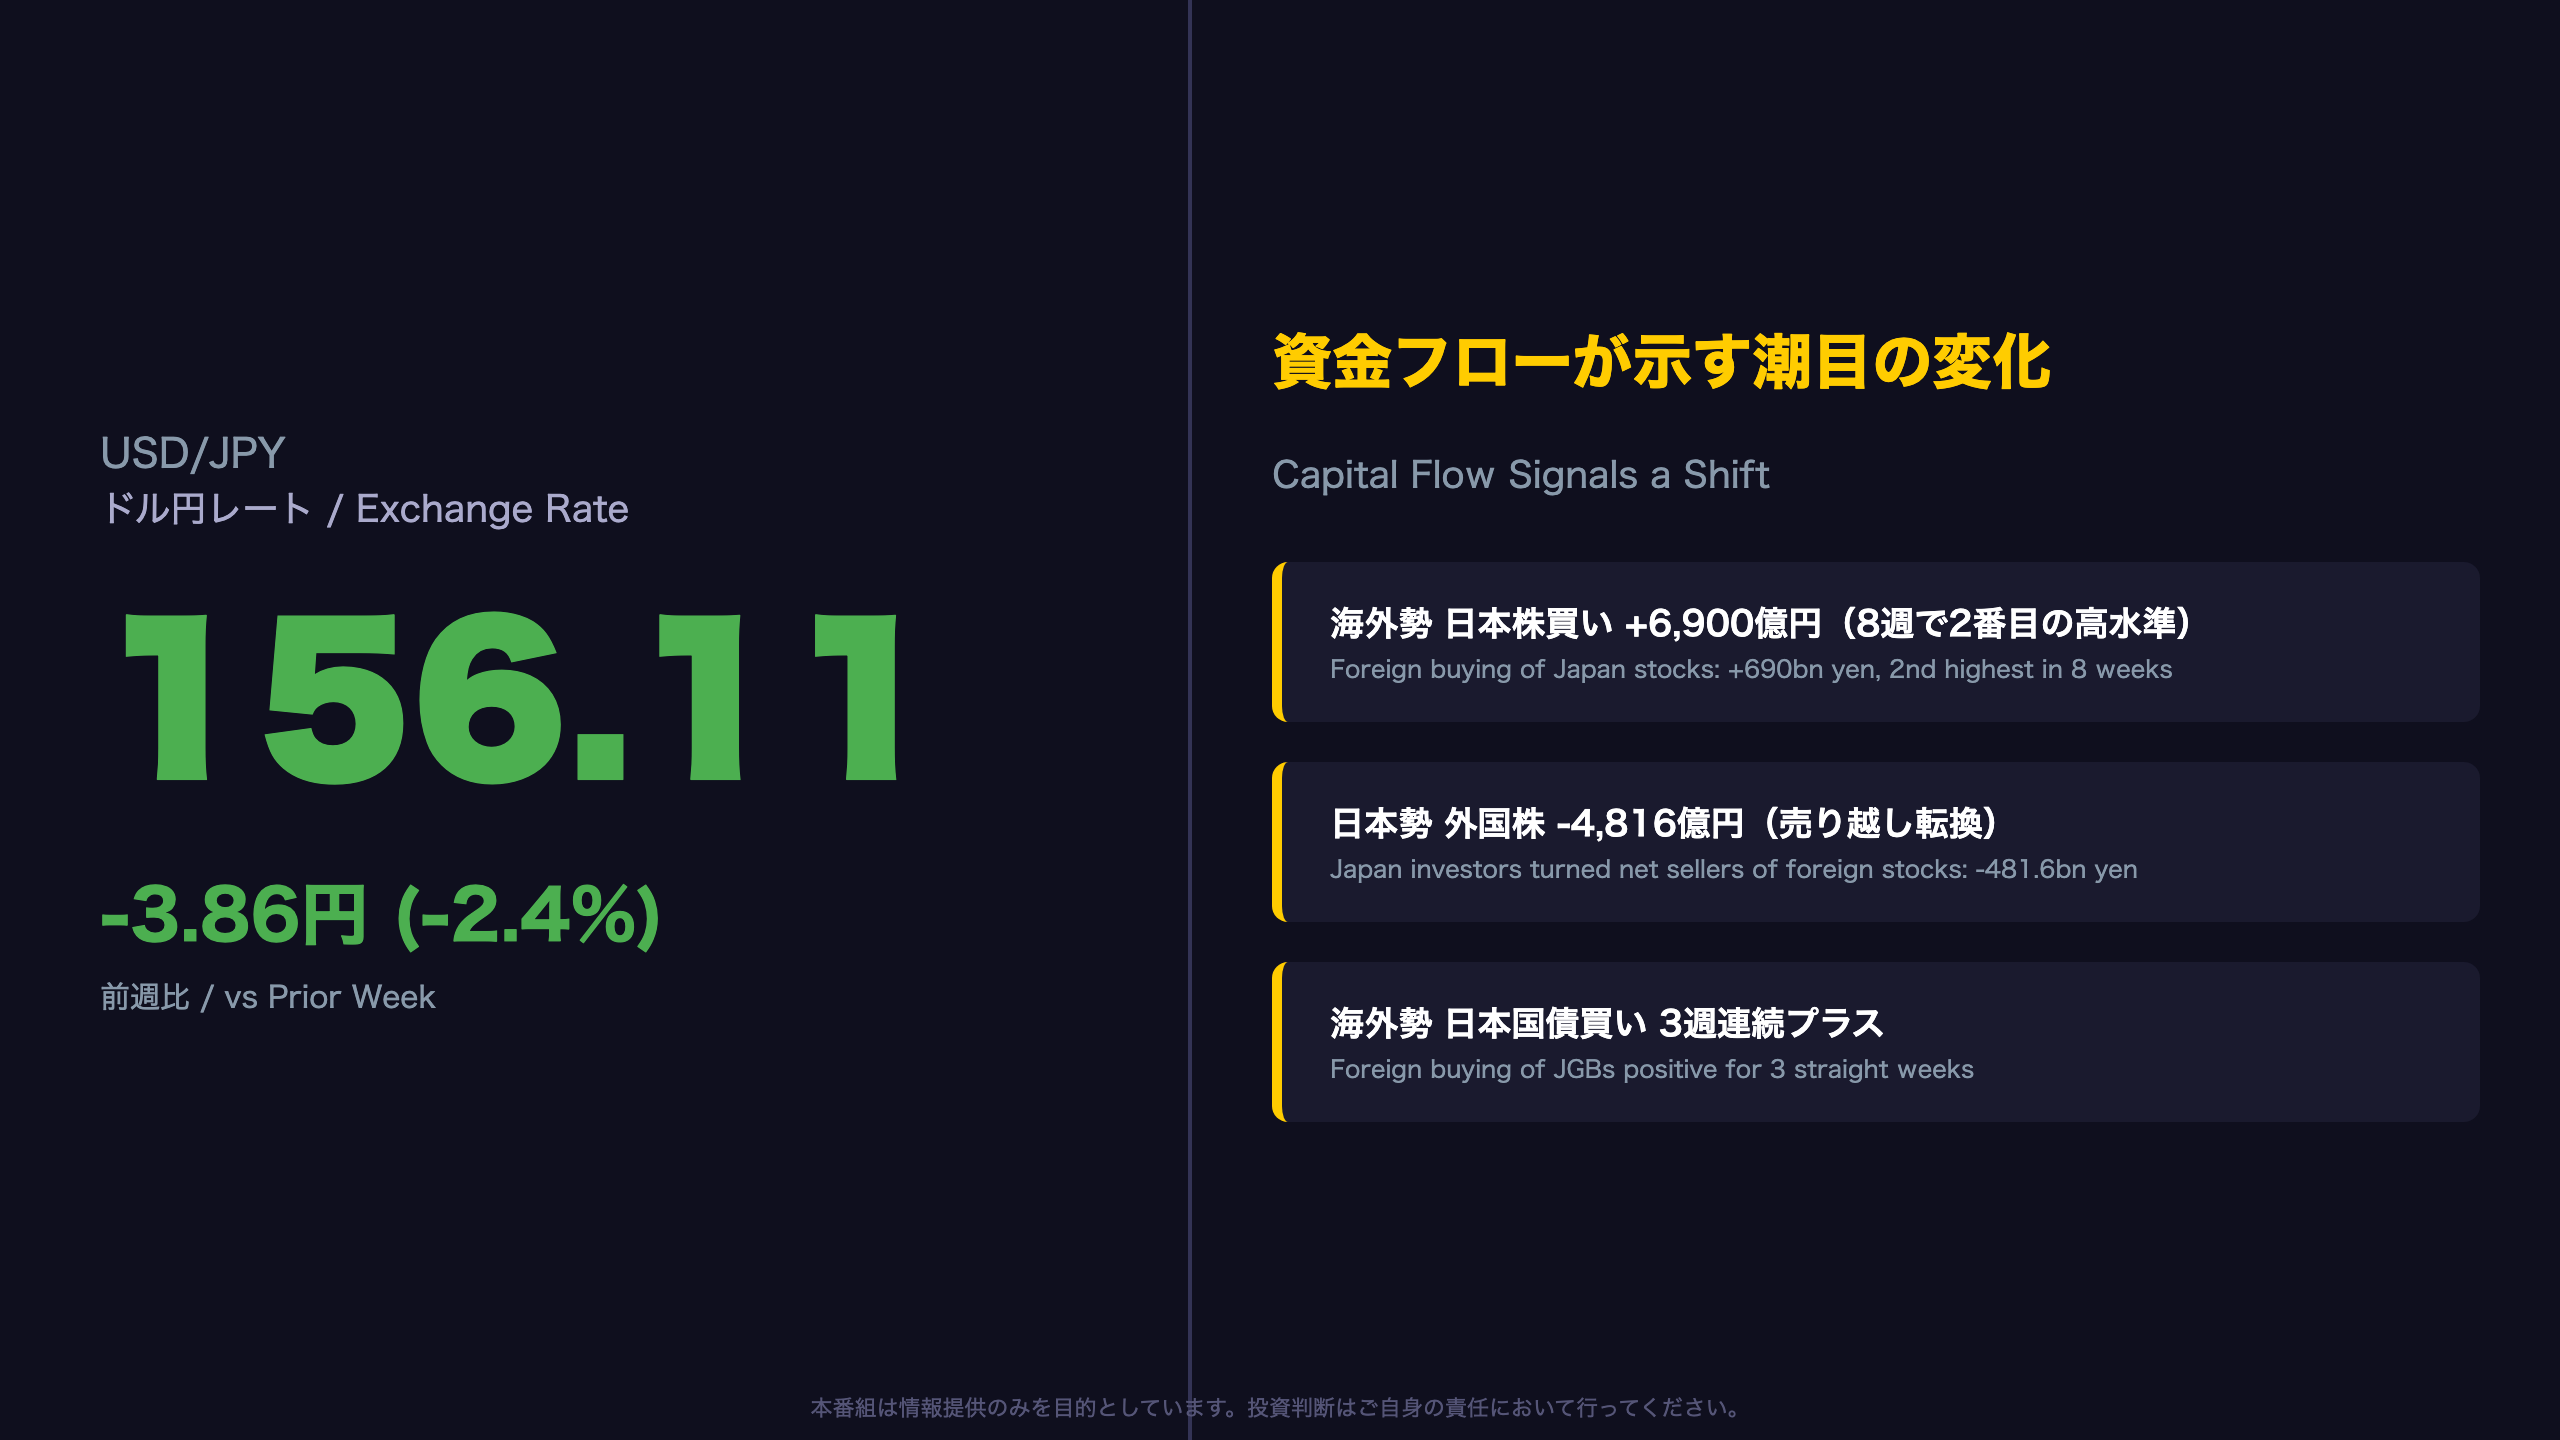
USD/JPY dropped from 159.97 to 156.11 in a single week — a 2.4% move. 📉
Foreign investors bought a net ¥690bn of Japanese stocks (2nd-highest in 8 weeks), and JGB buying stayed positive for a third straight week. 💹
Meanwhile, Japanese investors flipped to net selling foreign stocks (-¥481.6bn), signaling a shift in cross-border demand. ⚠️
It’s too early to call this a structural trend from one week of data. Next release: Sep 17, covering Sep 6-12.
資金フローが示す潮目の変化
Context: Japan’s Weekly International Securities Flow Report
The Ministry of Finance’s weekly report on cross-border securities transactions is Japan’s closest equivalent to the U.S. Treasury International Capital (TIC) data, though it is released weekly rather than monthly, giving traders a faster read on portfolio flows relative to yen moves.
A year of yen depreciation, now reversing
From roughly 146 in September 2025, USD/JPY climbed over 17 yen to a cycle high of 163.71 on July 25, 2026, driven by persistent rate-differential expectations. Since then, the pair has retraced to 156.11 as of September 5 — a 4.6% pullback over eight weeks.
What stands out in the flow data
Foreign investors bought a net JPY 690 billion of Japanese equities in the latest week, the second-largest weekly inflow in two months, while foreign JGB purchases have now been positive for three consecutive weeks (JPY 436.1bn, 509.1bn, and 449.6bn). Meanwhile, Japanese investors flipped to net sellers of foreign equities (-JPY 481.6bn), a reversal from the aggressive buying seen in early August.
Market implication: A simultaneous foreign bid for Japanese assets and reduced Japanese outbound investment is consistent with, though not proof of, the kind of flow rebalancing that can support the yen. Investors should watch whether this pattern persists beyond a single data point before drawing firm conclusions.
最新週のヘッドライン数字
Breaking Down the Weekly Headline Numbers
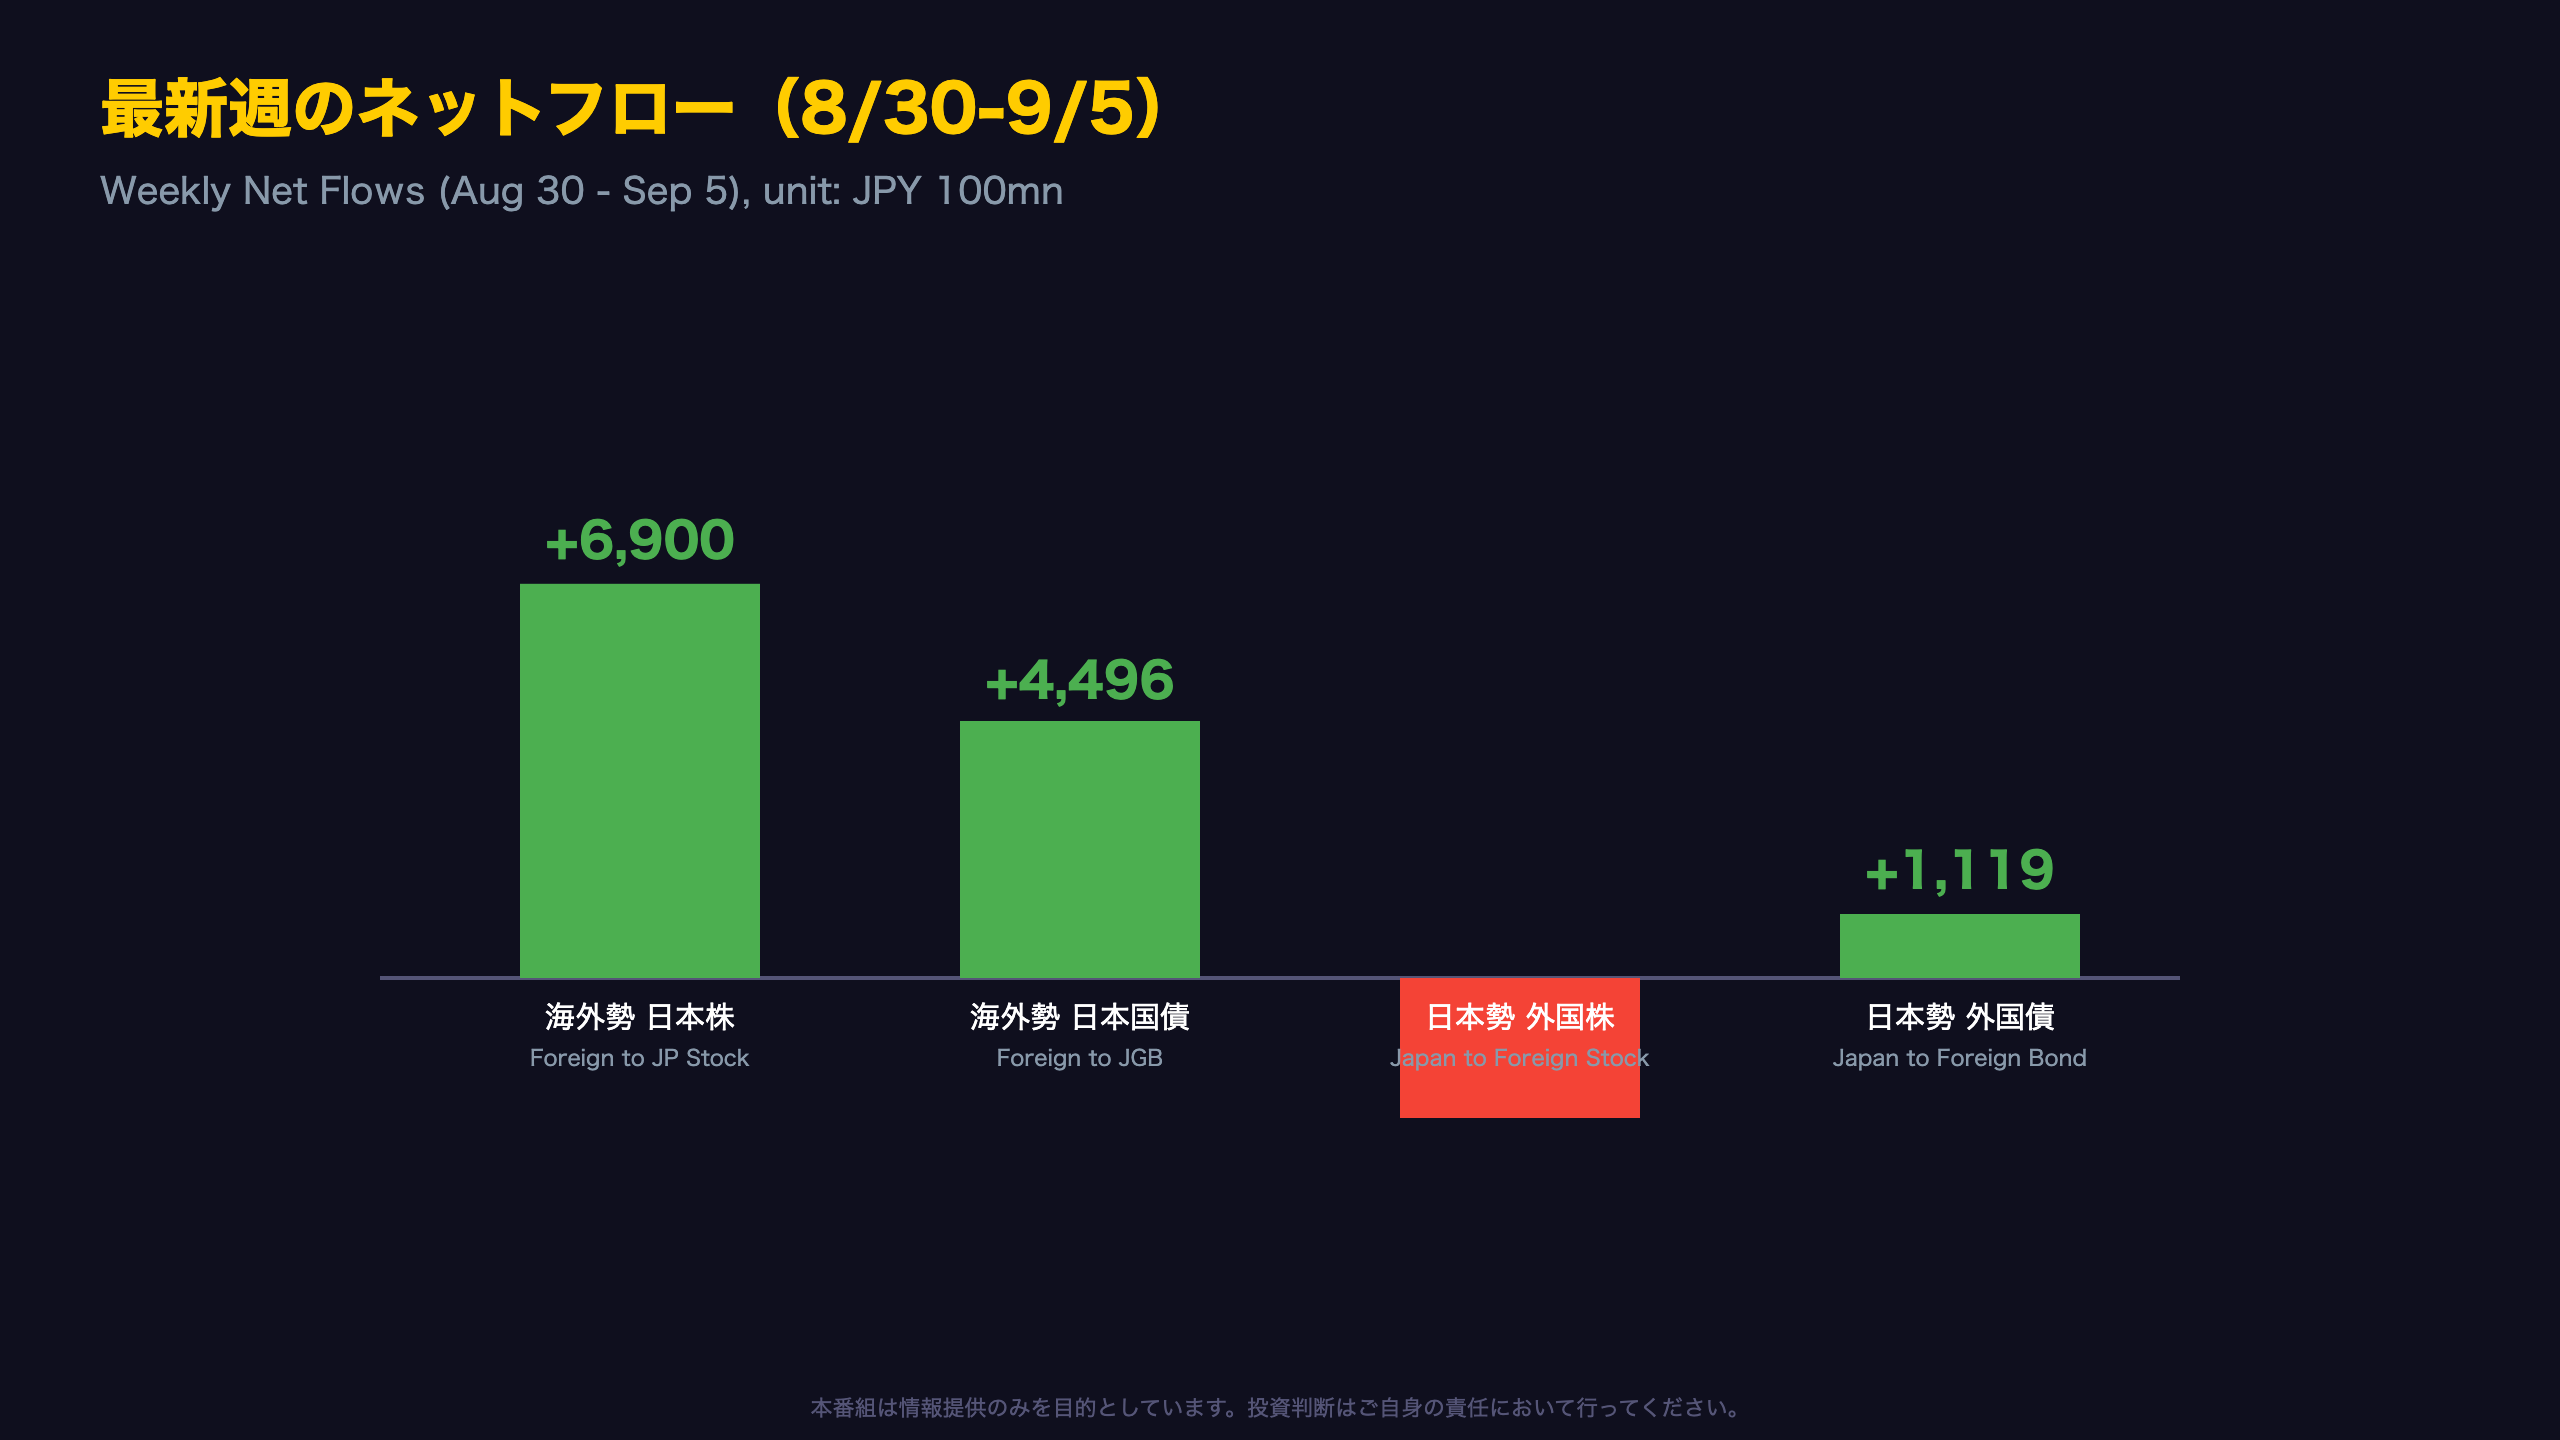
For the week of August 30 to September 5, all four flow categories showed clear directional signals: inbound flows (foreign investors into Japan) were positive for both equities and bonds, while outbound flows (Japanese investors abroad) were negative for equities but modestly positive for bonds.
The numbers at a glance
- Foreign → Japan equities: +JPY 690bn (buy)
- Foreign → JGBs: +JPY 449.6bn (buy)
- Japan → Foreign equities: -JPY 481.6bn (sell)
- Japan → Foreign bonds: +JPY 111.9bn (buy)
The fact that inbound equity buying exceeded inbound bond buying may hint that foreign investors are drawn not just to yield but also to Japanese equity valuations and ongoing corporate governance reforms, though this remains a single-week observation that requires confirmation over subsequent releases.
For context: Japan’s weekly securities flow data is watched closely by FX desks because, unlike the monthly U.S. TIC report, it offers a near real-time gauge of portfolio rebalancing pressure on the yen. A divergence like this week’s — inbound buying paired with outbound equity selling — is the kind of pattern that has historically preceded short-term yen strength, though causality is difficult to prove from flow data alone.
ドル円急落の背景:8週間の資金フローとの関係
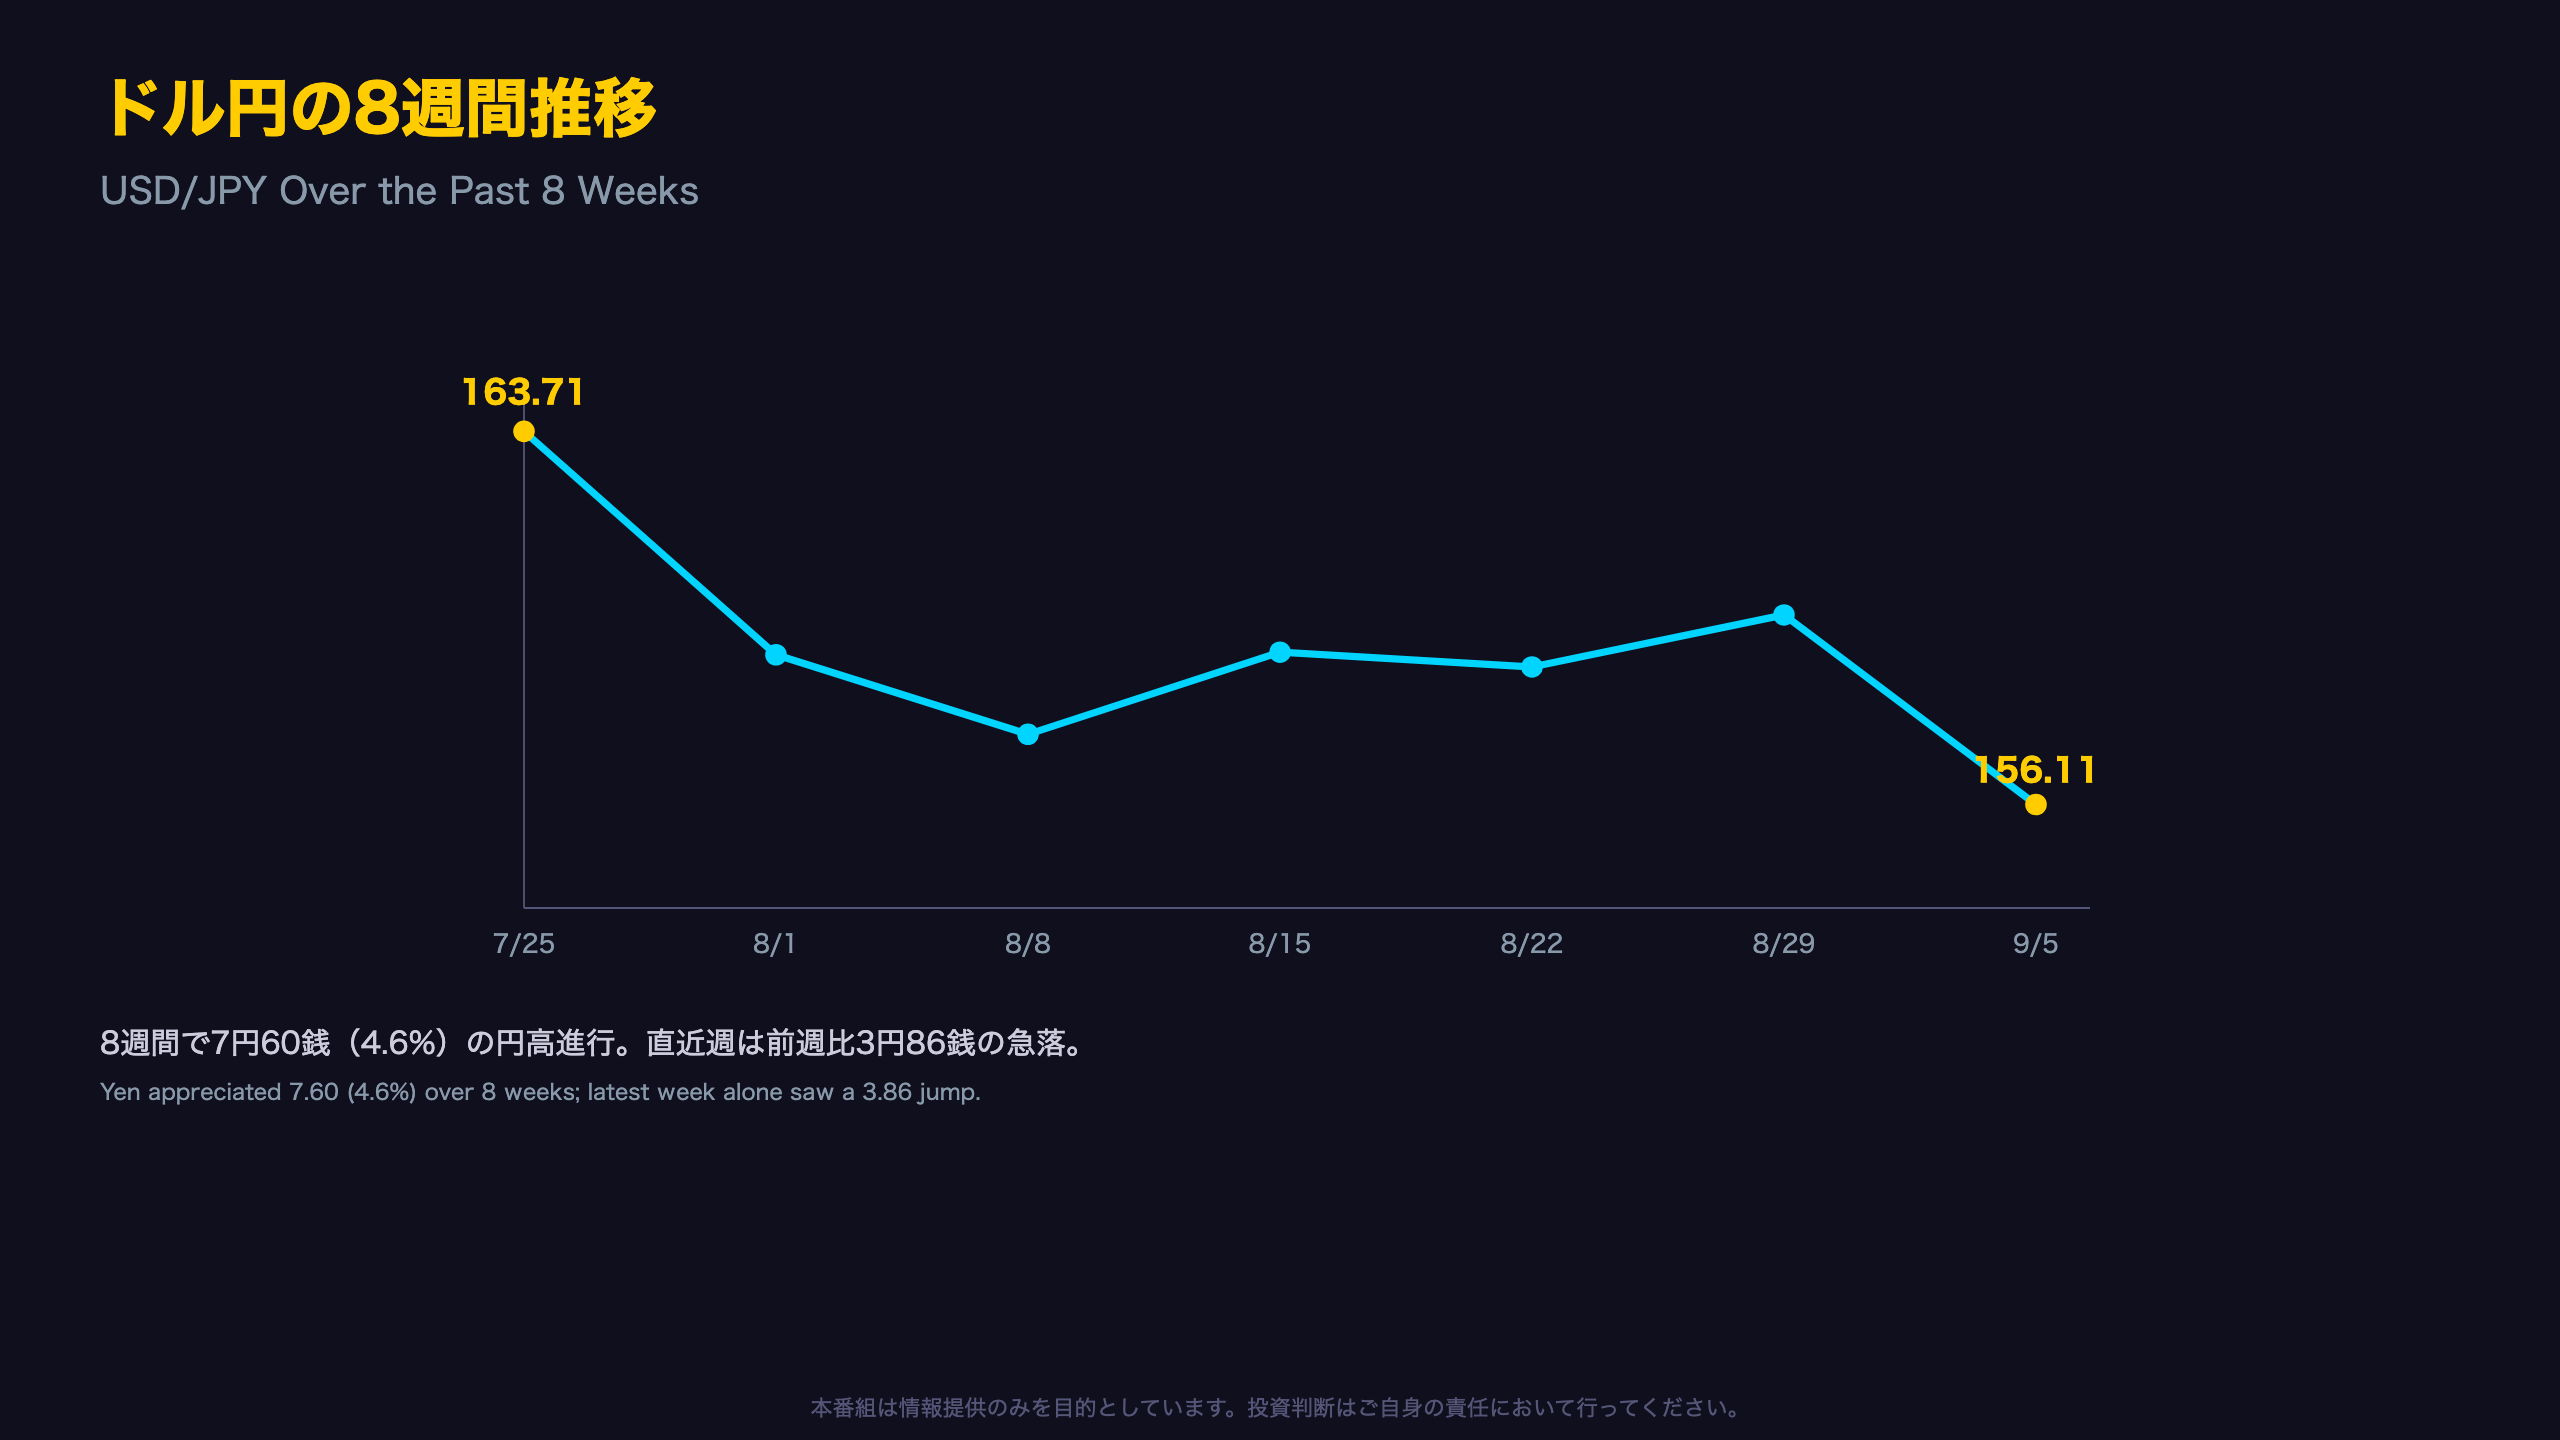
Cross-Referencing Yen Moves with Combined Flows
Combining equity and bond flows into a single “inbound” (foreign into Japan) and “outbound” (Japan into foreign) figure for each week reveals a nuanced relationship with the exchange rate.
| Week | USD/JPY | Inbound | Outbound |
|---|---|---|---|
| Jul 25 | 163.71 | -¥601.7bn | -¥521.0bn |
| Aug 1 | 159.16 | +¥166.4bn | +¥201.5bn |
| Aug 8 | 157.54 | -¥425.0bn | +¥2,468.2bn |
| Aug 15 | 159.21 | -¥627.5bn | +¥2,528.5bn |
| Aug 22 | 158.91 | -¥327.3bn | -¥2,838.5bn |
| Aug 29 | 159.97 | +¥544.9bn | -¥788.2bn |
| Sep 5 | 156.11 | +¥1,139.6bn | -¥369.7bn |
The latest week saw the largest inbound flow of the eight-week window paired with a shrinking outbound flow, a combination that coincided with the sharpest weekly yen appreciation in the sample.
Caveat for international readers: unlike the well-known correlation between U.S. Treasury yields and the dollar index, yen flow-price relationships are noisier because Japan’s life insurers and pension funds rebalance foreign exposure on fiscal-year and calendar-quarter cycles, not purely FX-driven timing. Weeks like Aug 8 and Aug 15, where large outbound flows coincided with yen strength, show that flow direction alone cannot reliably predict FX moves without accounting for interest rate differentials and risk sentiment.
日本勢の対外証券投資:高いボラティリティ
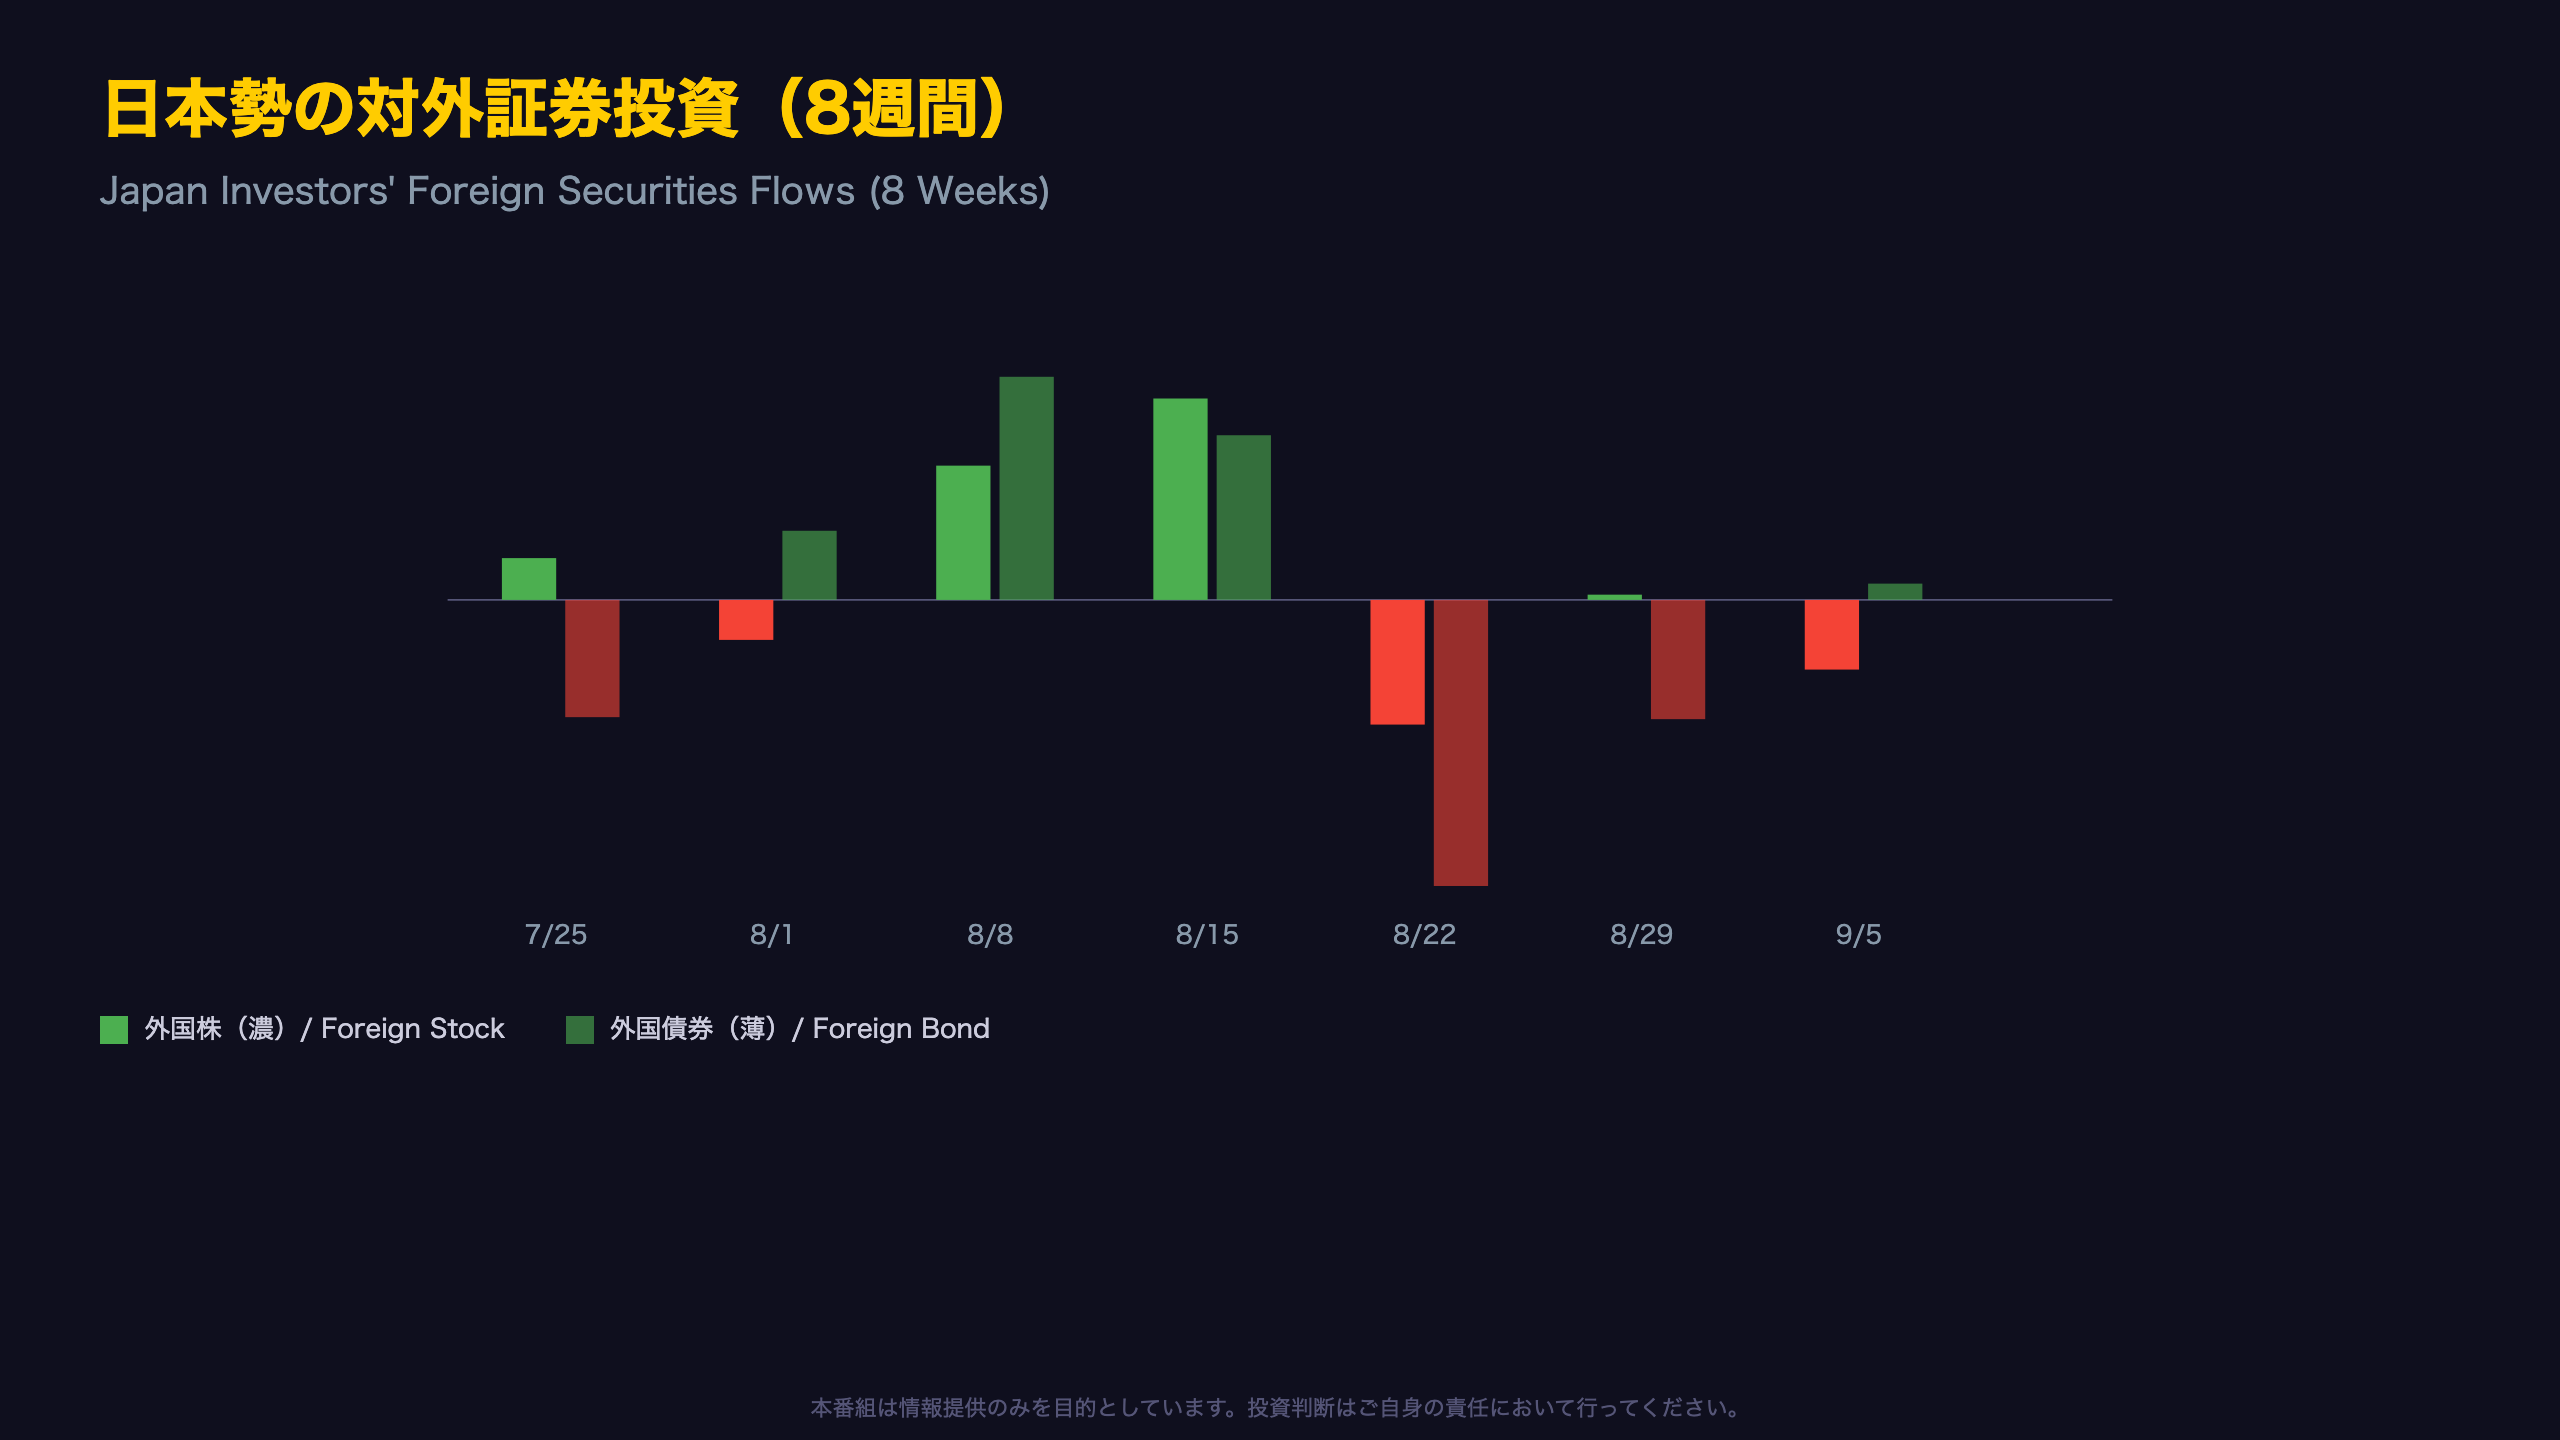
Why Japanese Institutional Flows Swing So Widely
Japanese life insurers, pension funds, and banks, the dominant players behind these outbound flow categories, rebalance foreign holdings around fiscal quarter-ends, respond to shifts in FX hedging costs, and adjust duration exposure as foreign yields move. This structural behavior explains why the data is noisier than, say, monthly U.S. mutual fund flow reports.
The scale of the swing
Foreign equity flows ranged from a JPY 1.39 trillion net purchase (Aug 15) to an JPY 861.7 billion net sale (Aug 22), a swing exceeding JPY 2 trillion in a single week’s difference. Foreign bond flows were even larger: from a JPY 1.54 trillion purchase (Aug 8) to a JPY 1.98 trillion sale (Aug 22), a swing above JPY 3 trillion.
Bull case: The late-August reversal into net selling could mark the start of a genuine repatriation cycle, as Japanese investors lock in FX gains after months of yen weakness.
Bear case: The subsequent week (Sep 5) saw foreign bond flows return to a modest JPY 111.9 billion purchase, suggesting the late-August selling was a one-off quarter-end adjustment rather than a durable shift. Equity outflows, however, persisted (-JPY 481.6bn), so the picture across asset classes is not yet uniform.
海外勢の対内証券投資:日本国債への安定した資金流入
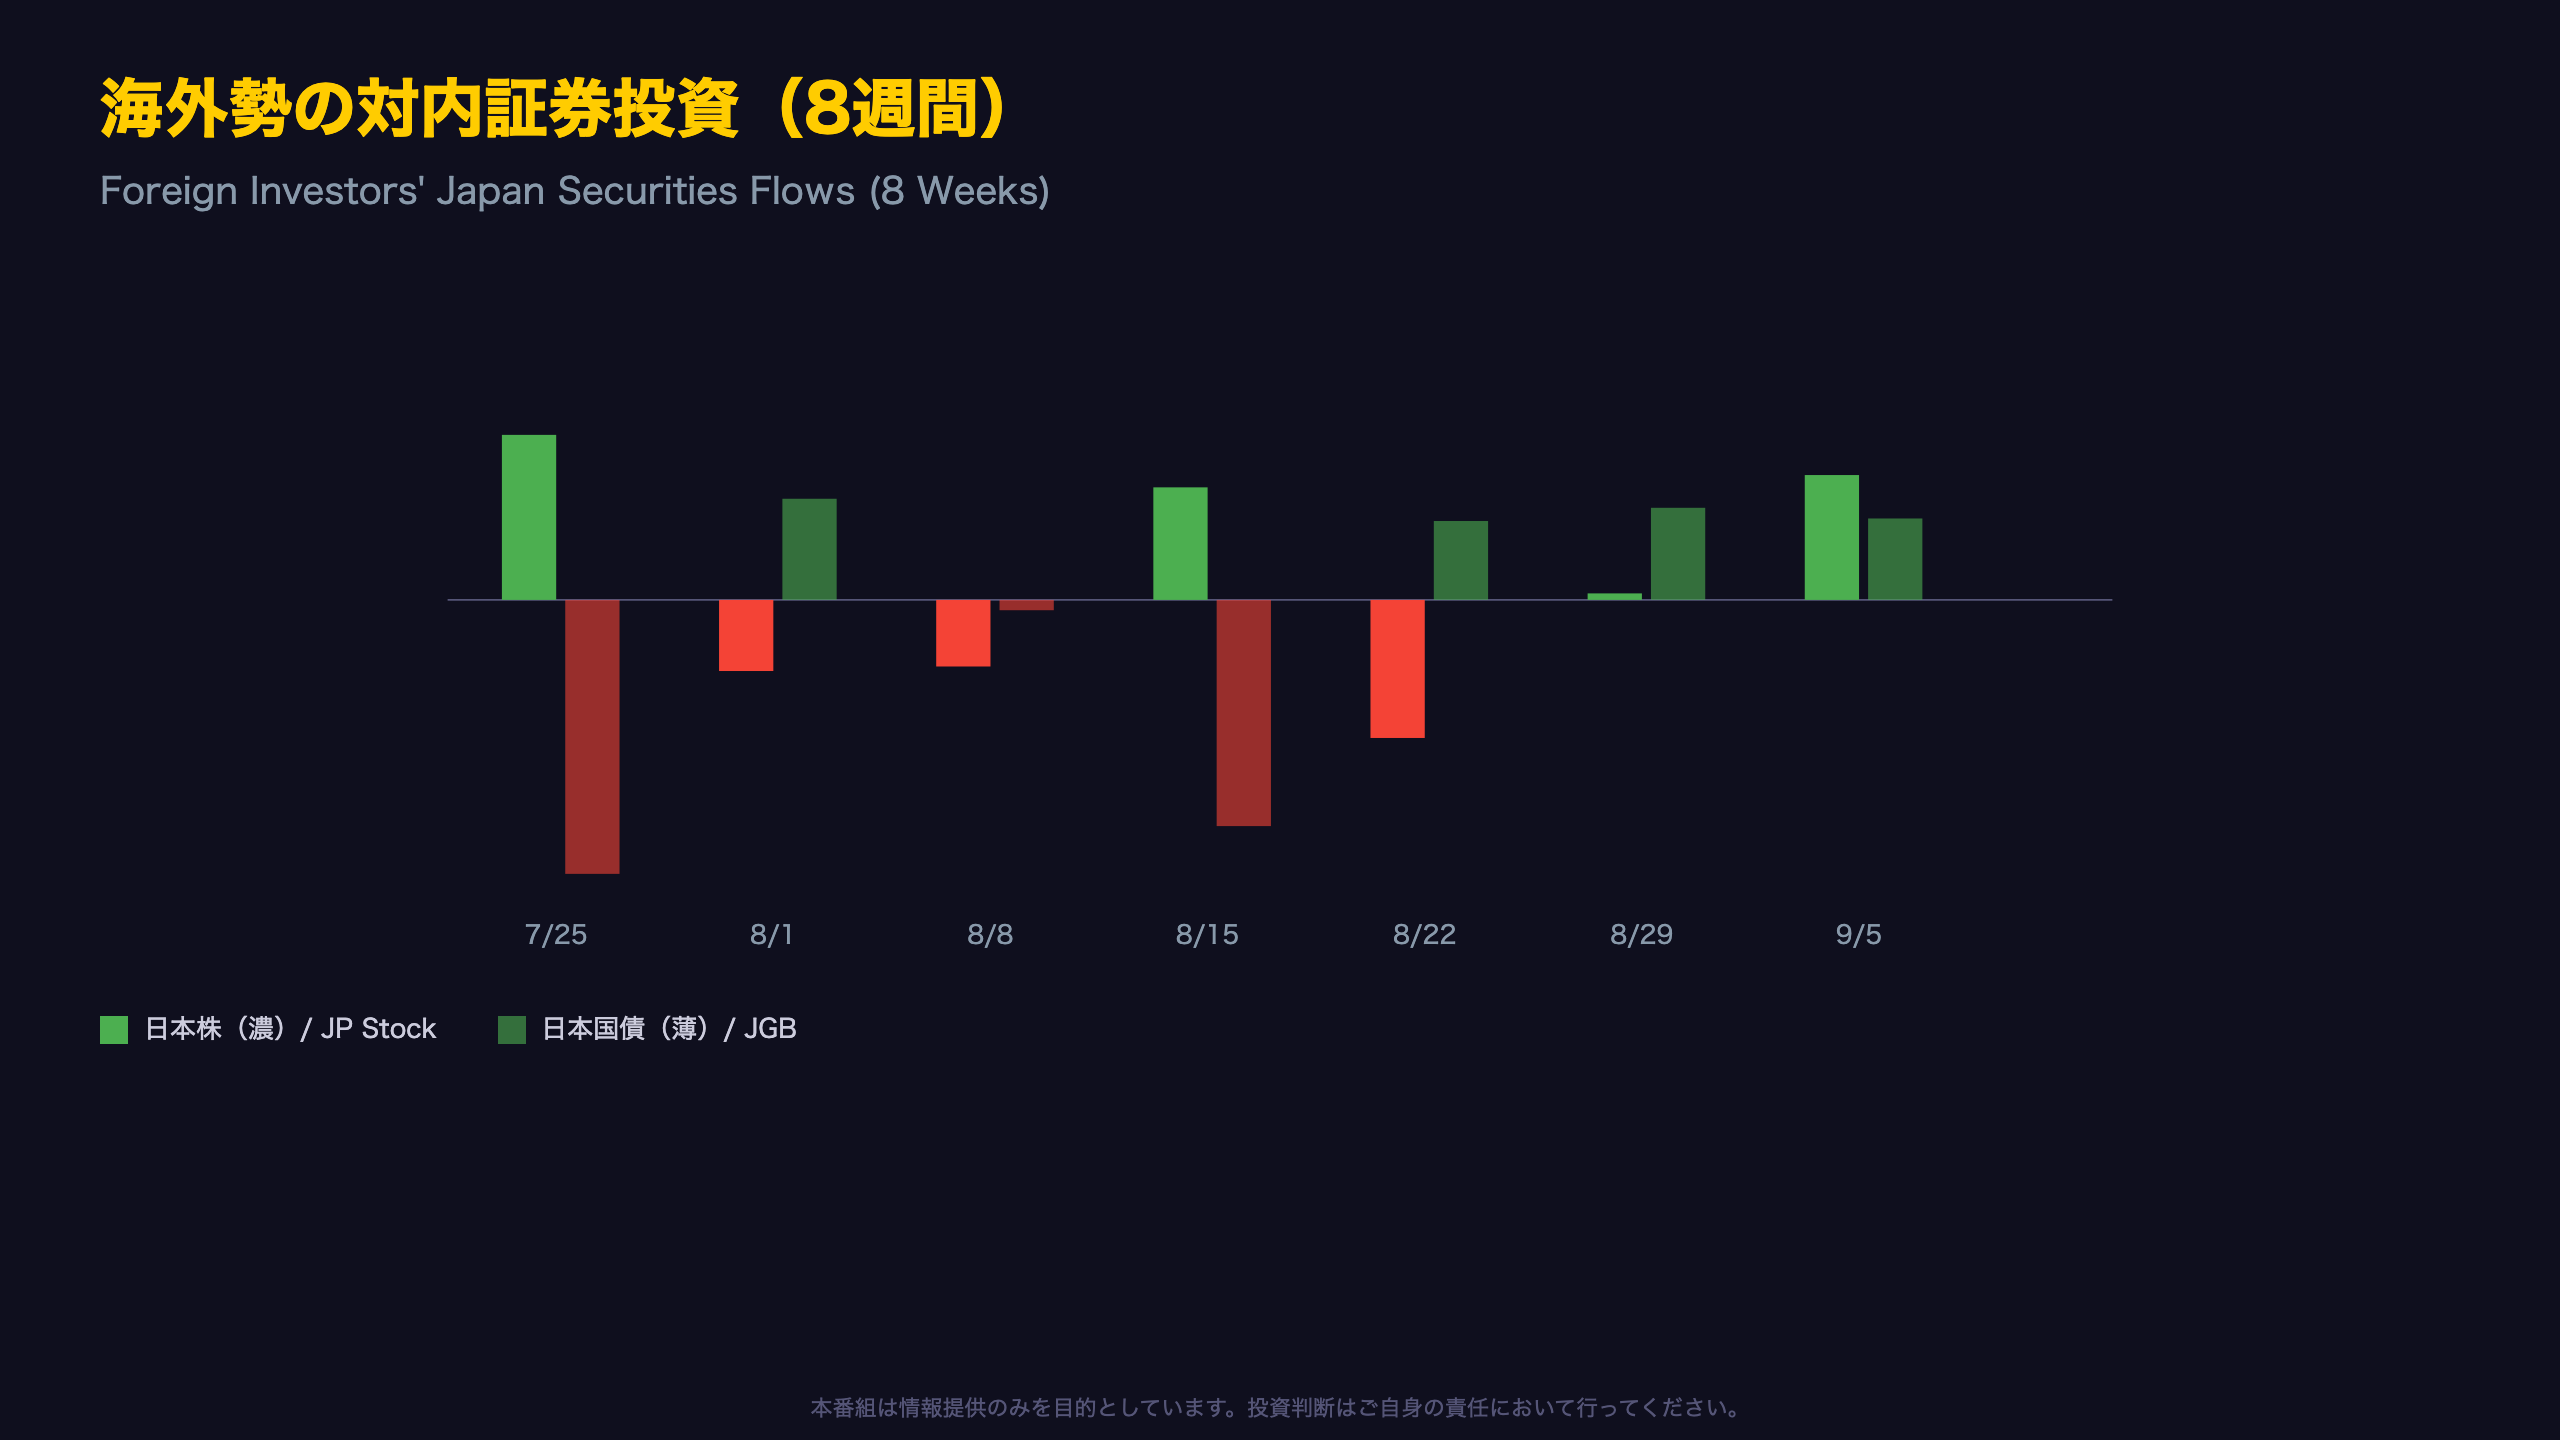
Stability vs. Volatility in Foreign Flows
Comparing foreign investment in Japanese equities versus JGBs over the same eight-week window reveals a clear divergence in behavior.
Equities: high volatility
The weekly sequence, +JPY 912.4bn (Jul 25), -392.5bn (Aug 1), -368.4bn (Aug 8), +622.4bn (Aug 15), -763.4bn (Aug 22), +35.8bn (Aug 29), +690bn (Sep 5), flips sign five times in seven weeks, indicating no consistent directional conviction among foreign equity investors.
JGBs: three weeks of directional consistency
Foreign JGB purchases, by contrast, have been positive for three consecutive weeks: +JPY 436.1bn, +509.1bn, and +449.6bn (Aug 22 through Sep 5). Both the direction and the magnitude have been notably stable.
What this could mean: This pattern is consistent with, though not conclusive proof of, sustained foreign demand for Japanese government debt, potentially reflecting views on the BOJ’s policy stance or relative yield attractiveness versus other developed markets. For comparison, foreign demand for U.S. Treasuries has also been a focus for global investors amid Fed policy uncertainty, making Japan’s steady JGB inflows a relevant data point in the broader global rates picture.
Caveat: three weeks is a short sample. Confirming a durable trend would require several more weeks of consistent inflows.
総括:強さと留意点、そして次回への焦点
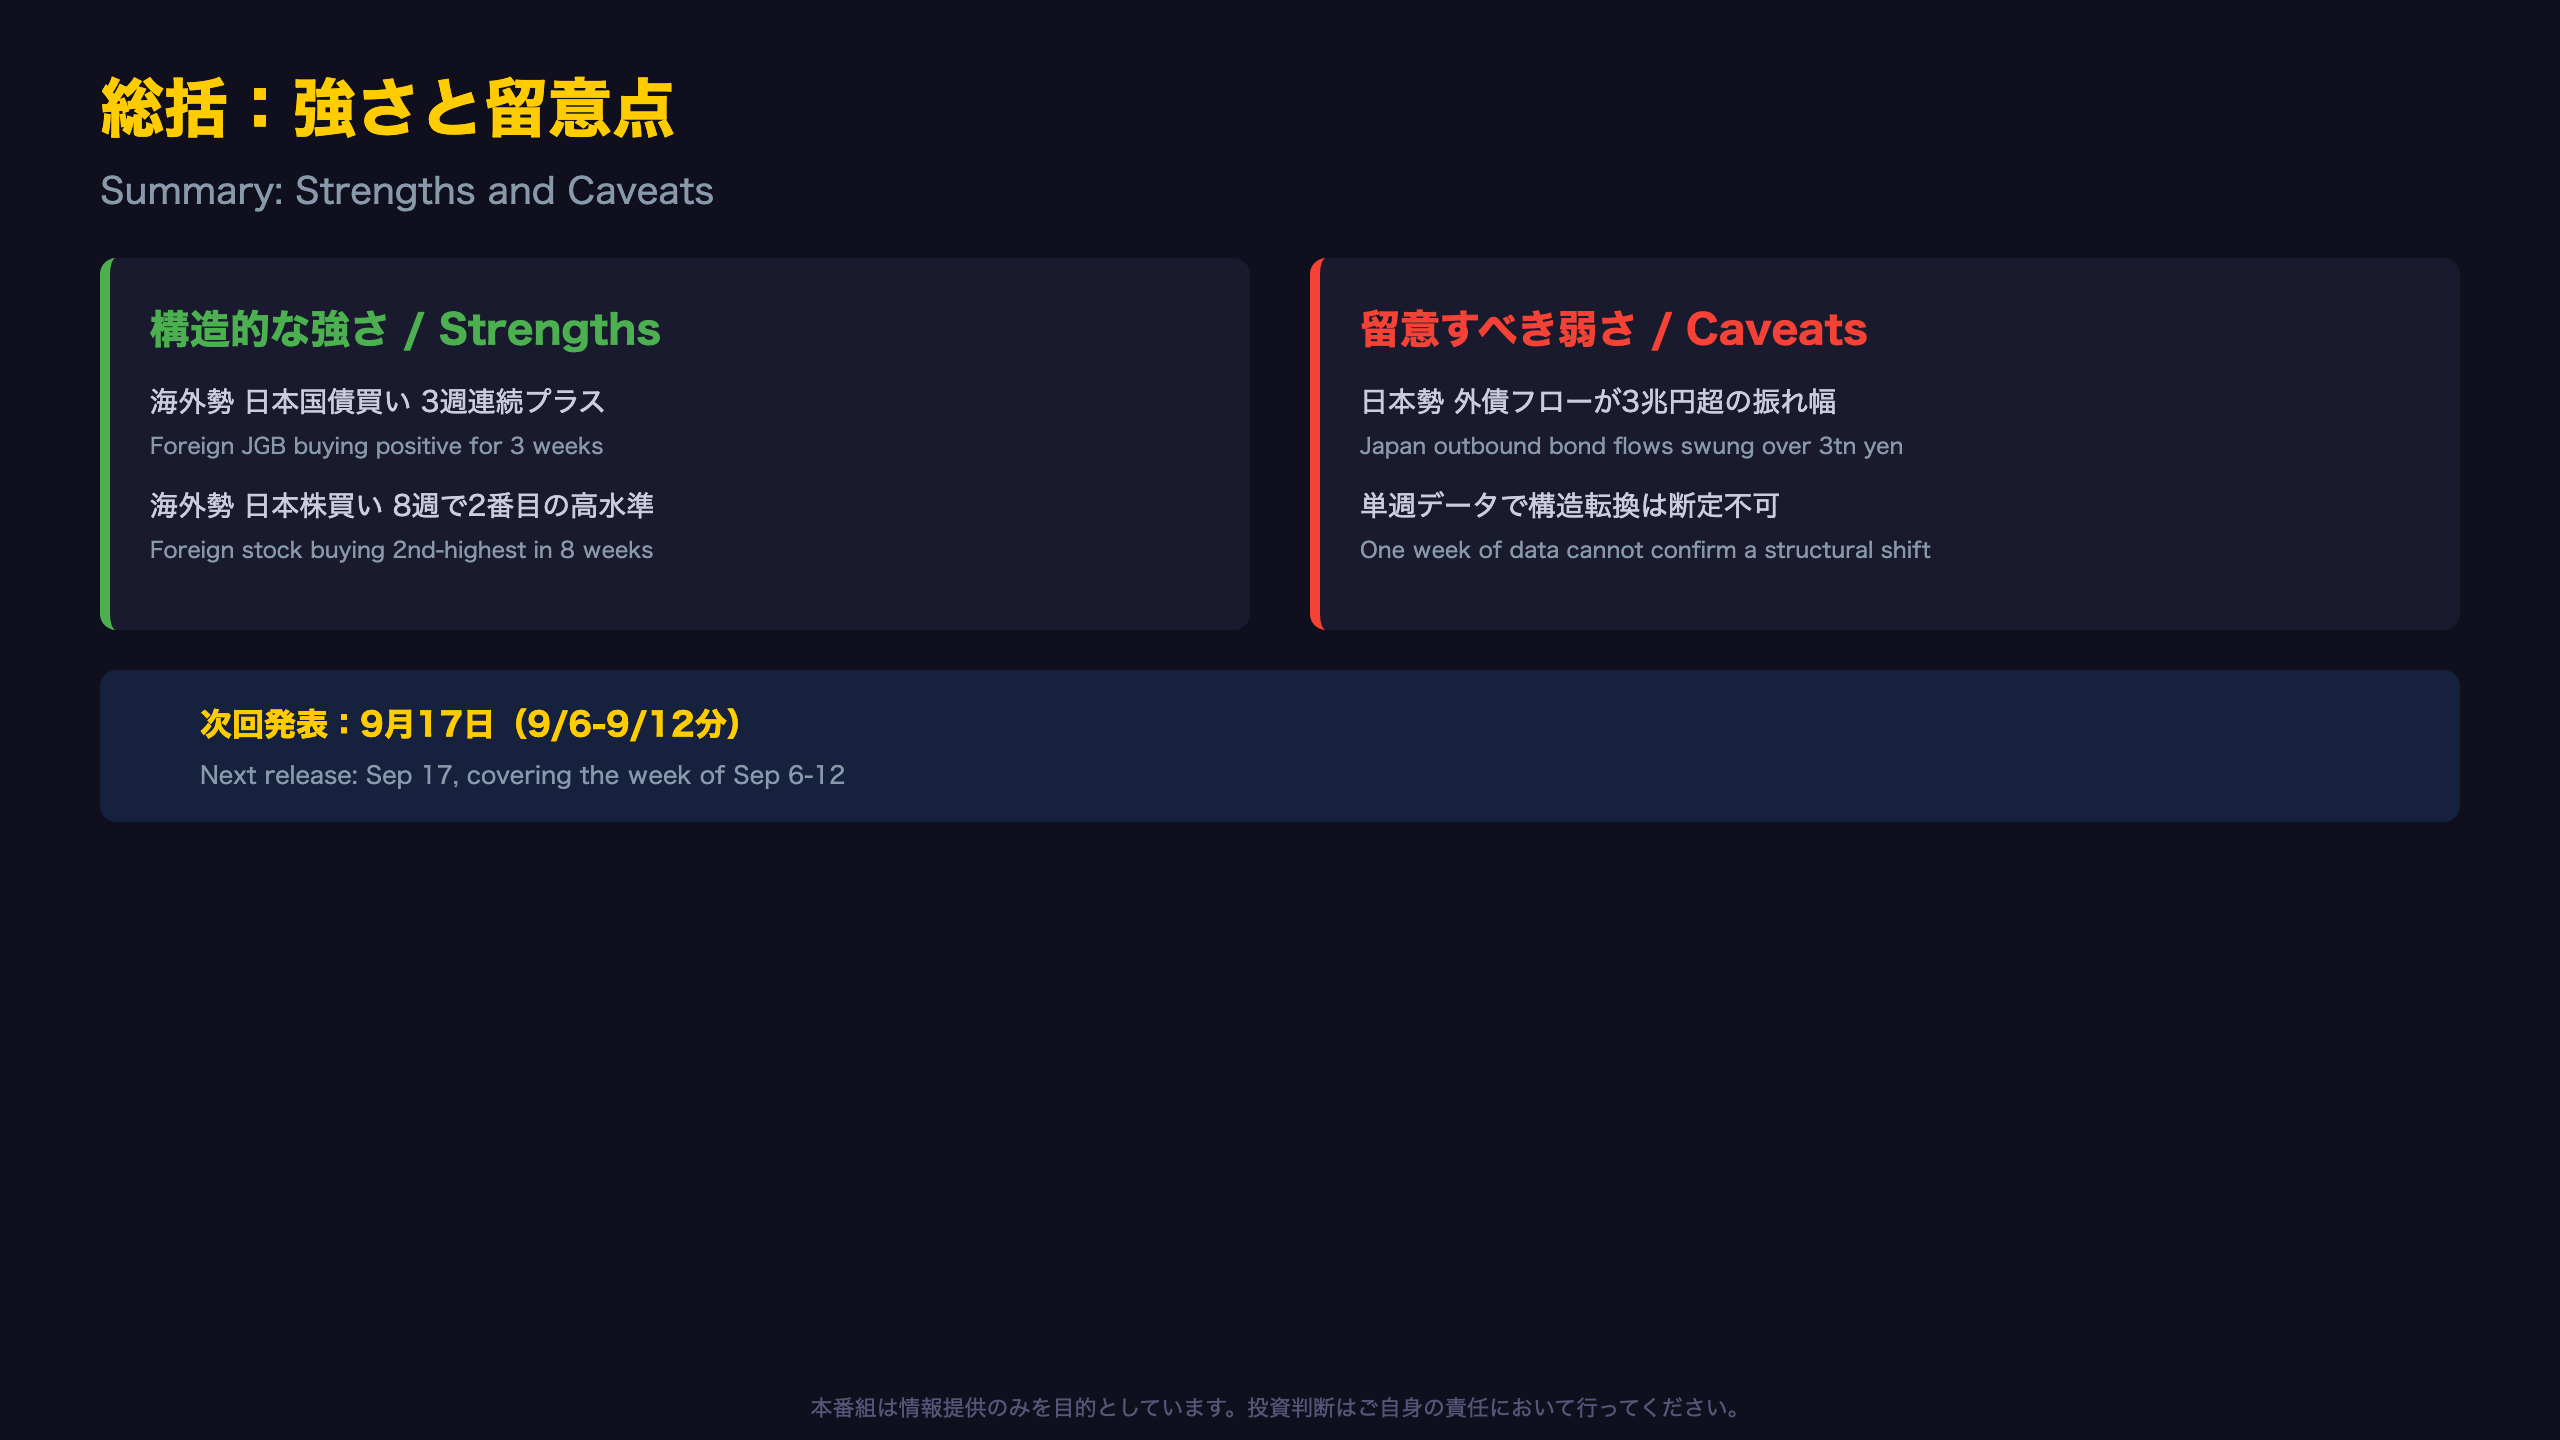
Weighing the Bull and Bear Case
Synthesizing this week’s data yields both structural strengths and points of caution that international investors should weigh.
The bull case
- Foreign JGB buying has been positive for three straight weeks (+JPY 436.1bn, +509.1bn, +449.6bn), a rare run of directional consistency in this typically noisy series
- Foreign equity buying jumped to +JPY 690bn, the second-highest weekly figure in two months
- Both inbound categories turned positive simultaneously in the latest week, suggesting broad-based foreign confidence in Japanese assets
The bear case and caveats
- Japanese outbound flows, especially into foreign bonds, have swung by more than JPY 3 trillion over eight weeks, an extremely unstable pattern
- The large foreign-bond selling seen in late August (-JPY 1.98tn on Aug 22, -JPY 824bn on Aug 29) has already partially reversed to a modest +JPY 111.9bn purchase in the latest week, suggesting the earlier selling may have been quarter-end related rather than a durable repatriation trend
- A single week of data is insufficient to confirm any structural shift in Japan’s cross-border capital flows
What to watch next
The next release of Japan’s weekly international securities transactions report is scheduled for September 17, covering the week of September 6-12. Whether Japanese investors’ bond and equity outflows continue to normalize, or whether last week’s reversal proves temporary, will be the key data point to watch, alongside whether foreign JGB buying extends its streak to a fourth consecutive week.
Disclaimer: This article is for informational purposes only. All investment decisions are made solely at your own risk.