📺 Watch the Full Video Analysis
This article was automatically generated by the NFC Market Live AI analysis system. (Updated: 2026-09-08 09:01 JST)
📄 Primary Source
内閣府経済社会総合研究所
https://www.esri.cao.go.jp/jp/sna/data/data_list/sokuhou/gaiyou/pdf/main_1.pdf
📊 A deep dive into Japan’s Q2 2026 GDP Second Preliminary Estimate from the Cabinet Office.
Real GDP was revised up from +0.3% to +0.4% QoQ (annualized +1.1% to +1.4%).
📉 But beneath the headline, domestic demand contribution stayed negative. Private capex fell for a second straight quarter, and housing/public investment were revised down.
💡 On the bright side, real compensation of employees was revised sharply higher, signaling accelerating wage growth.
⚠️ We break down what this mixed picture means for the BOJ’s rate path, JGB yields, equities, and the yen.
The Ultimate Summary:改定は上方、しかし中身は二面性
What the Second Preliminary Estimate Tells Us
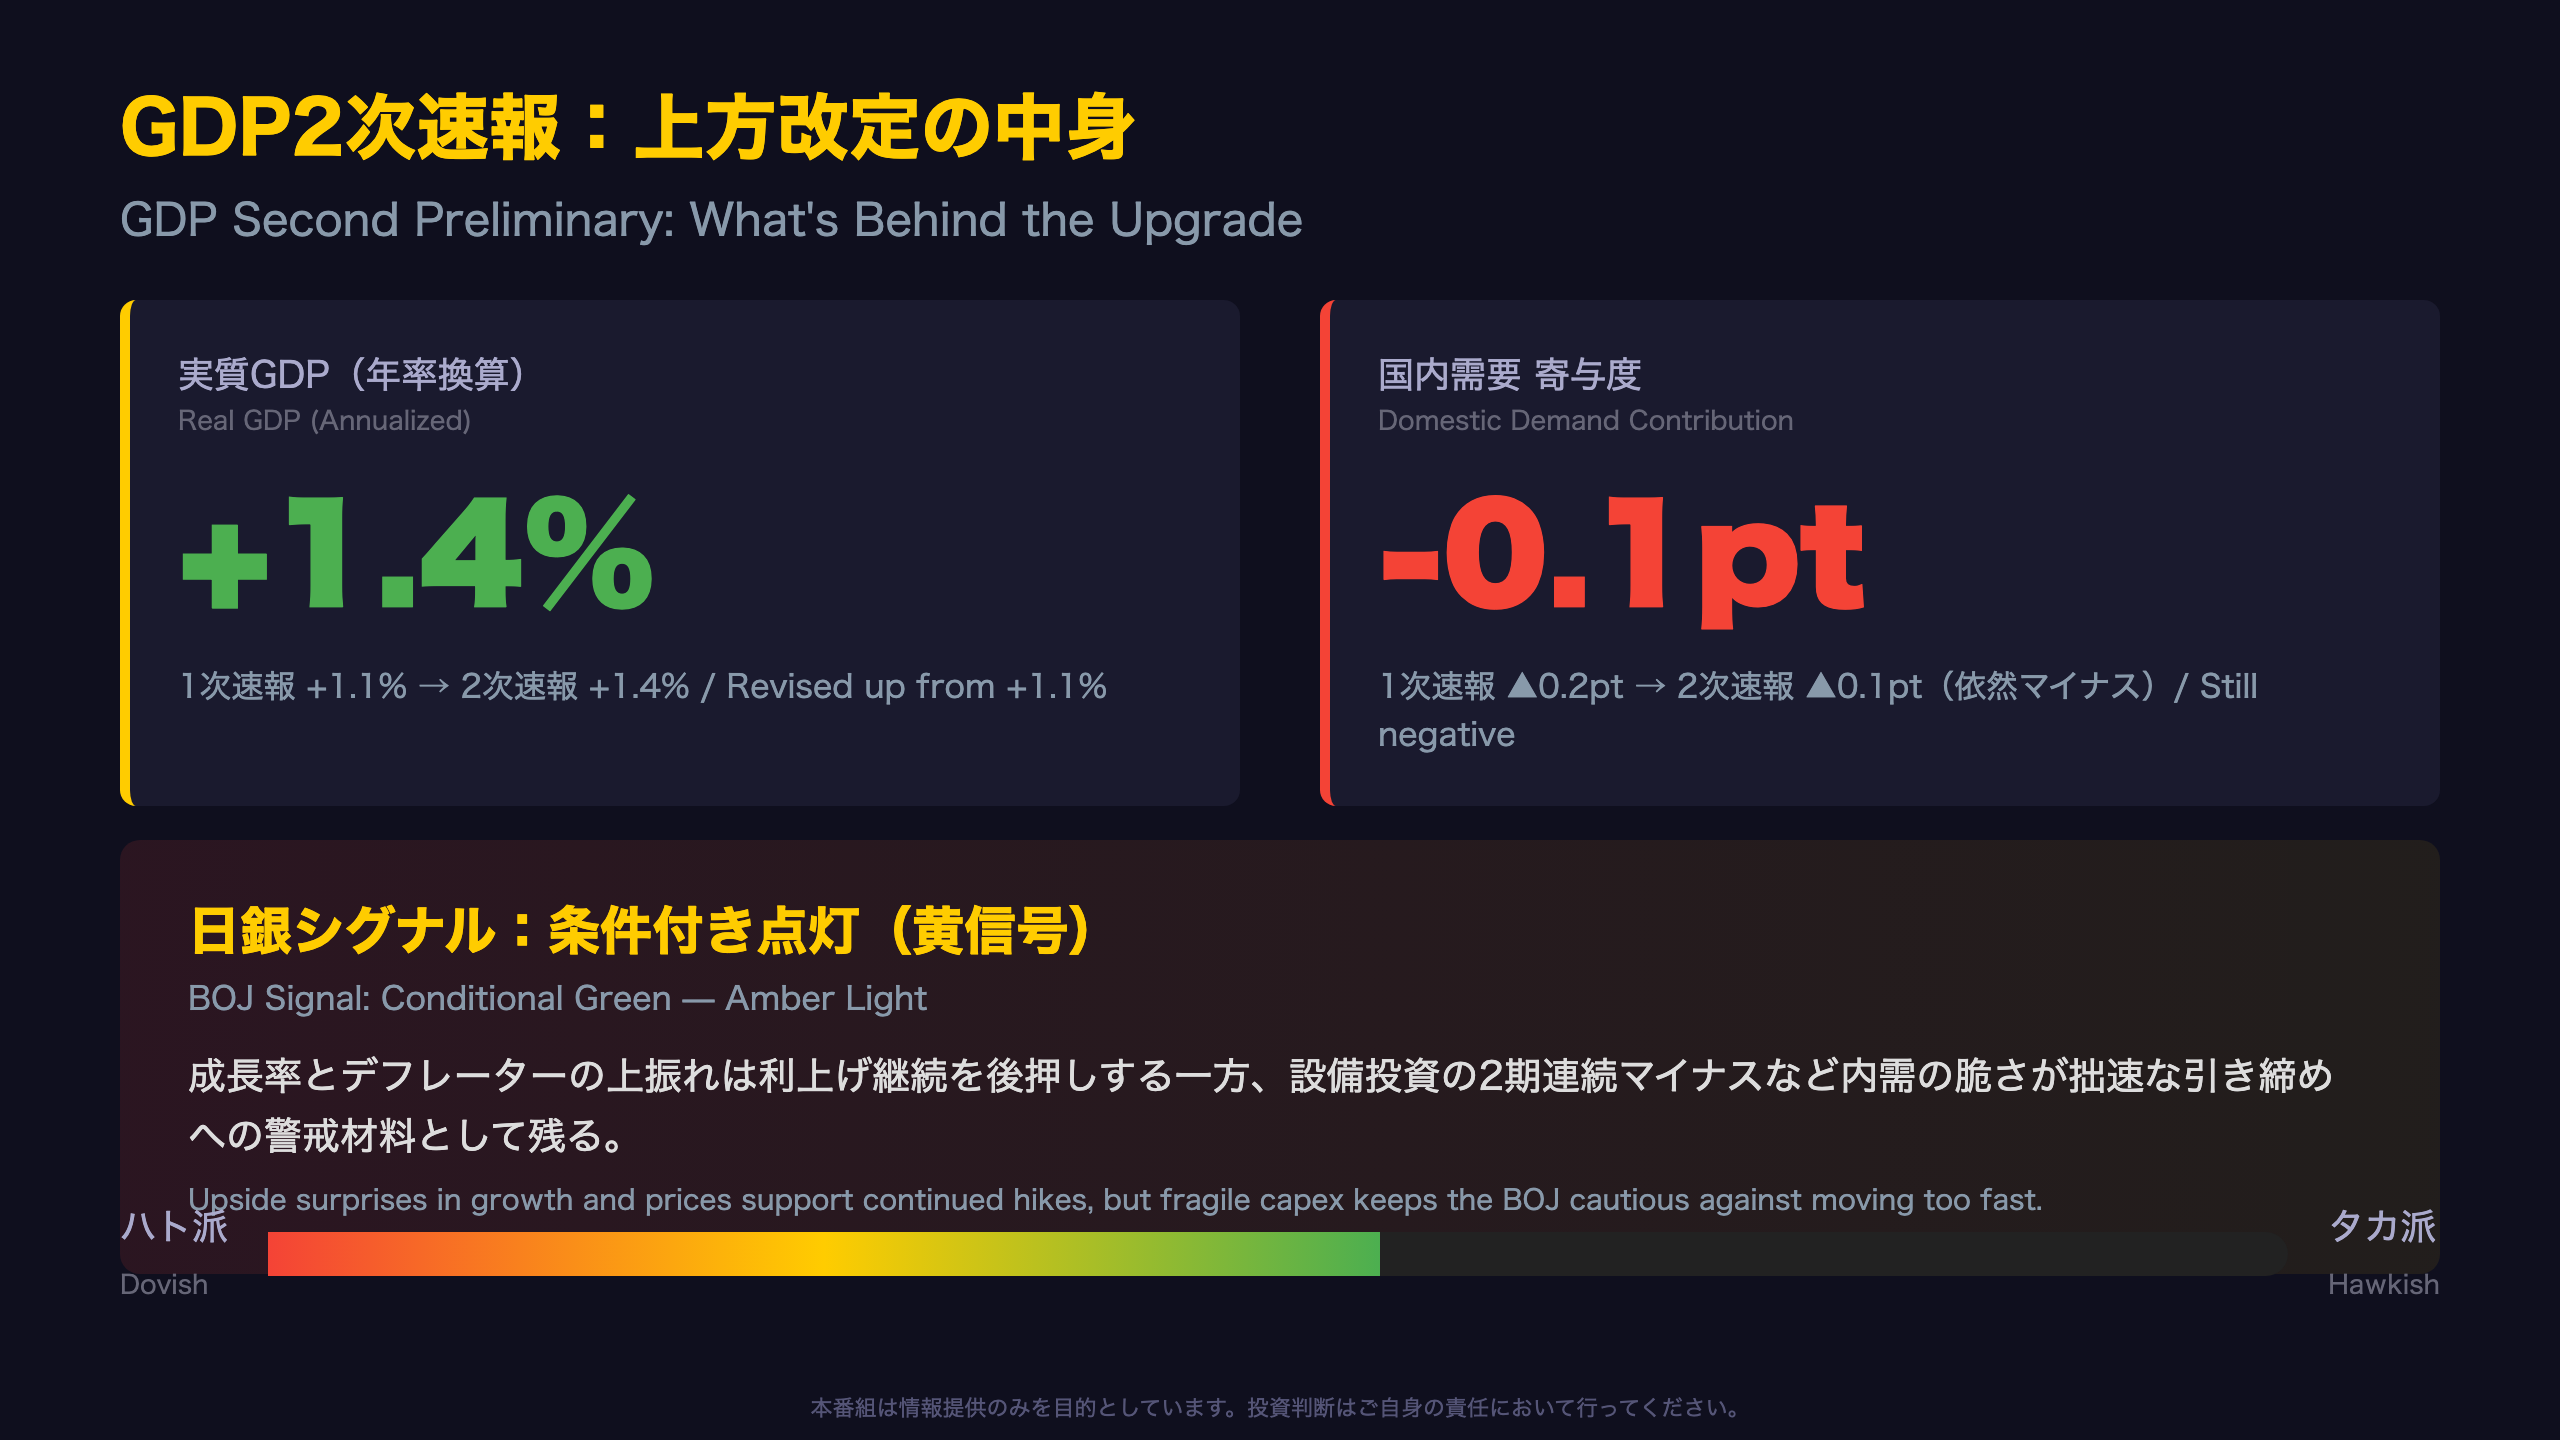
On September 8, 2026, Japan’s Cabinet Office (ESRI) released the Second Preliminary Estimate of Q2 2026 GDP, revising the First Preliminary Estimate (released Aug 17). Real GDP growth QoQ was revised from +0.3% to +0.4% (annualized +1.1% to +1.4%), and nominal GDP from +1.2% to +1.3% (annualized +4.8% to +5.5%).
Context for International Readers
Unlike the U.S. BEA, which issues three GDP estimates (advance, second, third), Japan’s Cabinet Office issues two: a First Preliminary roughly 6-7 weeks after quarter-end, and a Second Preliminary about three weeks later incorporating updated corporate and trade data. This revision cycle often moves markets, especially JGB yields, since it directly informs the Bank of Japan’s (BOJ) quarterly assessment.
The Real Story: A Two-Sided Signal
The official release states domestic demand’s contribution was \”-0.1 percentage point\” (narrower than -0.2pt in the first estimate), while net exports contributed +0.5 point—unchanged. This means the upward revision was not driven by a strengthening of consumption or investment, but largely by a wider import contraction, a nuance often missed in headline-only reporting.
Bull vs. Bear Read
Bulls will note two consecutive months of upward headline revisions signal underlying resilience. Bears will counter that revision quality matters as much as direction—an upgrade driven by import weakness (a proxy for soft domestic demand) is qualitatively different from one driven by robust consumer or capex spending.
The next GDP release (Q3 2026 First Preliminary) is expected around mid-November 2026.
ヘッドライン改定の解剖:牽引したのは輸入減少
Decomposing the Upward Revision
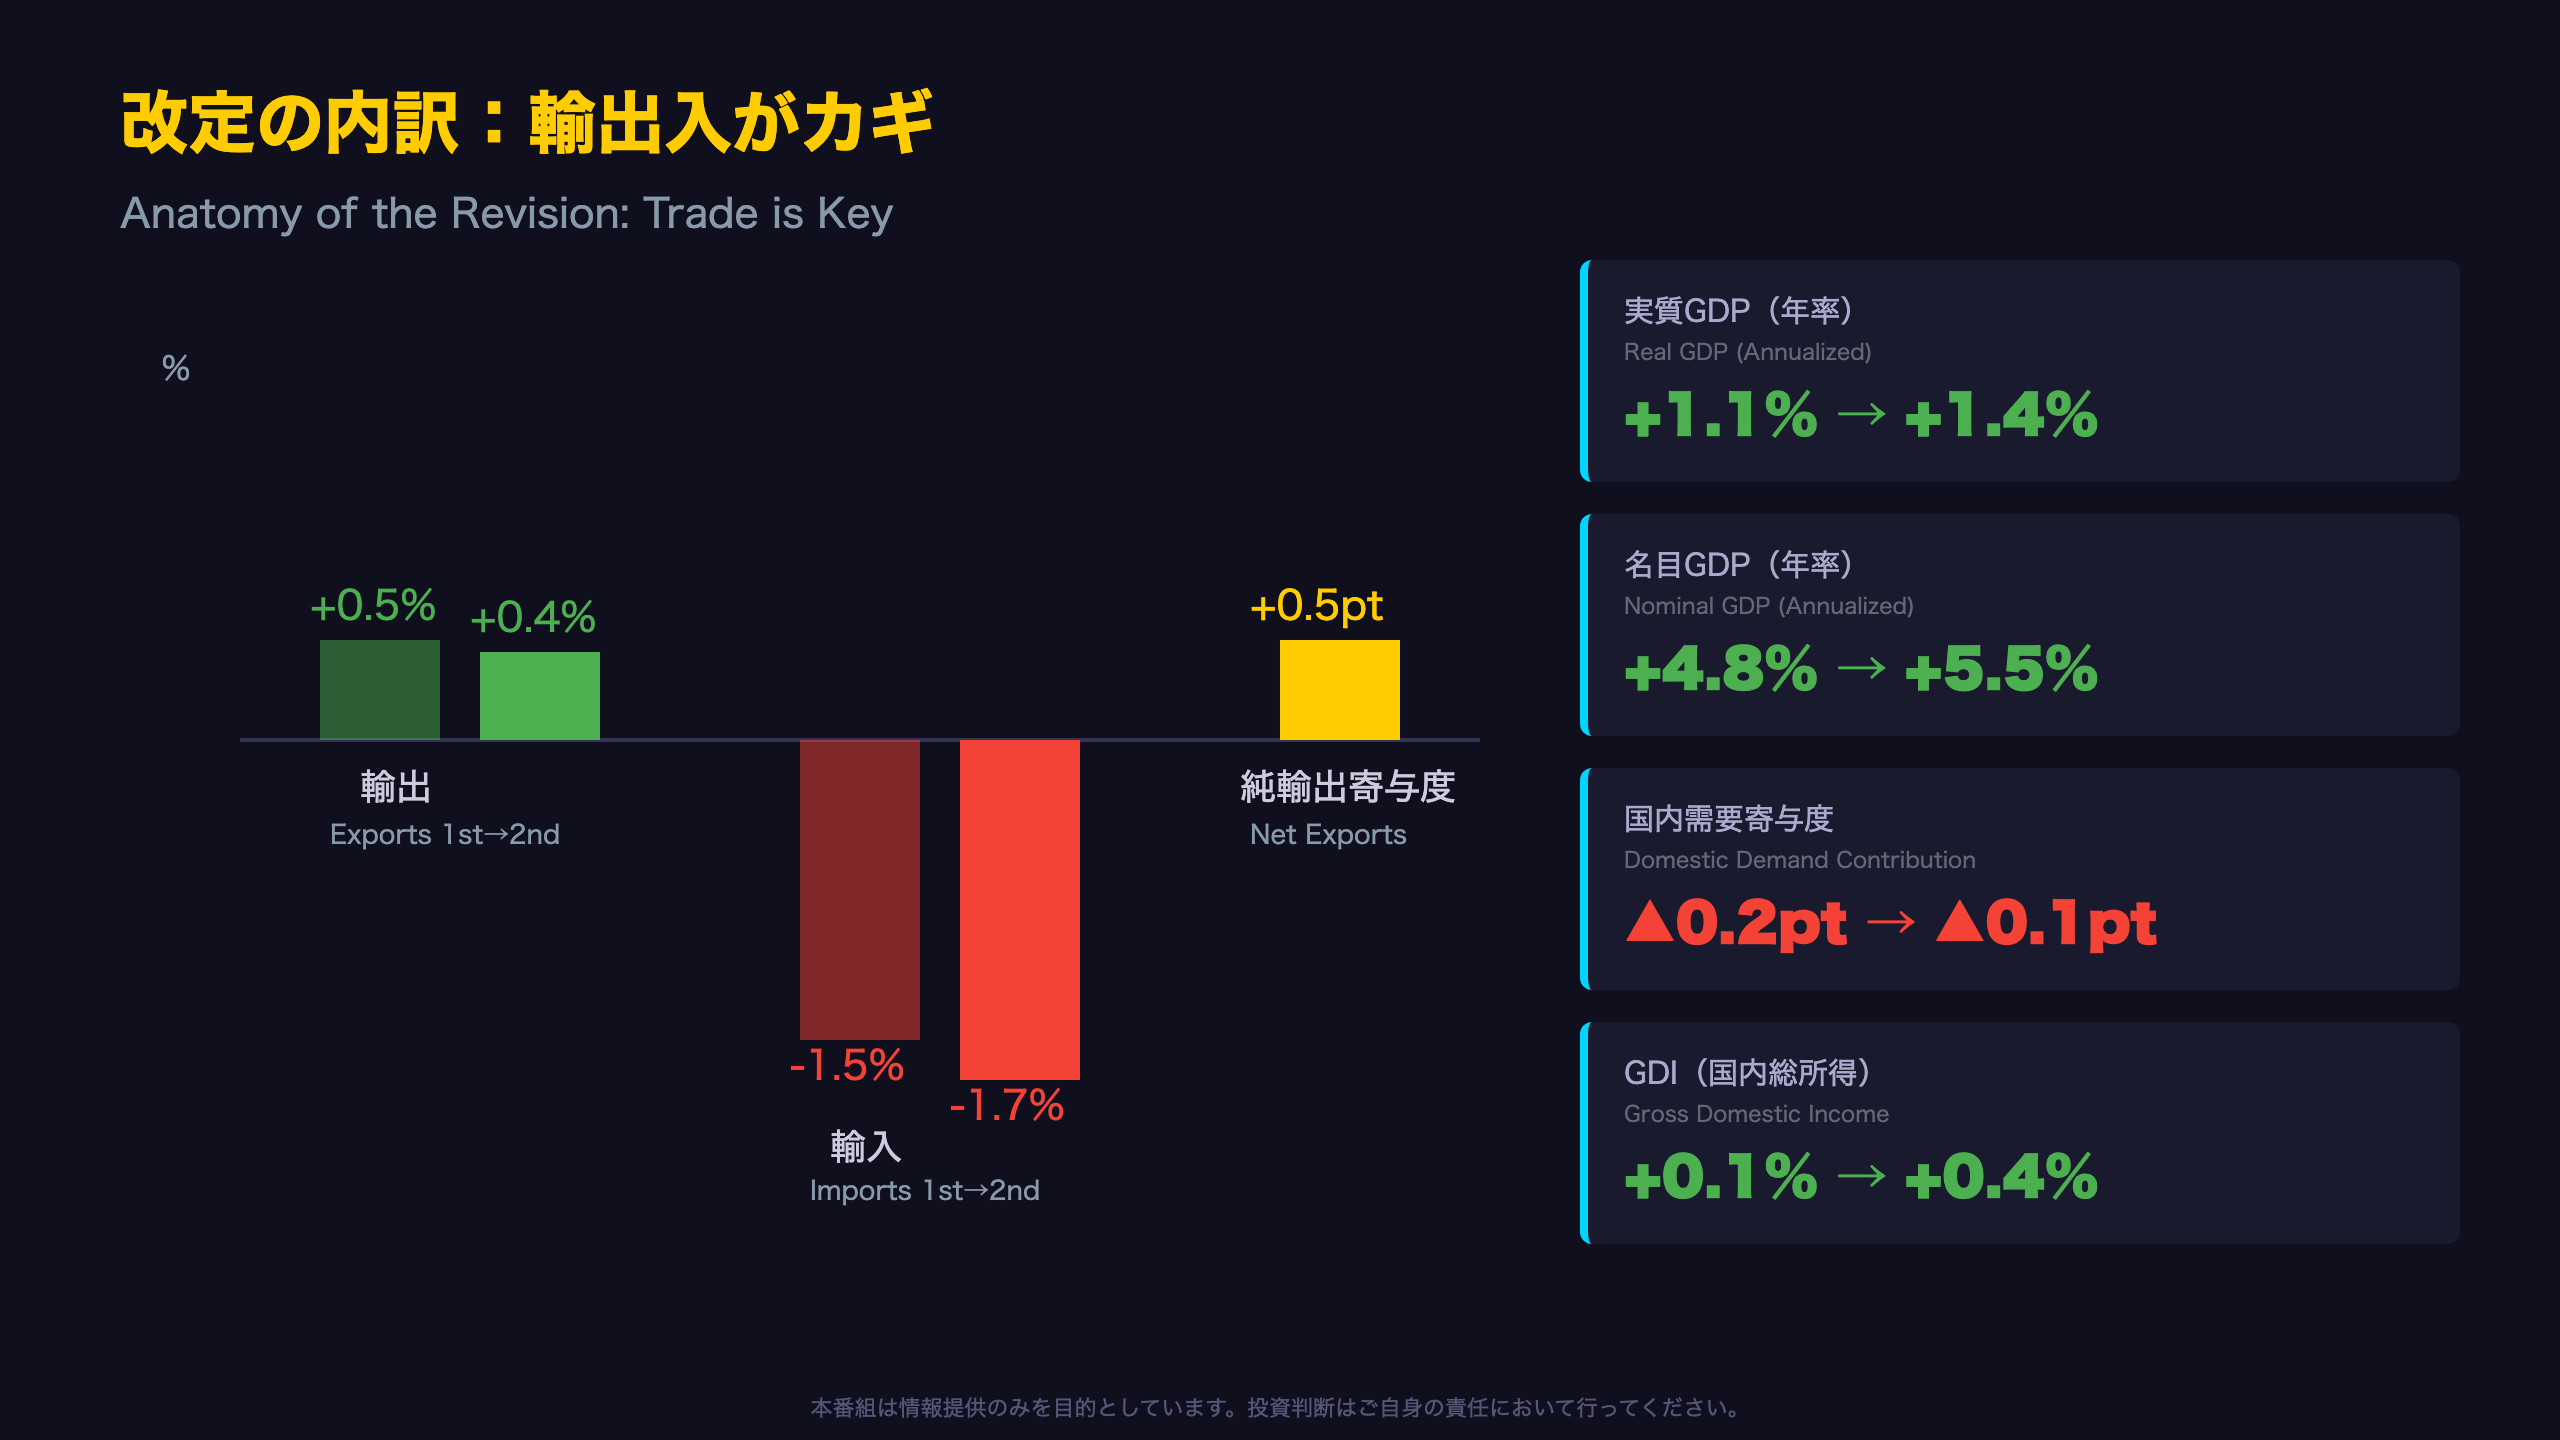
A careful read of the contribution data reveals exactly where the +0.1 percentage point upward revision in real GDP came from.
Trade Component Revisions
| Item | 1st Preliminary | 2nd Preliminary |
|---|---|---|
| Exports (real QoQ) | +0.5% | +0.4% |
| Imports (real QoQ) | -1.5% | -1.7% |
| Net exports contribution | +0.5pt | +0.5pt |
While the net export contribution itself stayed flat at +0.5 point, the deeper import contraction (from -1.5% to -1.7%) is a larger swing than the modest downgrade in exports (+0.5% to +0.4%). This is the mechanical engine behind the reported upgrade.
Why This Matters for Global Investors
Unlike the U.S., where GDP revisions are typically driven by inventory and services data updates, Japan’s revisions frequently hinge on trade statistics because Japan’s external accounts are updated with a lag relative to the preliminary release. A widening import contraction can reflect either weaker domestic capital goods demand (a soft signal) or commodity price/FX pass-through effects (a neutral signal)—the data alone cannot fully disentangle these (Level C inference).
Gross Domestic Income (GDI) Also Revised Up
Notably, GDI—a broader income-side measure the BOJ also monitors—was revised up sharply from +0.1% to +0.4% QoQ, suggesting the income side of the economy may be somewhat firmer than the expenditure-side headline alone suggests.
What to Watch Next
The Q3 2026 First Preliminary release (expected mid-November) will be the key test: does the import-driven pattern persist, or does domestic demand (capex, consumption) finally turn positive?
投資の三本柱、揃って弱含み
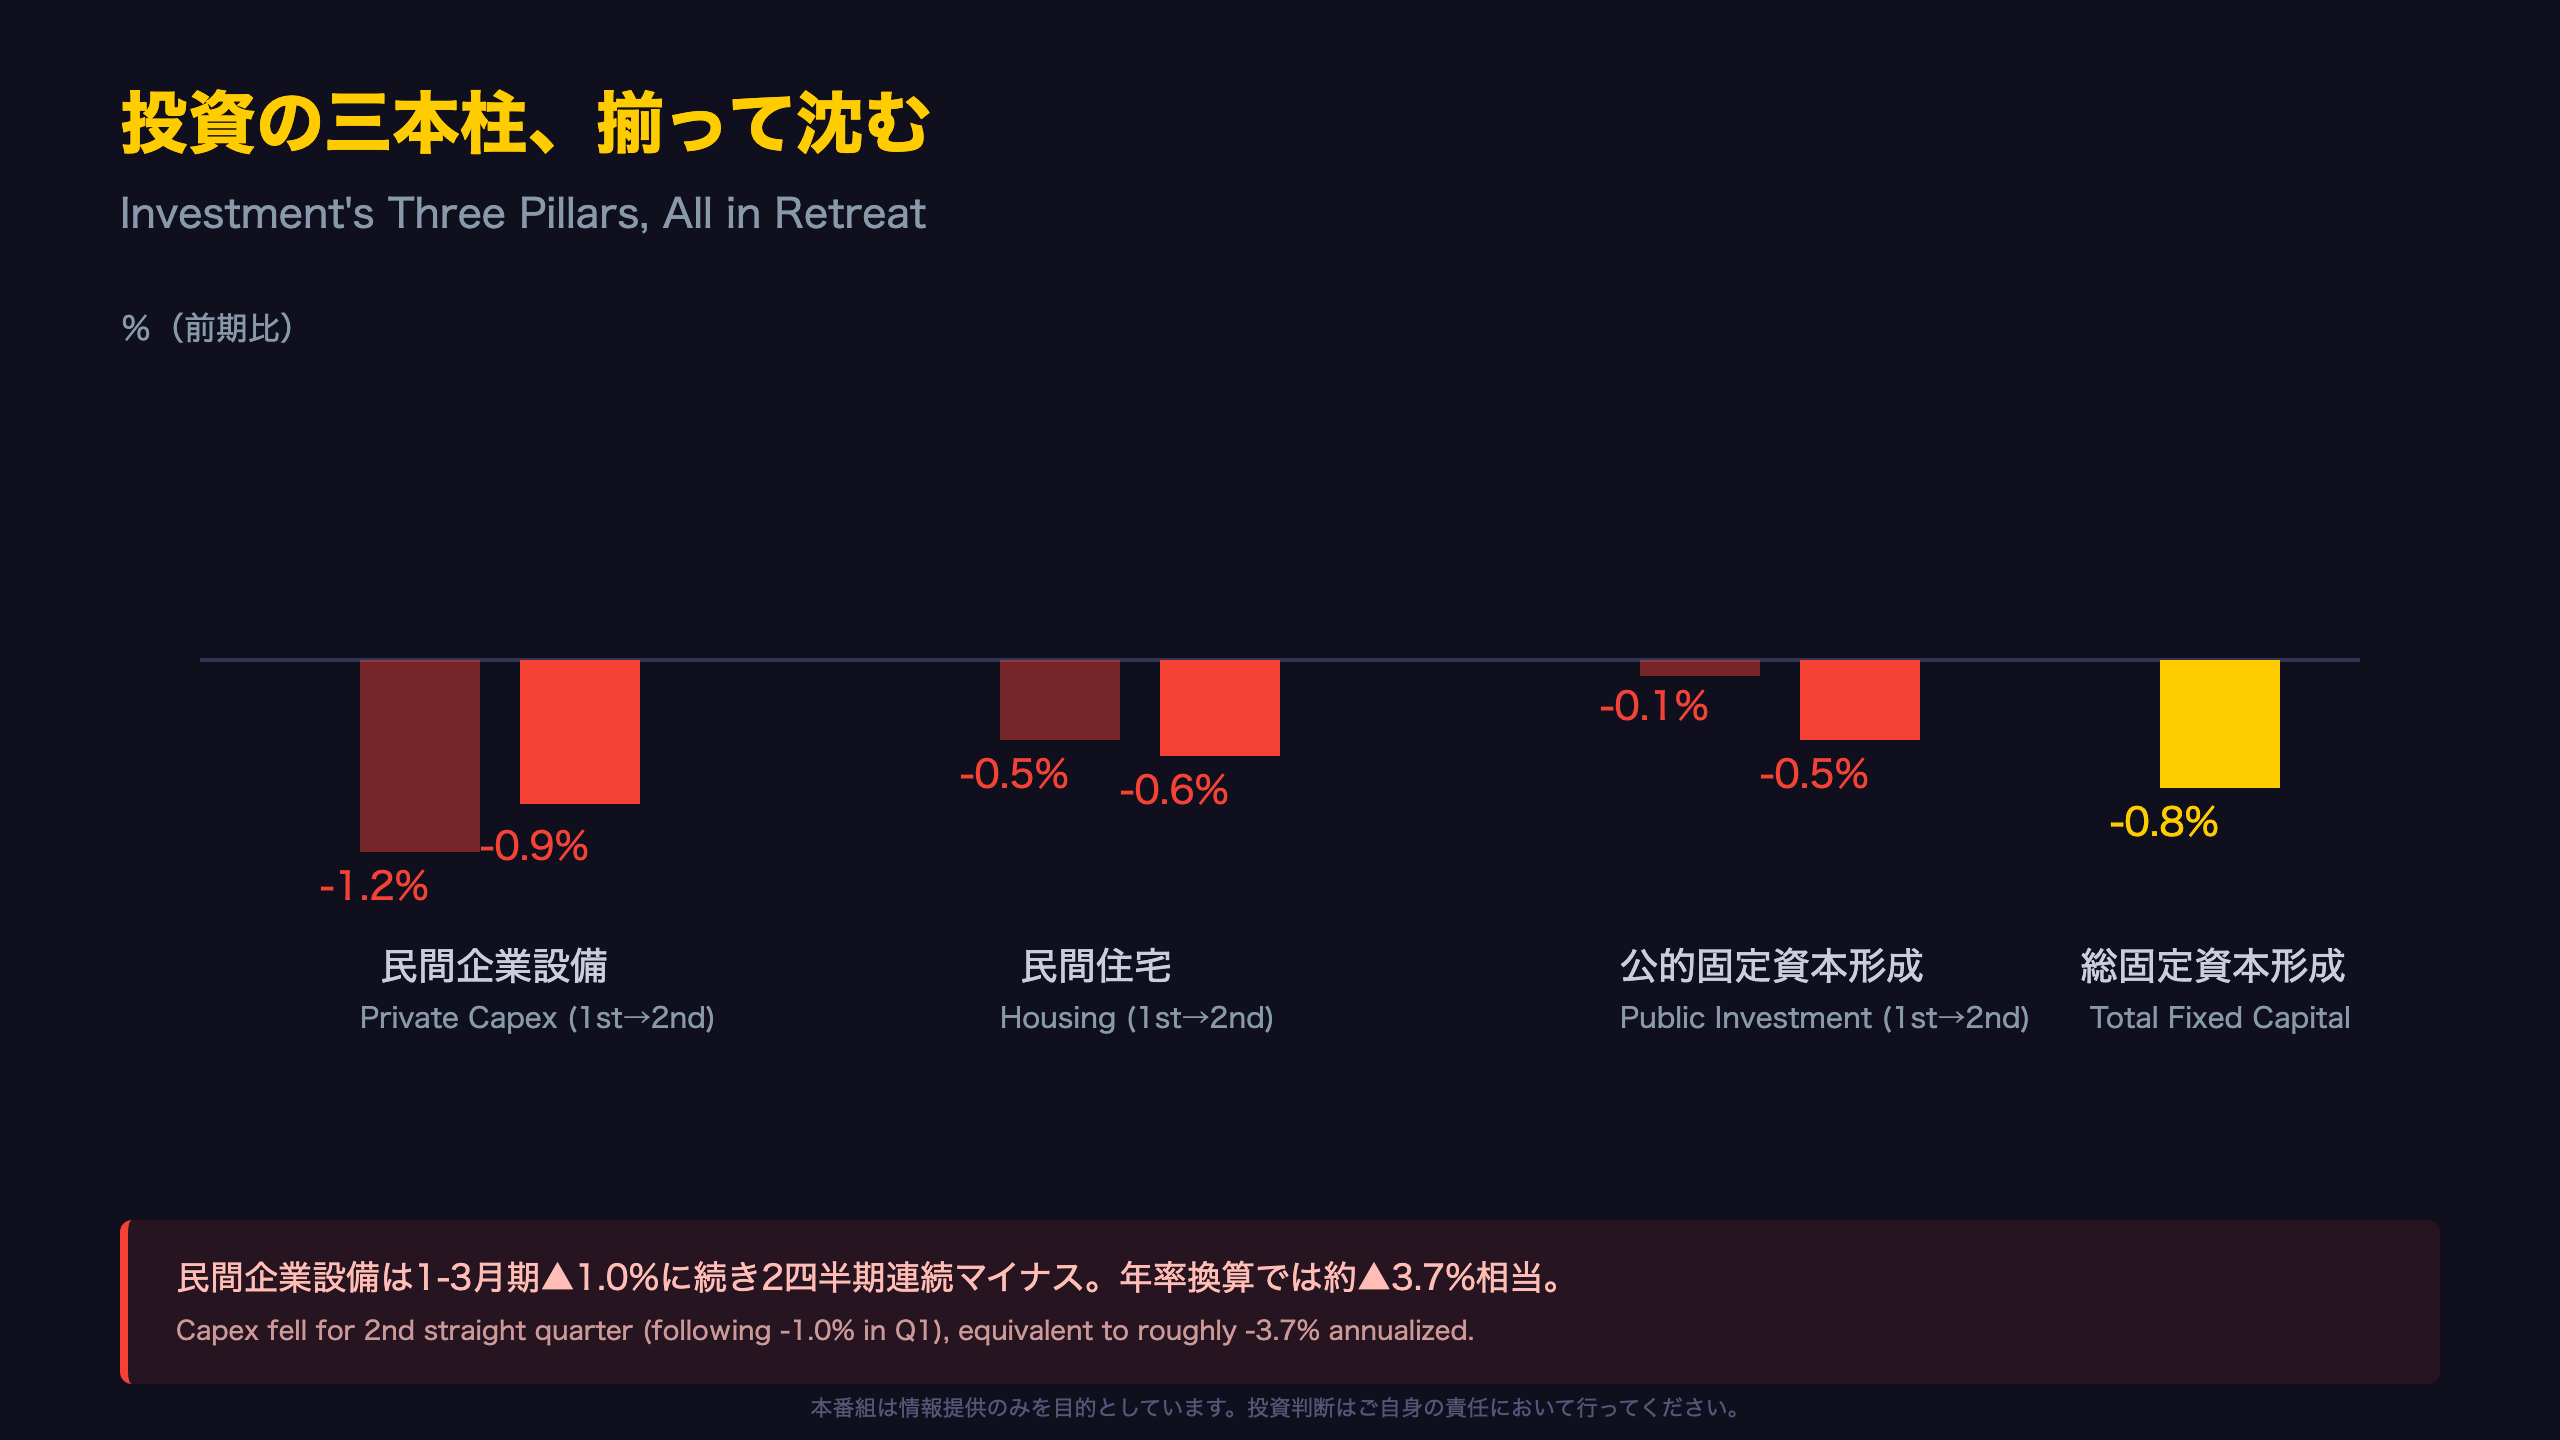
The \”Three Pillars\” of Investment All in Retreat
Gross fixed capital formation (private residential + private capex + public investment) came in at -0.8% QoQ in the Second Preliminary Estimate (vs. -0.9% in the First), remaining deep in negative territory.
Revision Table by Component
| Item | 1st Prelim. | 2nd Prelim. | Prior Qtr (Q1 2026) |
|---|---|---|---|
| Private capex | -1.2% | -0.9% | -1.0% |
| Private residential investment | -0.5% | -0.6% | +0.9% |
| Public investment | -0.1% | -0.5% | +1.4% |
Private capex has now declined for two consecutive quarters, equivalent to roughly -3.7% annualized. This is a meaningful signal for global investors tracking Japan’s corporate capex cycle, historically a bellwether for productivity-enhancing investment (automation, digitalization) that the BOJ closely watches as evidence of a \”virtuous cycle\” between wages and growth.
Year-over-Year Deceleration
On a year-over-year basis, private capex growth decelerated sharply: +3.9% in Q4 2025, +1.2% in Q1 2026, and now -0.9% in Q2 2026—a clear loss of momentum rather than a single-quarter blip.
Two Competing Interpretations
One read: this could be a cyclical payback after a period of elevated AI/labor-saving capex (a temporary pause). Another read: firms may be growing cautious amid rising wage costs and demand uncertainty—a more structural concern (Level C inference; the data alone cannot confirm either scenario).
Context: Comparison to Western Business Investment Cycles
Unlike the U.S., where business fixed investment is heavily influenced by financing conditions and Fed policy, Japanese capex decisions are more closely tied to corporate cash reserves and long-term demographic/labor-shortage considerations—meaning BOJ rate moves alone may have limited near-term influence on this trend.
明るい材料:雇用者報酬が大幅上方改定
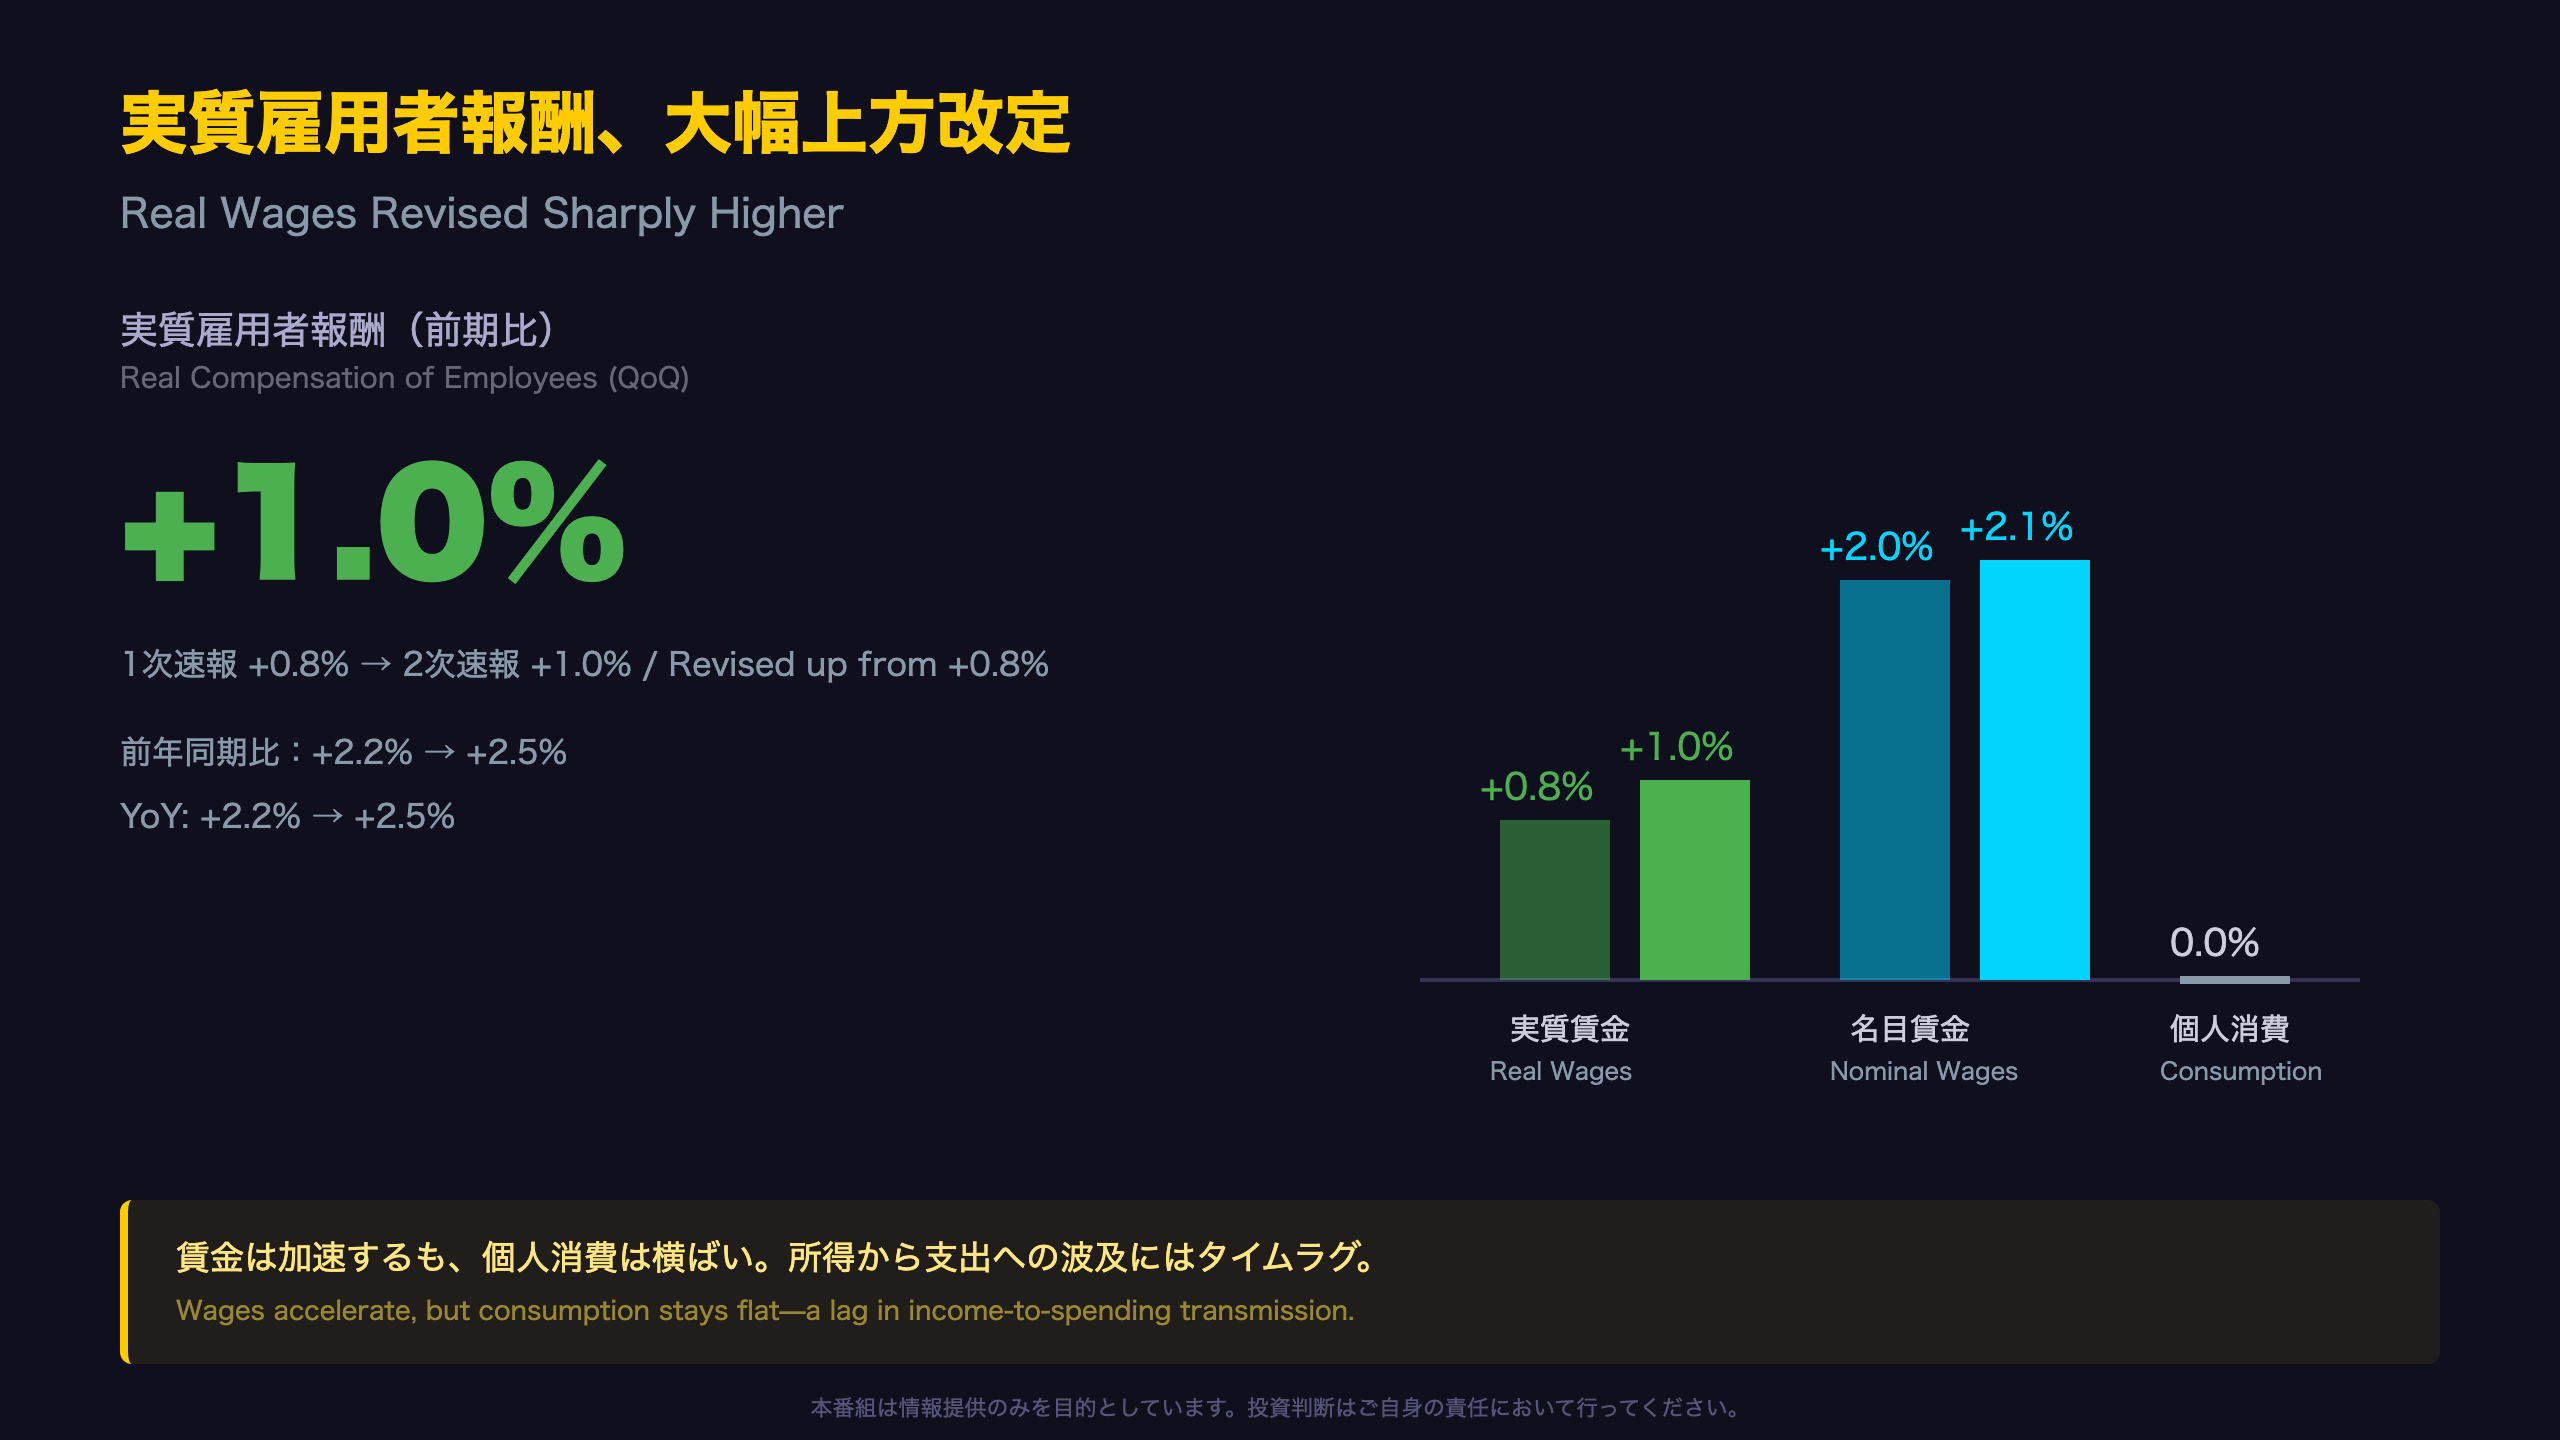
Why the Wage Revision Matters
The most unambiguous upward revision in this release is real compensation of employees, revised from +0.8% to +1.0% QoQ, with the nominal figure also revised from +2.0% to +2.1%.
Accelerating Wage Growth, Year-over-Year
On a year-over-year basis, real compensation of employees accelerated from +1.4-1.5% in Q1 2026 to +2.5-2.6% in Q2—a clear step-up. Nominal compensation growth YoY jumped even more sharply, from +3.5% to +5.3%.
Understanding Japan’s Dual Deflator Convention
Japan’s Cabinet Office reports real wages using two different deflators: one excluding imputed rent and FISIM (financial intermediation services), and one using the standard household consumption deflator. Both series showed the same upward revision pattern (+0.8→+1.0 and +0.9→+1.1 respectively), reinforcing confidence in the signal.
The BOJ’s Favorite Narrative: Wage-Price Virtuous Cycle
Since 2024, the Bank of Japan has repeatedly cited the sustainability of a \”virtuous cycle between wages and prices\” as the central condition for continued policy normalization—a framework quite different from the Fed’s dual mandate or the ECB’s inflation-only target. This wage data upgrade offers incremental support for that narrative (Level B inference, as multiple wage series point the same direction).
But the Consumption Transmission Remains Weak
Despite stronger wage data, household consumption (real, QoQ) was barely revised, moving from -0.0% to 0.0%—essentially flat. This suggests wage gains have not yet clearly translated into spending, a lag pattern common in Japan given elevated household savings propensity relative to, say, U.S. consumers. Watch Q3 consumption data closely to see whether this wage-to-spending transmission finally materializes.
デフレーター上振れ:物価圧力の性質
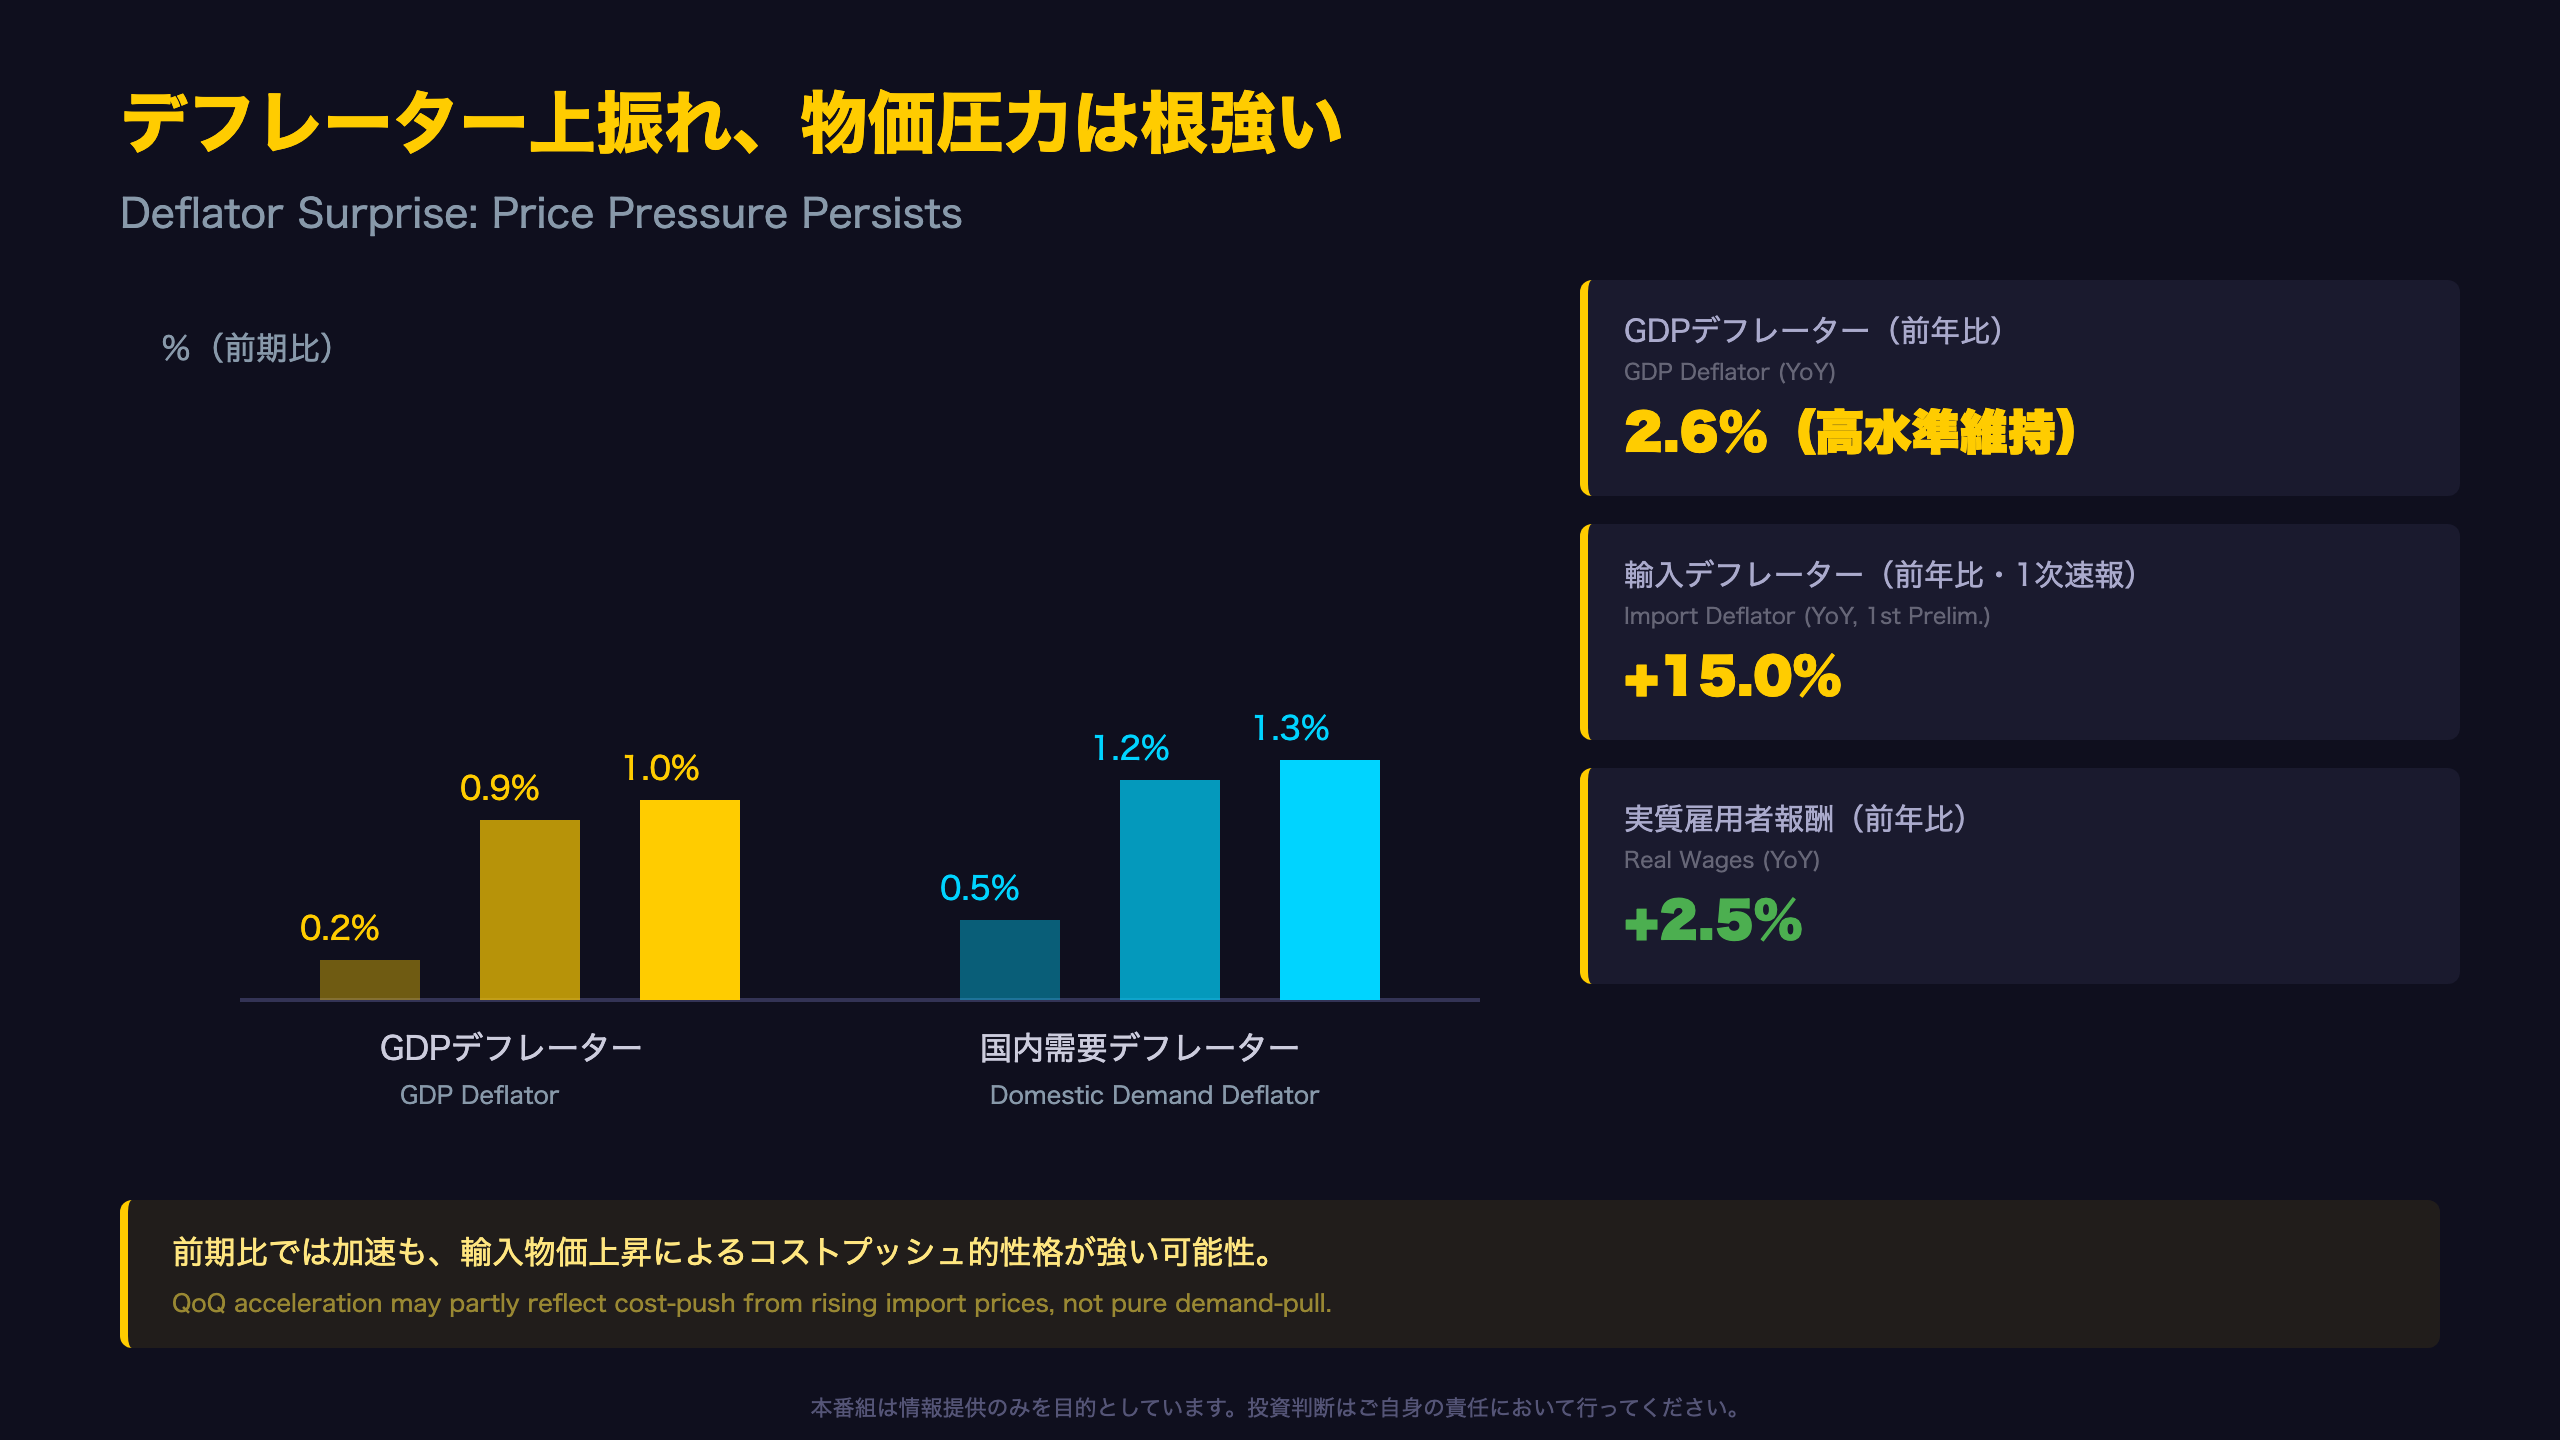
Inside the Deflator Revision
In the Second Preliminary Estimate, the GDP deflator (QoQ, seasonally adjusted) was revised up from +0.9% to +1.0%, and the domestic demand deflator from +1.2% to +1.3%.
Context for Non-Japan Readers
The GDP deflator is Japan’s broadest price gauge, capturing price changes across the entire economy (unlike the narrower CPI, which the Fed and most central banks target). The Bank of Japan monitors both the GDP deflator and the domestic demand deflator to assess whether inflation is domestically generated or imported.
Sequential Acceleration vs. Year-over-Year Deceleration
According to the First Preliminary release, the GDP deflator (QoQ) accelerated from +0.2% in Q1 2026 to +0.9% in Q2 (as first reported), now revised even higher to +1.0%. Yet on a year-over-year basis, the GDP deflator actually decelerated slightly, from 3.2% in Q1 to 2.6% in Q2 (unchanged in the Second Preliminary). This divergence between the sequential (QoQ) and annual (YoY) views is a nuance easily missed by headline readers and underscores why comparing multiple time frames matters.
Cost-Push or Demand-Pull?
Per the First Preliminary release, the import deflator rose 15.0% year-over-year (up from 3.2% in Q1)—a sharp acceleration likely reflecting higher global commodity prices and/or yen-denominated import costs (Level C inference, single-indicator based). This is a materially different inflation dynamic than the BOJ’s preferred scenario of demand-driven, wage-supported price growth—closer to the imported-cost-push dynamics the ECB grappled with in 2022.
Implications for BOJ Policy
Regardless of the underlying driver, the sequential acceleration in the deflator strengthens the case for continued BOJ policy normalization in the near term. Investors should watch how the BOJ’s next Outlook Report characterizes this price data—whether it emphasizes the encouraging QoQ trend or the more moderate YoY trend.
総合:日銀・国債・株・円へのインプリケーション
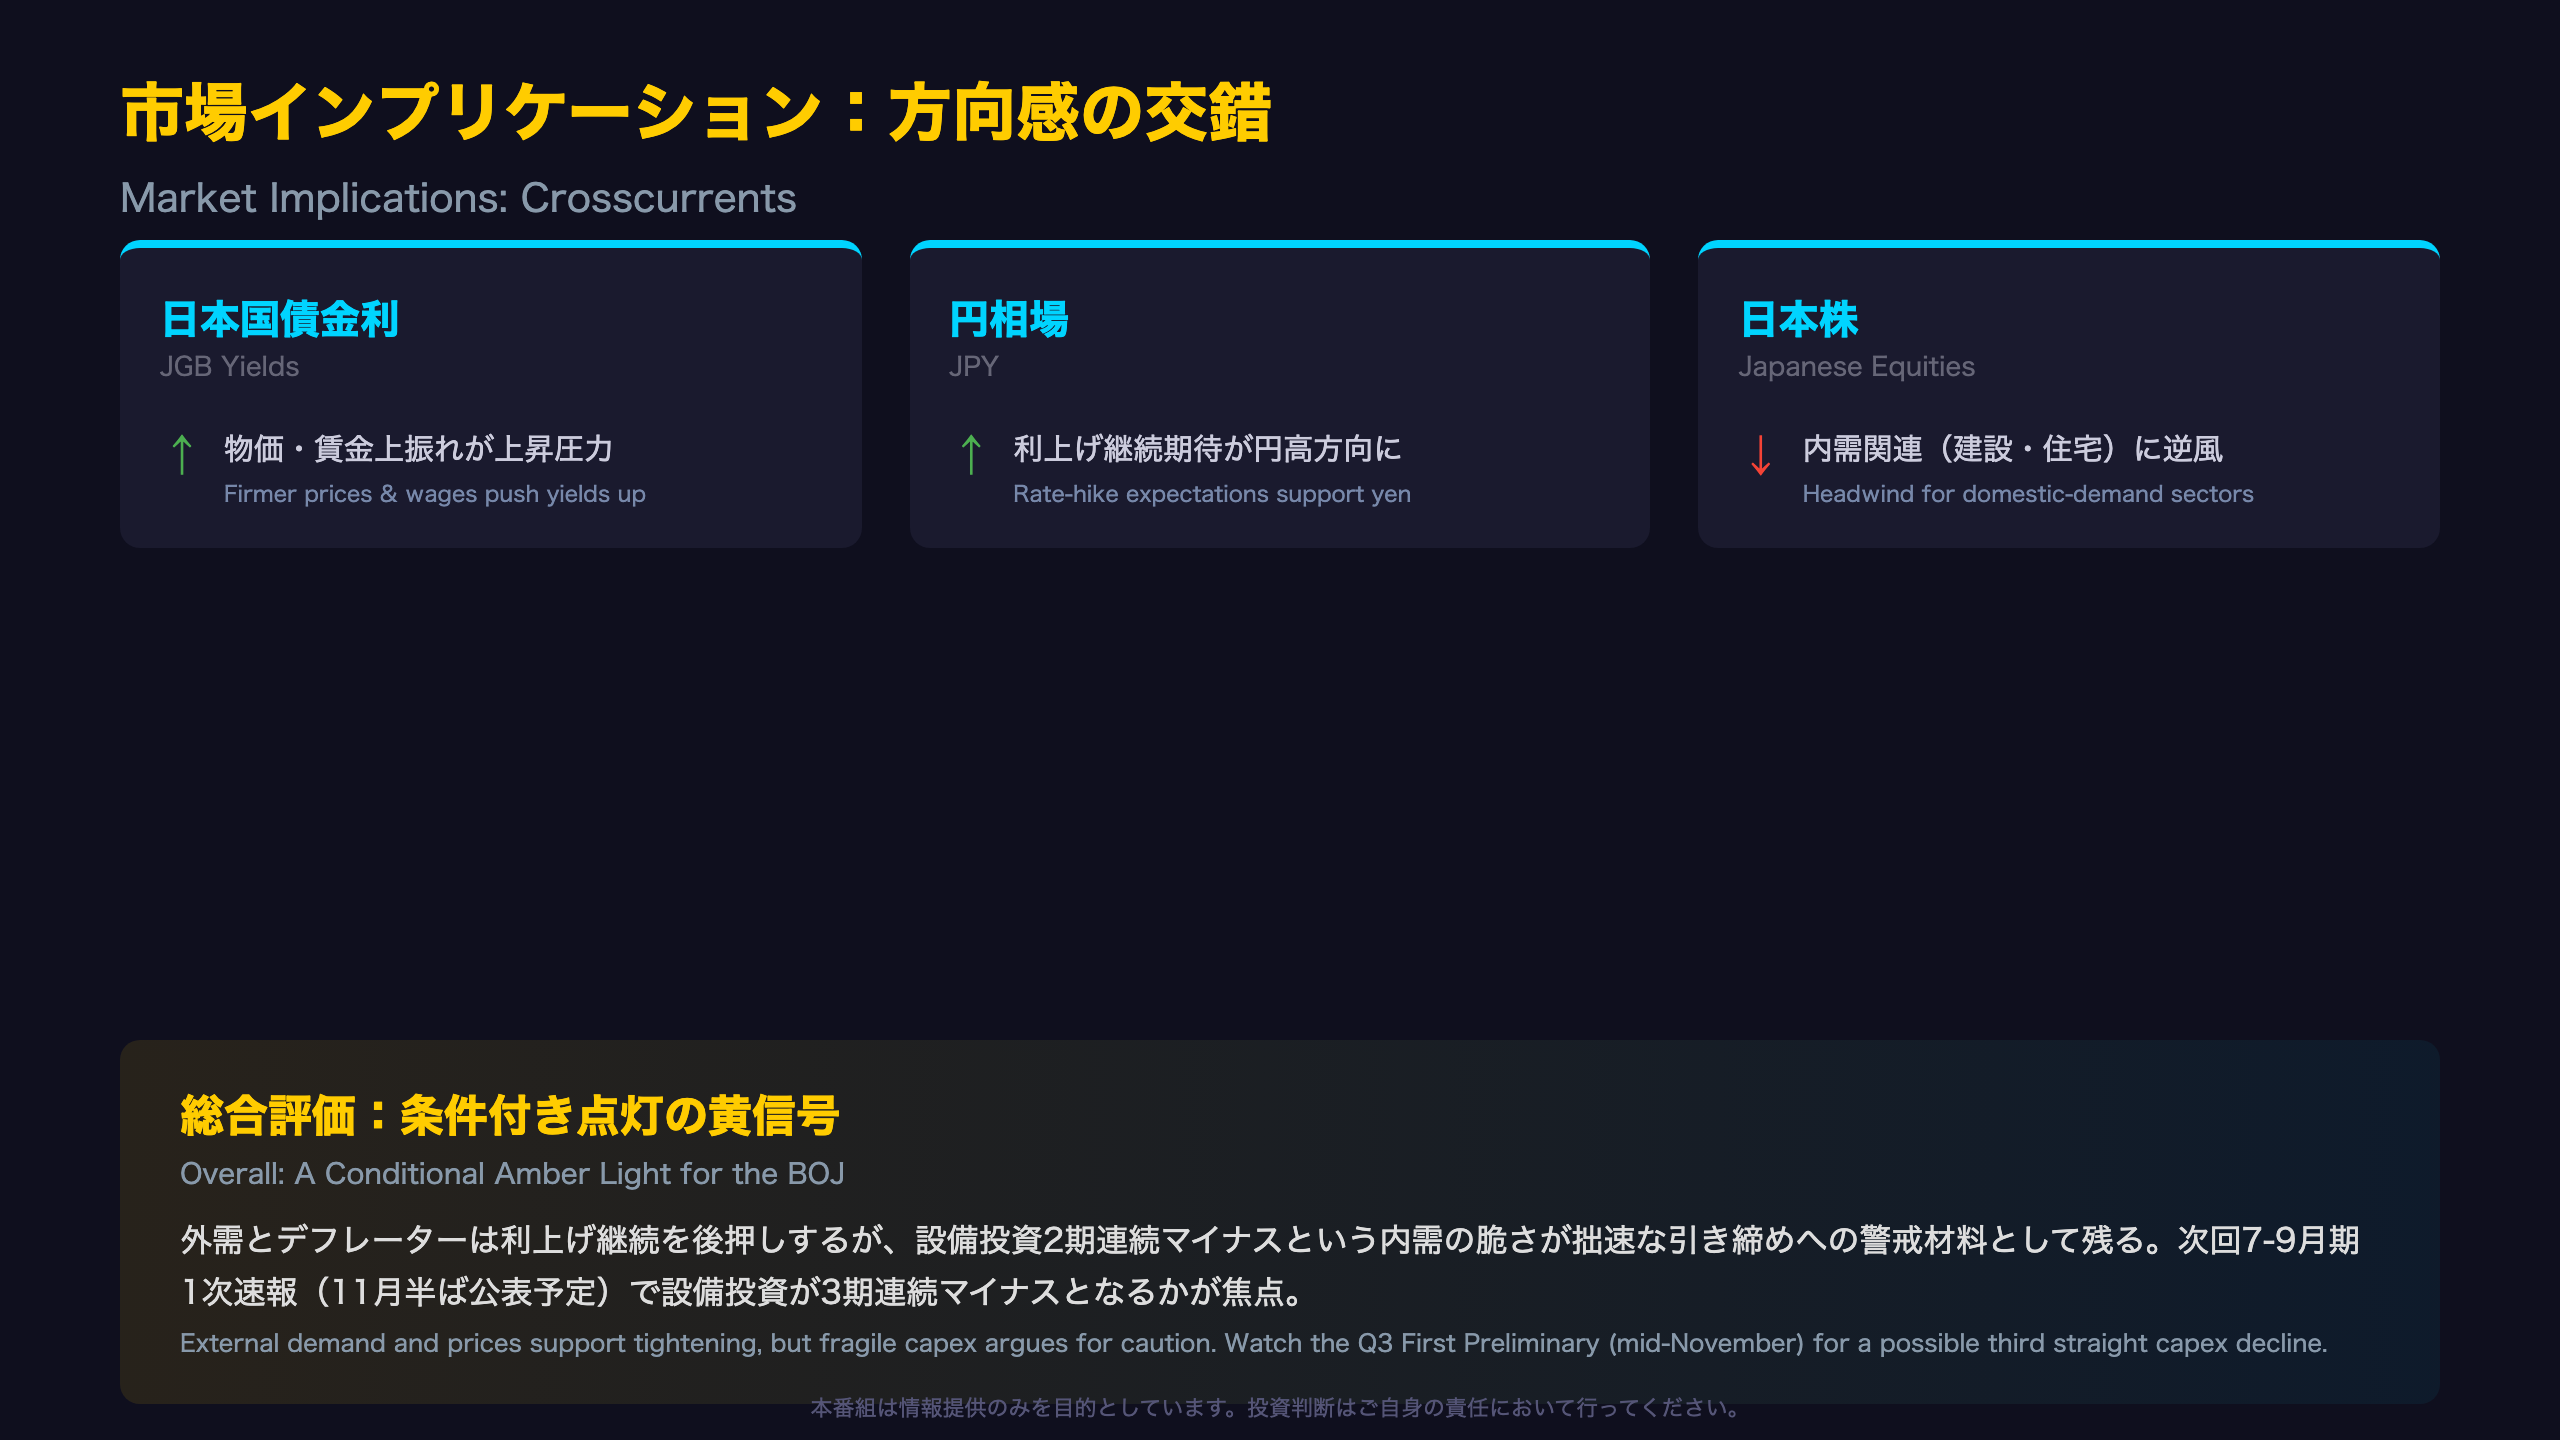
Synthesis: Three Lenses on This GDP Release
Lens 1: Headline Strength
On the surface, the upward revision to real GDP (annualized +1.4%) and nominal GDP (annualized +5.5%) reads as a positive surprise. The sequential deflator upgrade (GDP deflator +1.0%, domestic demand deflator +1.3%) also aligns with the BOJ’s inflation-sustainability narrative.
Lens 2: The Qualitative Weakness of Domestic Demand
Yet domestic demand’s contribution remained negative at -0.1 percentage point, with all three investment pillars—capex (-0.9%, a second straight quarterly decline), housing (-0.6%), and public investment (-0.5%)—in retreat simultaneously. This raises legitimate questions about the underlying resilience of Japan’s real economy, beyond the headline number.
Lens 3: The Bright Spot on the Income Side
On the other hand, real compensation of employees posted a strong upward revision (+1.0% QoQ, +2.5% YoY), consistent with the BOJ’s cherished \”virtuous cycle\” between wages and prices—a potential foundation for consumption recovery over coming quarters.
\”Domestic demand’s contribution was -0.1 percentage point; net exports of goods and services contributed +0.5 percentage point\” — Cabinet Office release
Market Implications (A Balanced View)
- JGB Yields: Firmer deflator and wage data are hawkish signals for the BOJ, though soft capex could temper the pace of any yield rise.
- Japanese Equities: Export-oriented names may see relative resilience, while domestic-demand-sensitive sectors (construction, housing, capital goods) face headwinds—expect sector dispersion rather than a uniform market reaction.
- JPY: Continued rate-hike expectations are yen-supportive, but fragile domestic demand could cap the pace of BOJ tightening, limiting how far yen strength extends.
None of these reads should be treated as definitive from a single data release; the Q3 report will be the key confirming or disconfirming data point.
The next GDP release—Q3 2026 First Preliminary—is expected around mid-November 2026. The central question: will private capex mark a third consecutive quarterly decline?
Disclaimer: This article is for informational purposes only. All investment decisions are made solely at your own risk.