📺 Watch the Full Video Analysis
This article was automatically generated by the NFC Market Live AI analysis system. (Updated: 2026-07-21 15:28 JST)
📄 Primary Source
Statistics Norway
https://www.ssb.no/en/arbeid-og-lonn/sysselsetting/statistikk/arbeidskraftundersokelsen
Statistics Norway’s July 21 Labour Force Survey shows June unemployment flat at 4.7% for a second month, while the employment rate rose to 70.0%.
📊 Headline figures look resilient, but Q1 2026 breakdown data tells a different story.
⚠️ Mid-duration unemployment (14-52 weeks) is rising, and unemployment among women aged 55-74 tripled from 0.7% to 2.2%.
💡 This divergence between stable headlines and deteriorating internals could shape Norges Bank’s rate path and the krone.
Next release: August 13. Q2 breakdown data will reveal whether this is noise or a real shift.
The Ultimate Summary:安定と劣化の分岐点
The Gap Between Headline and Composition
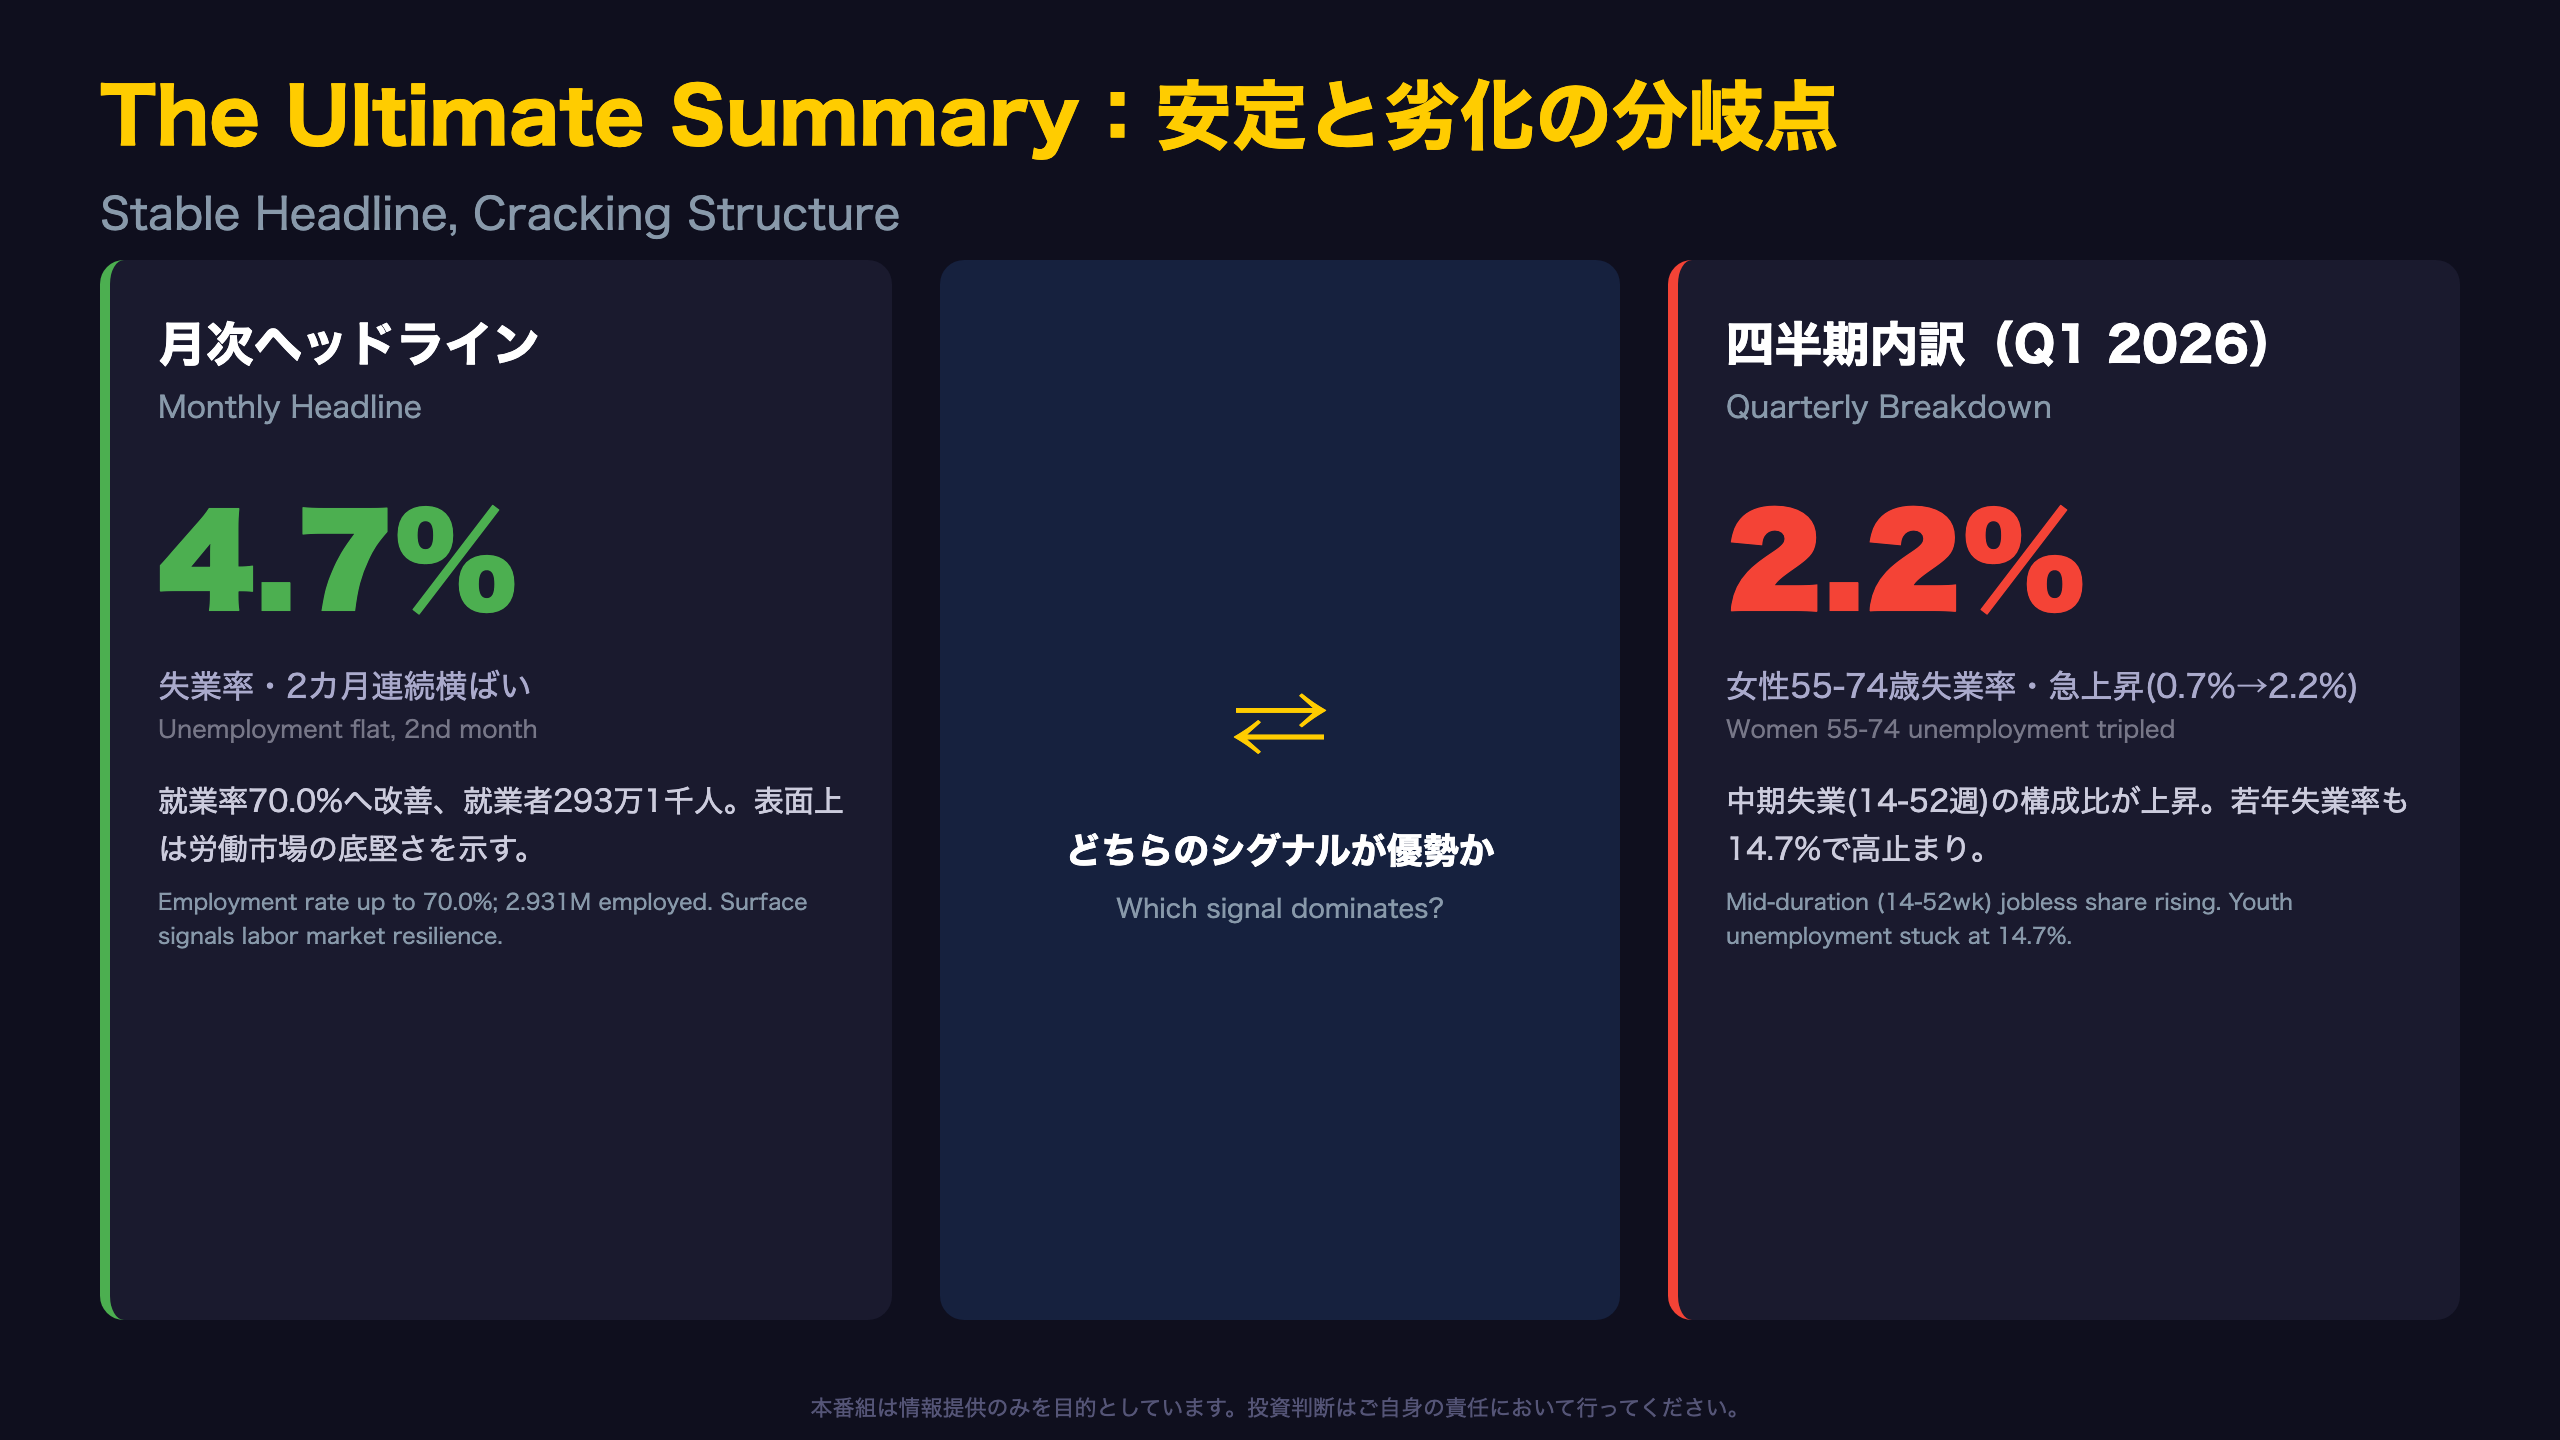
The most important story in this month’s Norwegian Labour Force Survey (LFS) isn’t the headline number itself, but the divergence between the monthly trend and the quarterly breakdown.
What Looks Stable
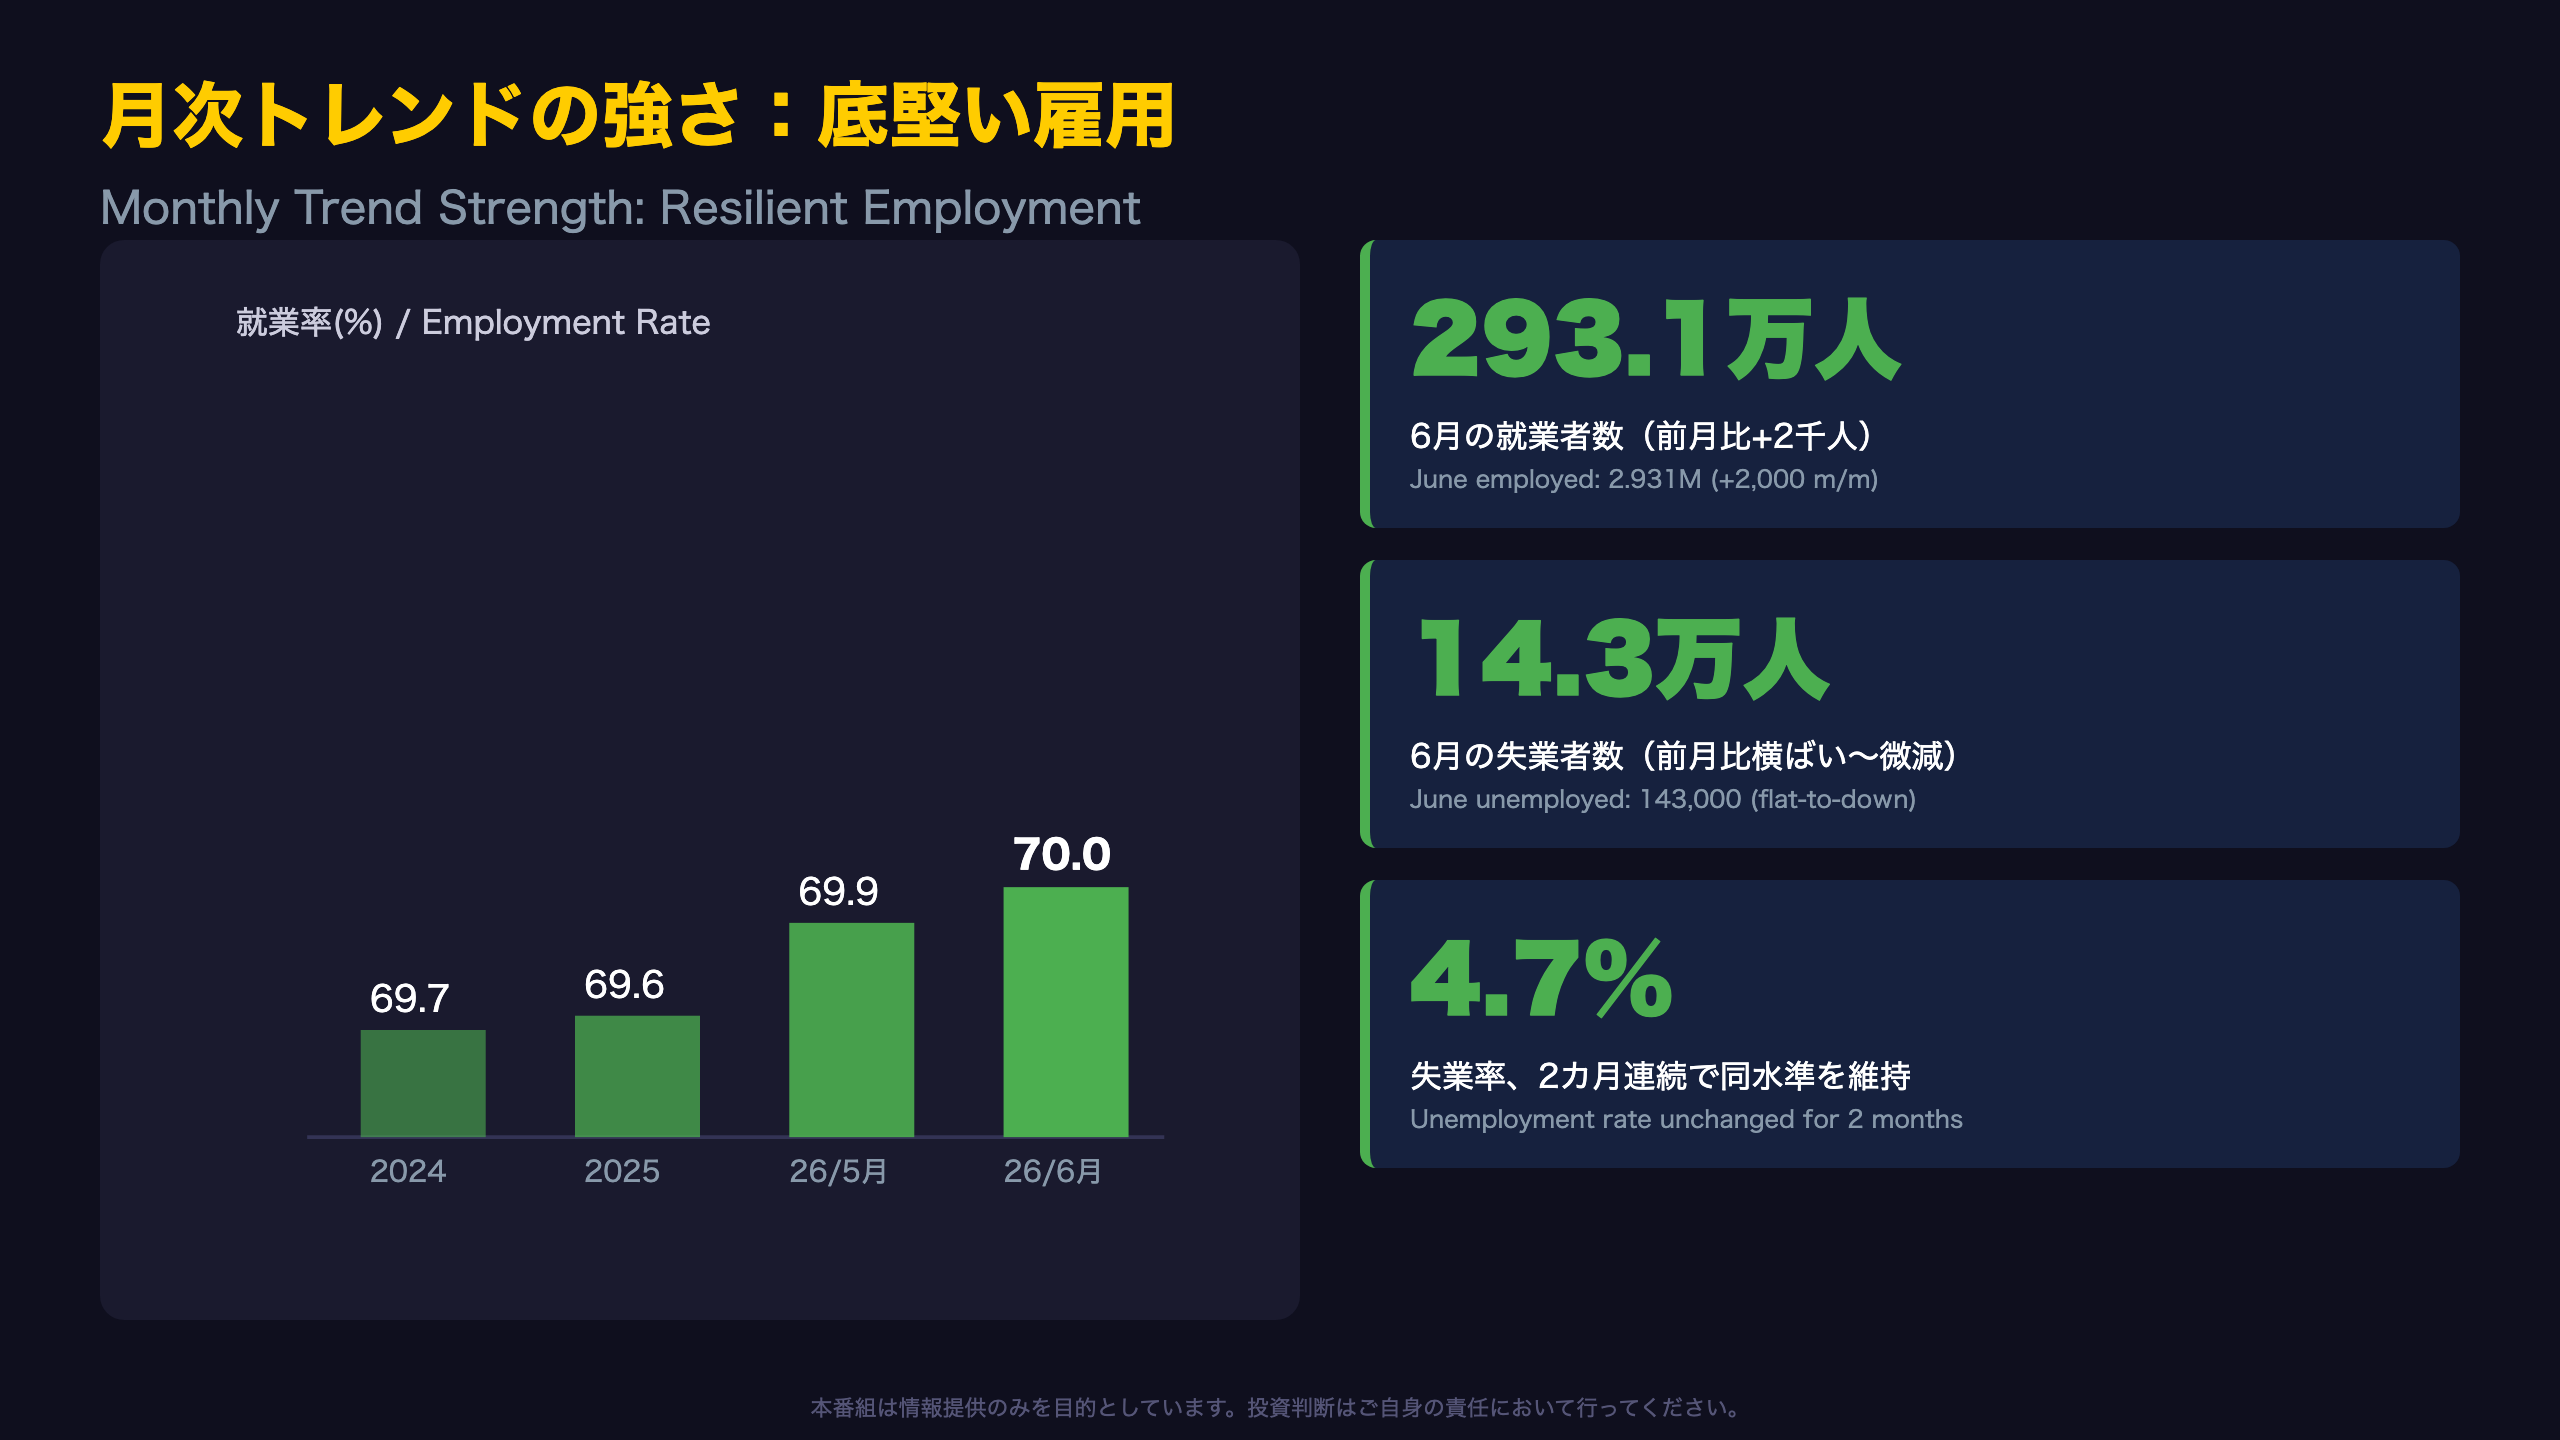
- Unemployment rate: 4.7% (unchanged from May)
- Employment rate: 70.0% (+0.1pt month-on-month)
- Employed persons: 2.931 million (+2,000 m/m)
What Looks Weaker
The latest quarterly data (Q1 2026) shows the share of mid-duration unemployment (14-52 weeks) rising, and unemployment among women aged 55-74 tripling from 0.7% to 2.2%.
Statistics Norway (SSB) defines unemployed persons as those “actively seeking work… and available for work… within the next two weeks.” A rising share of longer-duration jobseekers can reflect a qualitative shift in labor market matching.
Context for International Readers
Unlike the U.S. BLS unemployment rate, Norway’s LFS follows Eurostat/ILO methodology, making it directly comparable across the EU. Norway’s 4.7% compares to a Eurozone average typically in the 6% range, underscoring Norway’s historically tight labor market — which is exactly why any signs of internal softening matter disproportionately to Norges Bank.
Historical Context
Q1 2026’s 4.8% unemployment rate continues an uptrend from 2024’s annual average of 4.0% and 2025’s 4.5%. June’s 4.7% is a marginal improvement within this range, not a clear reversal.
Looking Ahead
The next release lands August 13. Whether the emerging weakness is noise or a genuine structural shift will only become clear once Q2 breakdown data (still pending) is published.
月次トレンドの強さ:就業率が示す底堅さ
What a 70.0% Employment Rate Really Means
An employment rate of 70.0% surpasses 2025’s annual average of 69.6% and nearly matches 2024’s 69.7%. The employed count of 2.931 million has been steadily building from Q4 2025’s trend level of 2.902 million.
Context Within the Labor Force
The labor force itself was roughly flat at 3.032 million in Q1 2026, suggesting the employment gain reflects absorption within the existing labor pool rather than expansion of the labor force itself — a subtle but important distinction for assessing labor market slack.
Unemployment in Context
| Period | Unemployed (thousands) | Rate |
|---|---|---|
| 2025 annual avg | 136 | 4.5% |
| Apr-May 2026 | 145 | 4.7% |
| June 2026 | 143 | 4.7% |
Compared to the 2025 average, unemployment in 2026 has run somewhat elevated, though the past two months show a modest decline.
The Bullish Read
If this improvement is genuine, it reinforces the narrative that Norway’s economy retains job-creation capacity despite broader growth concerns — a signal that would matter to both Norges Bank and NOK-watchers. That said, monthly LFS figures are subject to meaningful revision, so caution against over-interpreting a single month’s move is warranted, consistent with SSB’s own guidance to favor trend and 3-month moving average figures.
四半期内訳の弱さ:失業の長期化
Quantifying the Shift in Unemployment Duration
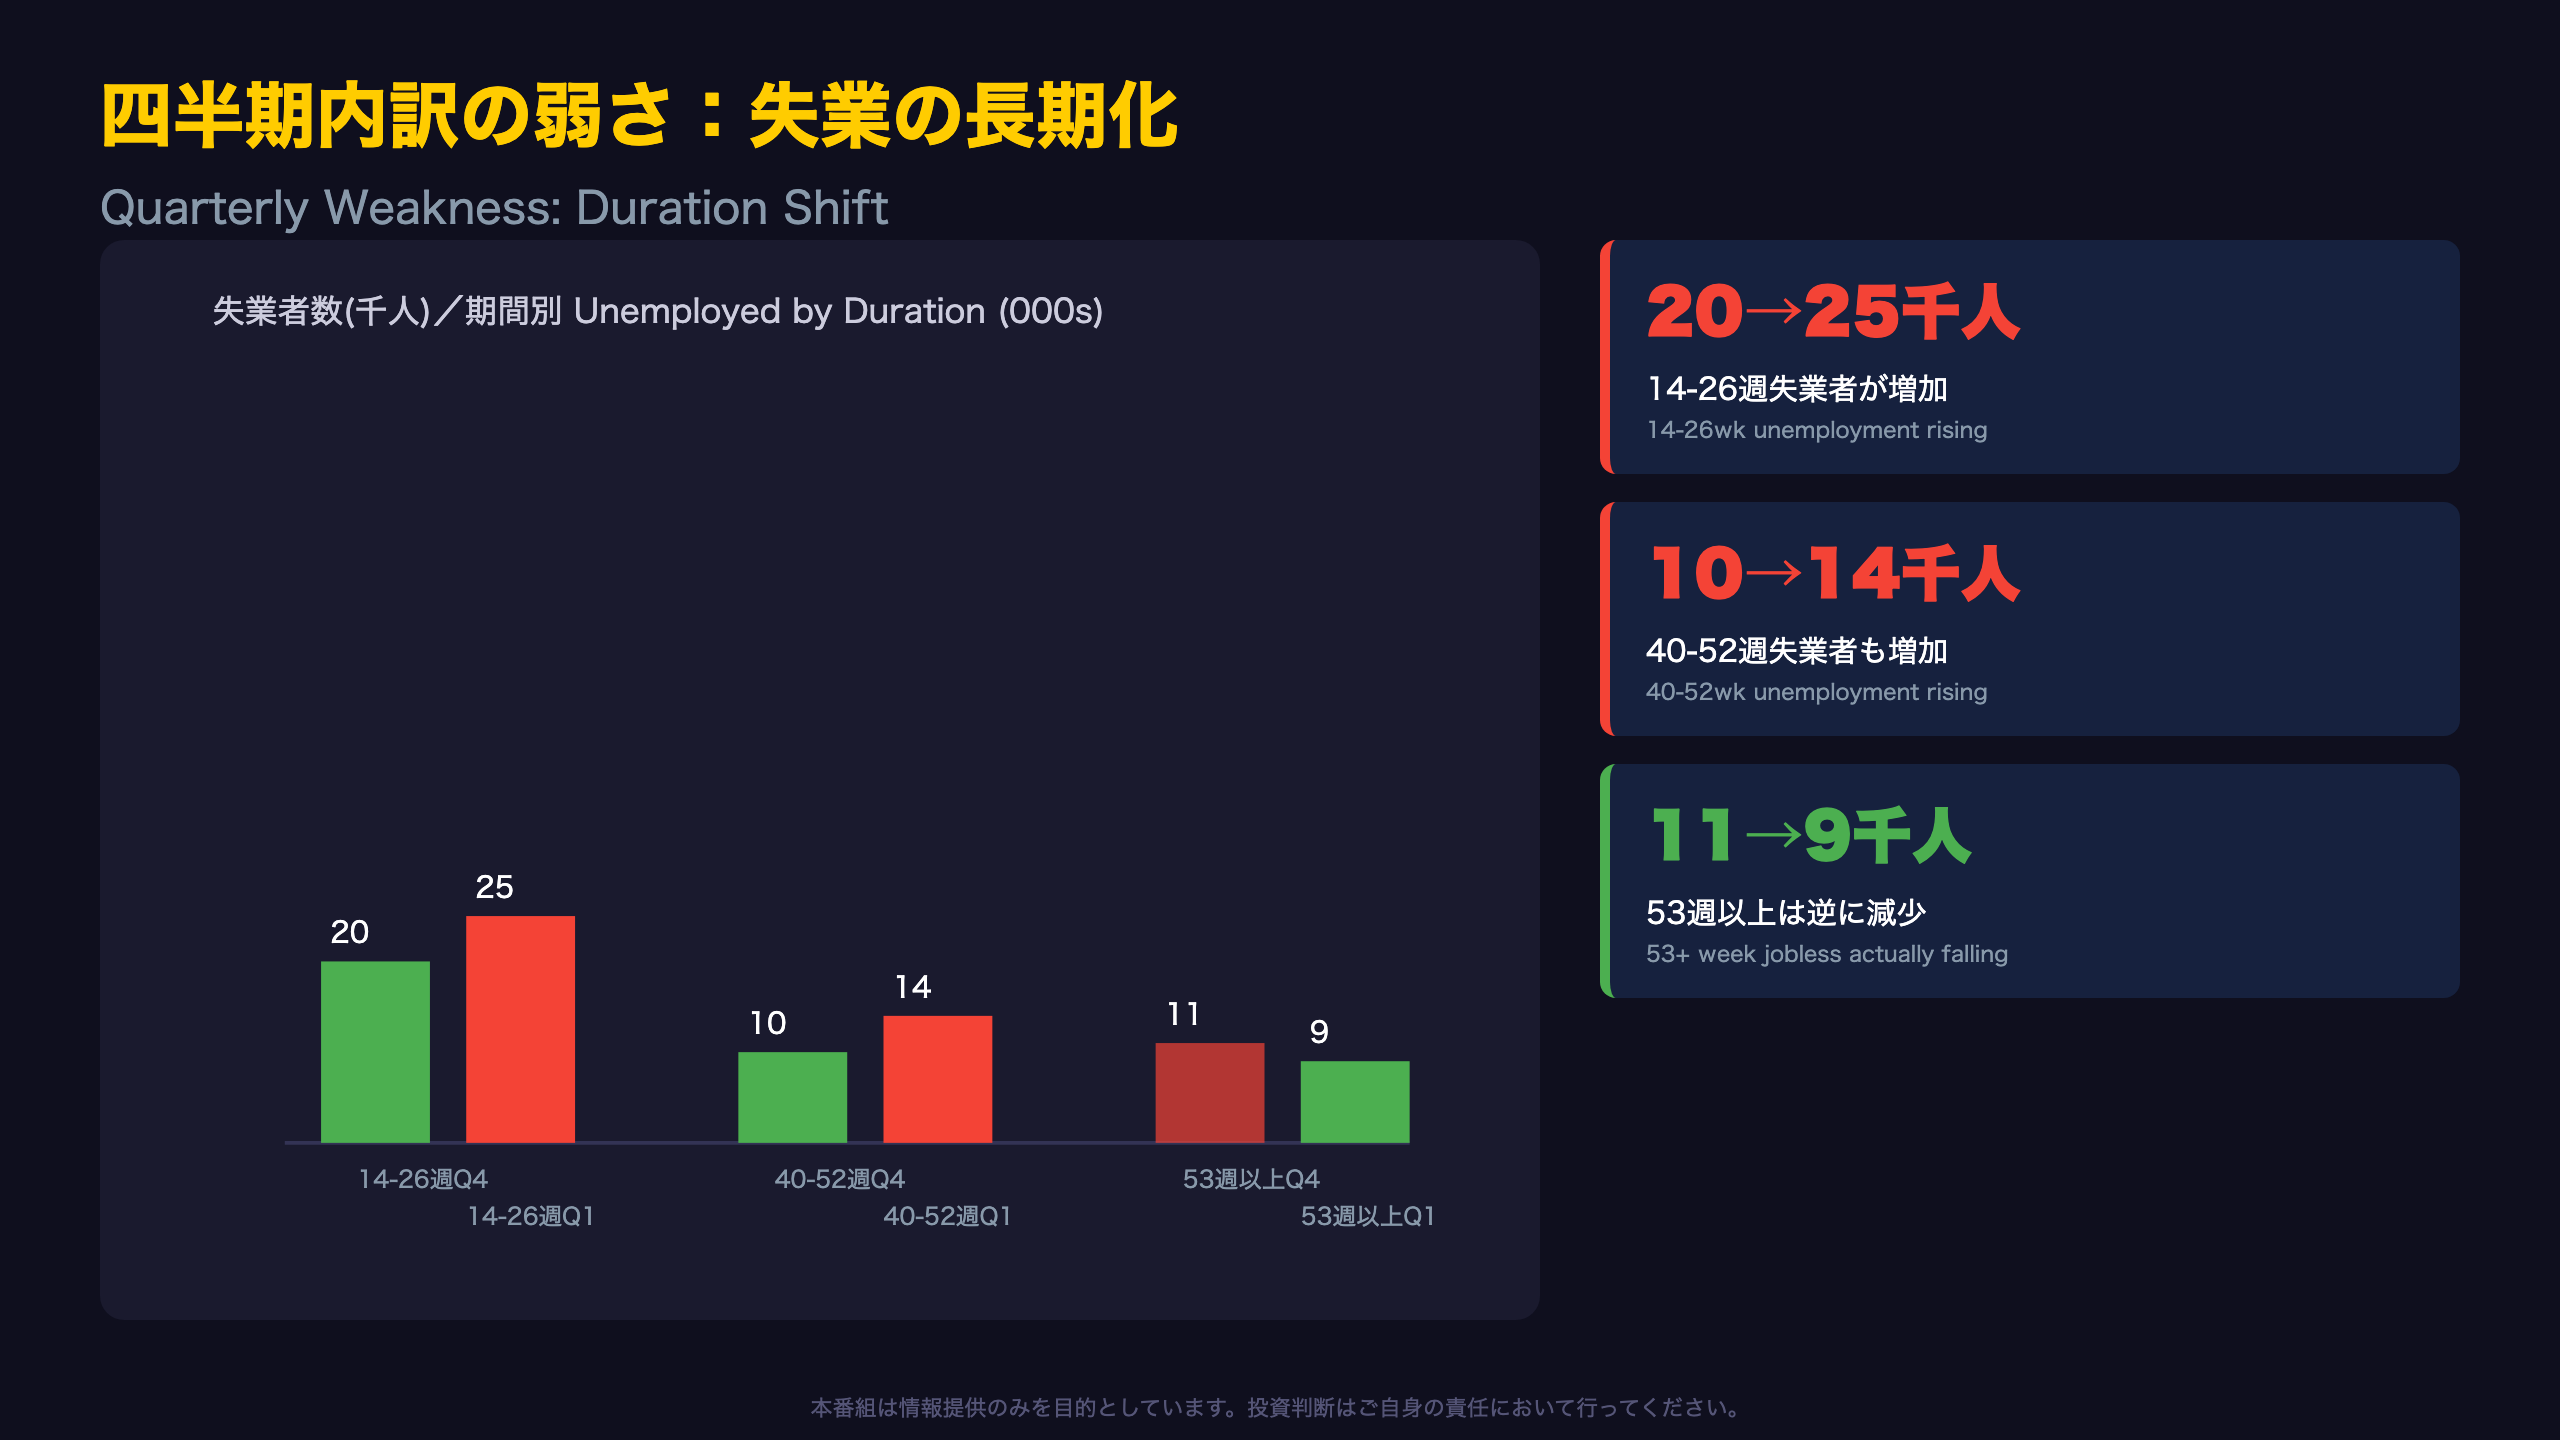
The duration breakdown in Table 5 is unchanged from the prior report (Q1 2026 remains the latest available), but it’s worth unpacking in detail.
| Duration | Q4 2025 (000s / share) | Q1 2026 (000s / share) |
|---|---|---|
| 1-4 weeks | 37 / 29% | 37 / 25% |
| 5-13 weeks | 34 / 27% | 36 / 25% |
| 14-26 weeks | 20 / 16% | 25 / 17% |
| 27-39 weeks | 5 / 4% | 8 / 5% |
| 40-52 weeks | 10 / 8% | 14 / 10% |
| 53+ weeks | 11 / 9% | 9 / 6% |
In absolute terms, the 1-4 week (new jobseeker) count was flat at 37,000, but because the total unemployed pool expanded from 127,000 to 146,000, its share fell from 29% to 25%.
Reading It Both Ways
On the bullish side, unemployment lasting 53+ weeks actually fell from 11,000 to 9,000 — the most extreme long-term joblessness is easing. On the bearish side, the 14-52 week “middle zone” is clearly growing, potentially reflecting hiring-side mismatch or more cautious recruitment amid slower growth — a pattern familiar to observers of European labor markets, where structural mismatch often shows up first in mid-duration statistics rather than headline rates.
A Statistical Caveat
SSB explicitly notes that where gross flows (people moving in and out of unemployment) are large, standard errors should be multiplied by roughly 1.3 — a reminder that quarter-to-quarter shifts here should be read with appropriate caution rather than as confirmed trend breaks.
性別・年齢別ギャップ:見えにくい弱者
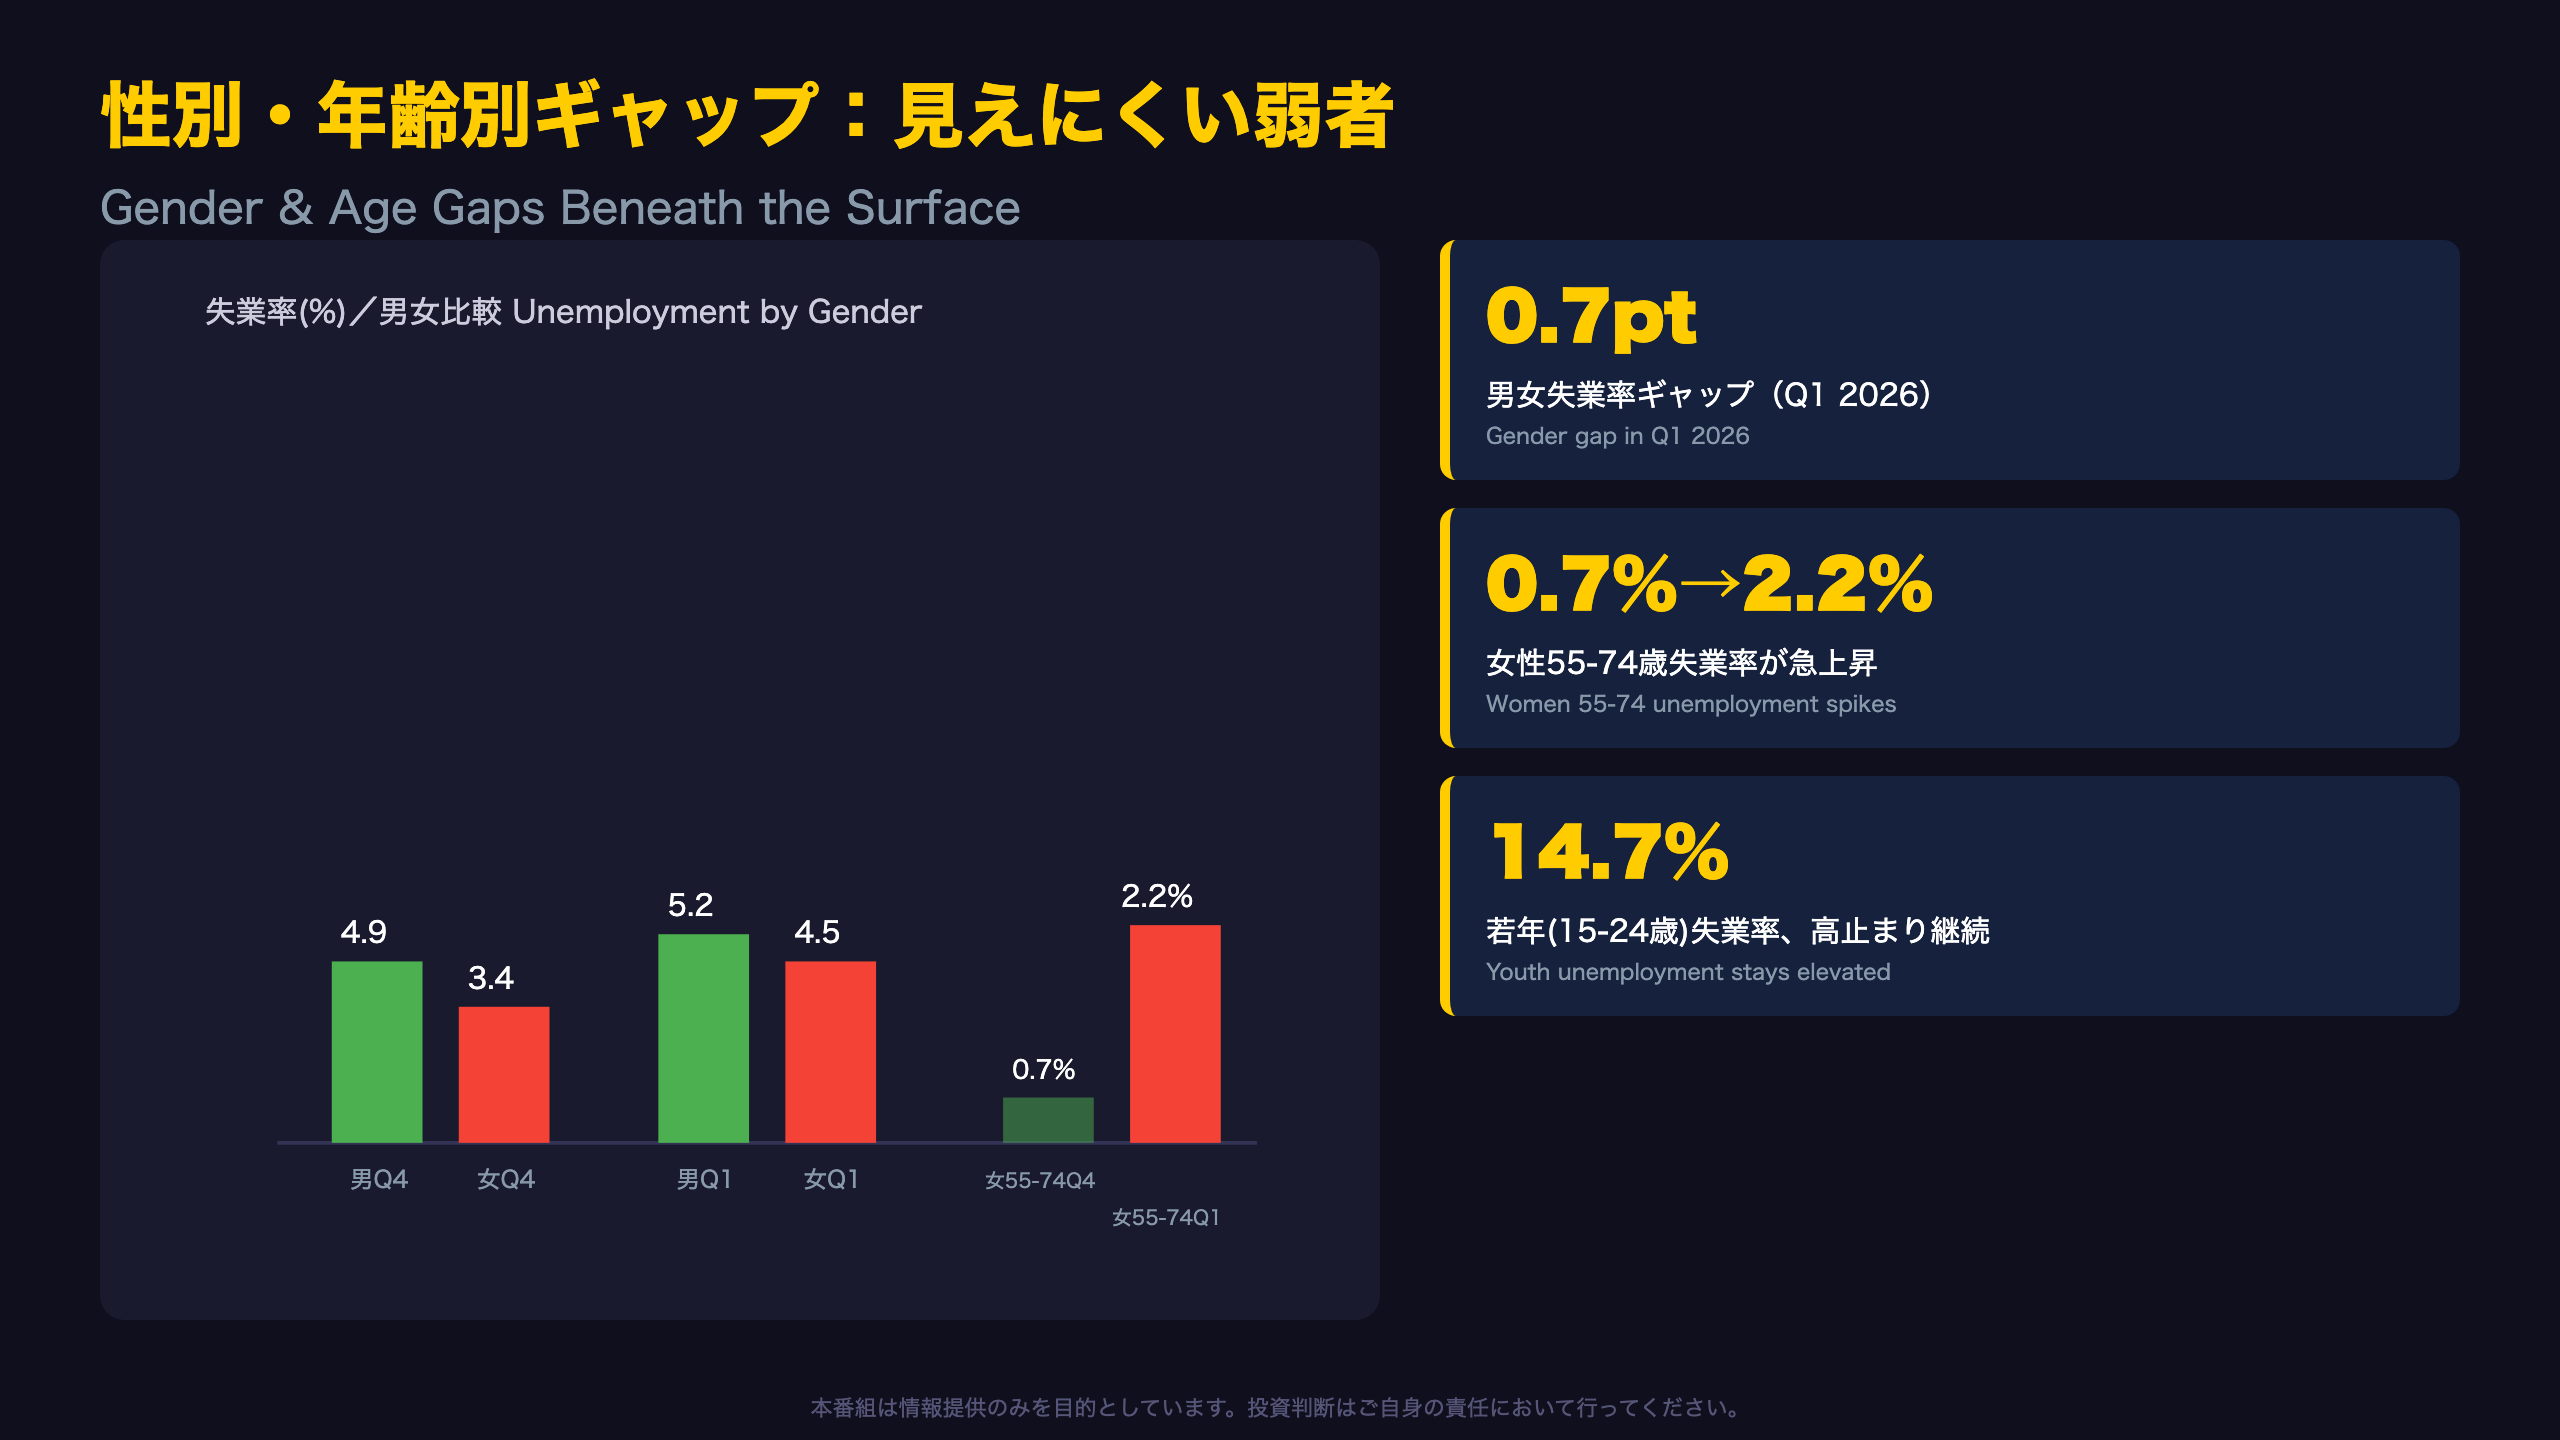
Reading the Gender and Age Breakdown
Table 4’s detailed data reveals distributional shifts invisible in the headline number.
Gender Gap Over Time
| Period | Male Unemployment | Female Unemployment | Gap |
|---|---|---|---|
| 2024 avg | 4.2% | 3.8% | 0.4pt |
| 2025 avg | 4.9% | 4.1% | 0.8pt |
| Q4 2025 | 4.9% | 3.4% | 1.5pt |
| Q1 2026 | 5.2% | 4.5% | 0.7pt |
Interestingly, the gender gap widened to 1.5 points in Q4 2025 before narrowing to 0.7 points in Q1 2026 — suggesting significant quarter-to-quarter volatility rather than a clean widening trend.
The Reality Behind the 55-74 Female Spike
In absolute terms, unemployed women aged 55-74 rose from just 2,000 in Q4 2025 to 7,000 in Q1 2026 — a small base. This age-gender cell has a small sample size, and per SSB’s own quality standards, such narrow cells are prone to large sampling volatility, similar to how thin subsamples in the U.S. BLS Current Population Survey can produce noisy month-to-month readings for small demographic cells.
The Structural Story Behind Youth Unemployment
At 14.7%, youth unemployment (ages 15-24) continues a gradual uptrend from 2024’s 12.1% average and 2025’s 14.0% average — better understood as a multi-year structural drift than a single-quarter blip.
Elevated youth unemployment is a common feature across Nordic labor markets, partly reflecting institutional factors like part-time study combined with job-seeking, which international investors comparing Norway to, say, German or U.S. youth unemployment rates should keep in mind.
インプリケーション:ノルゲスバンクとクローネ
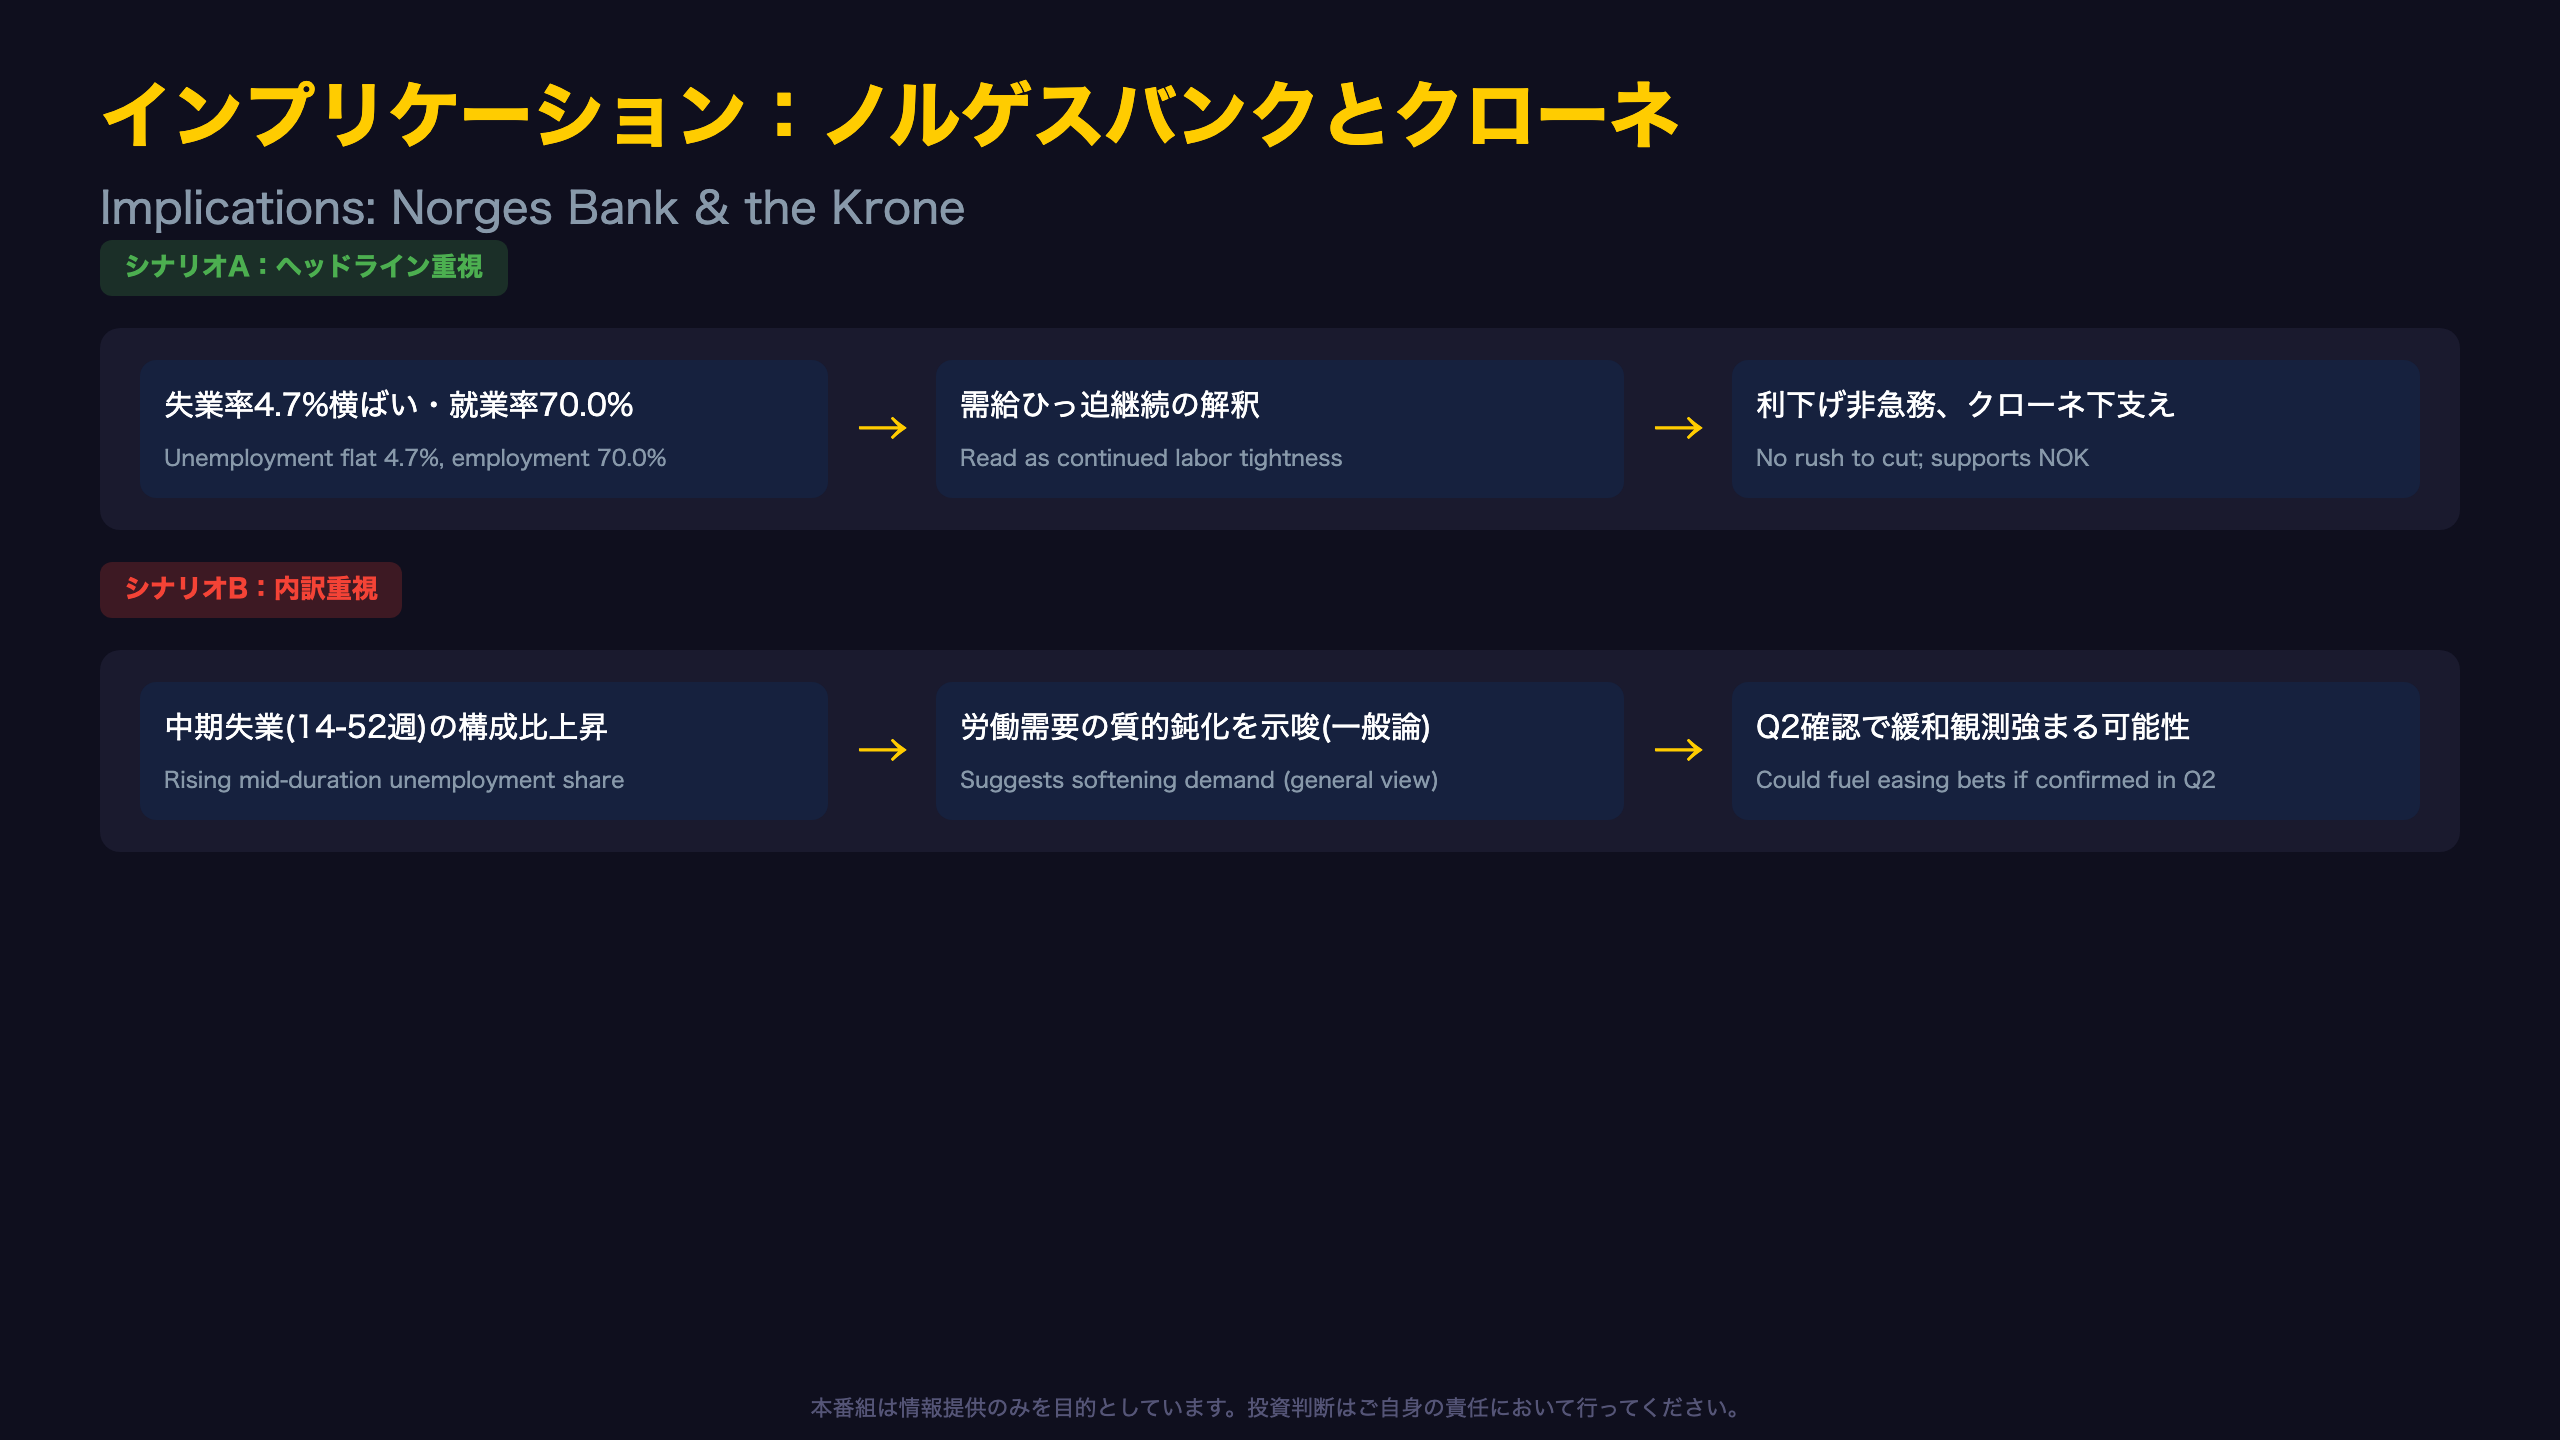
Tracing the Chain of Reasoning to Policy Implications
Scenario A: Headline-Driven Read
“Unemployment flat at 4.7% for two months, employment rate up to 70.0%” → “This can generally be read as continued labor market tightness” → “Norges Bank may see less urgency to cut rates or may maintain a firmer stance, which could support the krone.”
Scenario B: Composition-Driven Read
“Q1 2026 shows a rising share of mid-duration (14-52 week) unemployment” → “Longer unemployment duration is generally considered a lagging signal of hiring mismatch or softening labor demand, though this single dataset cannot confirm a structural trend” → “If confirmed in Q2 data, this could strengthen expectations for a future Norges Bank easing pivot.”
Transmission to FX and Rates
Norges Bank has historically anchored policy primarily to headline unemployment and inflation figures. Since today’s headline reads flat-to-improving, it’s unlikely to trigger an immediate shift in near-term policy stance — a dynamic international investors comparing this to the Federal Reserve’s dual mandate framework will find familiar. That said, central bank staff analyses (including labor market slack concepts encompassing the potential labor force) also track quarterly composition data, meaning today’s rise in mid-duration unemployment could become a secondary factor supporting an eventual dovish pivot, particularly if inflation continues to cool.
What to Watch Next
Beyond the August 13 monthly release, the next Q2 quarterly breakdown (typically 5-6 weeks later) will be the key test of whether the moves in women aged 55-74 and 14-52 week unemployment persist. Distinguishing single-quarter noise from a genuine structural shift will require accumulating data across multiple periods — a discipline that applies equally to interpreting Fed or ECB labor data.
Disclaimer: This article is for informational purposes only. All investment decisions are made solely at your own risk.