📺 Watch the Full Video Analysis
This article was automatically generated by the NFC Market Live AI analysis system. (Updated: 2026-09-17 03:14 JST)
📄 Primary Source
Federal Reserve
https://www.federalreserve.gov/monetarypolicy/fomcprojtabl20260916.htm
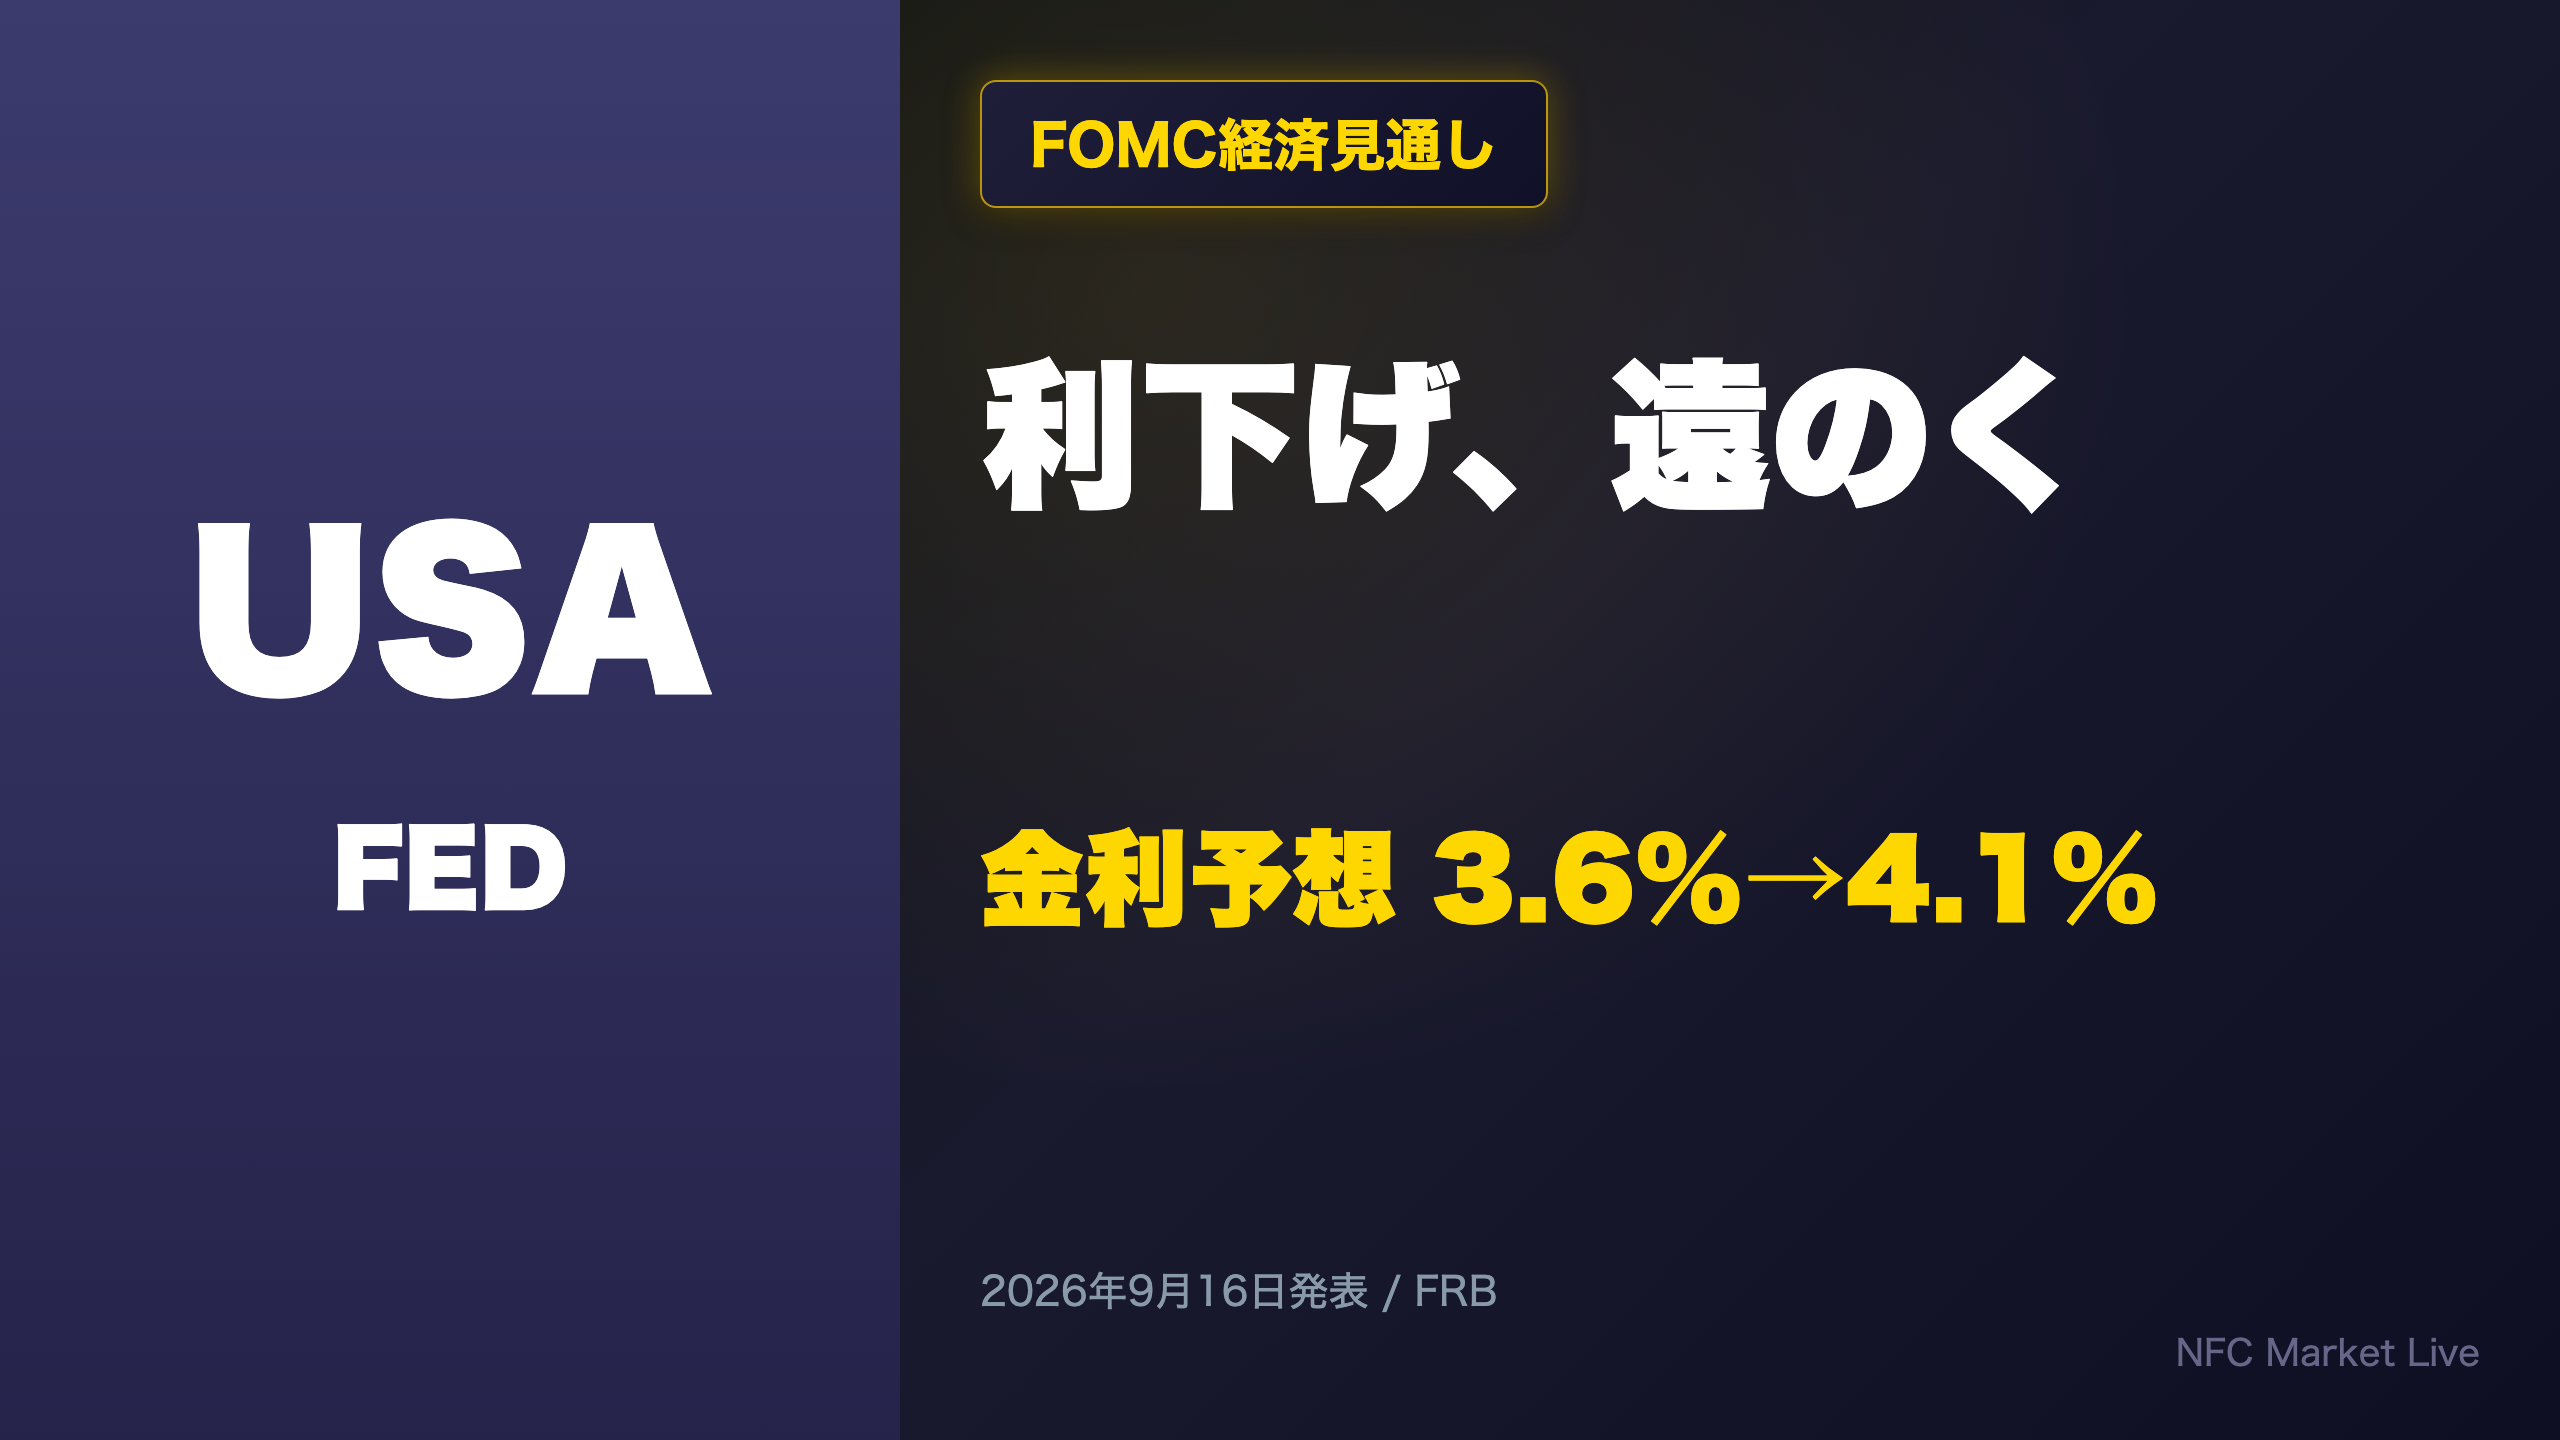
📊 The Fed released its September 2026 Summary of Economic Projections (SEP).
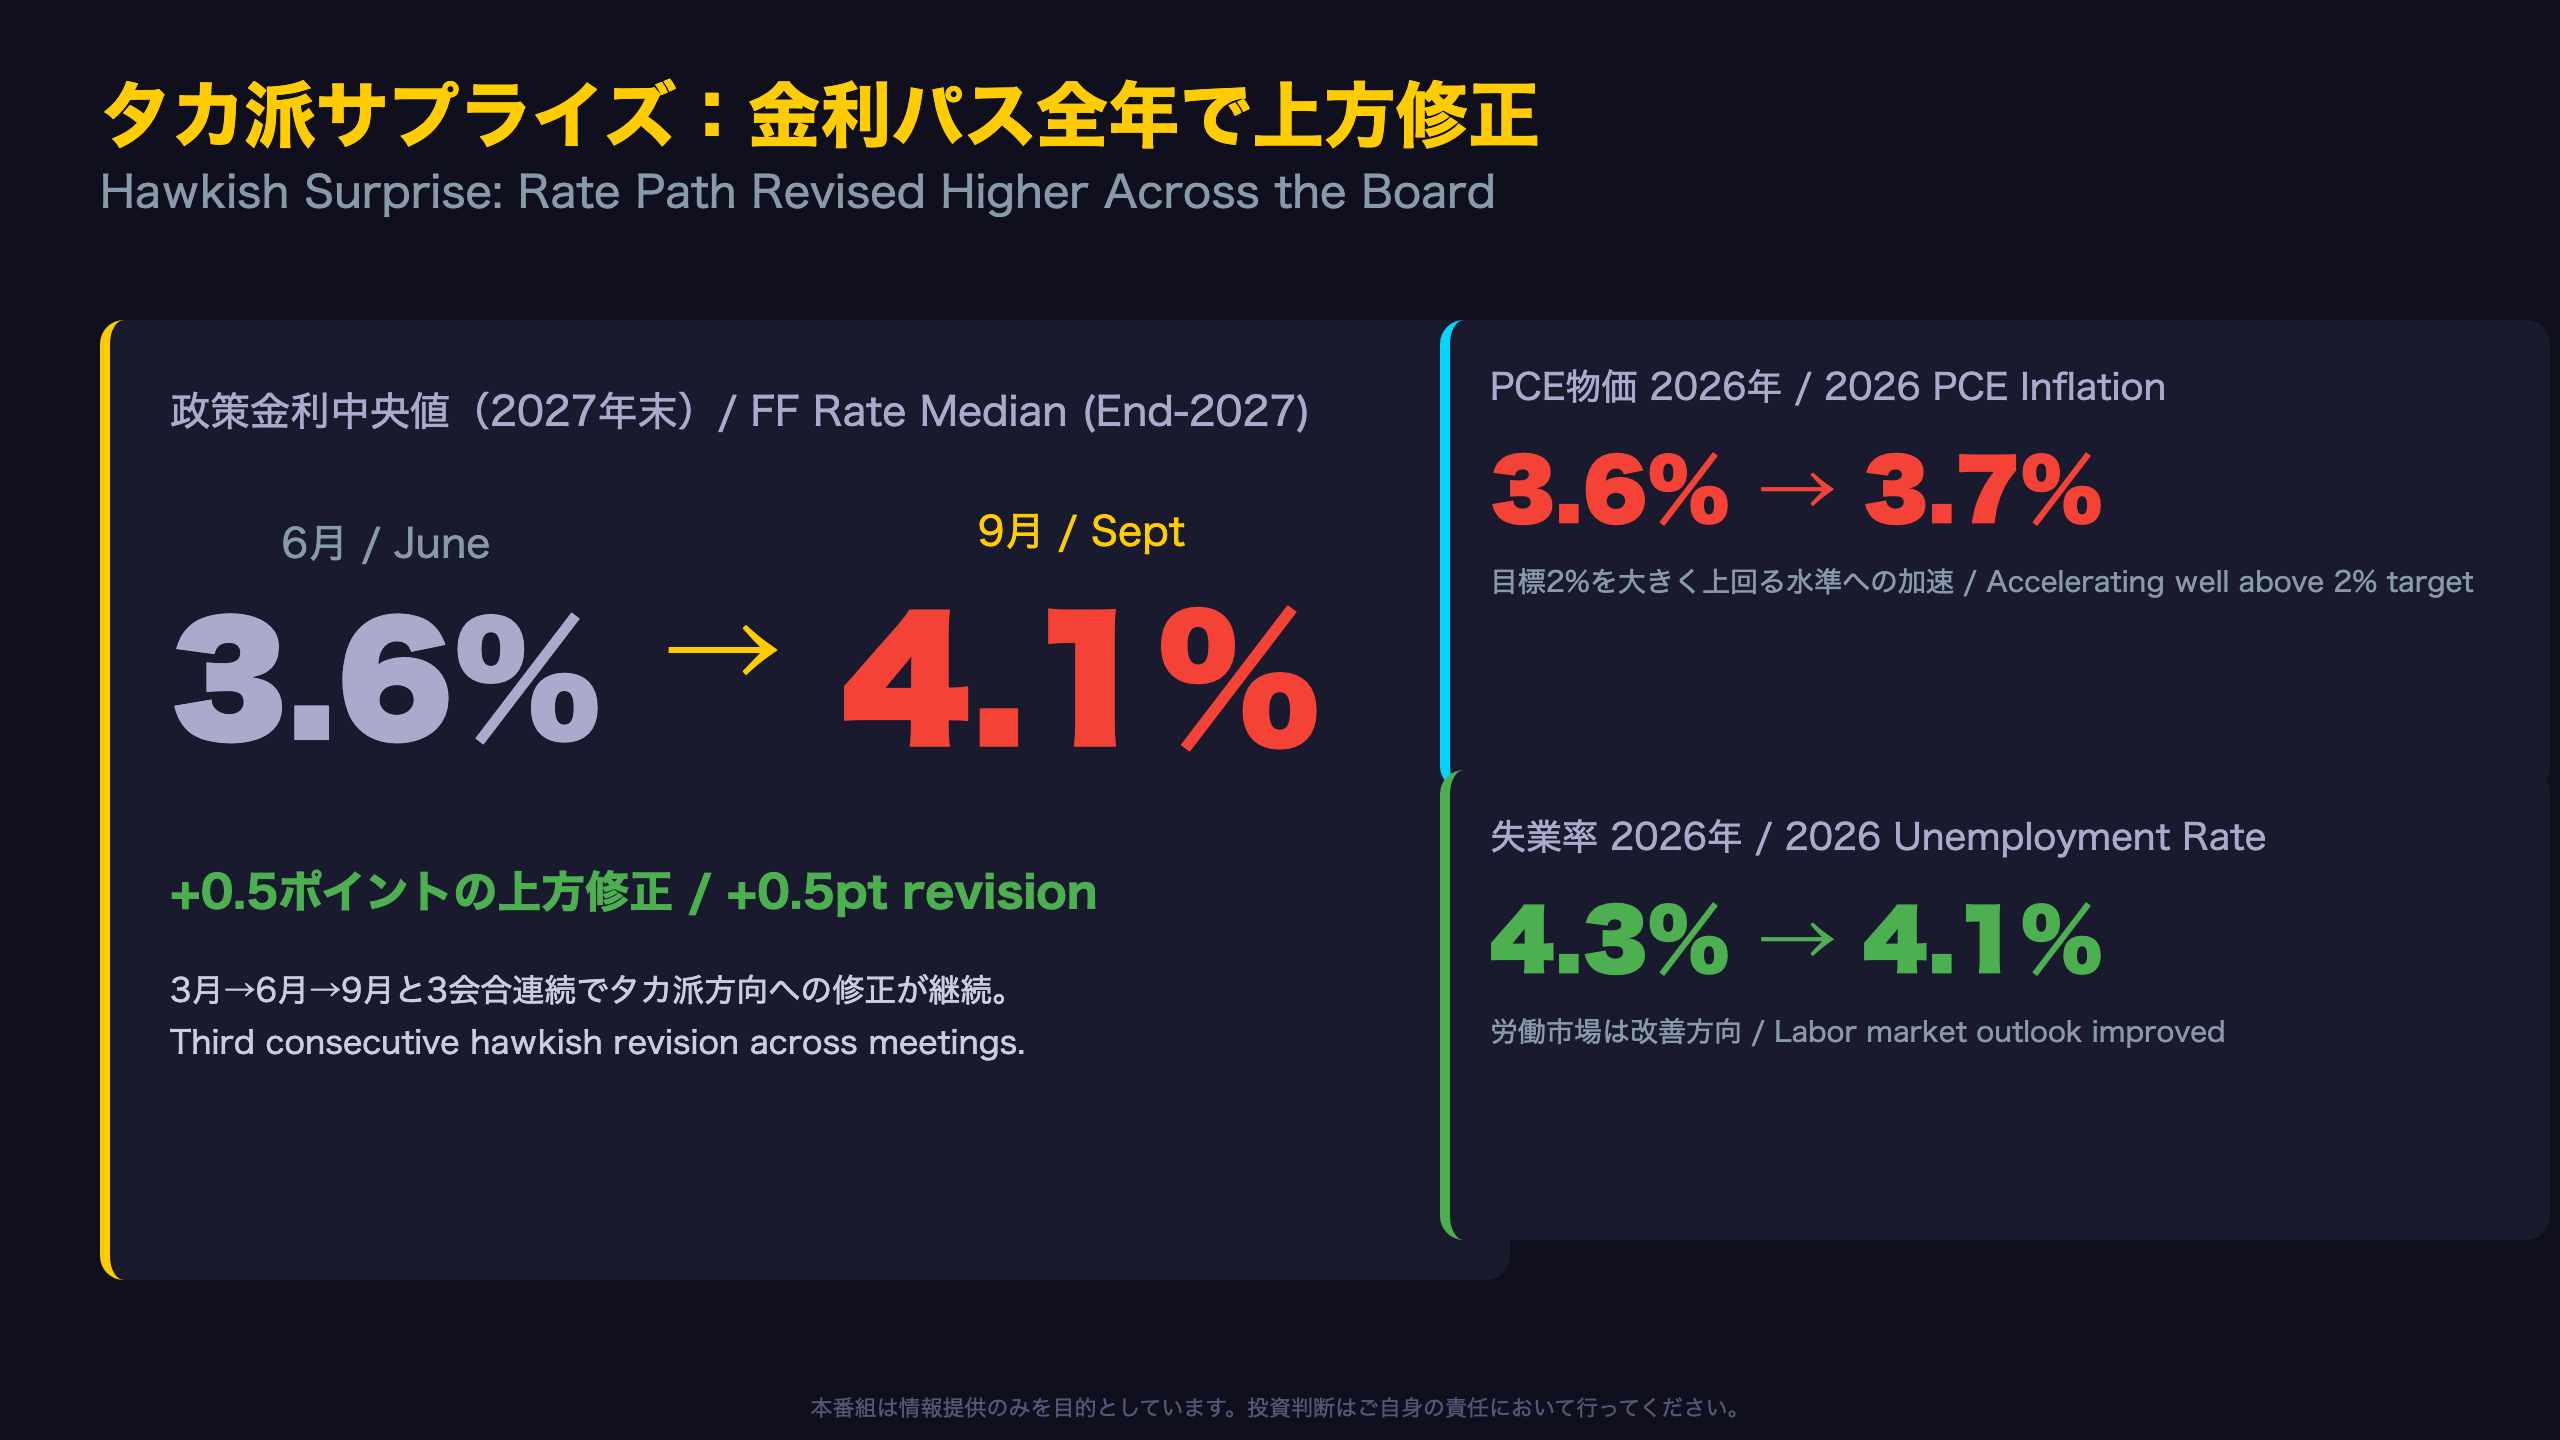
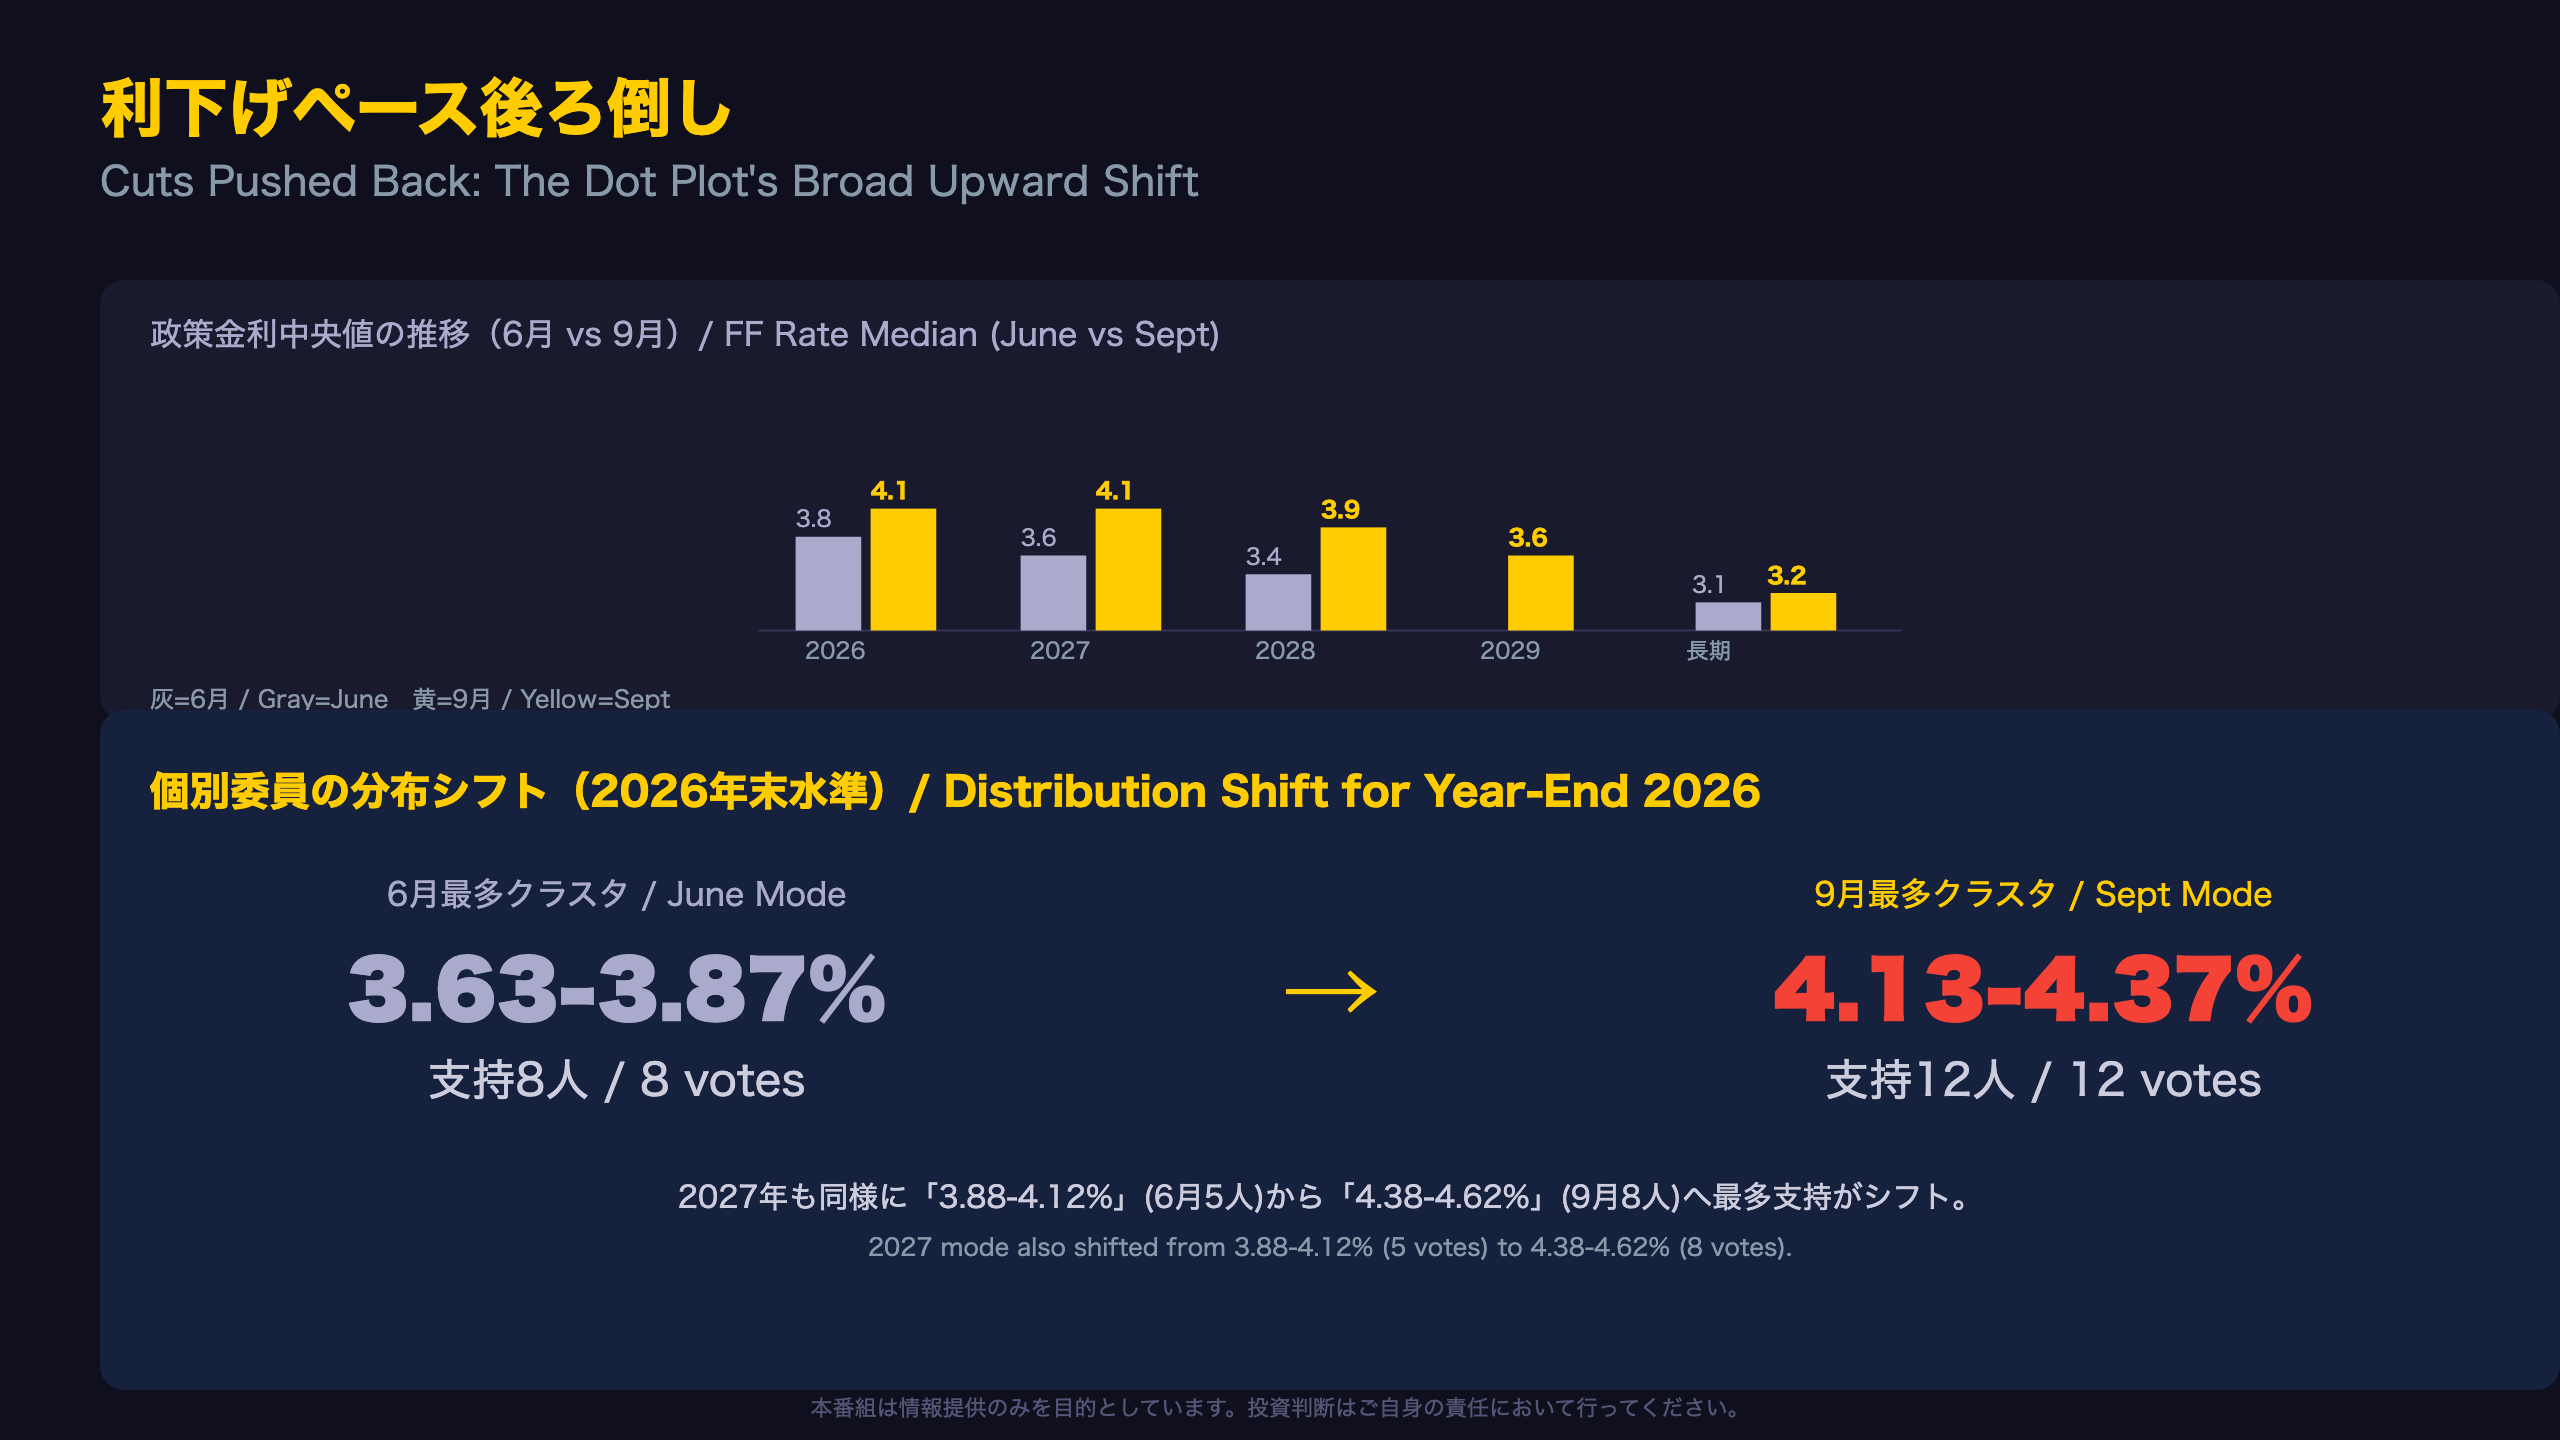
📈 The biggest surprise: the median federal funds rate for year-end 2027 jumped from 3.6% to 4.1% in just three months.
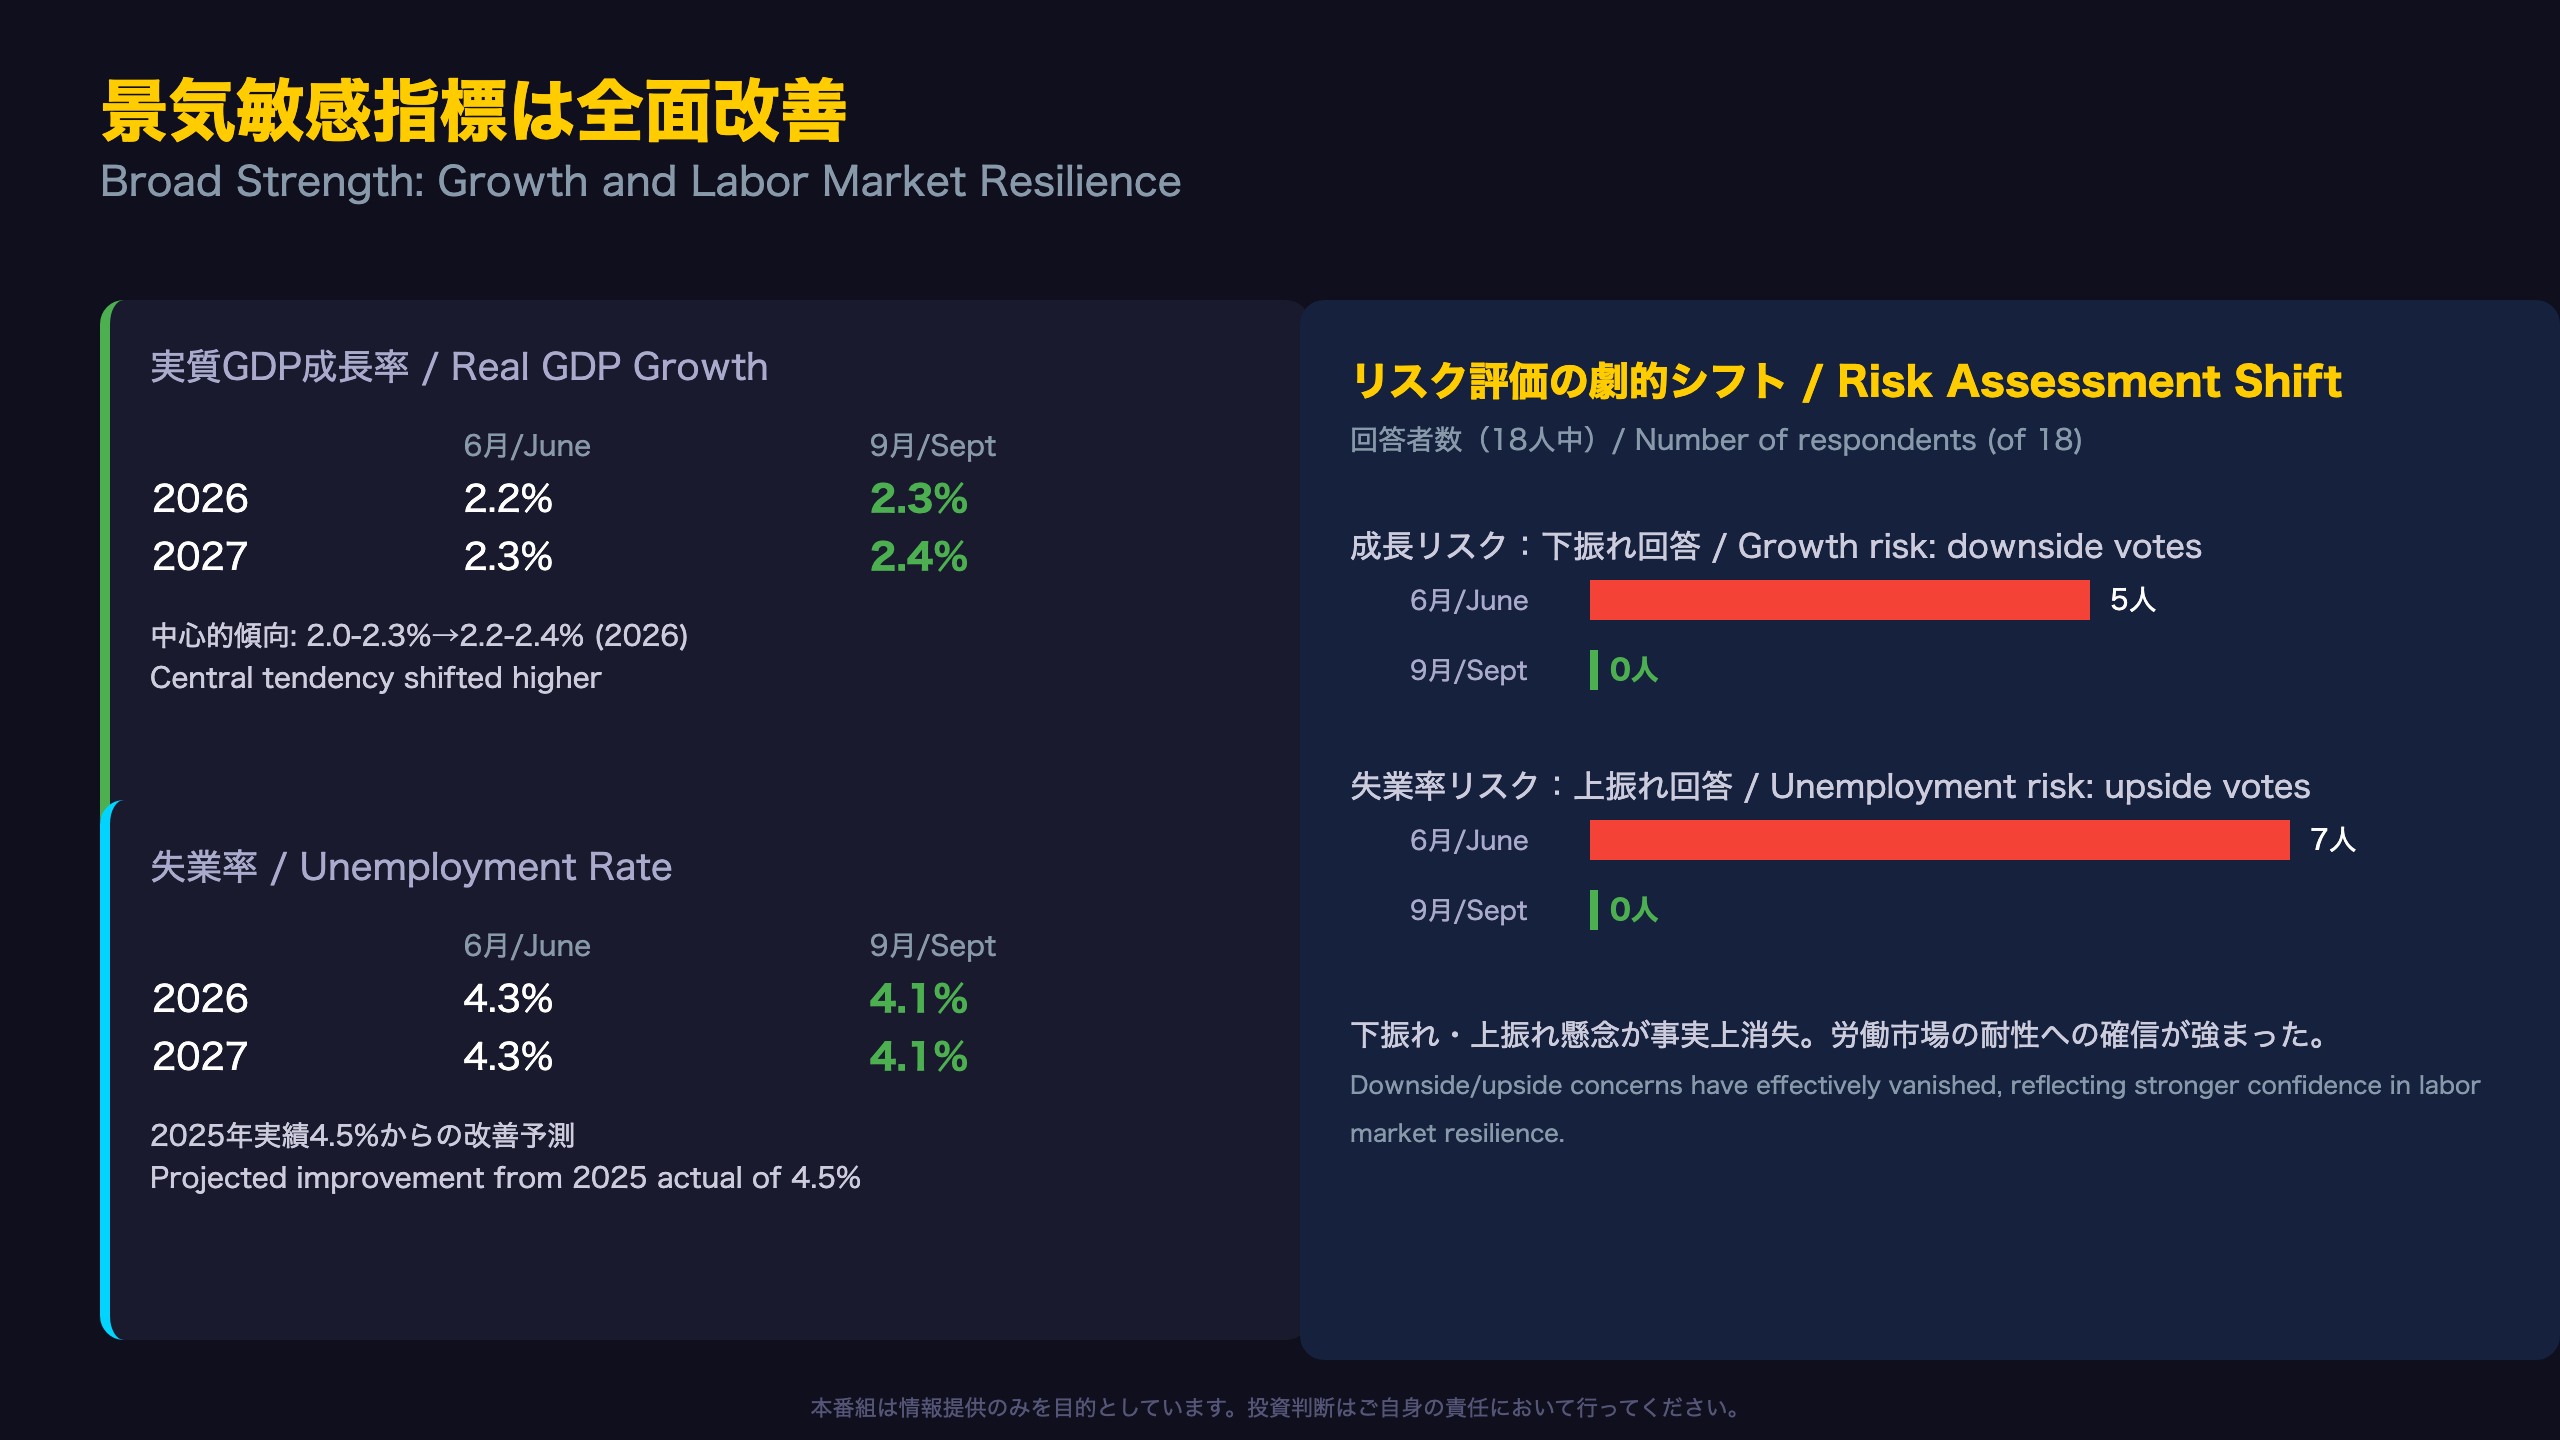
💪 Meanwhile, unemployment forecasts improved (4.3%→4.1%) and GDP growth was revised higher — signs of real resilience.
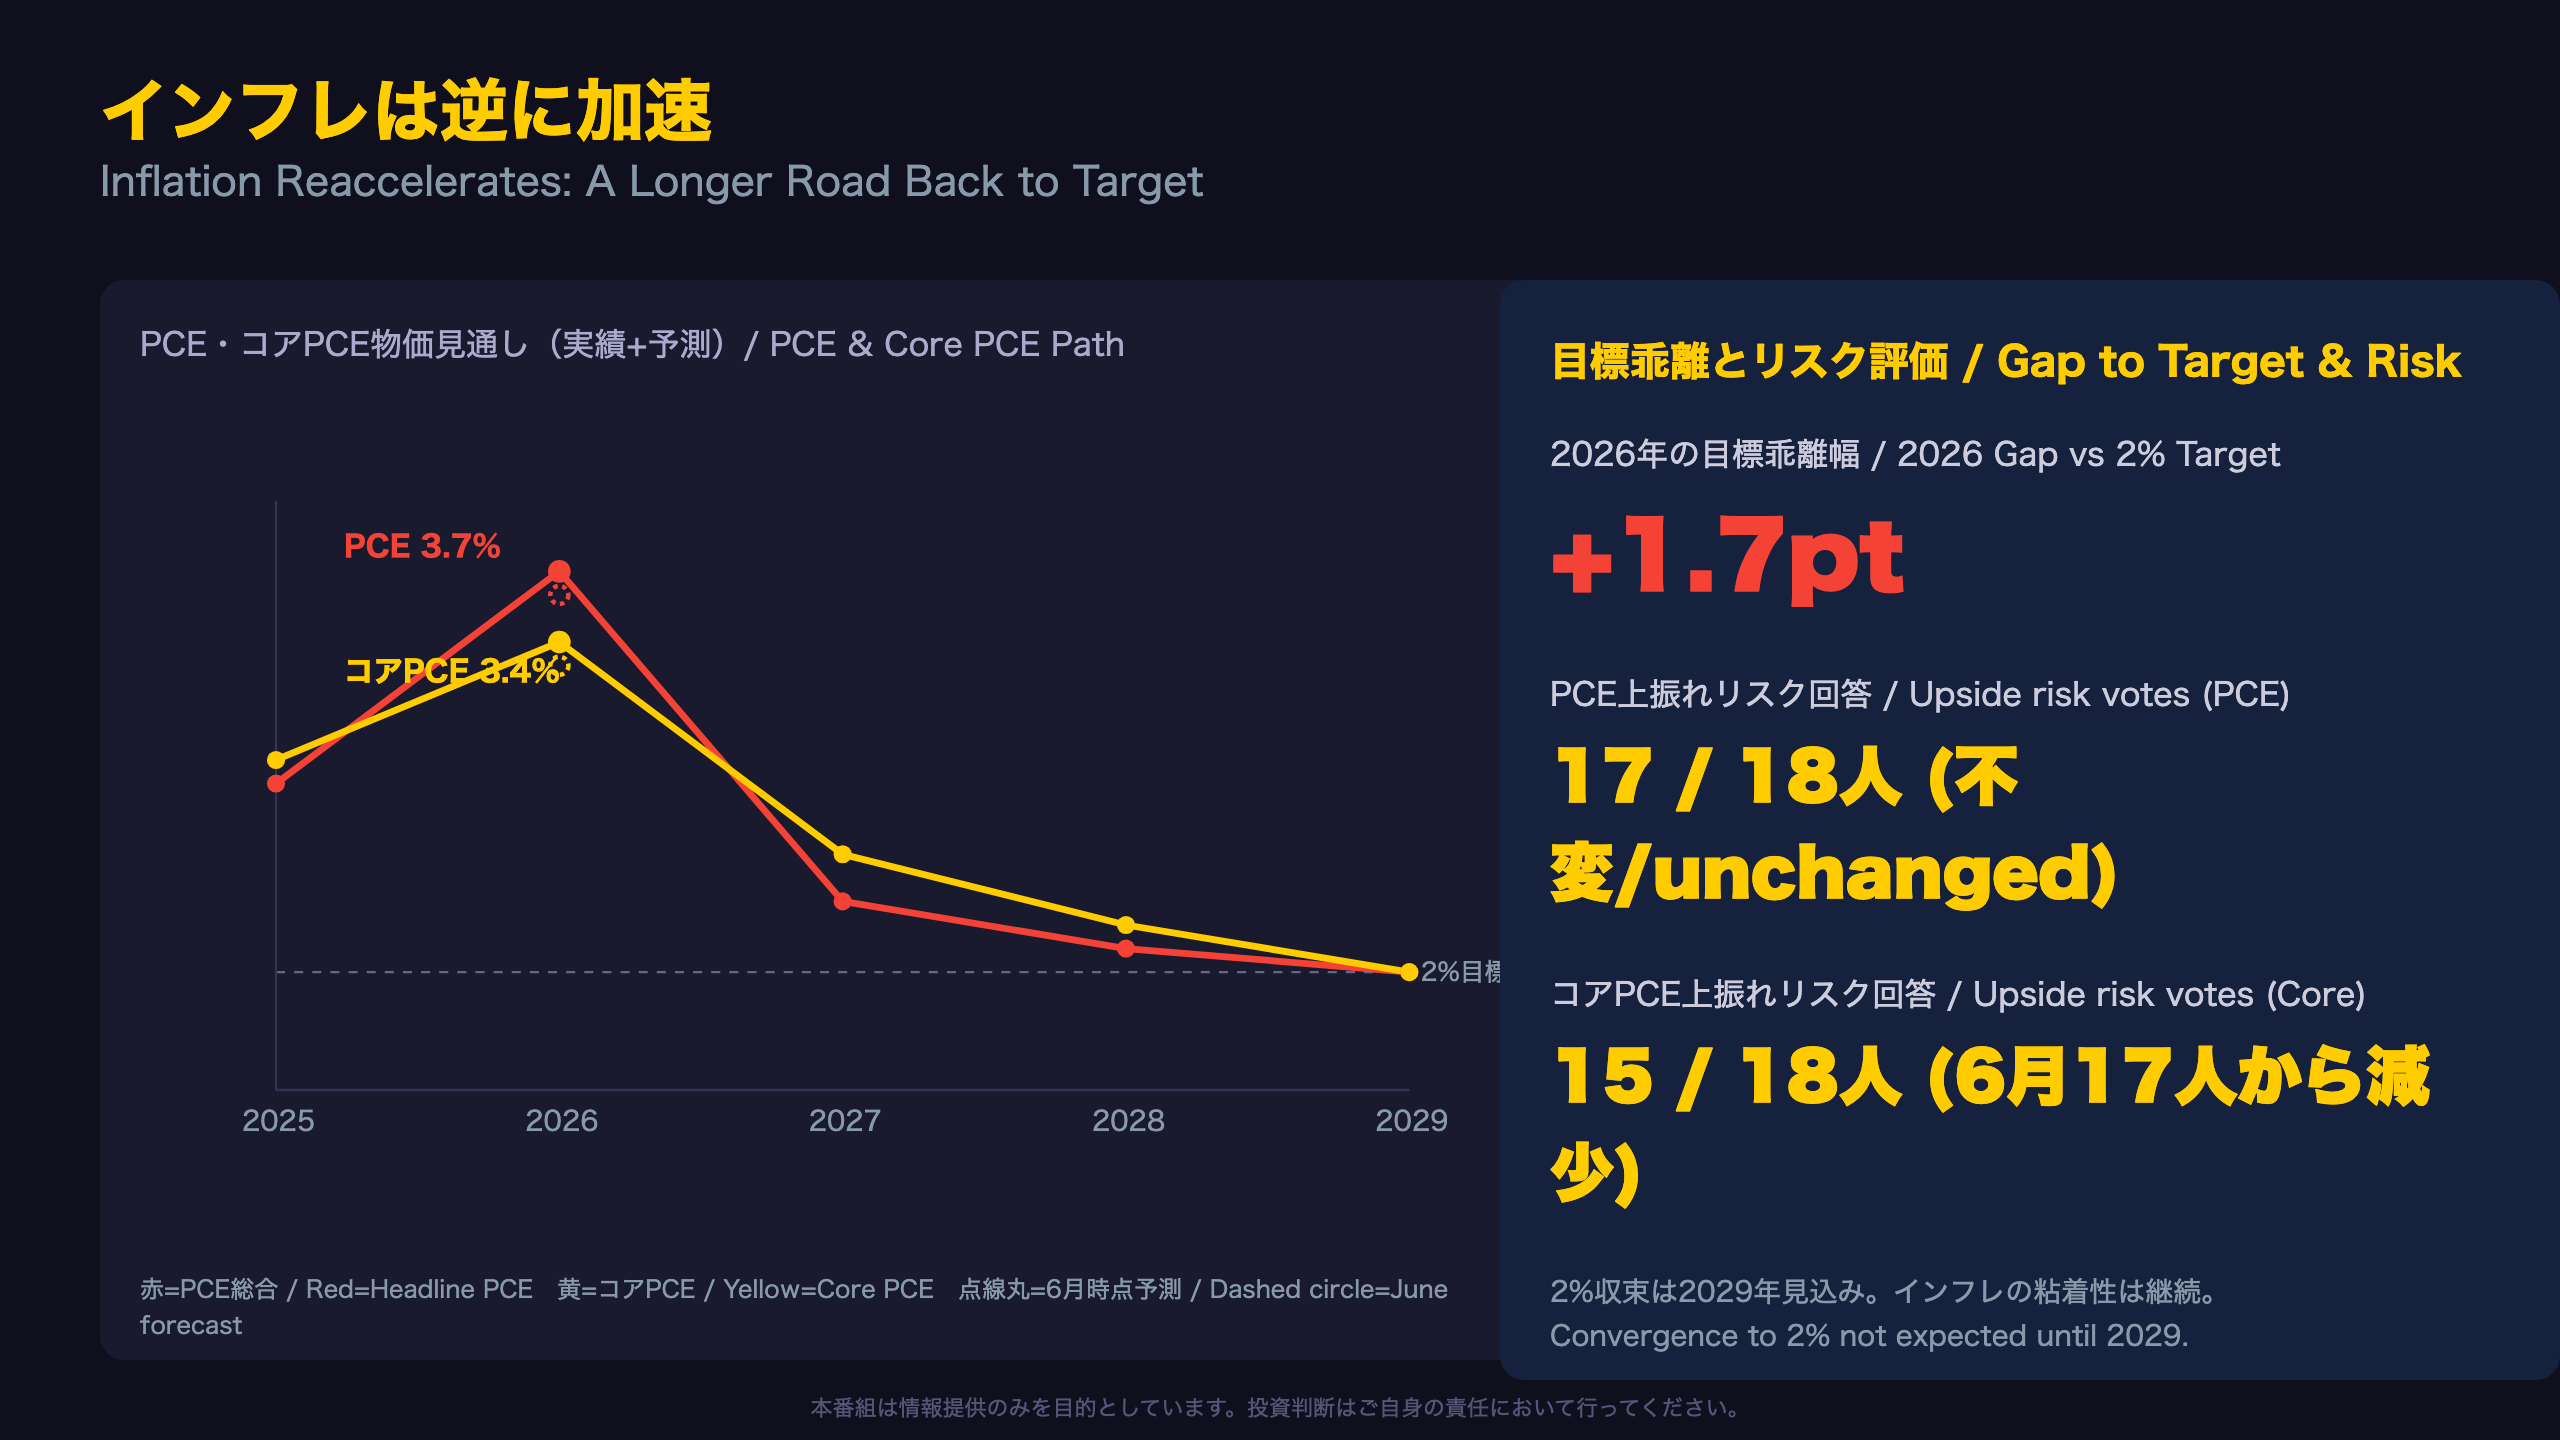
⚠️ Yet PCE inflation is now seen accelerating to 3.7% in 2026, pushing the return to target back to 2029.
💡 We break down this asymmetric mix of resilience and sticky inflation, and what it means for rates, the dollar, and equities.
タカ派サプライズ:金利パス全年で上方修正
Why This Dot Plot Revision Matters
The Federal Reserve’s Summary of Economic Projections (SEP), released quarterly alongside the FOMC’s March, June, September, and December meetings, aggregates each policymaker’s individual forecast for GDP growth, unemployment, inflation, and the appropriate federal funds rate path. Unlike the FOMC statement, the SEP is not a committee consensus but a collection of 18 individual dots.
What changed: The median dot for year-end 2027 jumped from 3.6% in June to 4.1% in September — a 50-basis-point upward revision in just one quarter. That is unusually large for the SEP, where quarter-to-quarter dot revisions are typically 10-25bp.
International Context
For investors more familiar with the ECB or BOE, this is roughly equivalent to a central bank pulling forward its terminal rate guidance by half a percentage point without an accompanying growth shock — normally a red flag for markets. Here, however, the upward revision coincides with an improving unemployment forecast (4.3% to 4.1%), a combination rarely seen together.
Market Read
A higher-for-longer dot plot, paired with resilient labor market projections, typically supports the U.S. dollar and keeps front-end Treasury yields elevated relative to prior expectations, while complicating the soft-landing-plus-rate-cuts trade that equity markets had been pricing.
景気敏感指標は全面改善:労働市場の底堅さ
Reading the Labor Market Signal
Unlike many national labor statistics releases, the Fed’s SEP asks each of the 18 FOMC participants to submit forward-looking judgments not just on point forecasts, but on the direction of risk around those forecasts. This qualitative layer is unique among major central banks and offers a real-time read on policymaker sentiment shifts.
The key shift: the actual unemployment rate hit 4.5% in 2025 (per the historical actuals table), yet the SEP projects a decline to 4.1% by end-2026 — a 0.2pp improvement from the June forecast of 4.3%. This is significant against the historical error range of plus-or-minus 0.5pp for 2026 unemployment projections (Table 2).
Compare to the ECB/BOE Approach
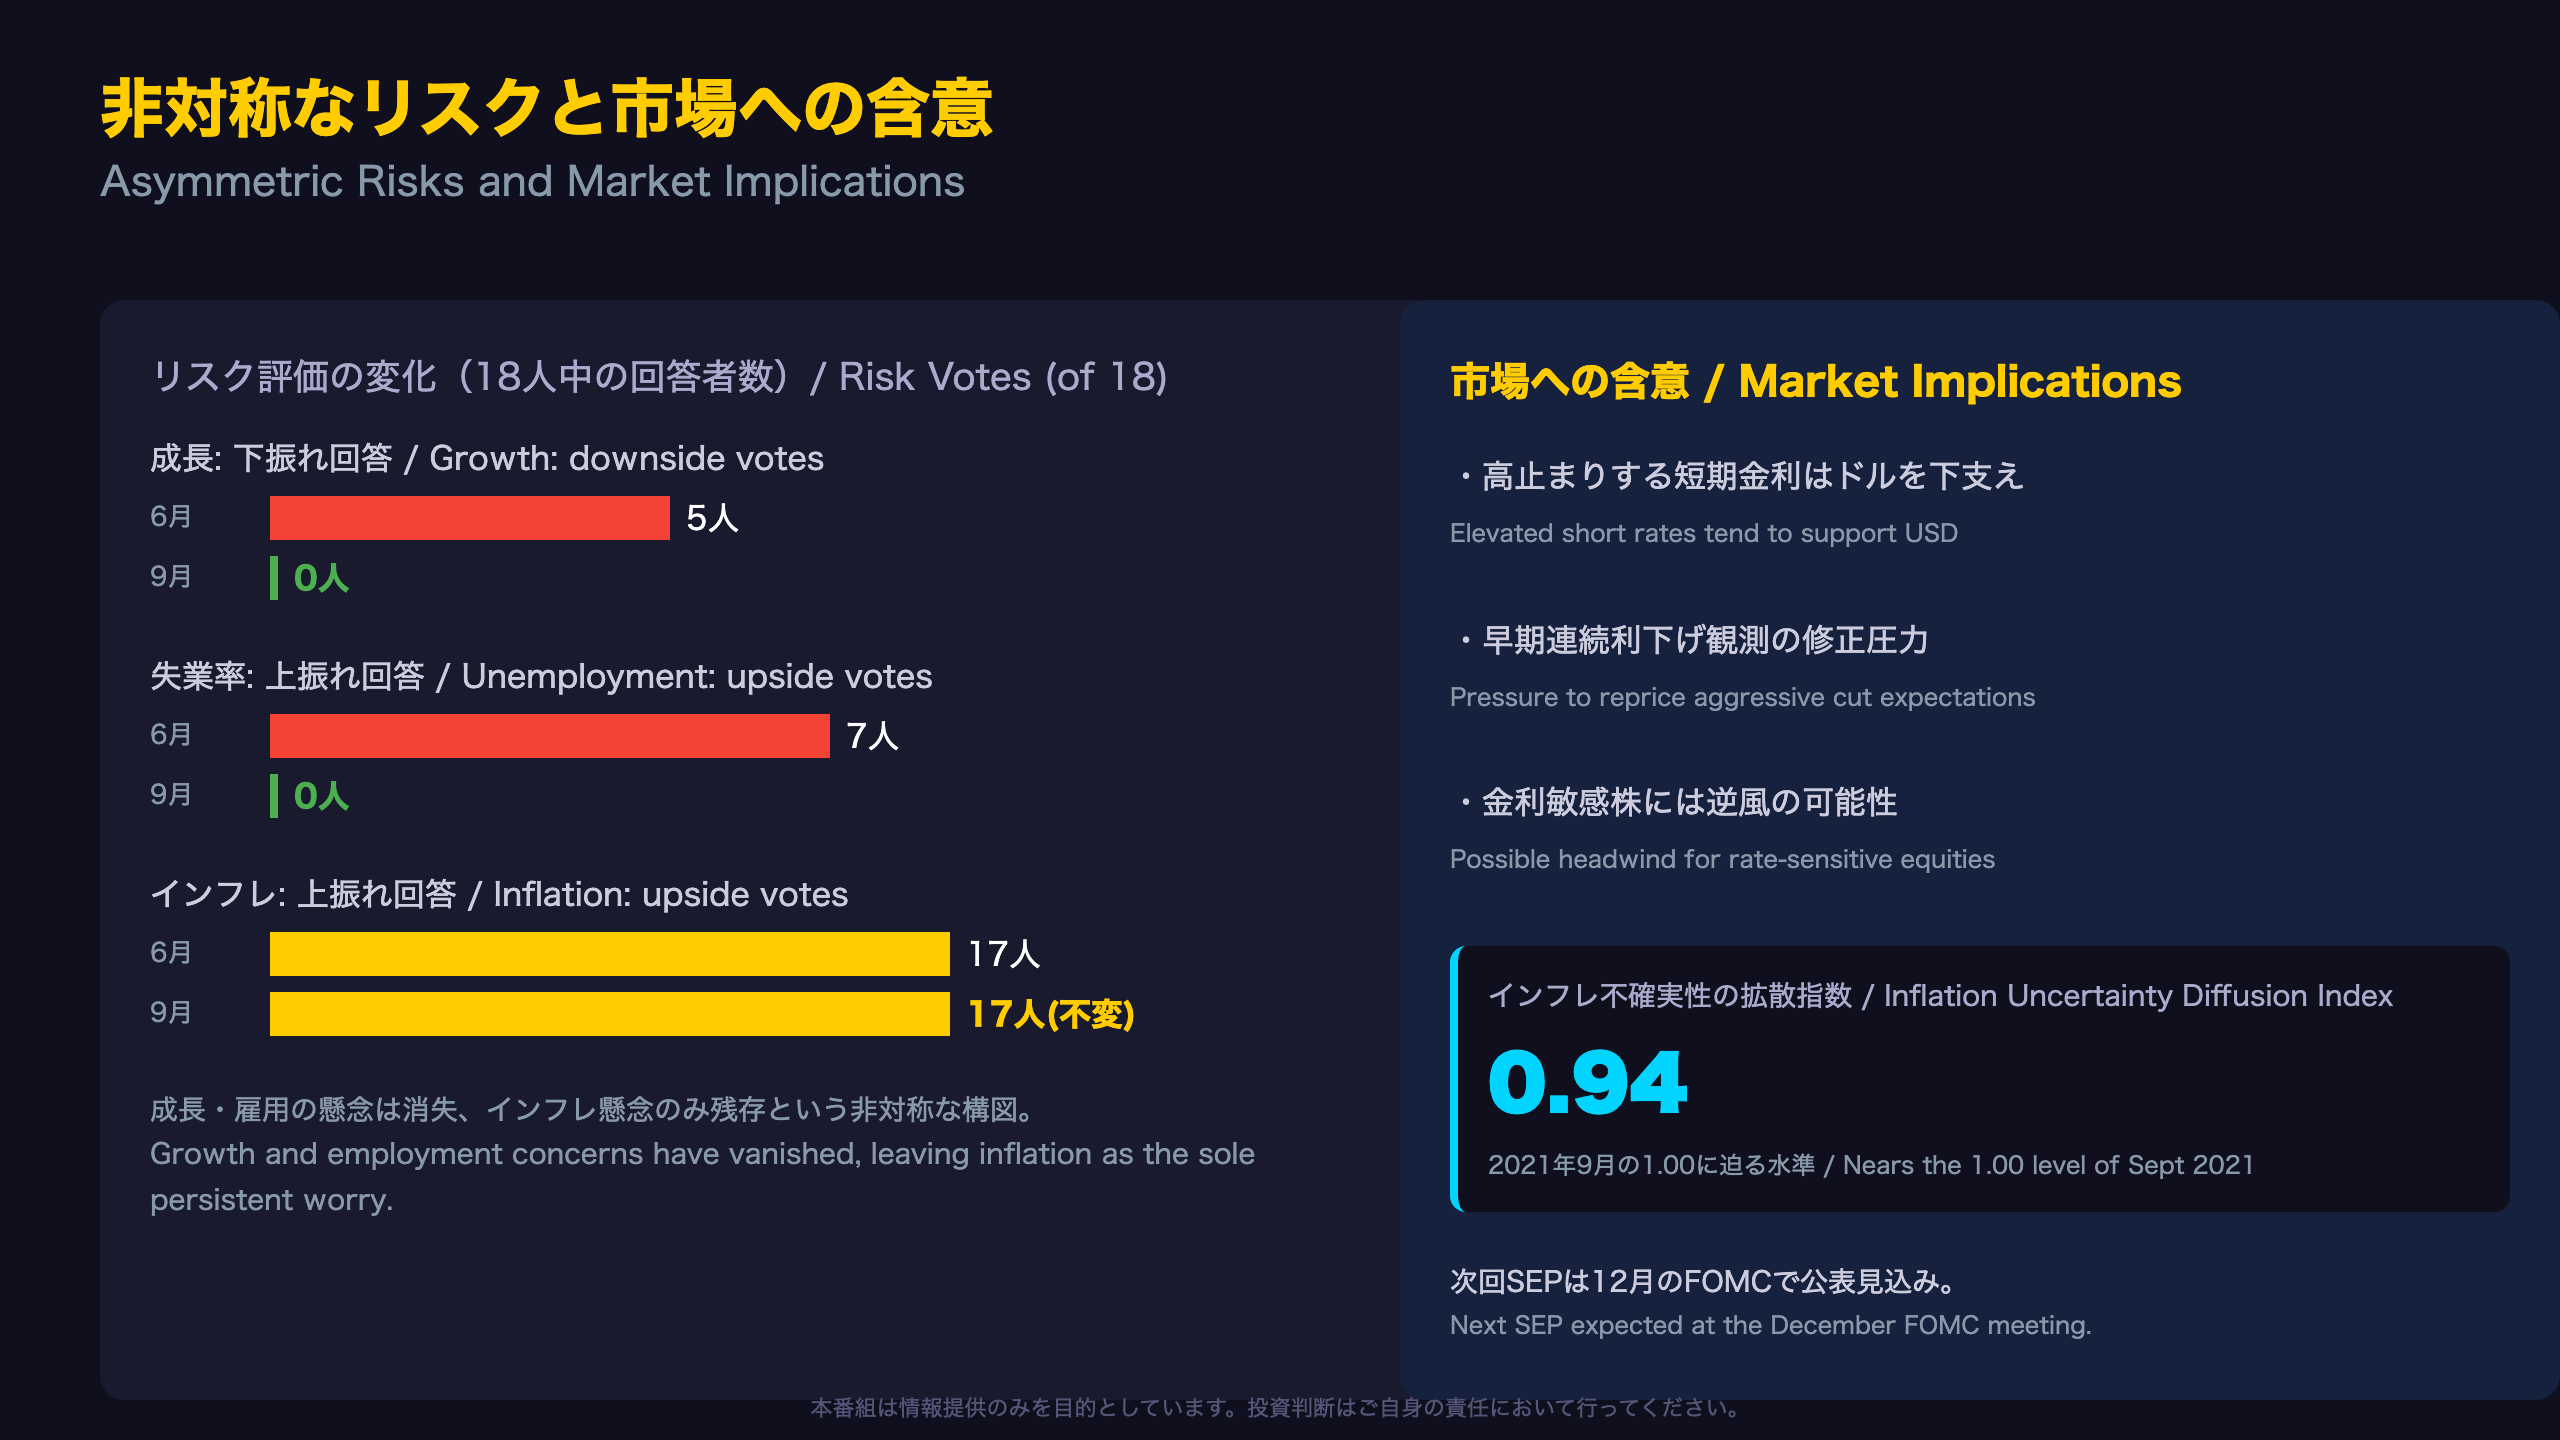
Neither the ECB’s macroeconomic projections nor the BOE’s Monetary Policy Report publish an equivalent risk-direction diffusion index. The Fed’s approach gives markets an unusually granular read: zero of 18 members now see upside risk to unemployment, down from seven in June.
Market takeaway: A labor market perceived as durably resilient reduces the probability of aggressive, recession-driven rate cuts, reinforcing the higher-for-longer narrative developed in Slide 1.
インフレは逆に加速:目標乖離の長期化
Why a 3.7% Inflation Forecast Still Matters for a 2% Target Central Bank
For readers used to the ECB’s single mandate framework or the Bank of Japan’s decade-long fight against deflation, the Fed’s persistent inflation overshoot is a distinct animal: it is a demand-driven overshoot occurring alongside accelerating growth (Slide 2), not a cost shock hitting a weak economy.
The core numbers: 2026 headline PCE inflation is now projected at 3.7% (up from 3.6% in June), with core PCE at 3.4% (up from 3.3%). Both figures compare against 2025 actuals of 2.8% and 2.9% — meaning the Fed’s own model expects inflation to reaccelerate, not glide down, over the coming year.
The Persistent Risk Skew
Seventeen of eighteen FOMC participants continue to rate inflation risks as weighted to the upside, identical to June’s reading. Core PCE upside-risk votes eased modestly from 17 to 15 — a small but notable softening worth watching in the December SEP.
For fixed income investors: an inflation path that doesn’t return to 2% until 2029, well beyond the Fed’s traditional two-year policy horizon, implies the market’s pricing of an aggressive 2026-2027 rate-cut cycle is increasingly at odds with the Fed’s own median projections.
利下げペース後ろ倒し:ドットプロットの全面上方シフト
Reading the Fed’s Dot Plot Beyond the Median
Unlike the ECB’s staff macroeconomic projections, which present a single institutional forecast, the Fed’s dot plot publishes the anonymized individual rate view of all 18 policymakers. This makes it possible to see not just where the median sits, but how the distribution of views has shifted — often a more powerful signal than the median alone.
The distribution shift: For year-end 2026, the modal cluster of dots moved from the 3.63-3.87% range (8 members in June) to the 4.13-4.37% range (12 members in September). That is not a marginal drift; it represents a wholesale relocation of the committee’s center of gravity. A similar pattern appears for 2027, where the mode shifted from 3.88-4.12% (5 members) to 4.38-4.62% (8 members).
Sizing the Move Against Historical Error Bands
Table 2 in the SEP shows the historical root-mean-squared error for short-term rate forecasts is plus-or-minus 1.7pp for 2027 — meaning a 50bp revision, while large in dot-plot terms, still sits within one standard historical error band.
Bottom line for rates traders: fewer cuts are now baked into the Fed’s own median path than three months ago, a materially different starting point for pricing 2026-2027 front-end Treasury yields.
非対称なリスクと市場への含意
Contextualizing the Risk Asymmetry With Historical Diffusion Data
The SEP’s diffusion indexes (Figures 4.D and 4.E) offer a rarely-used lens for international investors: a numerical measure of how unified or divided the FOMC is on risk direction, tracked continuously since 2007. As of September 2026, the inflation-risk diffusion index sits at 0.94, nearly matching the 1.00 reading seen in September 2021, just as the post-pandemic inflation surge was taking hold. In other words, the committee’s collective concern about inflation risk today rivals its concern during the most acute phase of the 2021 inflation shock.
Contrast with growth and employment: The GDP growth risk diffusion index flipped to +0.28 (upside-skewed) in September, while the unemployment risk index eased to -0.06 (essentially balanced), a sharp departure from the deeply negative readings seen during the 2022-2023 tightening cycle.
A Word of Caution on These Judgments
As the Fed’s own documentation states, all projections reflect each policymaker’s individual assessment of appropriate monetary policy, not a forecast of the most likely path. These views can shift quickly if incoming data diverges from expectations.
Looking ahead: the next SEP is due at the December FOMC meeting. The central question is whether above-3% inflation forecasts get revised down, or become further entrenched.
Disclaimer: This article is for informational purposes only. All investment decisions are made solely at your own risk.