📺 Watch the Full Video Analysis
This article was automatically generated by the NFC Market Live AI analysis system. (Updated: 2026-09-16 09:00 JST)
📄 Primary Source
財務省
https://www.customs.go.jp/toukei/shinbun/trade-st/gaiyo2026_08.pdf
Deep dive into Japan’s August 2026 trade statistics released by the Ministry of Finance.
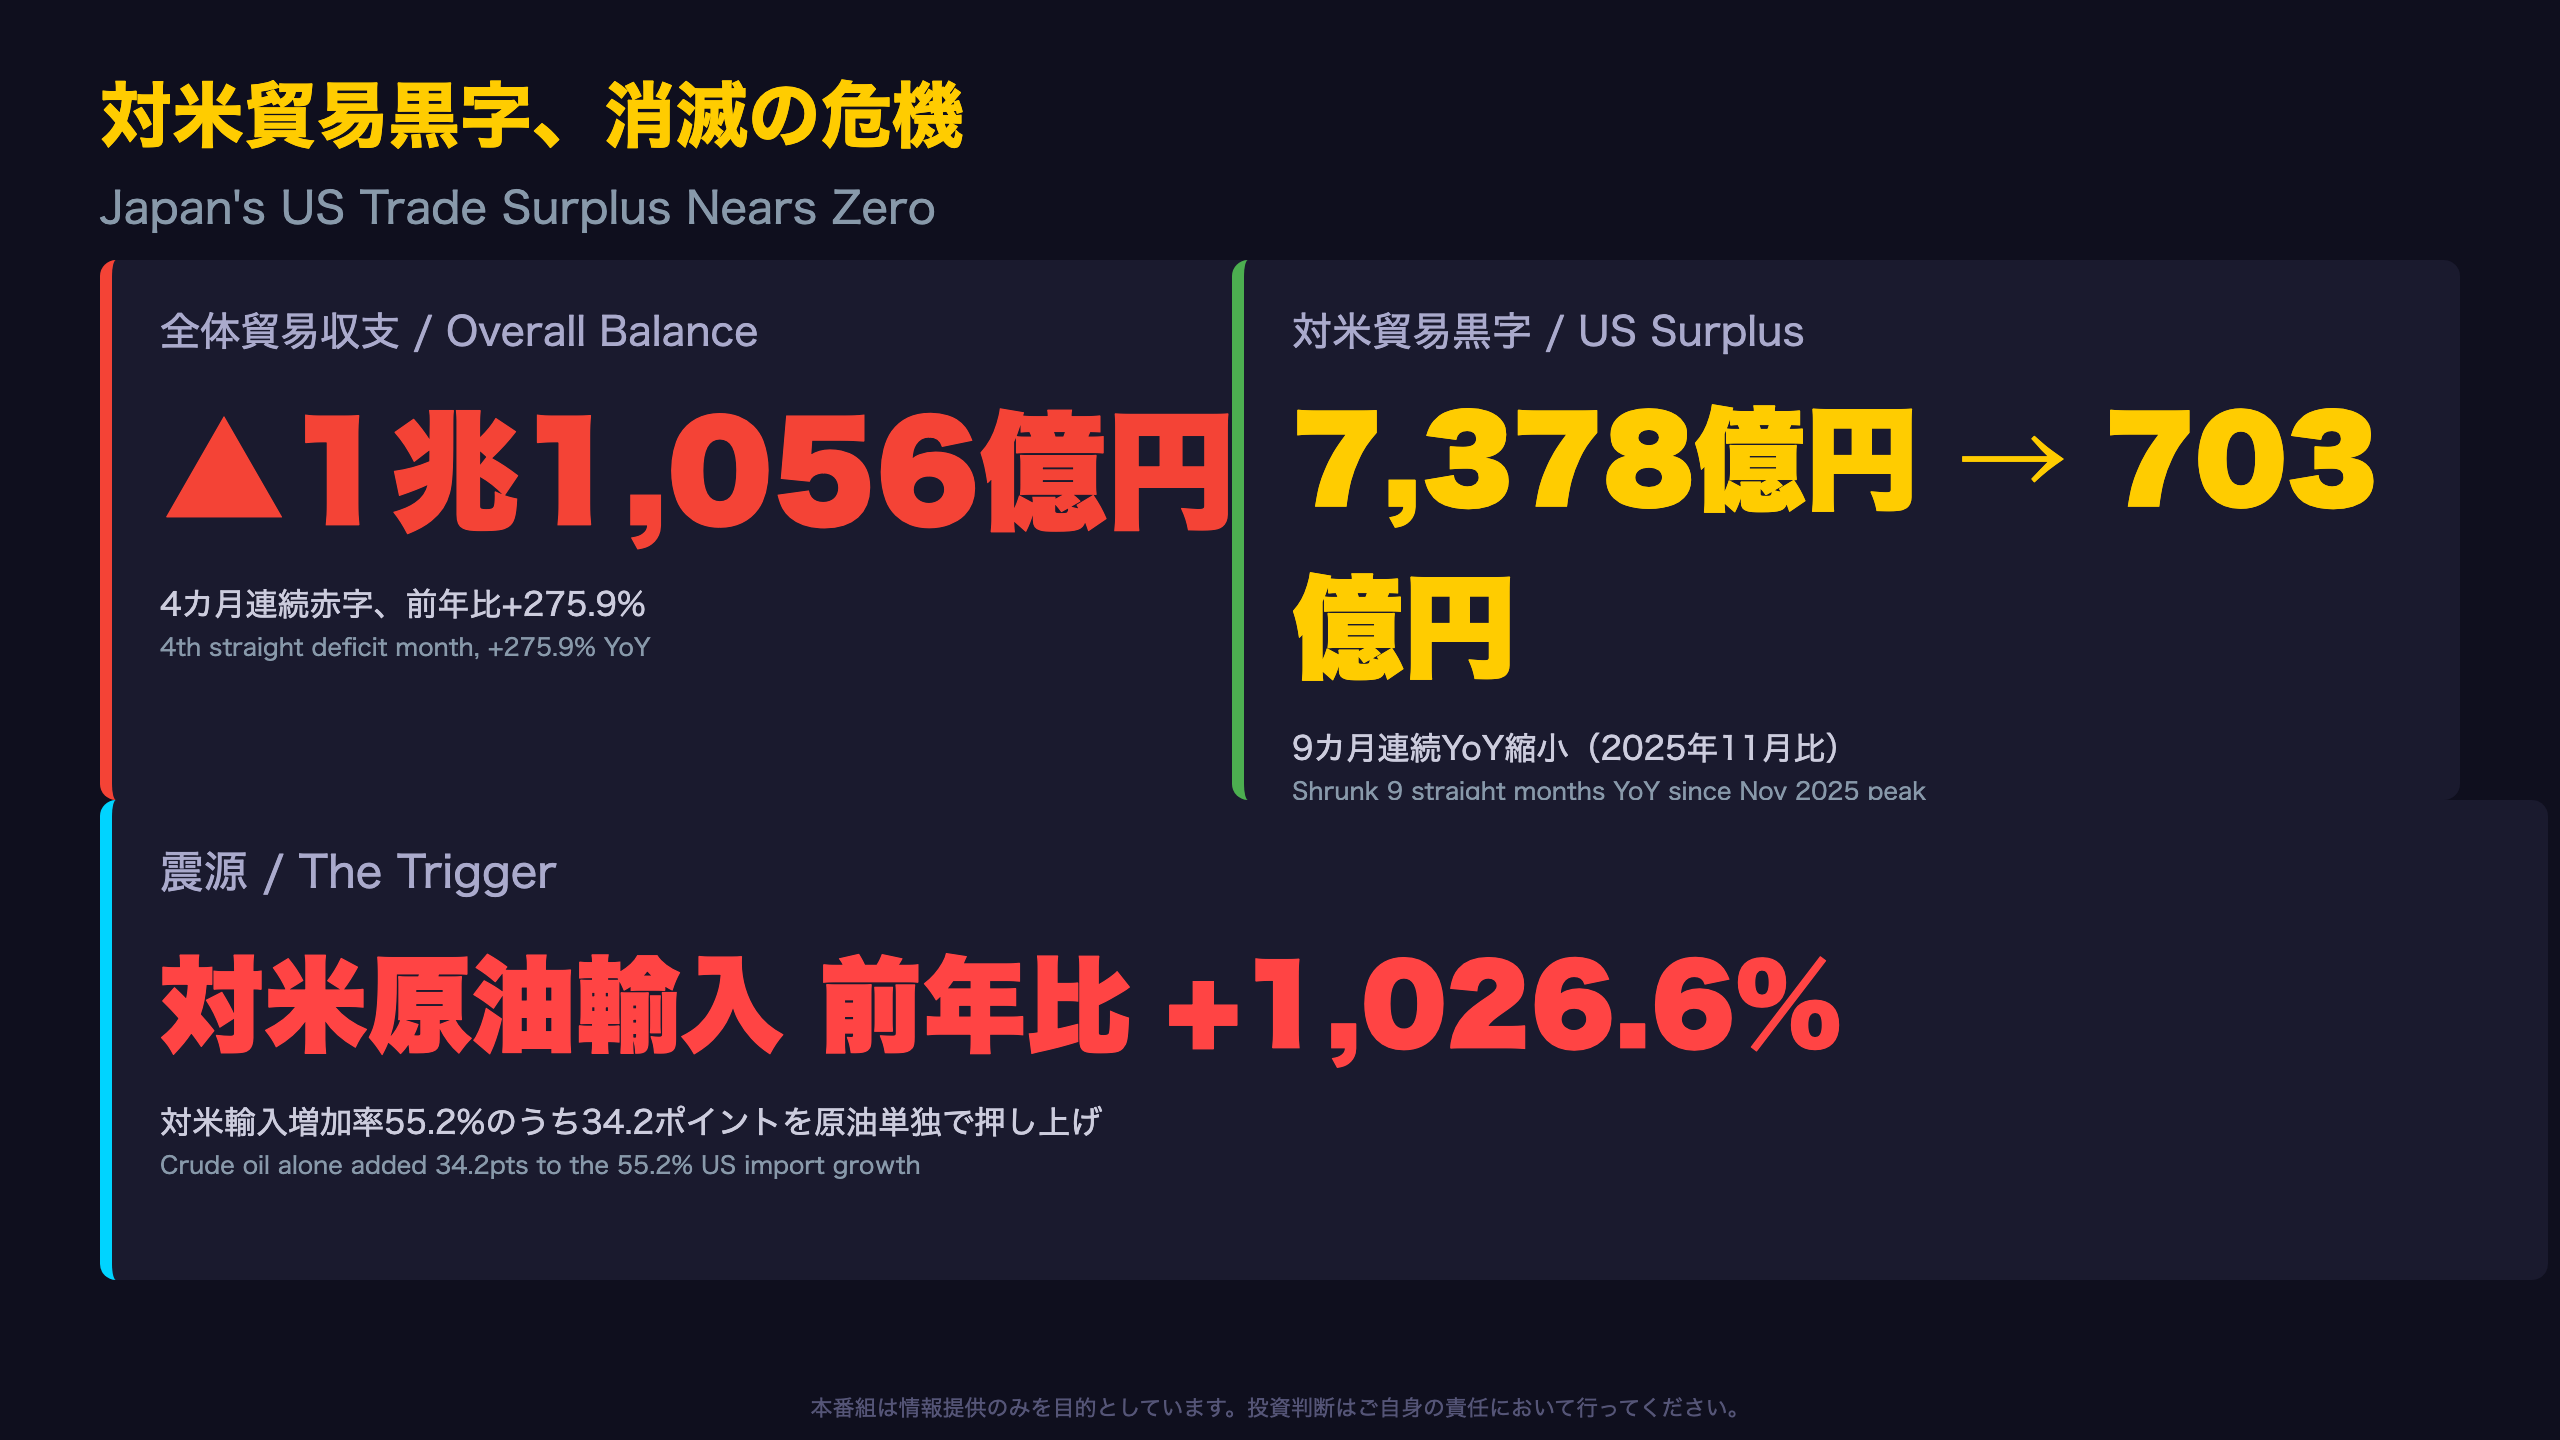
📊 Overall trade deficit widened to ¥1.1056 trillion (4th straight month)
💡 The real story: Japan’s trade surplus with the US has shrunk for 9 consecutive months YoY, collapsing to just ¥70.3bn
⚠️ Driver: crude oil imports from the US surged +1026.6% YoY
📈 Meanwhile semiconductor and auto exports remain resilient
A flat, balanced look at what this means for USD/JPY flows, BOJ policy, and US-Japan trade friction.
The Ultimate Summary:対米貿易黒字、消滅の危機
The Real Story Behind the Headline
Japan’s Ministry of Finance (MOF) released August 2026 trade data on September 16, showing a headline deficit of ¥1.1056 trillion — the 4th straight deficit month, largely attributed to yen weakness.
But look at the US bilateral balance
| Period | Balance with US |
|---|---|
| Nov 2025 (peak) | +¥737.9bn |
| Jul 2026 | +¥279.9bn |
| Aug 2026 | +¥70.3bn |
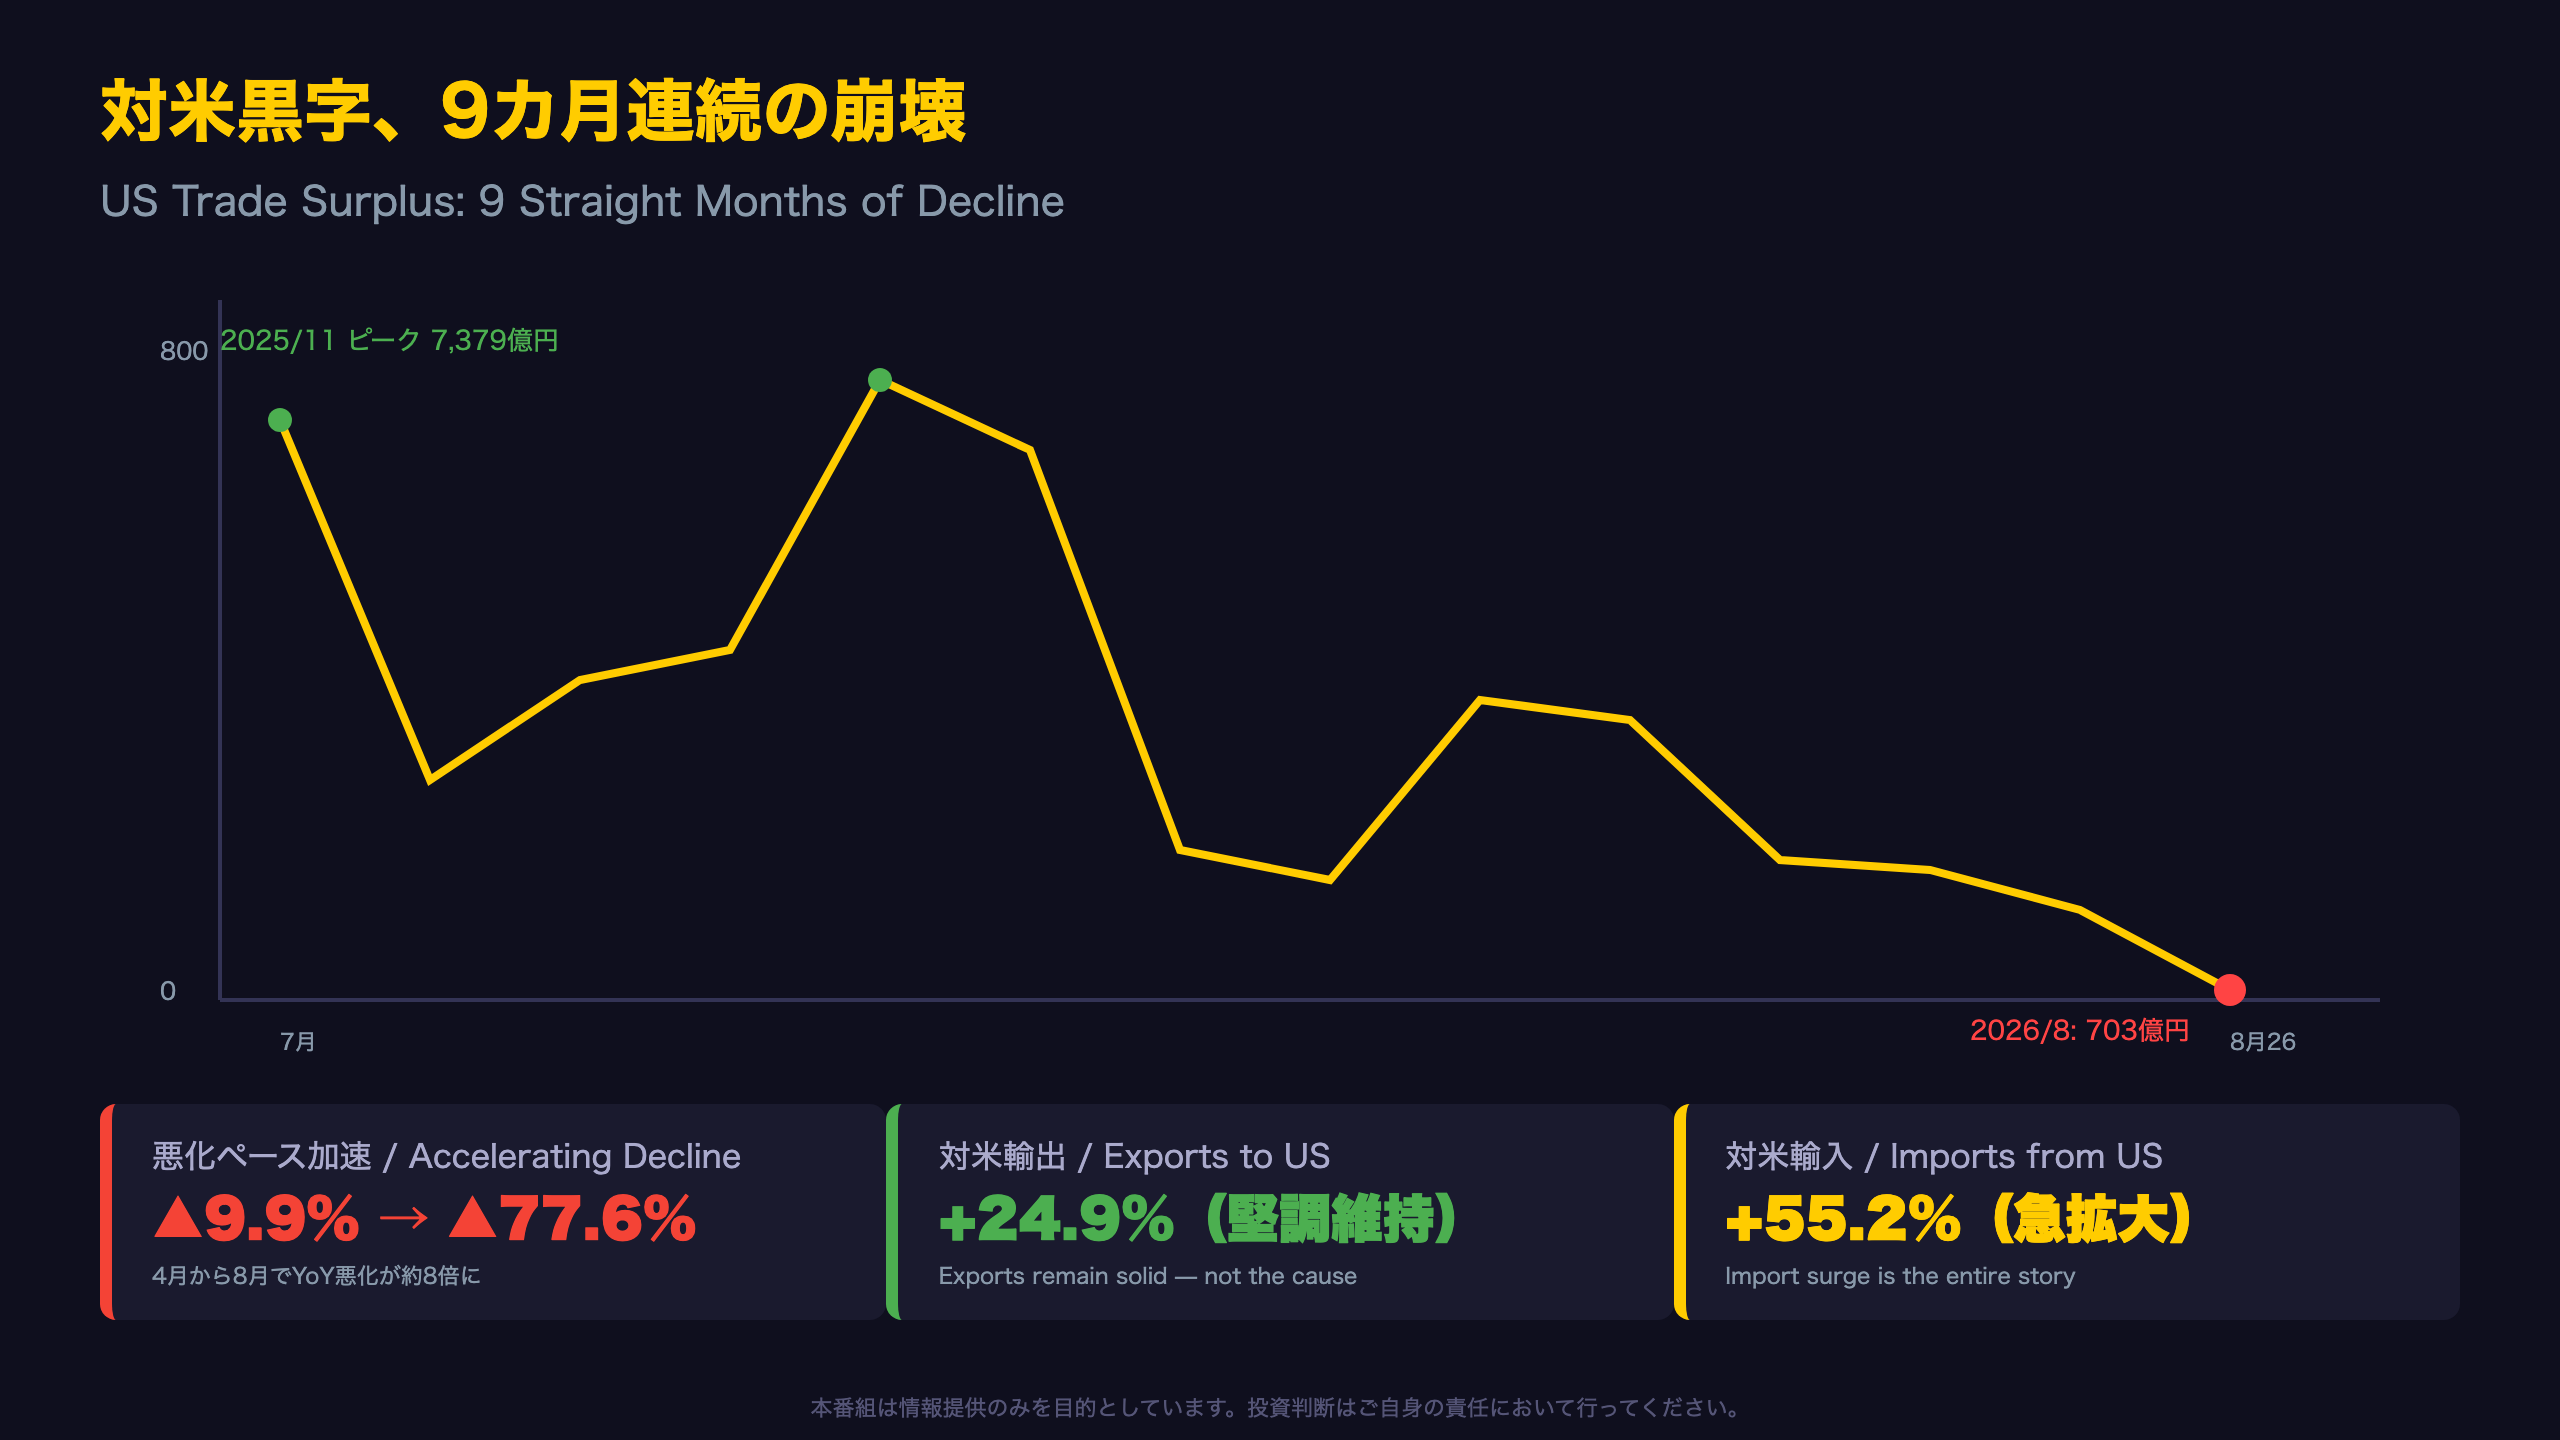
The surplus has declined year-over-year for nine consecutive months, and the pace of decline is accelerating — from -9.9% in April to -77.6% in August.
Why this matters for US-Japan trade politics
The source text states explicitly: “9-month consecutive decrease” (9ヵ月連続の減少) in the balance’s YoY growth rate. This magnitude is too large to be explained by FX alone, and lines up closely with an extraordinary surge in crude oil imports from the US (detailed in later slides).
Importantly, this is not driven by weak exports — Japan’s exports to the US actually rose 24.9% YoY. The story is entirely on the import side, where growth hit 55.2%.
Context for global investors: unlike the US CPI or Fed policy, Japan’s trade statistics rarely make Western headlines, but the vanishing US surplus — a key friction point in tariff negotiations — could meaningfully affect diplomatic and market dynamics.
The next trade release (September data) is expected in mid-October 2026.
全体像:赤字拡大の背後にある円安と季節性
What the Seasonally Adjusted Figures Reveal
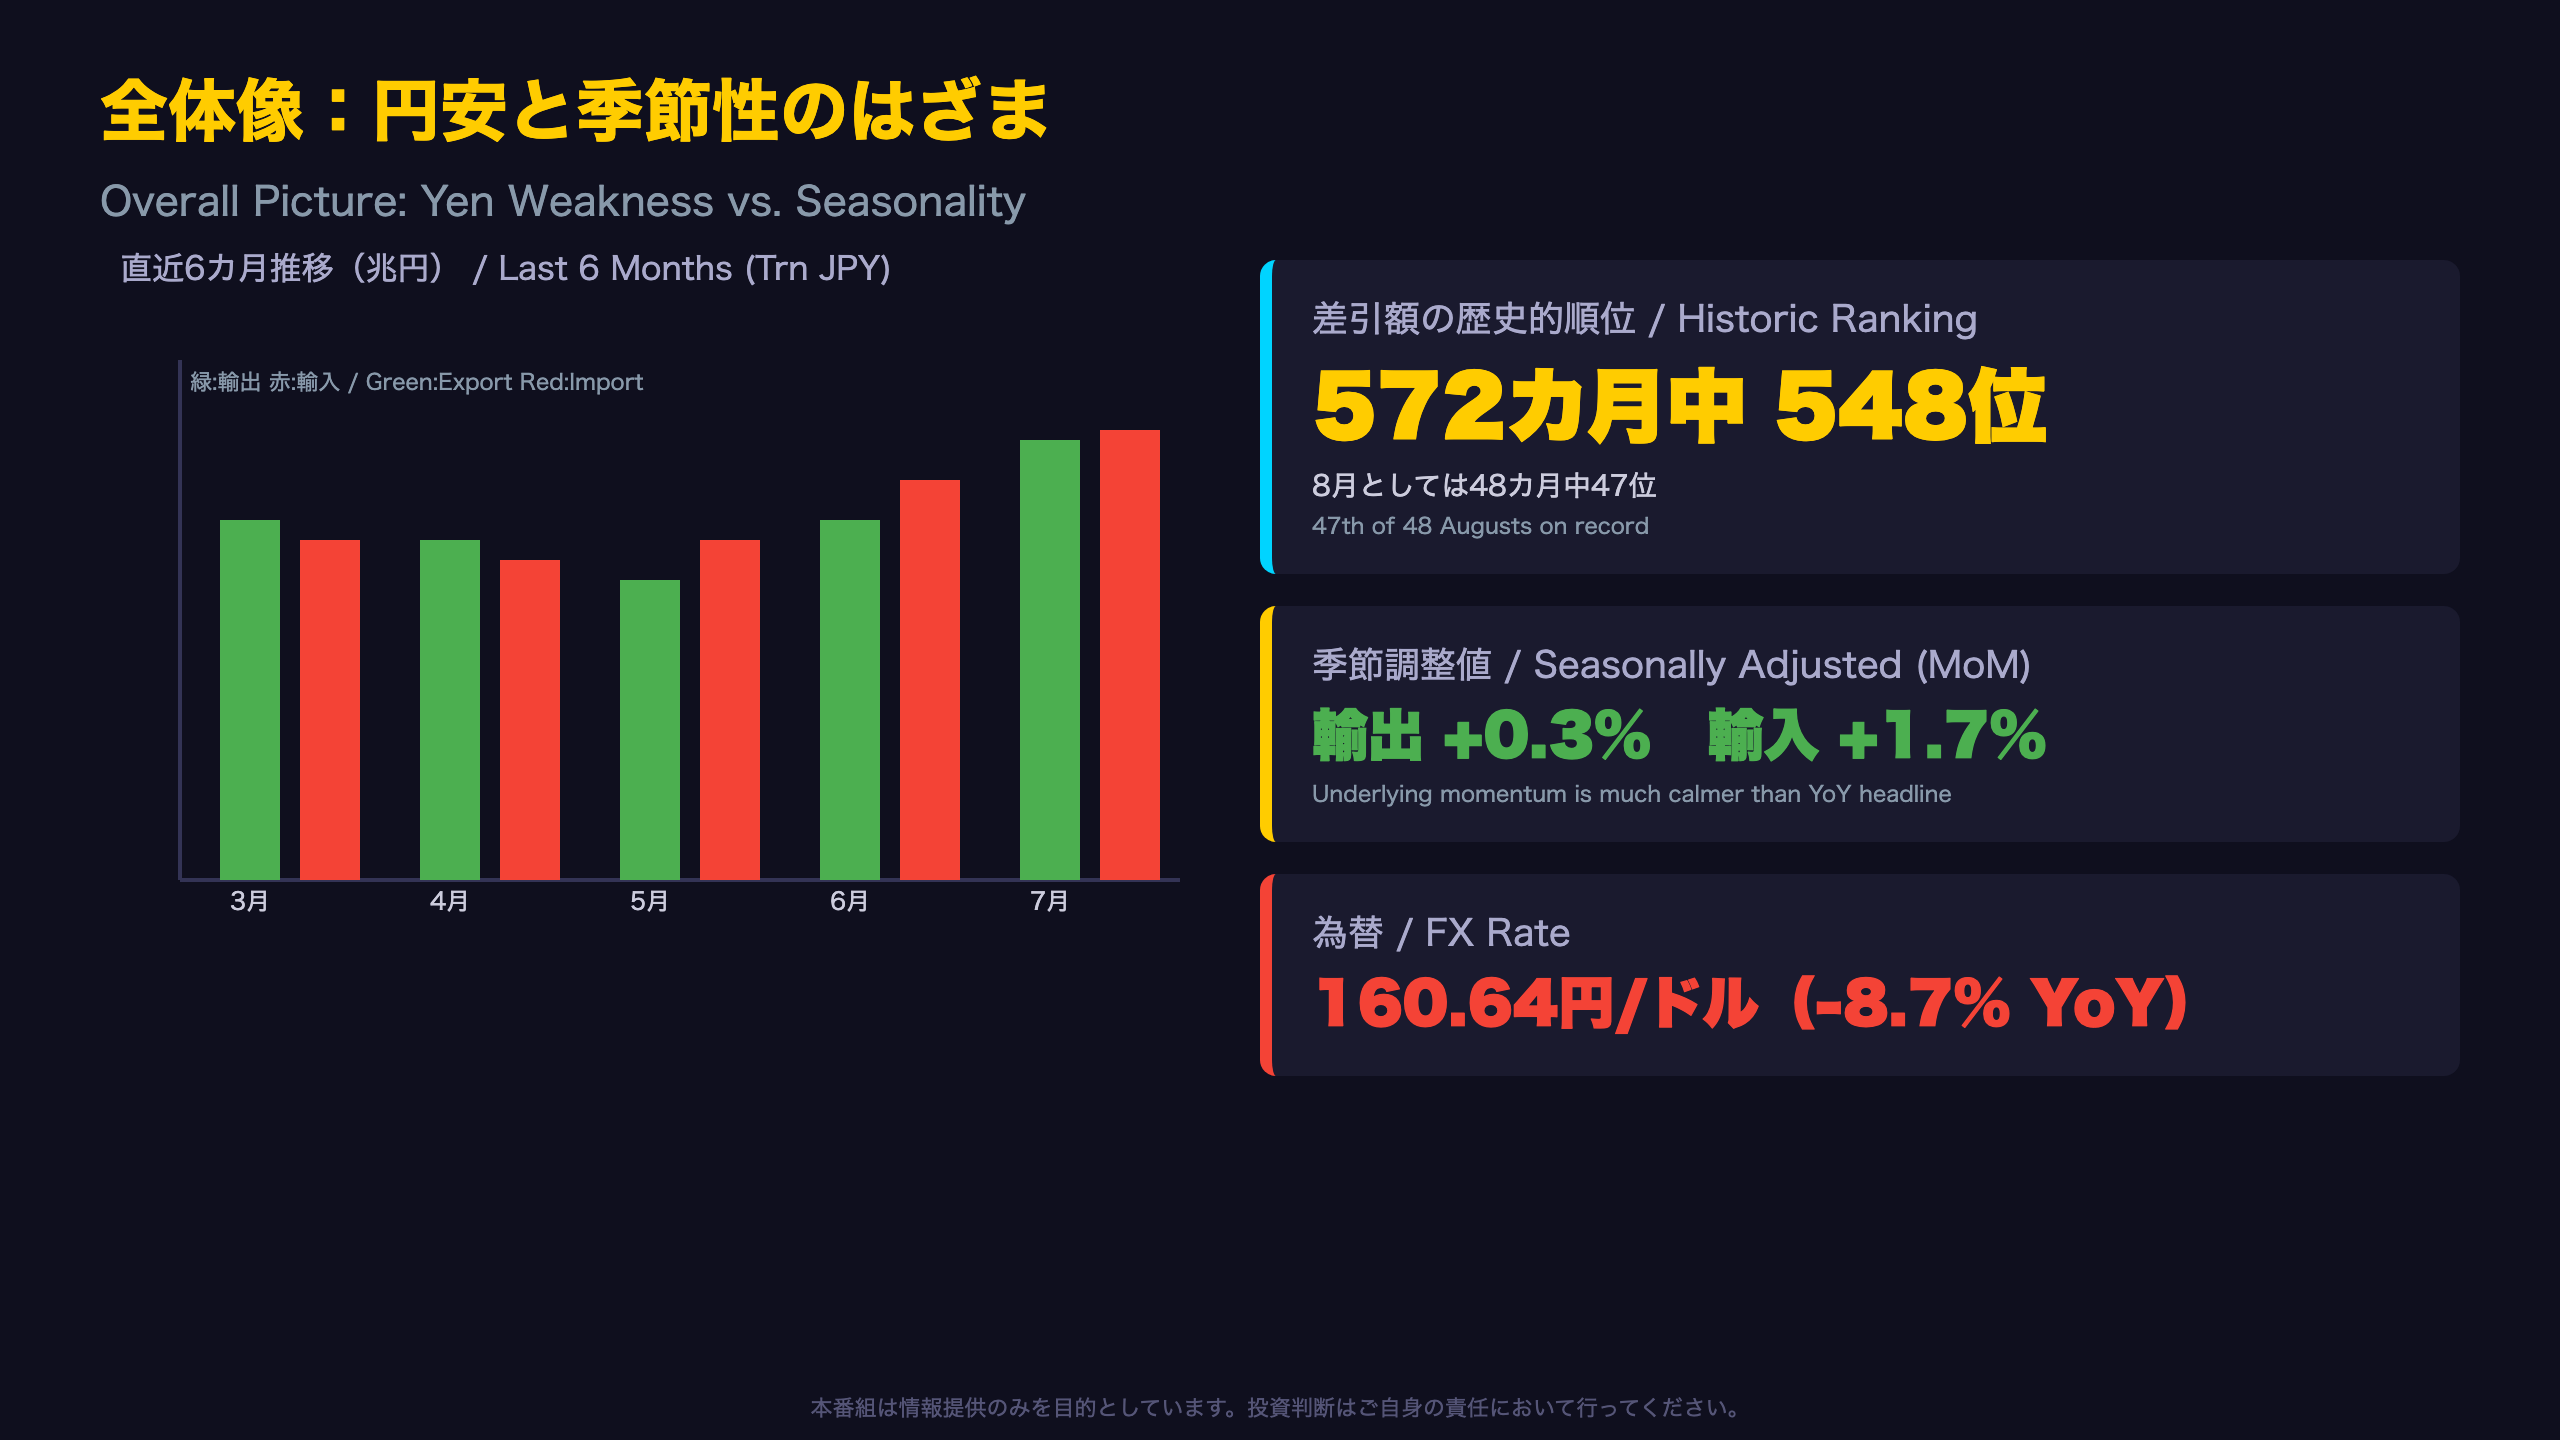
The headline YoY figures (exports +19.3%, imports +28.0%) are heavily flattered by yen weakness. The Ministry of Finance’s (MOF) own seasonally-adjusted series tells a calmer story: exports +0.3% MoM, imports +1.7% MoM — essentially flat.
Historical context matters
The report explicitly ranks the deficit as “548th out of 572 months” since records began in January 1979, and “47th out of 48 Augusts.” This is a near-record-weak reading for the month, not explainable by seasonality alone.
Volume, not just price
Export volume index came in at 94.5 (+2.5% YoY) and import volume at 97.2 (+2.7% YoY) — real trade volumes are still growing modestly, suggesting this isn’t purely a currency pass-through story.
For context: Japan’s trade statistics use a similar seasonally-adjusted methodology to the US Census Bureau’s trade release, making the MoM SA figures the more reliable gauge of underlying momentum versus the noisier YoY headline.
The next release (September data) is expected mid-October 2026.
対米貿易収支の崩壊:ピークからの9カ月連続縮小
Tracing the Collapse Month by Month
Japan’s trade surplus with the US has been on a volatile but clearly downward path over the past year.
| Month | US Balance (¥bn) | YoY |
|---|---|---|
| Nov 2025 | +737.9 | +11.0% |
| Dec 2025 | +688.8 | -31.9% |
| Apr 2026 | +687.7 | -9.9% |
| Jun 2026 | +339.7 | -49.0% |
| Aug 2026 | +70.3 | -77.6% |
What stands out is the acceleration: the YoY decline rate roughly octupled in just four months, from -9.9% in April to -77.6% in August.
Exports are not the culprit
Throughout this period, Japan’s exports to the US stayed firmly positive (+24.9% in August), led by autos (contributing +6.2 points) and semiconductor manufacturing equipment (+1.9 points). The data clearly shows the surplus erosion is an import-side phenomenon, not an export slowdown.
Market context: this dynamic is notably different from the US’s own trade deficit narrative — Japan is running an increasingly balanced (not surplus-heavy) trade relationship with the US, which could reduce a key point of friction in bilateral tariff talks going forward. Whether this is a temporary import binge or a structural shift is explored via the energy-import breakdown in the next section.
震源地:原油輸入+1026.6%という異常値
The 74% Energy Shock
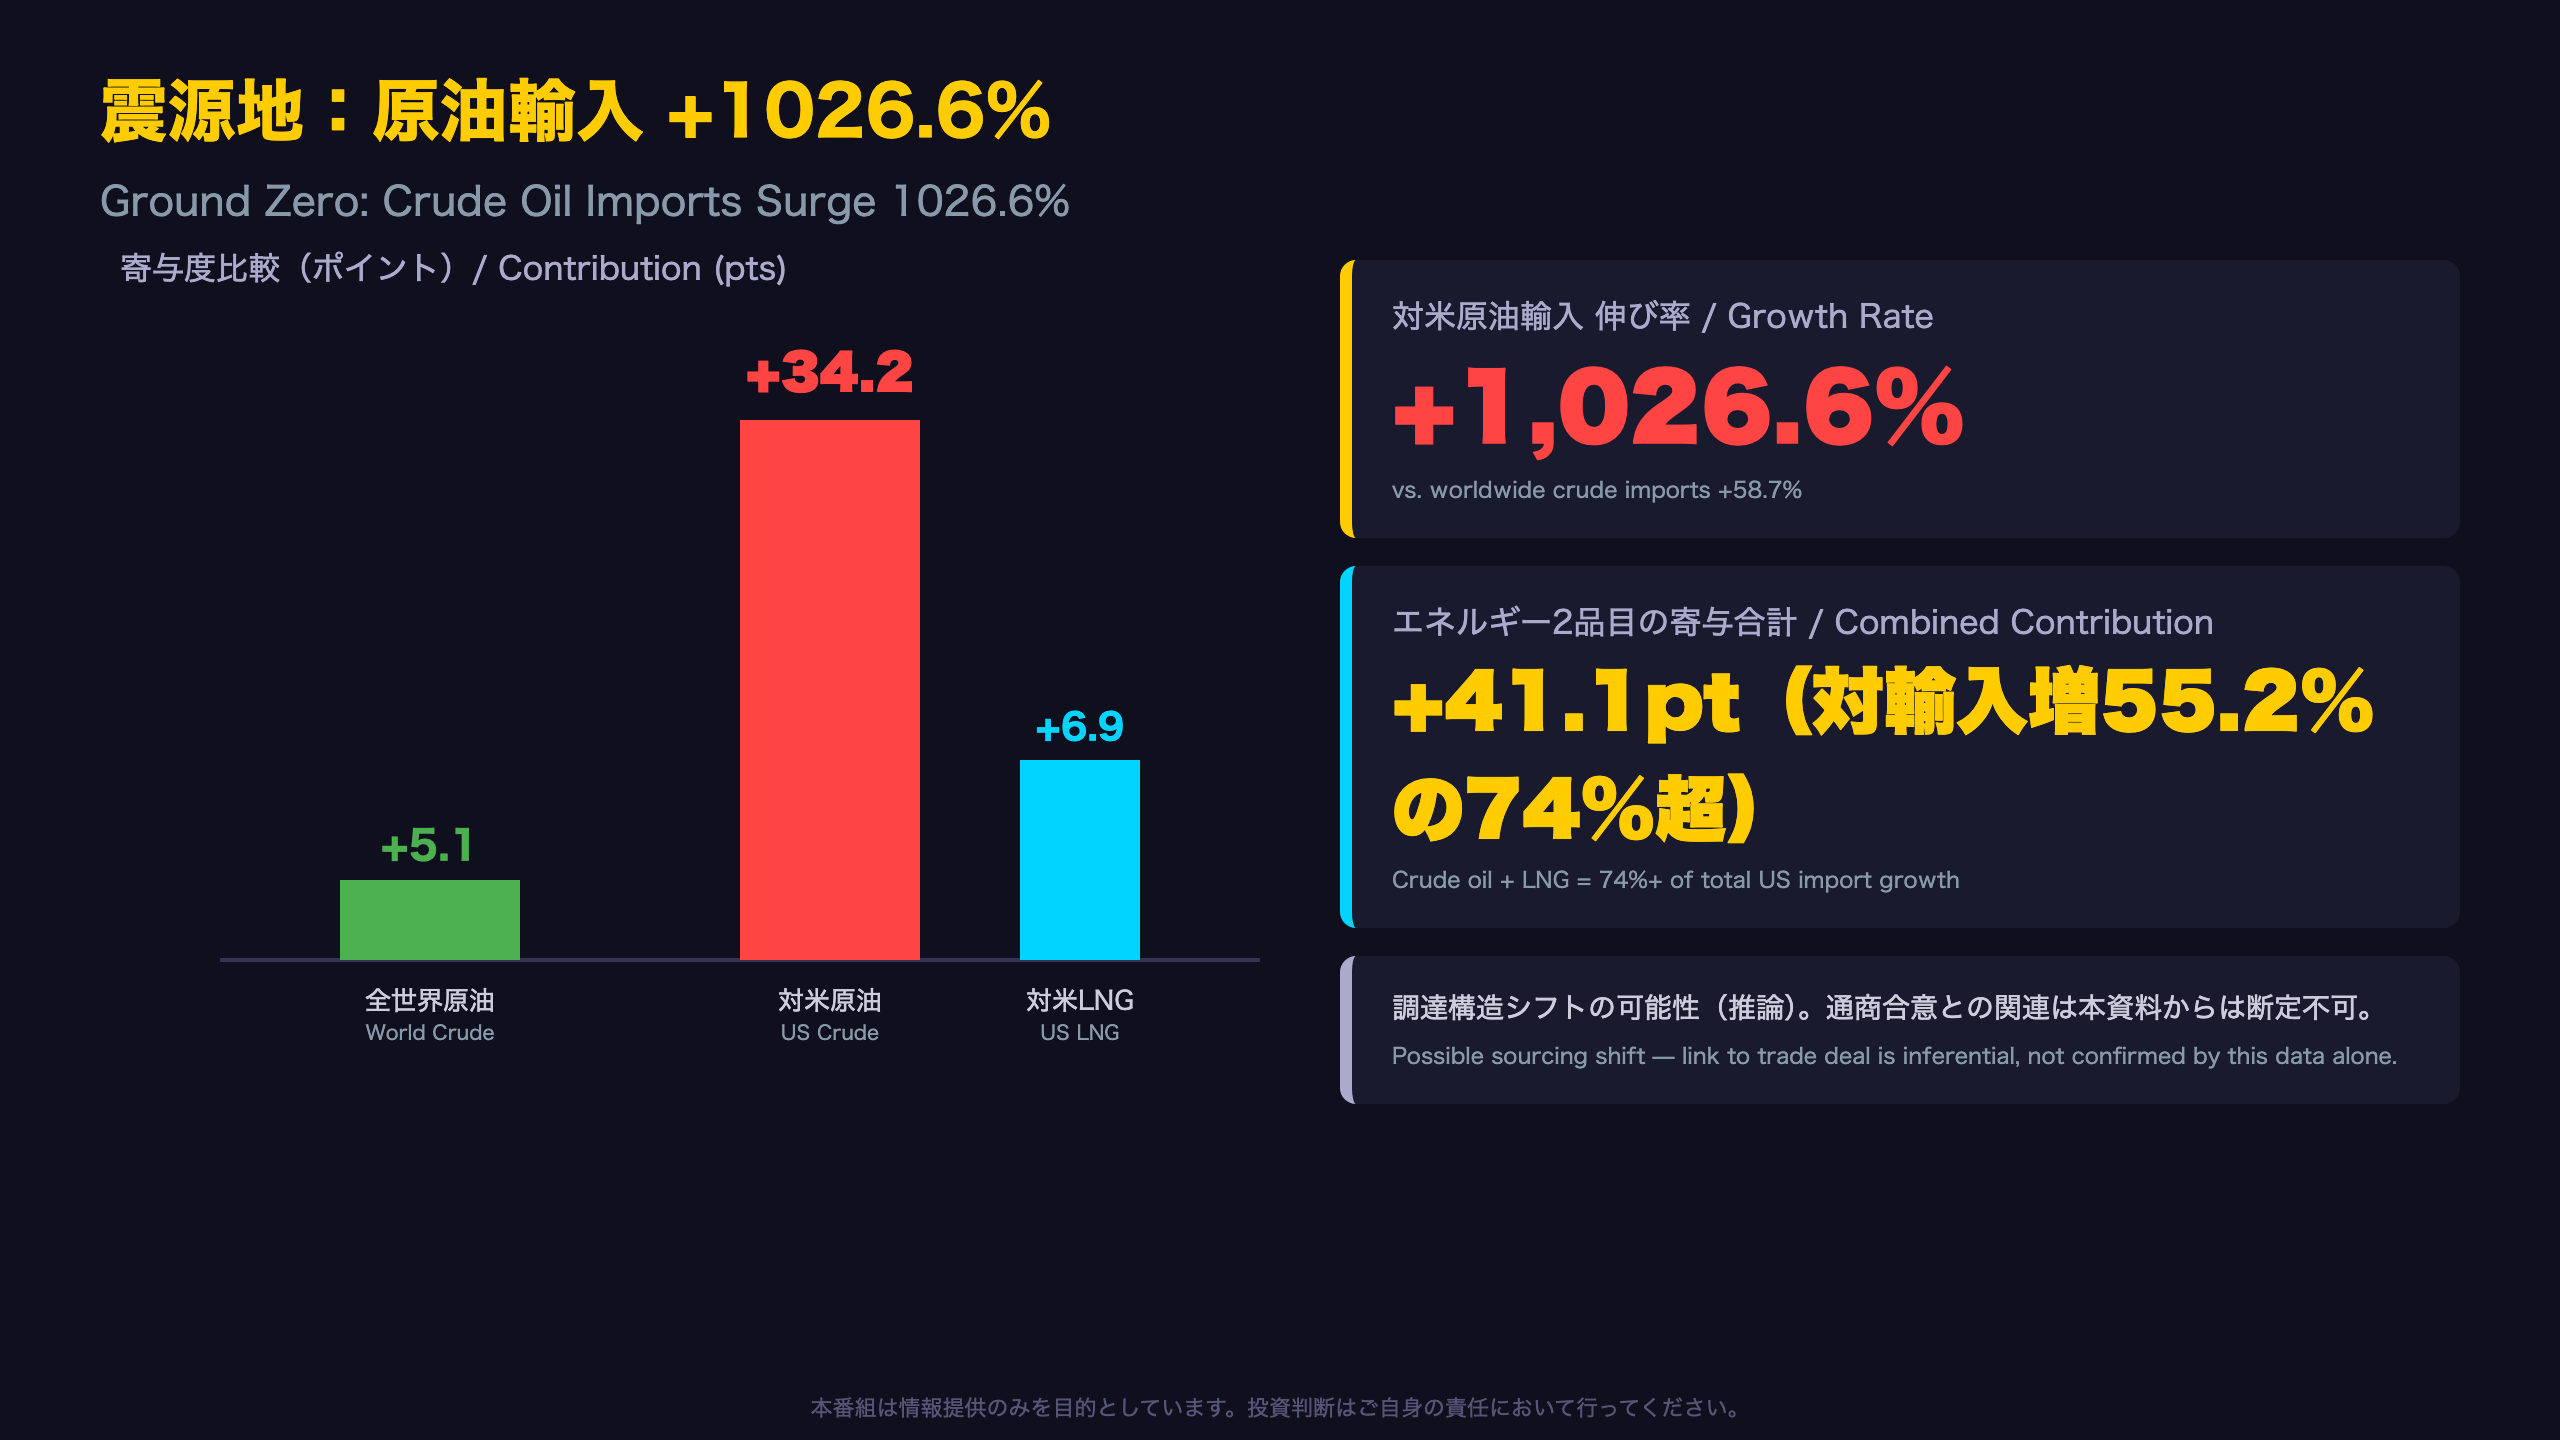
The MOF source data states, for US imports: “Crude oil: +1026.6%, contribution +34.2pts; Computers: +327.6%, contribution +8.2pts; LNG: +206.5%, contribution +6.9pts.”
Against the total US import growth of 55.2%, crude oil and LNG alone account for +41.1 points of contribution — over 74% of the entire import growth figure.
The gap versus worldwide crude imports
Japan’s total crude oil imports from all sources grew just 58.7% YoY (contributing 5.1 points nationwide). The US-specific growth rate of 1026.6% is nearly 18 times larger — a gap far too wide to be explained by yen depreciation or global oil price moves alone, both of which would affect all supplier countries roughly equally.
A plausible (not confirmed) explanation
This pattern is consistent with — though not proven by this data alone — the energy purchase commitments that were part of the broader 2025 US-Japan trade framework discussions. If Japan is increasingly substituting Middle Eastern crude with US-sourced crude and LNG, this would show up exactly as this data does: an outsized US-specific surge with a much more modest global figure.
For international readers: this dynamic parallels how US LNG export capacity expansion has reshaped trade flows with several Asian and European buyers in recent years — Japan’s data may reflect a similar realignment.
Computers/peripherals imports from the US also jumped 327.6% (contributing 8.2 points), suggesting the shift may extend beyond energy. Whether this pace holds will become clearer with the September data, due out in mid-October.
地域別のまだら模様:中国・EU・アジア
A Genuinely Mixed Regional Picture
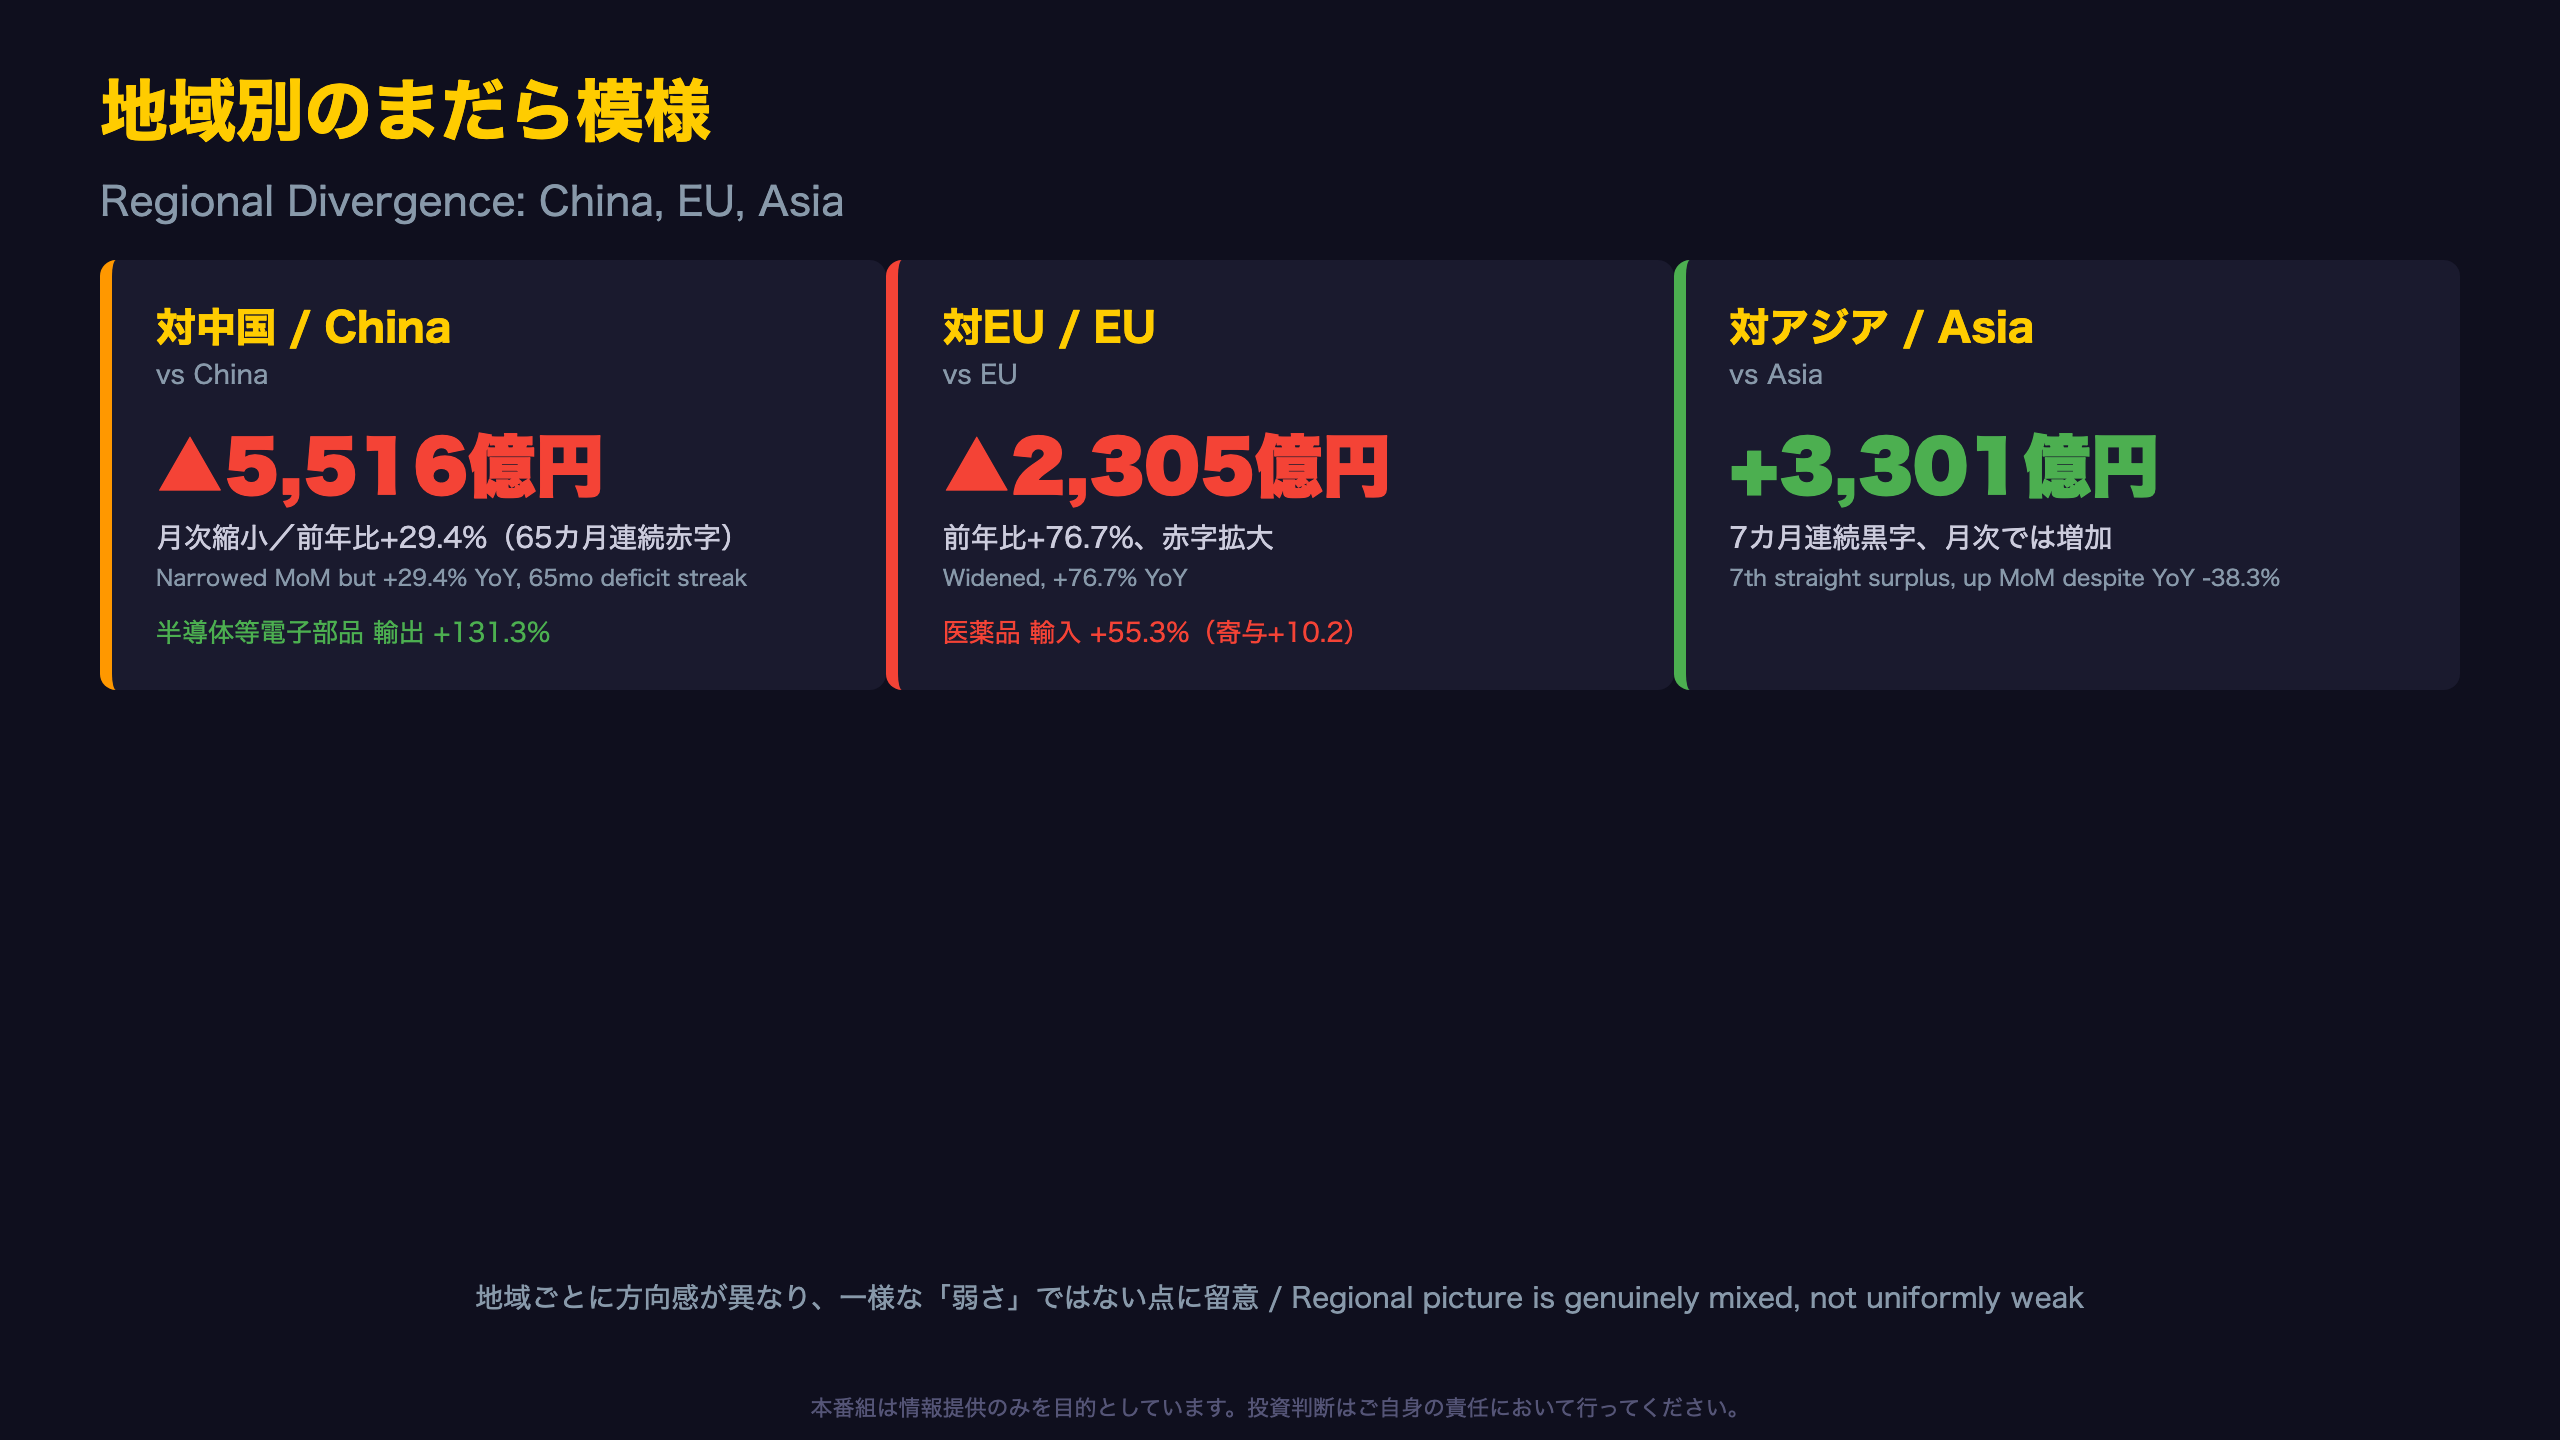
While the headline deficit expansion suggests broad weakness, the regional breakdown tells a more nuanced story.
China: improving and worsening at once
The deficit with China narrowed month-on-month to -¥551.6bn from -¥776.1bn in July, but on a year-on-year basis it’s still up 29.4%, extending a 65-month deficit streak. Notably, semiconductor-related exports to China jumped 131.3% (contributing 10.3 points), suggesting a genuine recovery in chip-related demand from China.
EU: pharmaceutical imports are the swing factor
The EU deficit widened to -¥230.5bn (+76.7% YoY). The source data specifically flags: “Pharmaceuticals: +55.3%, contribution +10.2pts” as the key import driver. Whether this reflects genuine demand growth or one-off restocking cannot be determined from a single month’s data.
Asia: surplus narrowing YoY but still expanding MoM
Japan’s broader Asia trade balance posted a surplus of +¥330.1bn (7th straight surplus month) — down 38.3% YoY, but actually up from July’s +¥235.6bn on a month-on-month basis.
Takeaway for investors: unlike the widely-cited US trade deficit narrative (where China is often singled out), Japan’s regional trade picture shows genuine divergence — worsening with the EU, mixed with China, and resilient with broader Asia. This nuance rarely appears in mainstream coverage of Japan’s “widening trade deficit.”
結論:日米摩擦の緩和と円需給への含意
Balancing Strength and Weakness
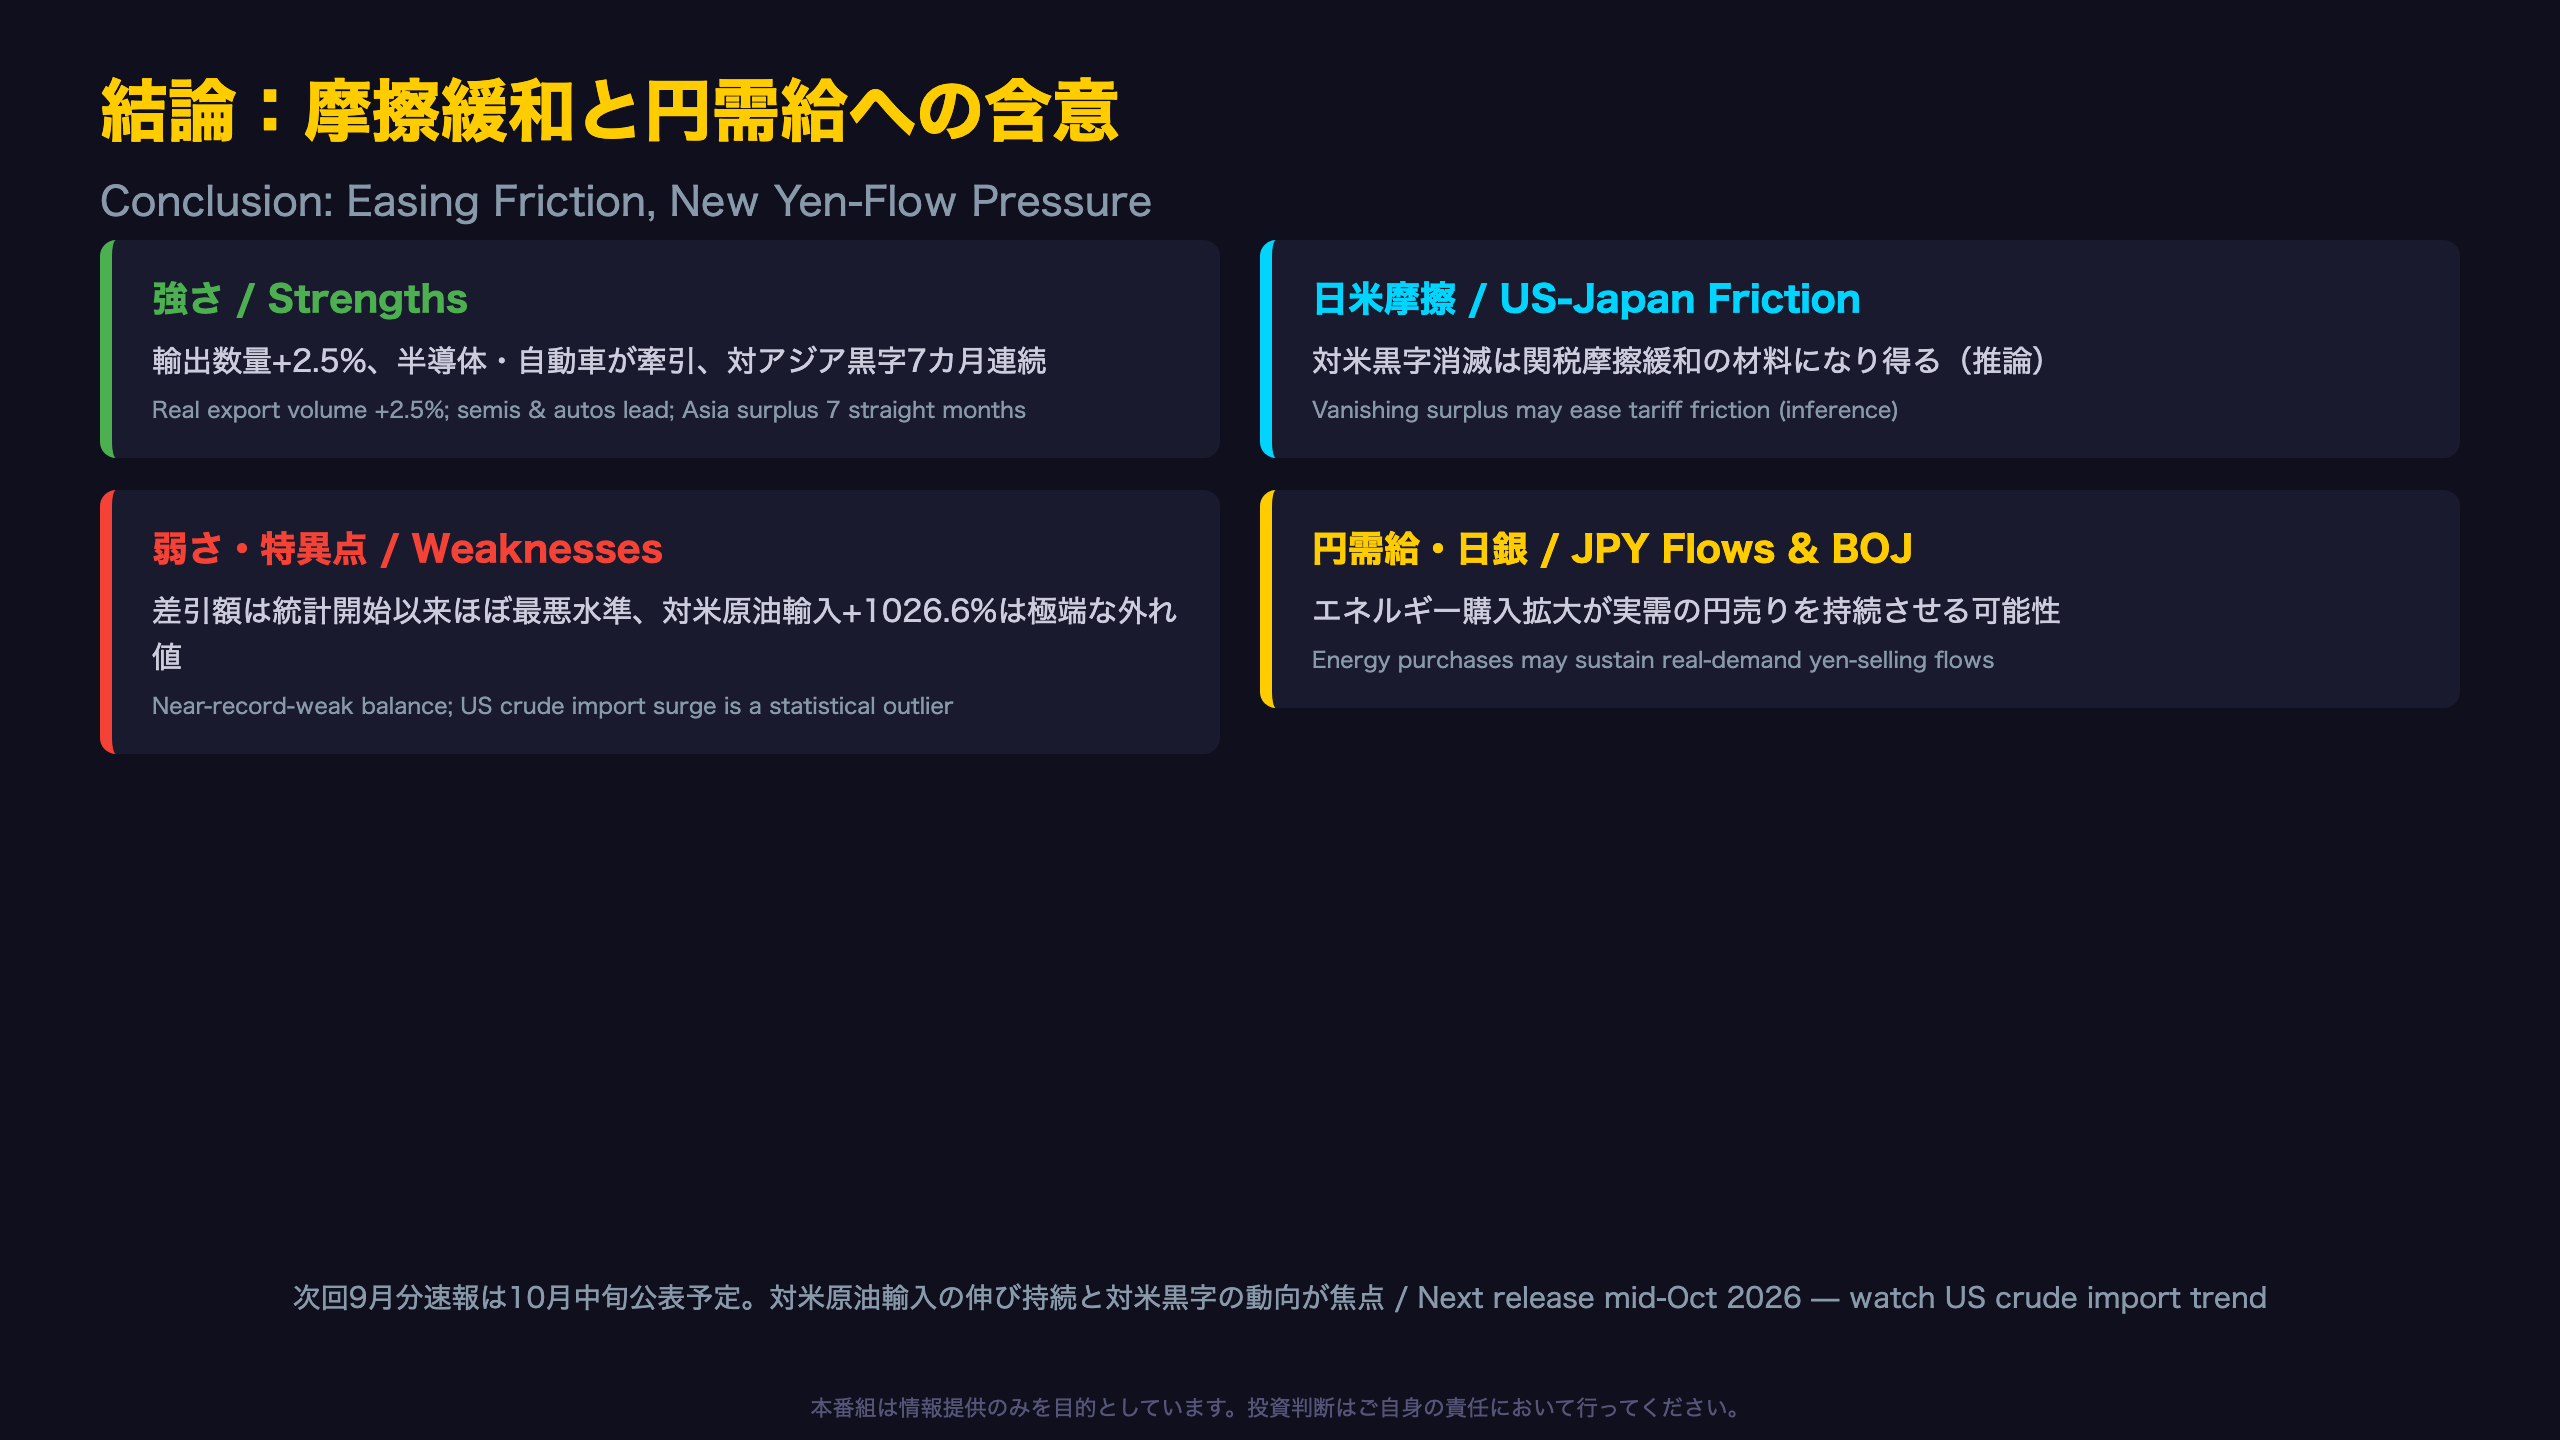
This data does not support a simple “widening deficit equals economic weakness” narrative.
Signs of strength
- Export volume index rose a real +2.5%
- Semiconductors (+3.6pt contribution) and autos (+2.3pt) led exports
- Asia surplus extended to a 7th consecutive month
Signs of weakness / anomalies
- The deficit ranks among the worst in the 572-month historical record (548th)
- The US surplus has shrunk for 9 consecutive months YoY, and the pace is accelerating
- US crude oil imports rose 1026.6% — a statistically extreme outlier
Market implications (inference)
The near-disappearance of Japan’s US trade surplus effectively means a smaller US deficit with Japan — from Washington’s perspective, this could ease pressure in ongoing tariff discussions (a moderate-confidence inference, supported by multiple aligned data points). On the other hand, if expanded US energy purchases persist structurally, they could provide an ongoing source of real-demand dollar buying/yen selling — a flow-based yen pressure distinct from the more commonly discussed interest-rate differential story.
These are inferences drawn from a single month of data and should not be read as confirmed causal relationships.
What to watch next
The September data release, expected mid-October 2026, will be the key test: does the triple-digit-percent surge in US crude imports persist, or was August an outlier? That will determine whether this is a structural realignment or a temporary spike.
Disclaimer: This article is for informational purposes only. All investment decisions are made solely at your own risk.