📺 Watch the Full Video Analysis
This article was automatically generated by the NFC Market Live AI analysis system. (Updated: 2026-07-21 15:29 JST)
📄 Primary Source
Office for National Statistics
https://www.ons.gov.uk/employmentandlabourmarket/peopleinwork/employmentandemployeetypes/bulletins/uklabourmarket/latest
Deep dive into the UK’s July 2026 Labour Market Overview from the Office for National Statistics (ONS), released July 21, 2026.
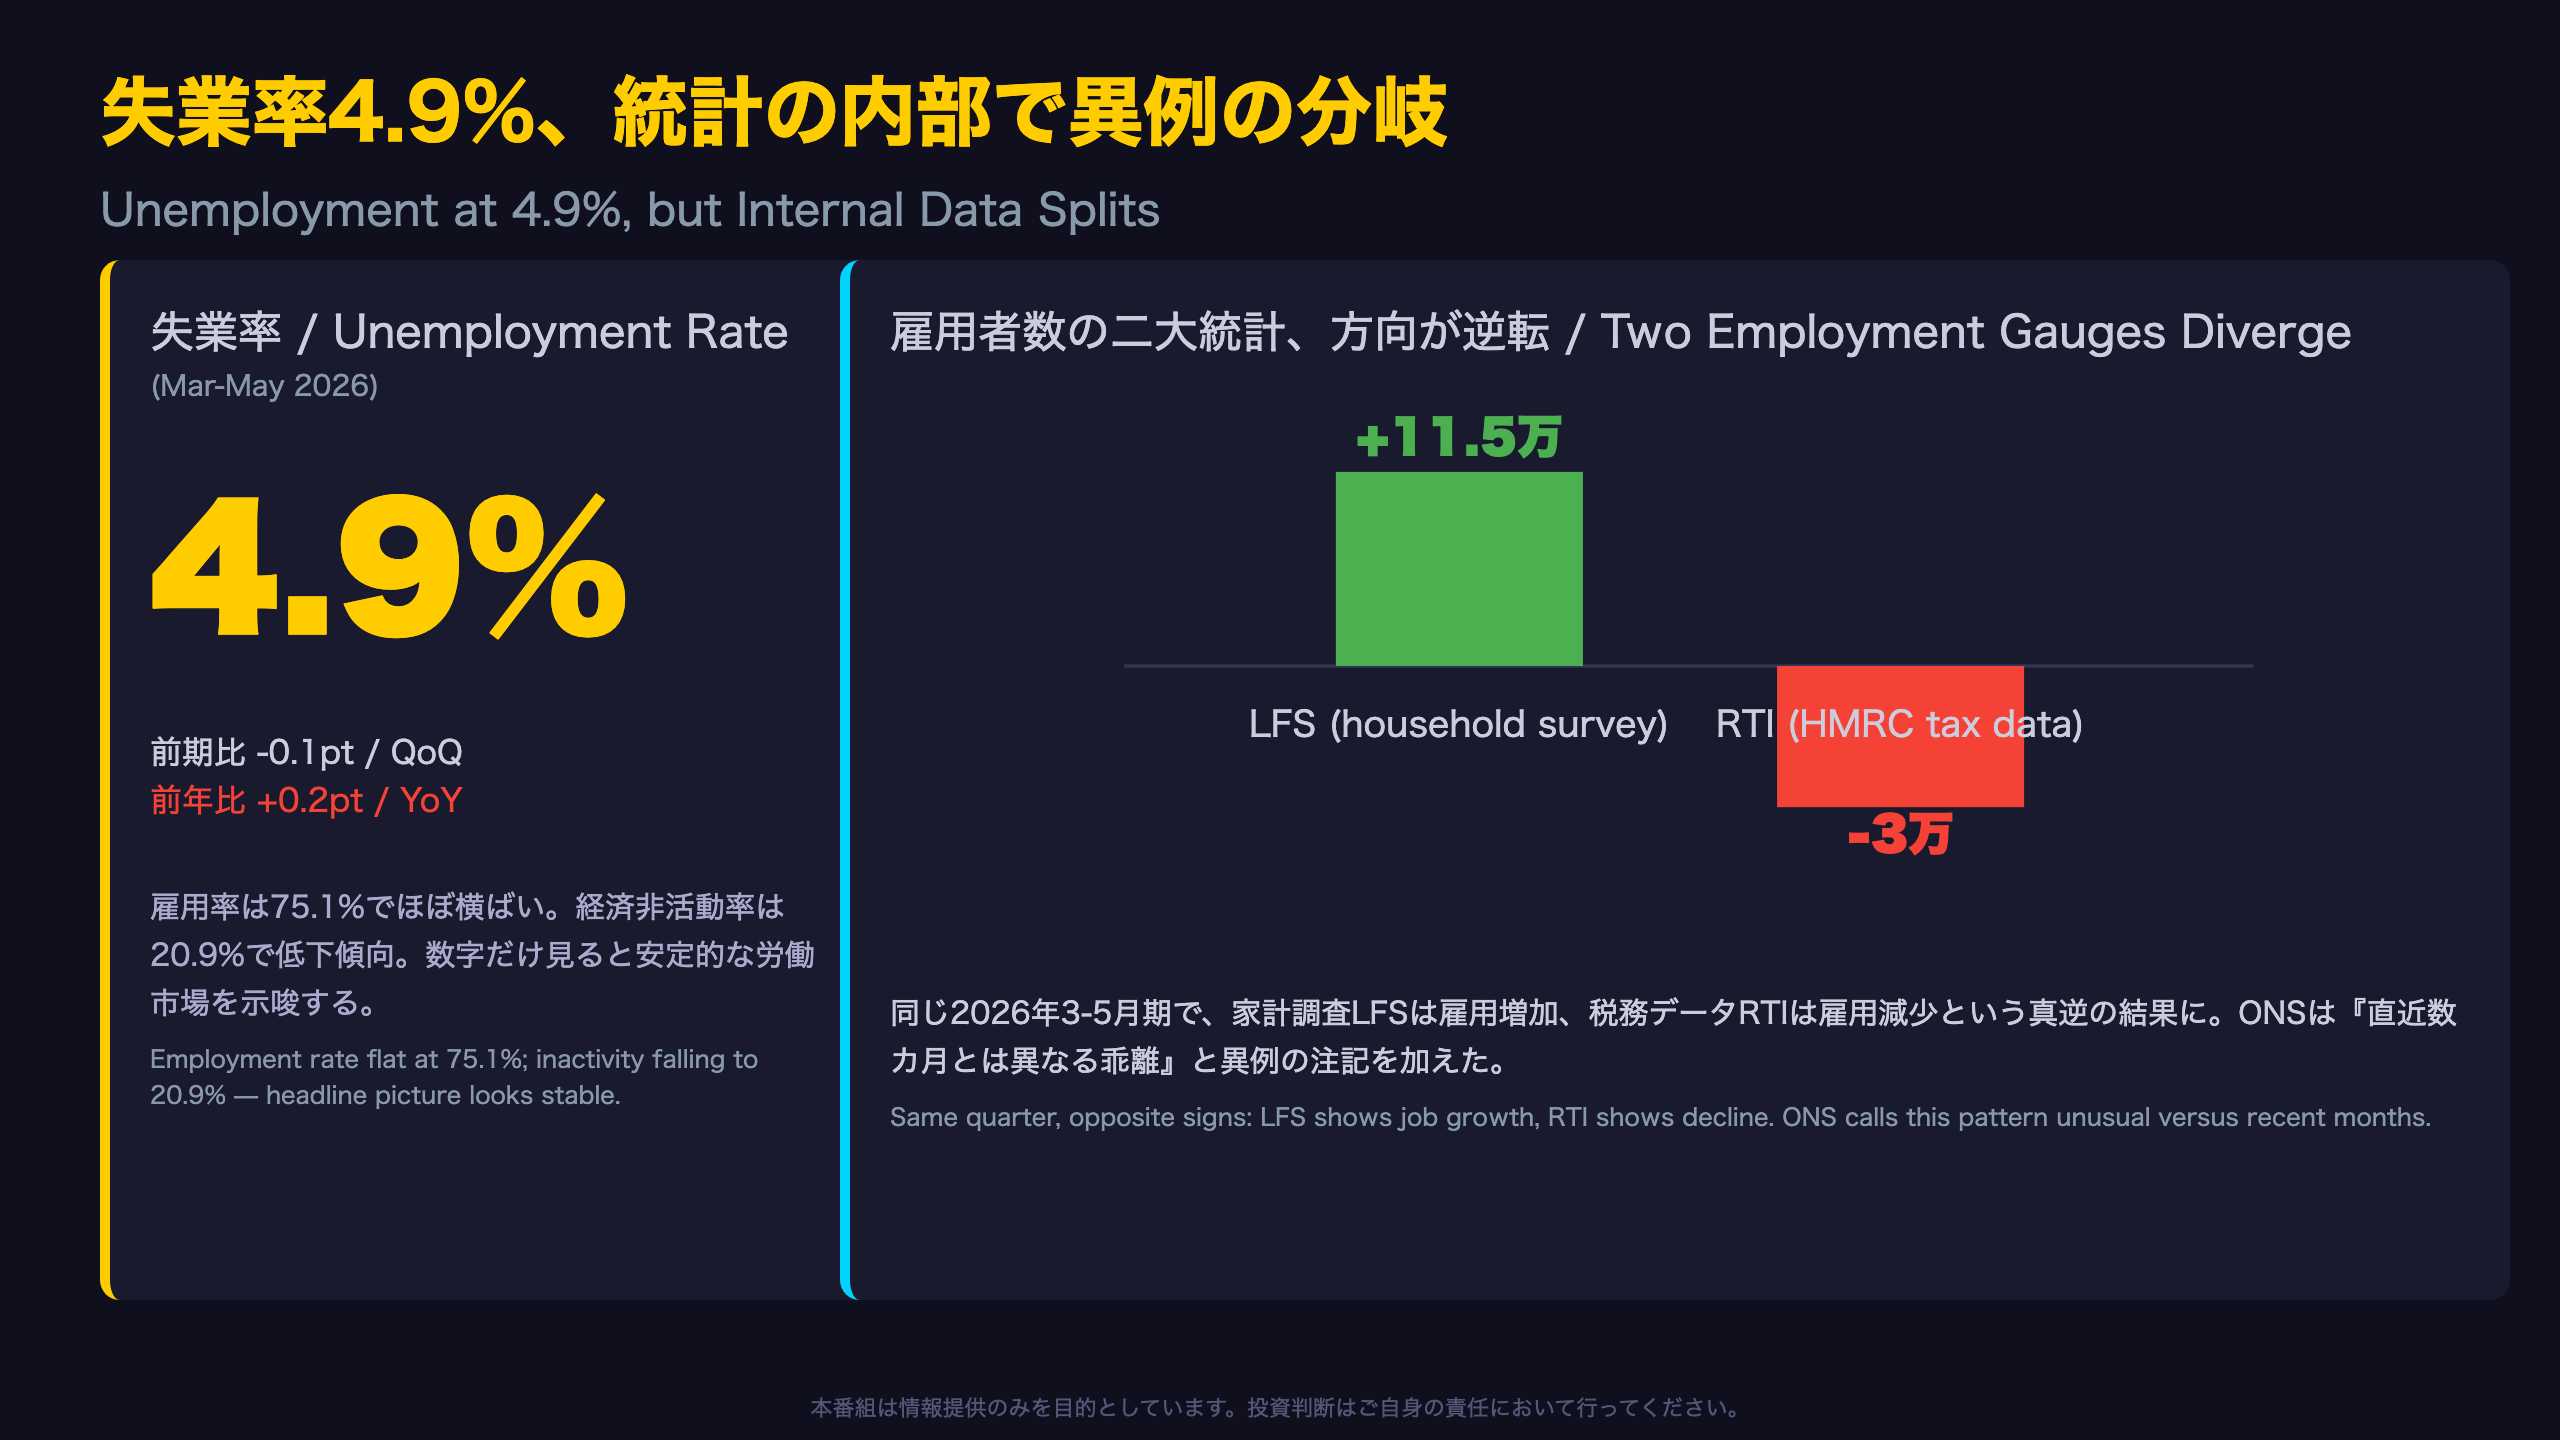
📊 Unemployment held at 4.9%, down 0.1pt on the quarter — calm on the surface.
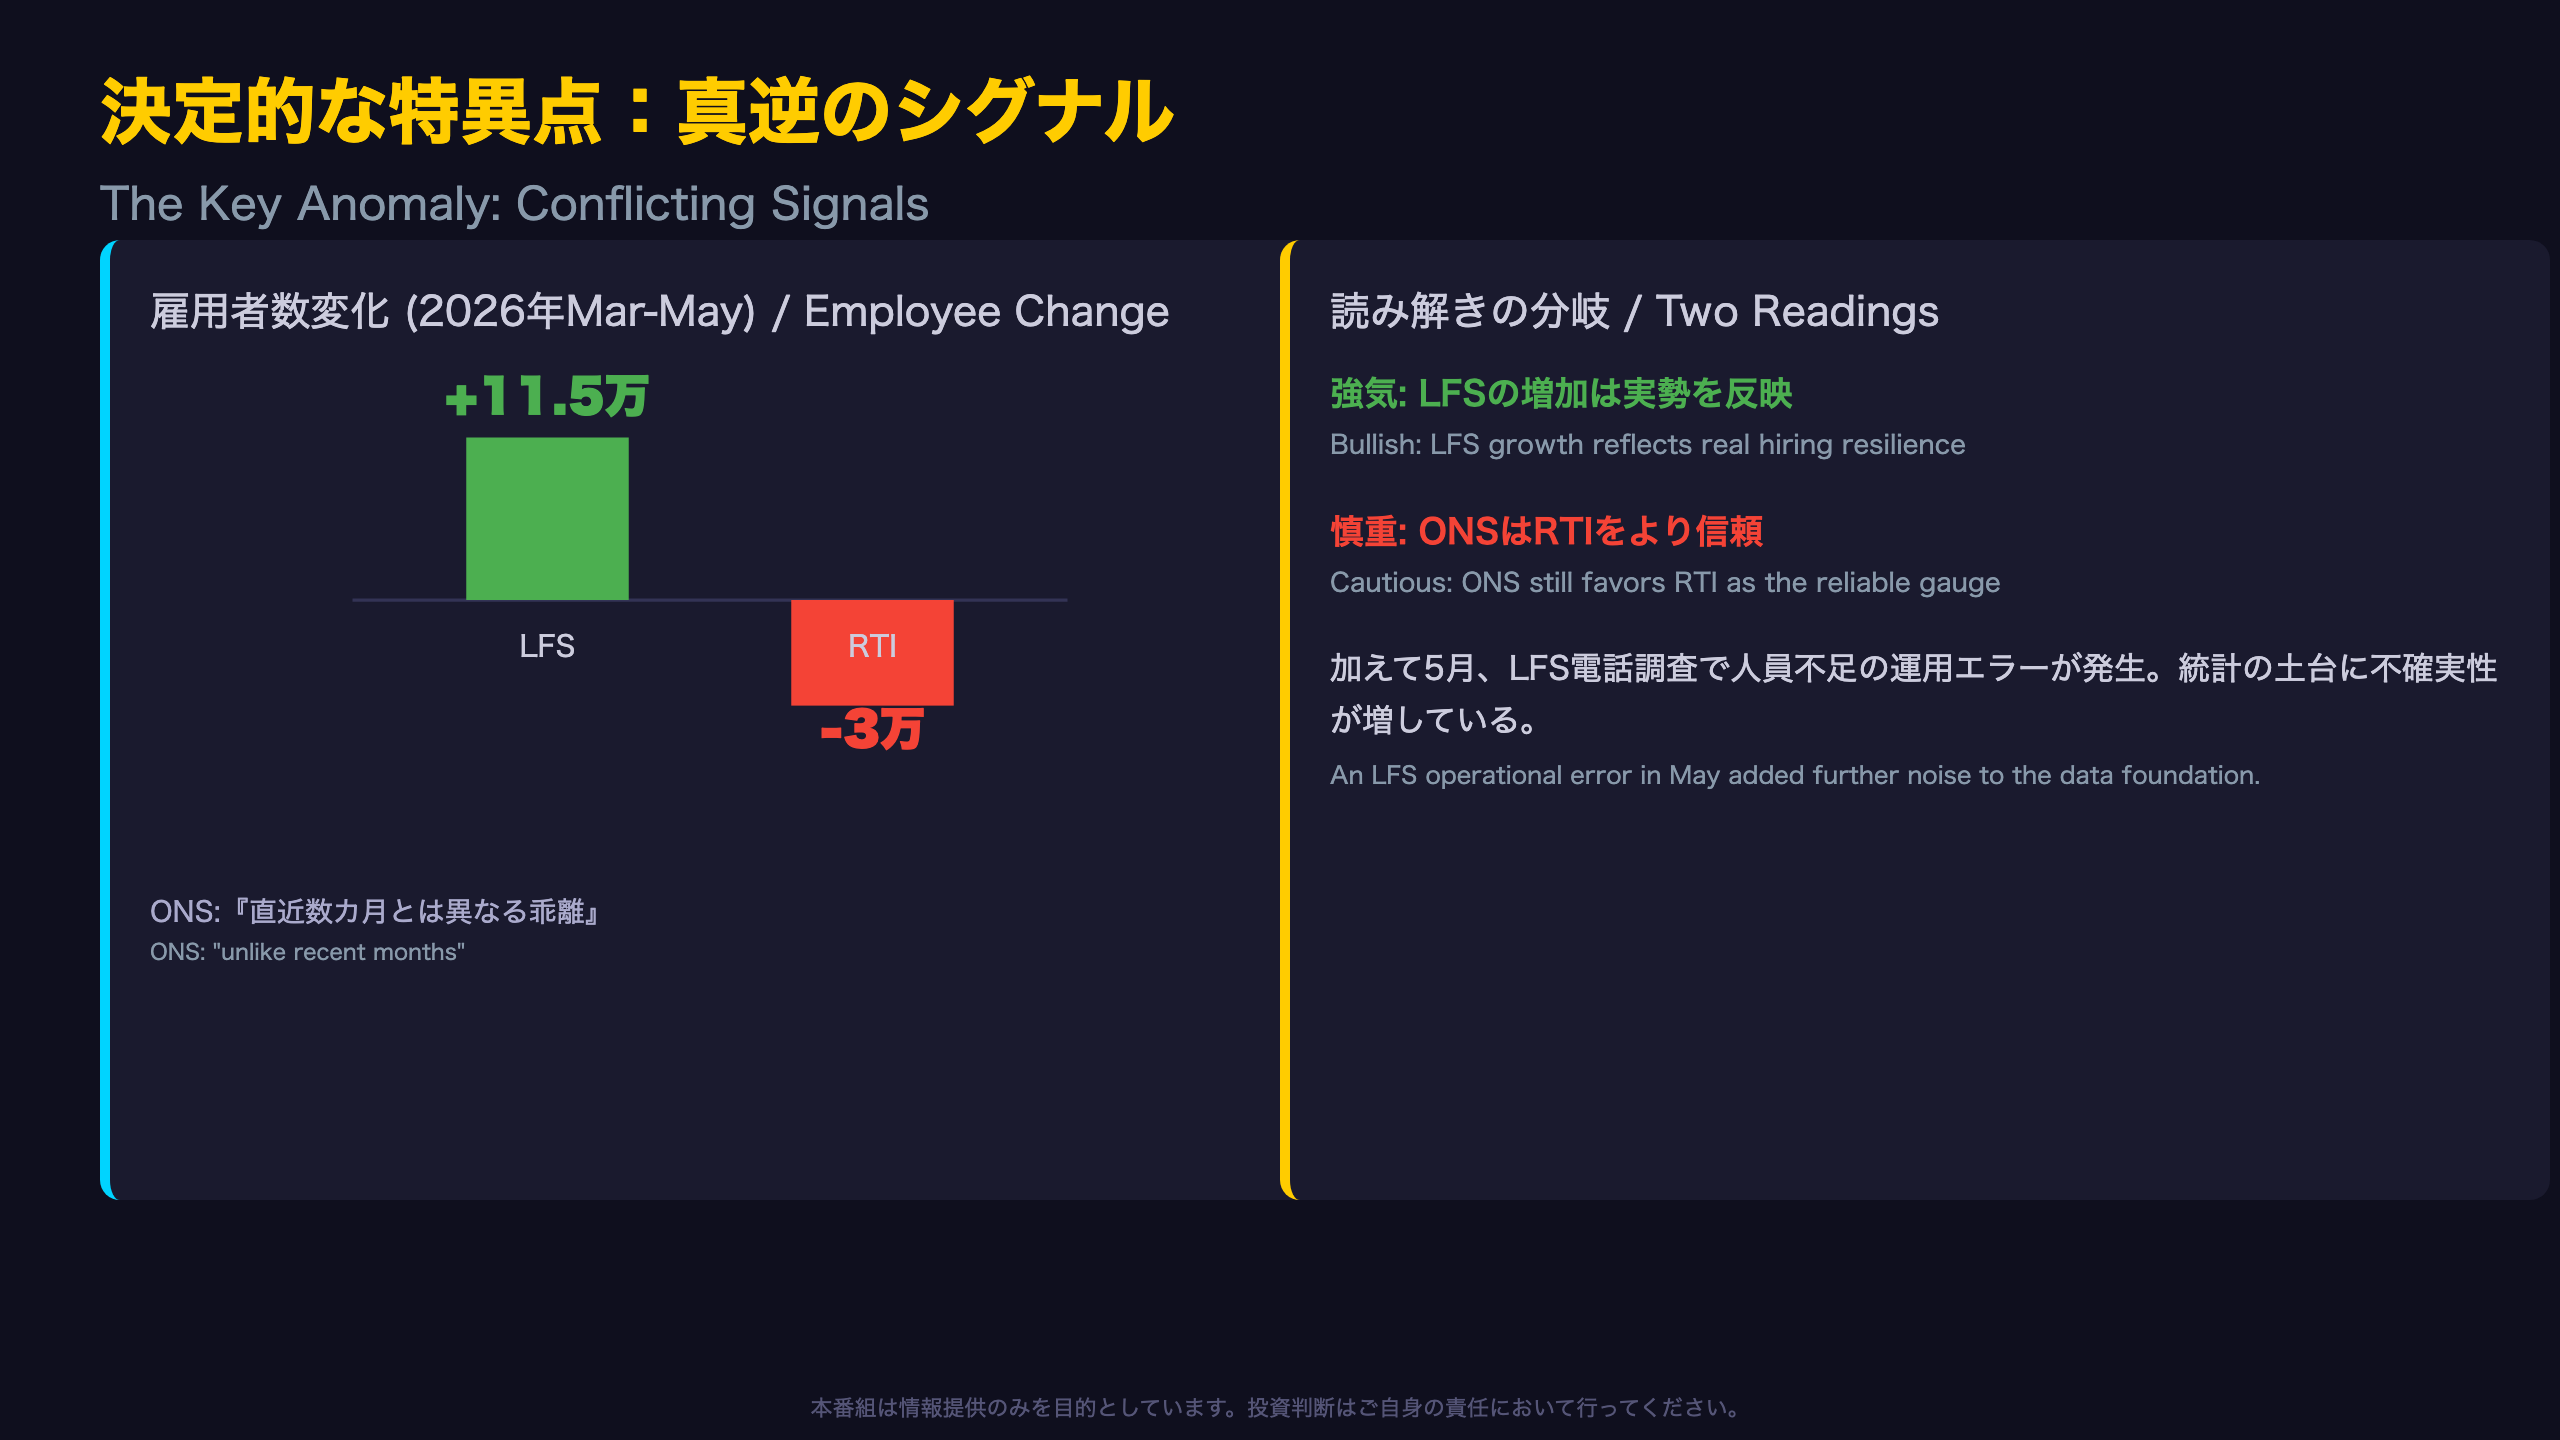
⚠️ But the Labour Force Survey showed +115,000 employees while HMRC’s RTI tax data showed -30,000 for the same quarter. ONS flagged this divergence as unusual.
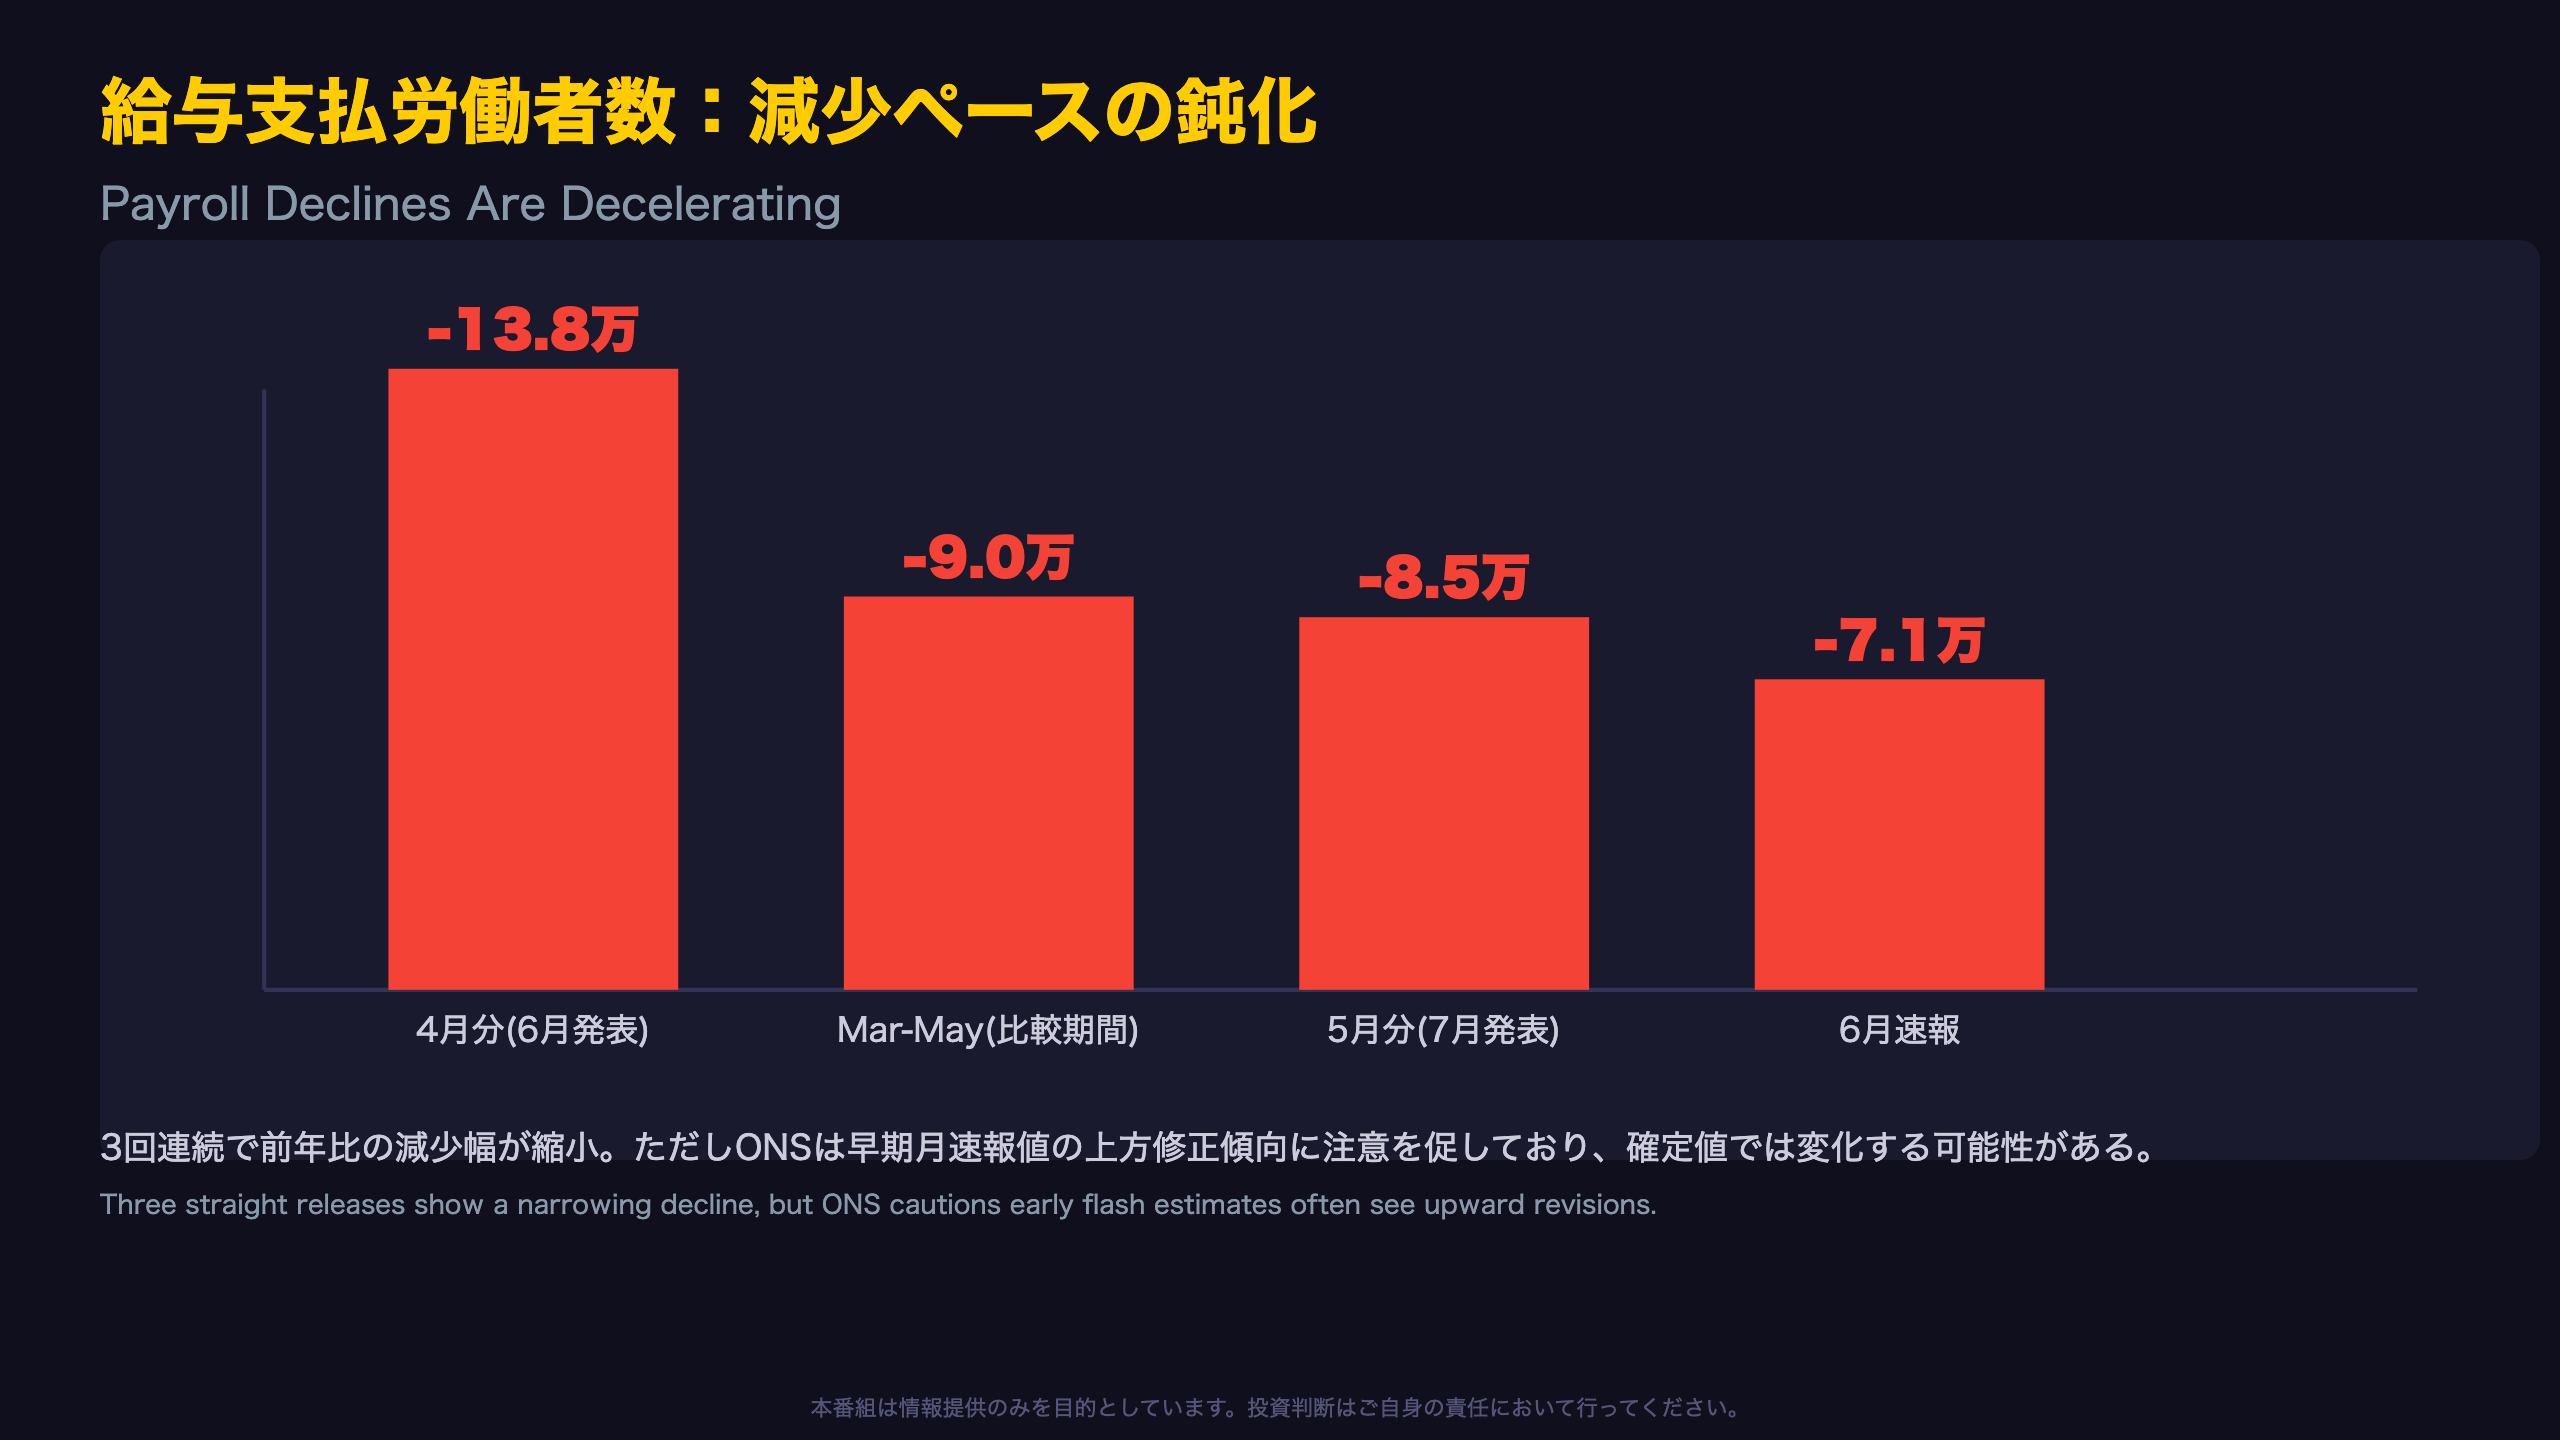
📈 Payroll declines are decelerating (-85k YoY vs -138k in the prior release), and vacancies show tentative signs of bottoming after a 5-year low.
💰 The public-private pay growth gap widened to 2.6 points.
We break down what this means for the Bank of England’s next rate decision.
The Ultimate Summary:失業率4.9%の裏にある異例のデータ乖離
A Calm Headline Number Hides a Data Integrity Story
The UK’s headline unemployment rate ticked down to 4.9% for March-May 2026, suggesting a labour market cooling gently and predictably. But readers unfamiliar with UK labour statistics should know that the UK produces employment estimates from three distinct sources: the Labour Force Survey (LFS, a household survey), Workforce Jobs (a business survey), and PAYE Real Time Information (RTI, HMRC tax records covering the entire population).
Normally these broadly agree. This release, however, flags an unusual split: LFS shows +115,000 employees for the quarter, while RTI shows -30,000 — language the ONS rarely uses in these bulletins.
Why this matters for investors
For readers used to a single US nonfarm payrolls print, this is roughly equivalent to the household and establishment surveys moving in opposite directions in the same month. The Bank of England gets exceptional pre-release access to this exact data ahead of MPC meetings, meaning this ambiguity was on policymakers’ desks before their June decision.
The trend still matters
Despite the divergence, the pace of RTI payroll declines has moderated: -85,000 year-on-year in May versus -138,000 in April’s release, a deceleration rather than acceleration of job losses. Watch the August 18 release, when ONS says it will reassess whether the LFS-RTI split persists.
給与支払労働者数:減少ペースは鈍化
Is the Slowing Decline a Real Trend?
The year-on-year decline in payrolled employees (RTI, HMRC tax data) has narrowed clearly across the last three releases:
| Release | Reference | YoY Change |
|---|---|---|
| June 2026 bulletin | April 2026 | -138,000 |
| June 2026 (comparable qtr) | Feb-Apr | -103,000 |
| July 2026 bulletin | May 2026 | -85,000 |
| July 2026 (comparable qtr) | Mar-May | -90,000 |
| July 2026 (flash) | June 2026 | -71,000 |
This is not single-month noise — the narrowing trend holds across multiple releases, which strengthens the read that UK payroll losses are decelerating rather than accelerating.
The important caveat
The ONS explicitly notes that flash estimates for early months in the tax year “typically carry a greater degree of uncertainty” and “have received larger than average upward revisions” in recent years. In other words, this improving trend could still be revised.
The other side
Meanwhile, the LFS-based employment rate (75.1%) is actually down 0.1 percentage point year-on-year — a reminder that RTI’s improvement and LFS’s stagnation are two separate stories that both deserve attention before drawing a single conclusion.
決定的な特異点:LFSとRTIの真逆の乖離
Why This Isn’t Just Routine Statistical Noise
The ONS states plainly: “The LFS showed an increase of 115,000 employees aged 16 years and over, while comparable RTI data showed a decrease of 30,000… This pattern is seen in both seasonally adjusted and non-seasonally adjusted data, suggesting it is unlikely to be the result of different treatment of seasonality.”
Normally, the UK’s three employment measures — LFS, RTI, and Workforce Jobs — broadly agree on direction even when levels differ. A full sign reversal, as seen here, is rare enough that the ONS felt compelled to flag it explicitly as different from recent months.
An added complication: an LFS operational error
The bulletin also discloses that “an LFS operational error occurred in May 2026 which led to temporary under-resourcing in LFS telephone collection operations.” The ONS says the impact on headline estimates was minimal but concedes there is “a small but noticeable impact on the estimates of average hours.”
Two readings
Bullish read: the LFS increase reflects underlying resilience in hiring that RTI’s monthly volatility hasn’t caught up with yet.
Cautious read: the ONS itself continues to treat RTI as the more reliable gauge of employees, meaning the true picture may be closer to decline.
The August 18 release, which will include more complete RTI data, should reveal whether this split was a one-off or the start of a deeper measurement problem.
求人と賃金:下げ止まりと格差拡大の同時進行
Vacancies: A Subtle Turn Within a Rolling Average
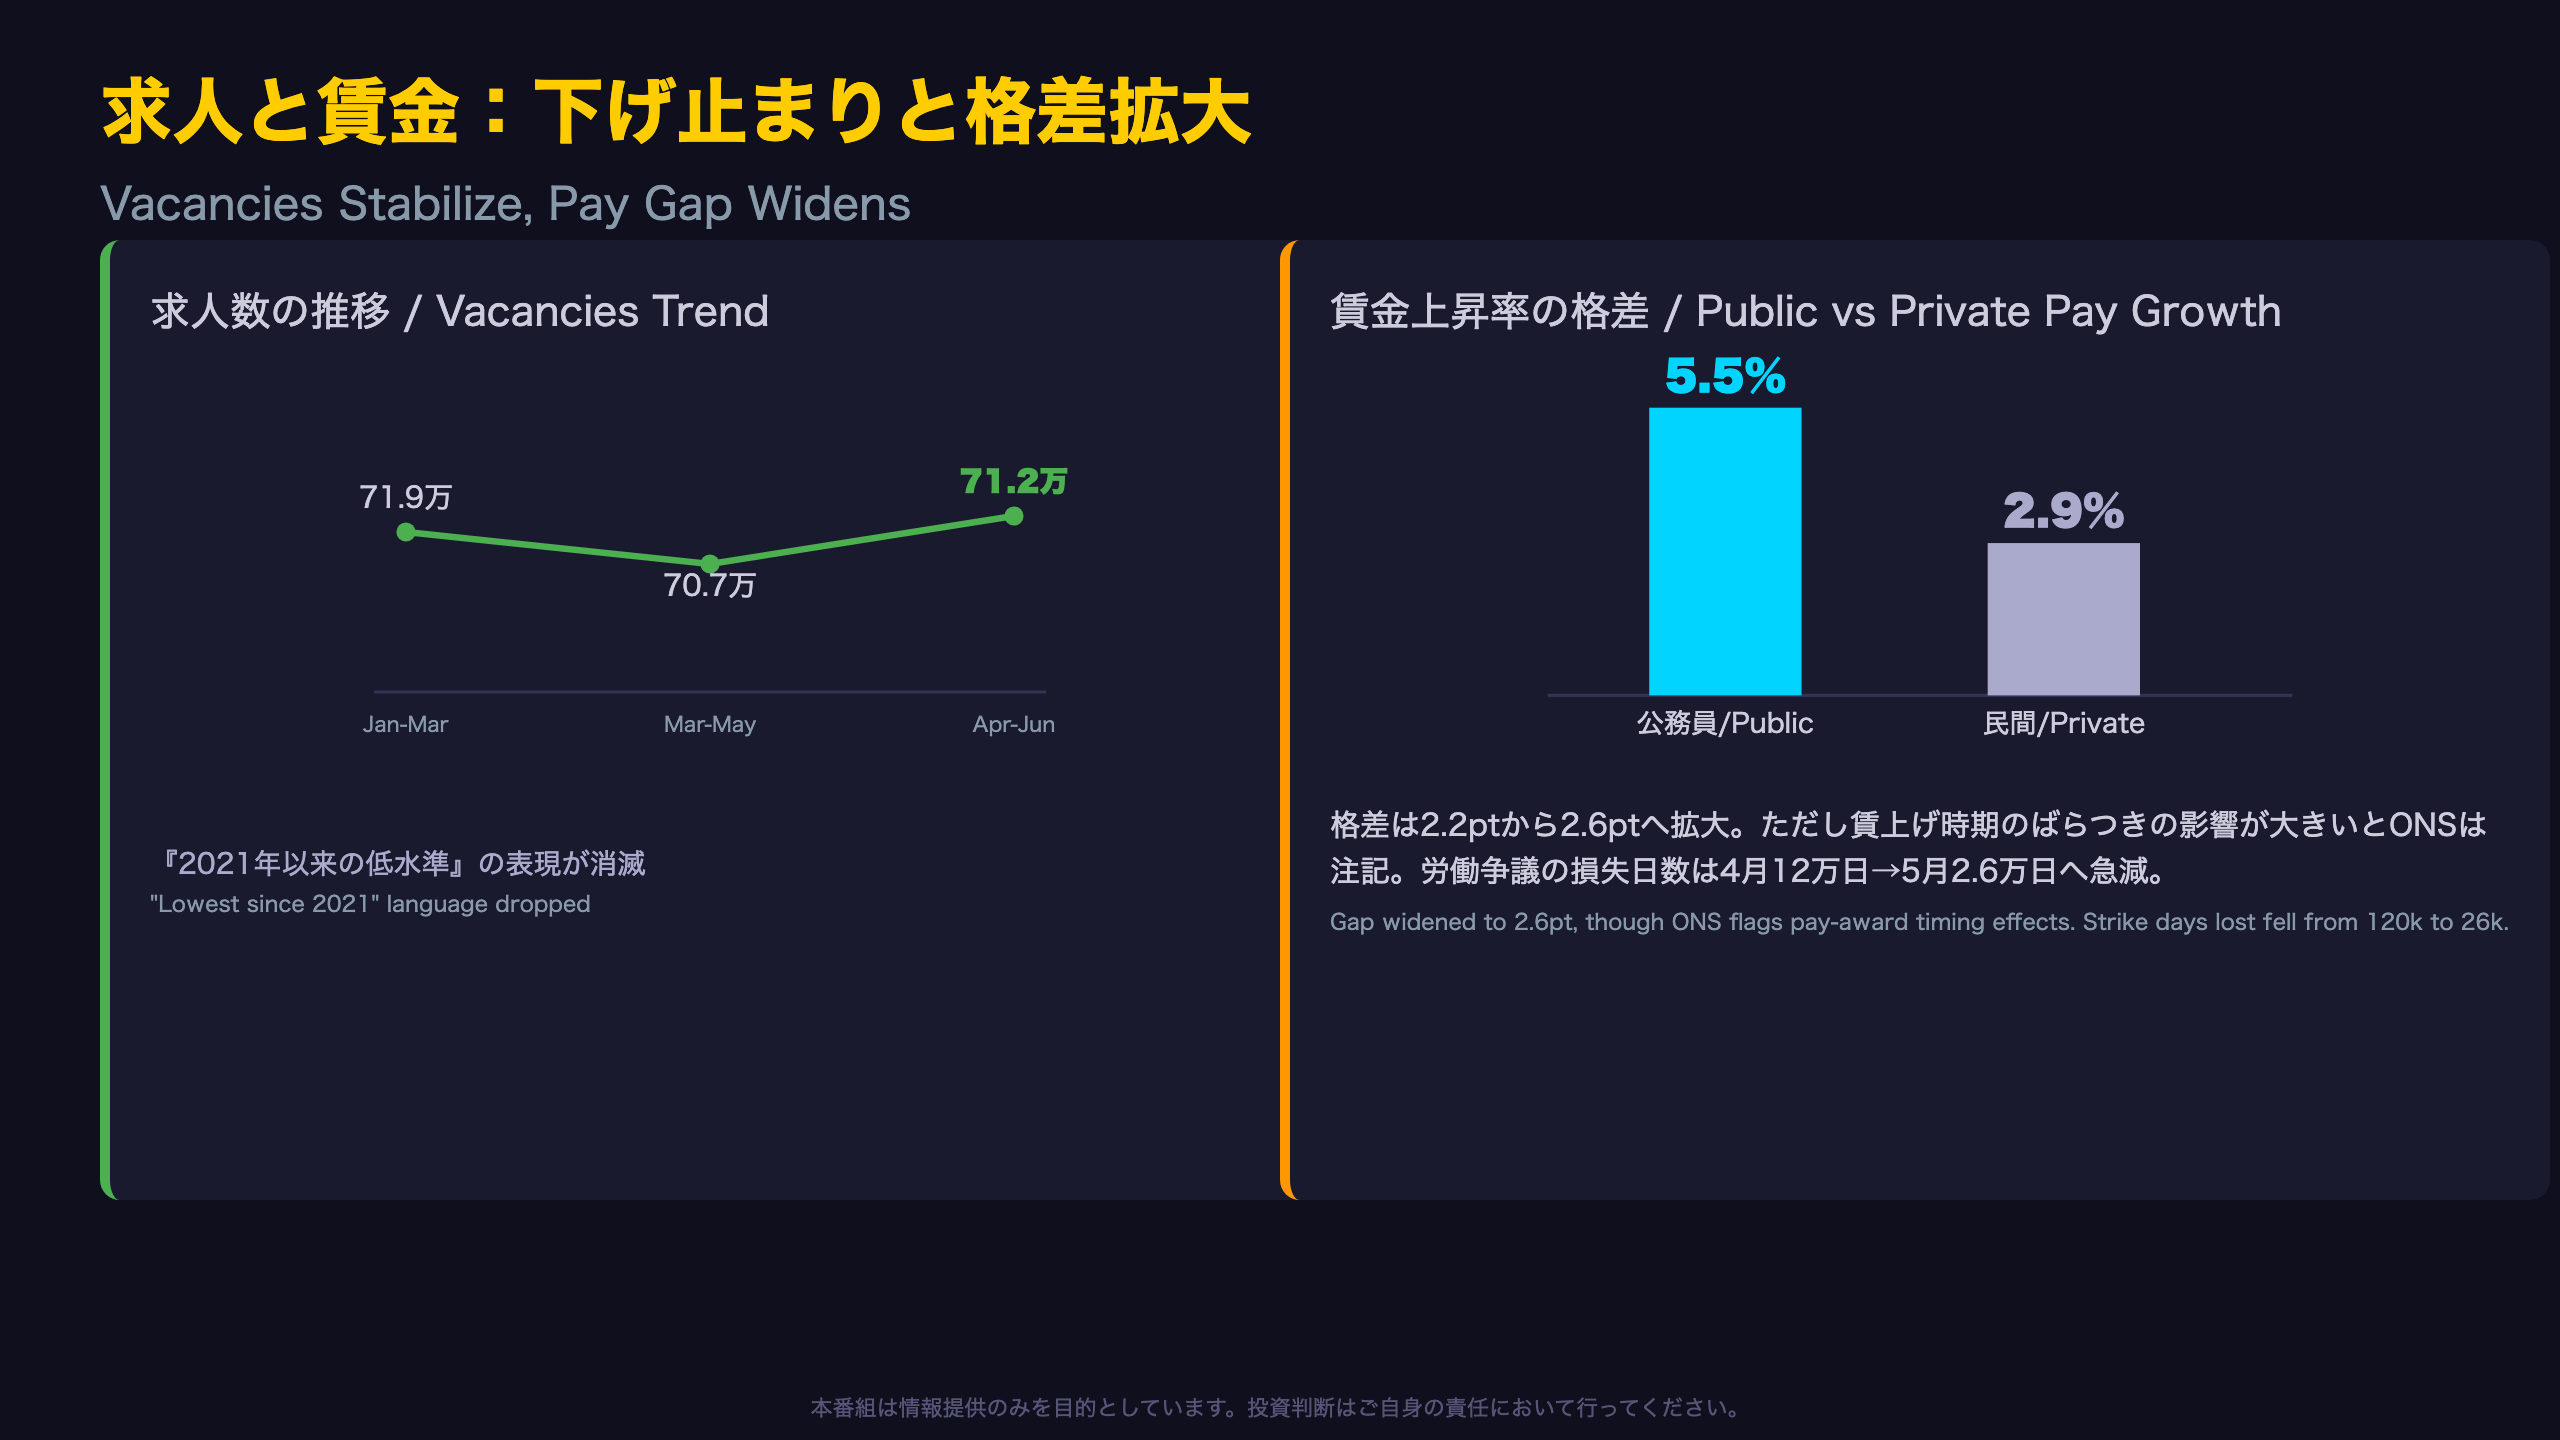
Vacancies rose from 707,000 (Mar-May) to 712,000 (Apr-Jun) on a quarter-to-quarter comparison, even though the bulletin itself frames it as a decrease of 7,000 versus Jan-Mar. This is a function of comparing different rolling three-month windows, and single-quarter reversals shouldn’t be over-read. That said, the disappearance of last month’s language calling vacancies the “lowest level since February to April 2021” is a level-C signal (a possibility, not a certainty) that labour demand may be stabilizing.
Context for international readers
The UK’s Vacancy Survey is roughly analogous to the US JOLTS report, though sampled at a smaller scale. A stabilizing vacancy count after a multi-year low would, in a Fed-watching framework, typically be read as tentatively supportive of labour demand.
The widening public-private pay gap
| Sector | June release (Feb-Apr) | July release (Mar-May) |
|---|---|---|
| Public | +5.1% | +5.5% |
| Private | +2.9% (ref) | +2.9% |
| Gap | 2.2pt | 2.6pt |
The ONS repeatedly cautions that public sector pay growth “continues to be affected by variations in the timing of pay awards this year,” so this should not be read as a simple structural premium.
Strikes ease sharply
Working days lost to labour disputes fell from 120,000 in April (driven mainly by doctors’ strikes) to just 26,000 in May — a signal that public-sector industrial action has cooled markedly.
インプリケーション:BoE・ポンド・英国債への含意
Market Implications: The Chain of Reasoning
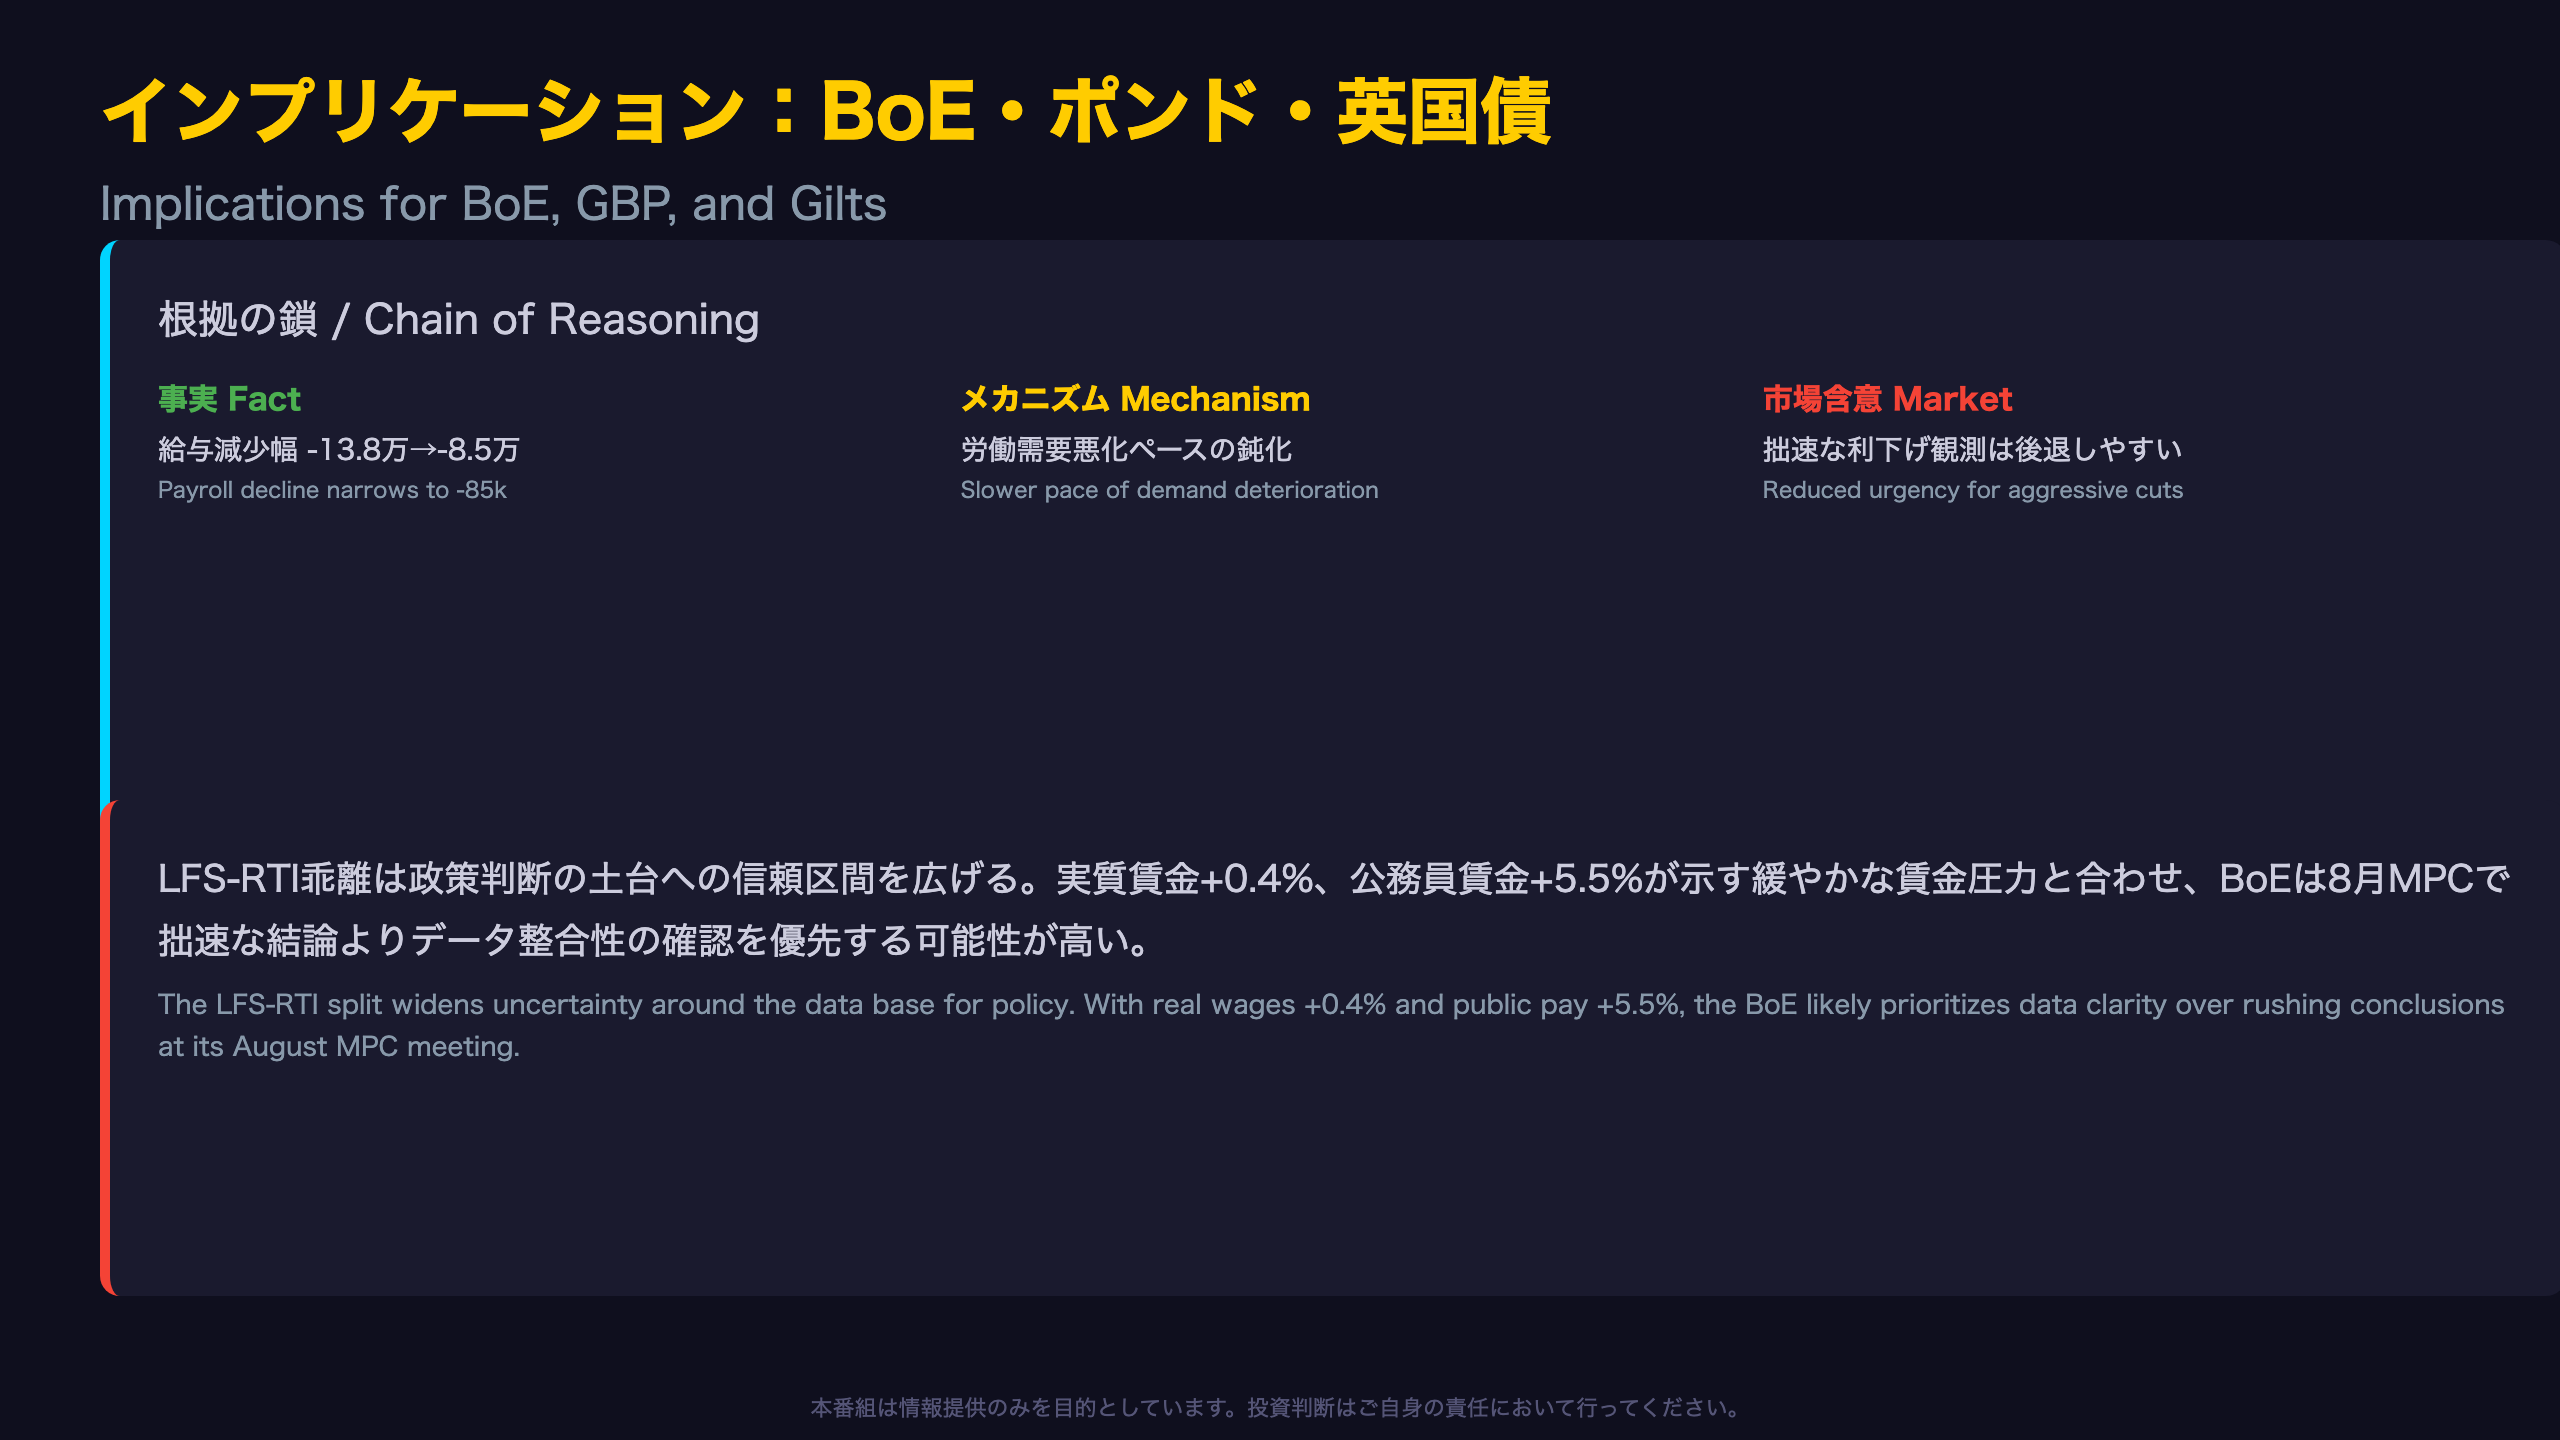
Chain 1: Year-on-year payroll declines narrowed from 138,000 (April) to 85,000 (May) → the pace of labour market deterioration is slowing → generally, this reduces the urgency for aggressive rate cuts, though this single release cannot pin down the Bank of England’s exact policy path.
Chain 2: LFS shows +115,000 employees while RTI shows -30,000, a divergence the ONS itself calls unusual → the confidence interval around the data underpinning policy decisions has widened → central banks generally prefer to wait for data clarity amid such uncertainty, but whether the August release resolves the split in either direction remains genuinely unknown.
Chain 3: Real regular pay growth (CPI-adjusted) held positive at +0.4% while public sector pay accelerated to +5.5% → wage inflation pressure persists at a moderate pace → sticky wage growth is generally seen as supportive of continued monetary caution, though the public-sector figure is heavily influenced by the timing of pay awards, a caveat the ONS itself raises.
For international investors
Unlike the Fed’s dual mandate framework, the Bank of England’s Monetary Policy Committee explicitly received pre-release access to this exact bulletin ahead of its June meeting, underscoring how central this dataset is to UK rate decisions. Watch the August 18 release for whether the LFS-RTI gap closes, and in which direction — that will be the key test of whether today’s ambiguity was noise or signal for GBP and gilt positioning.
Disclaimer: This article is for informational purposes only. All investment decisions are made solely at your own risk.