📺 Watch the Full Video Analysis
This article was automatically generated by the NFC Market Live AI analysis system. (Updated: 2026-10-02 23:10 JST)
📄 Primary Source
U.S. Census Bureau
https://www.census.gov/manufacturing/m3/prel/pdf/s-i-o.pdf
📊 Breaking down the U.S. August Durable Goods report.
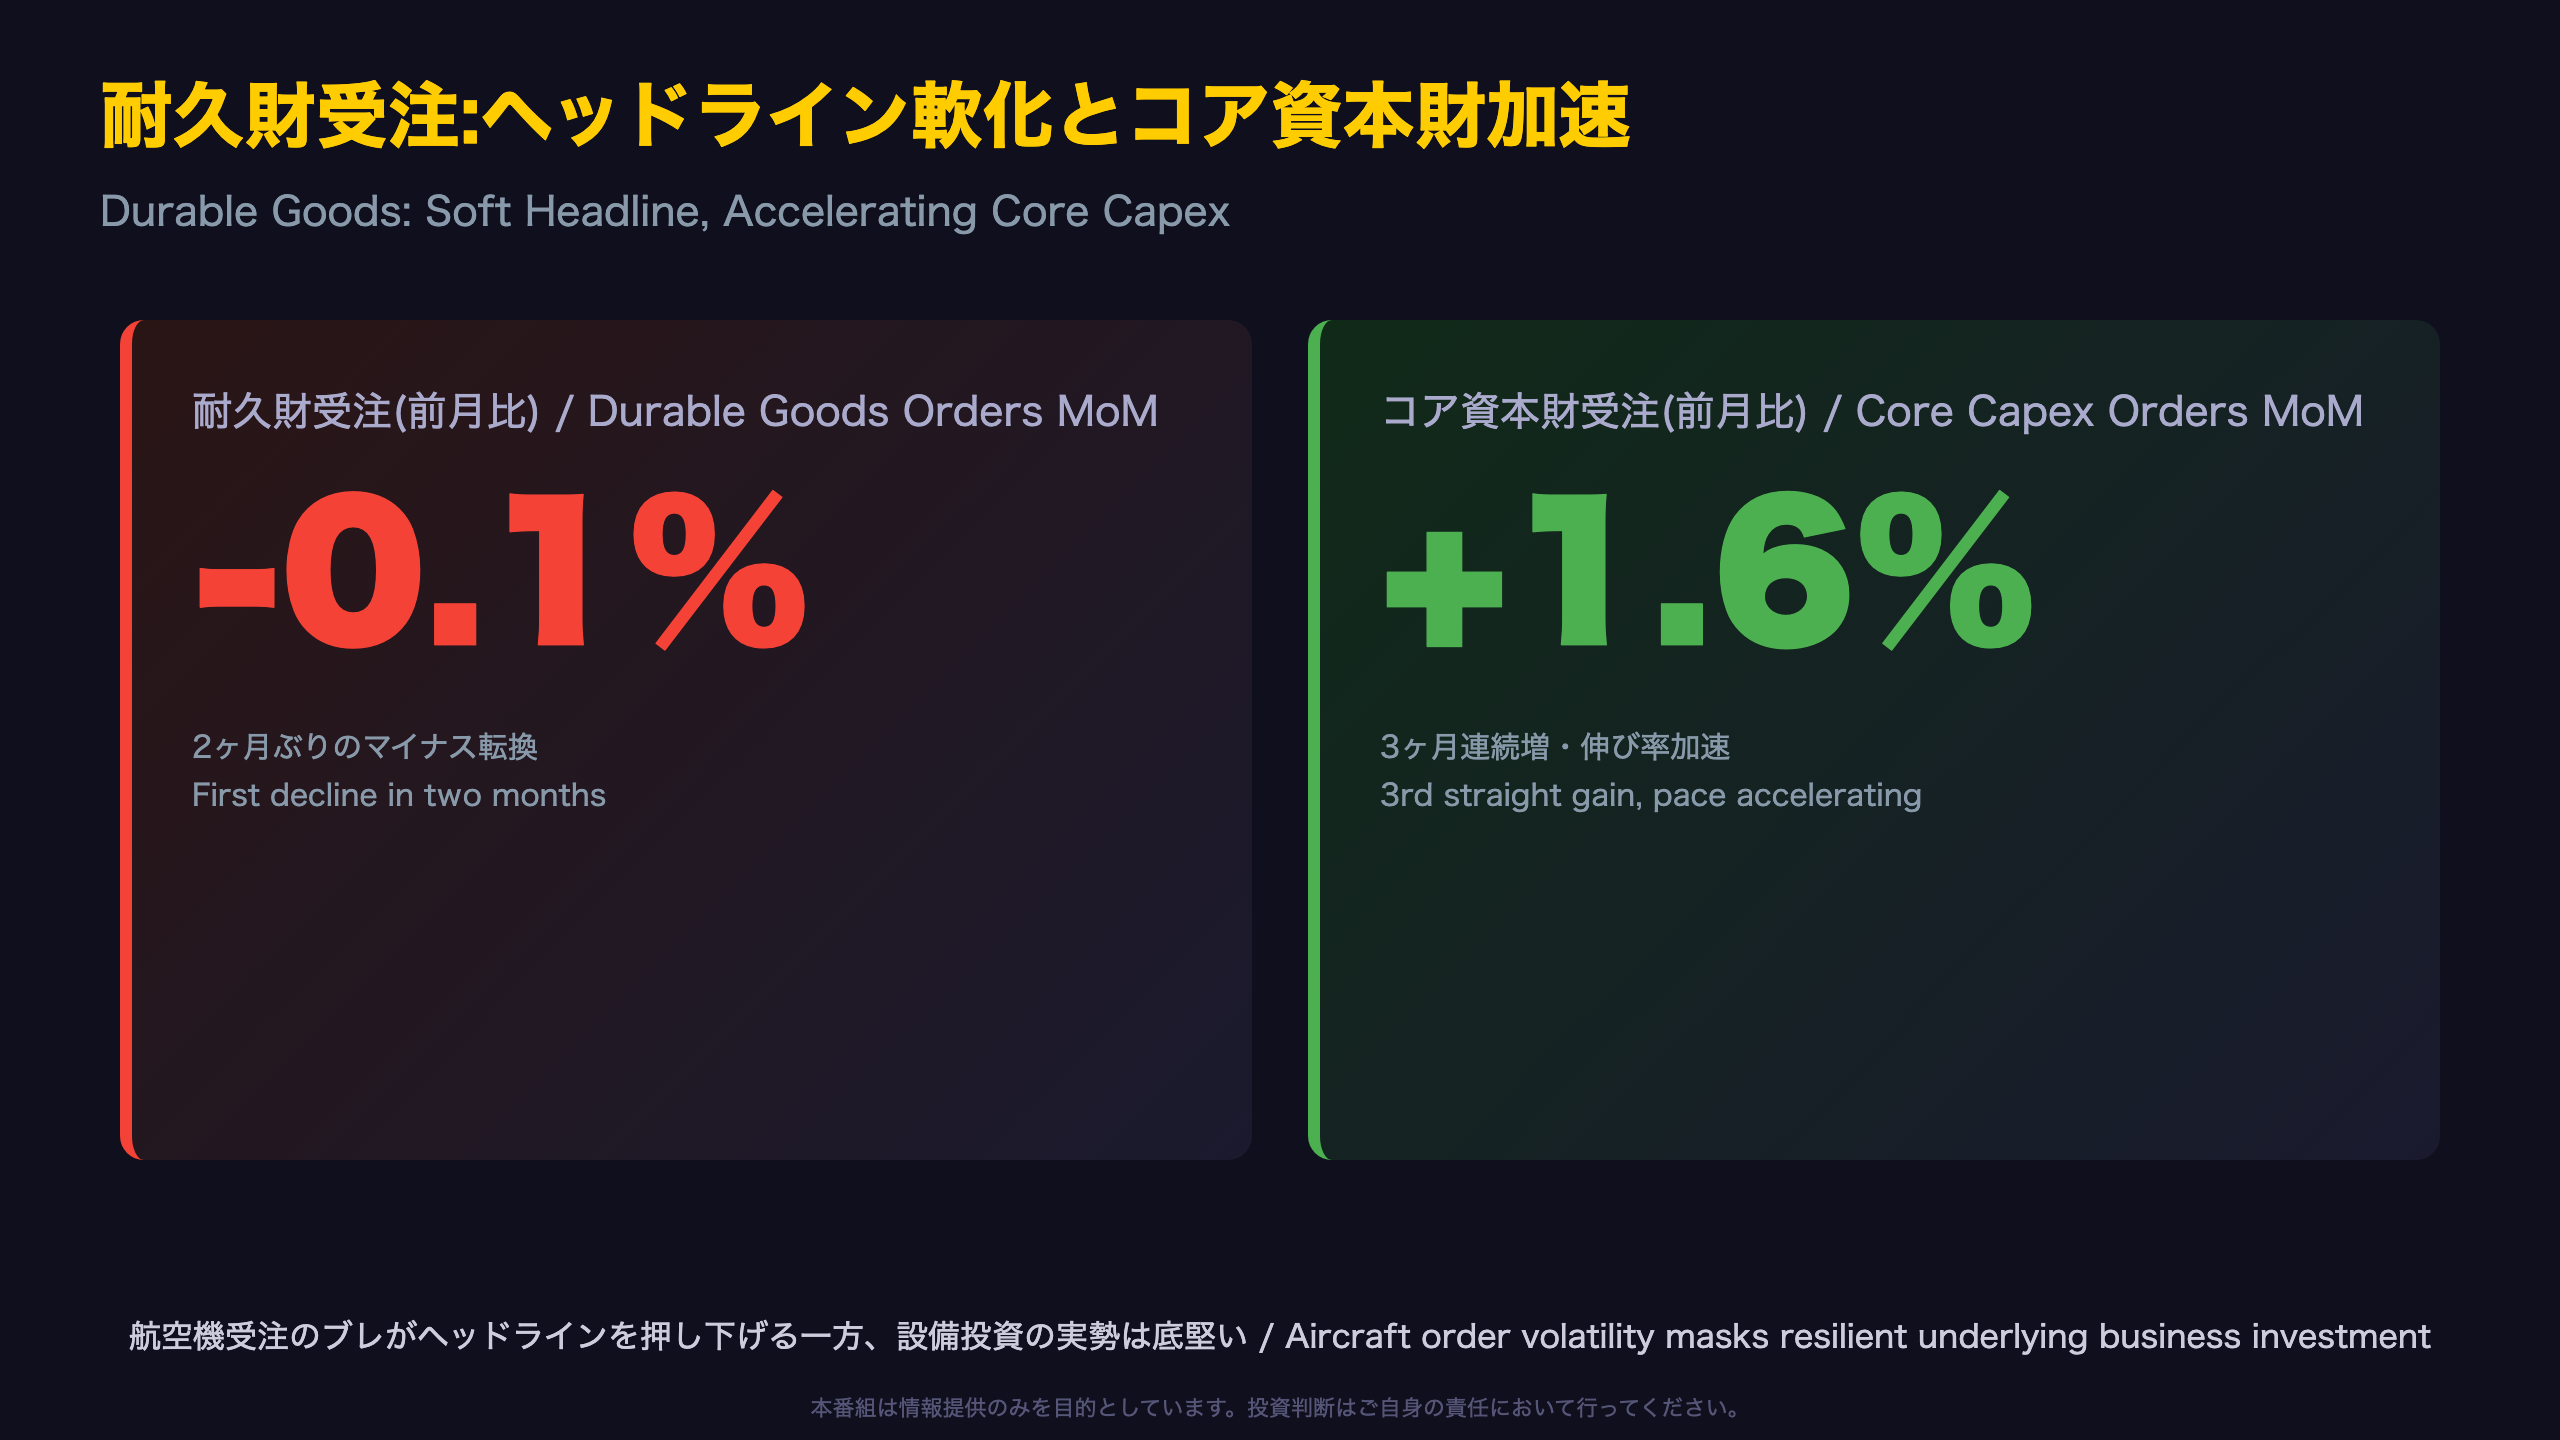
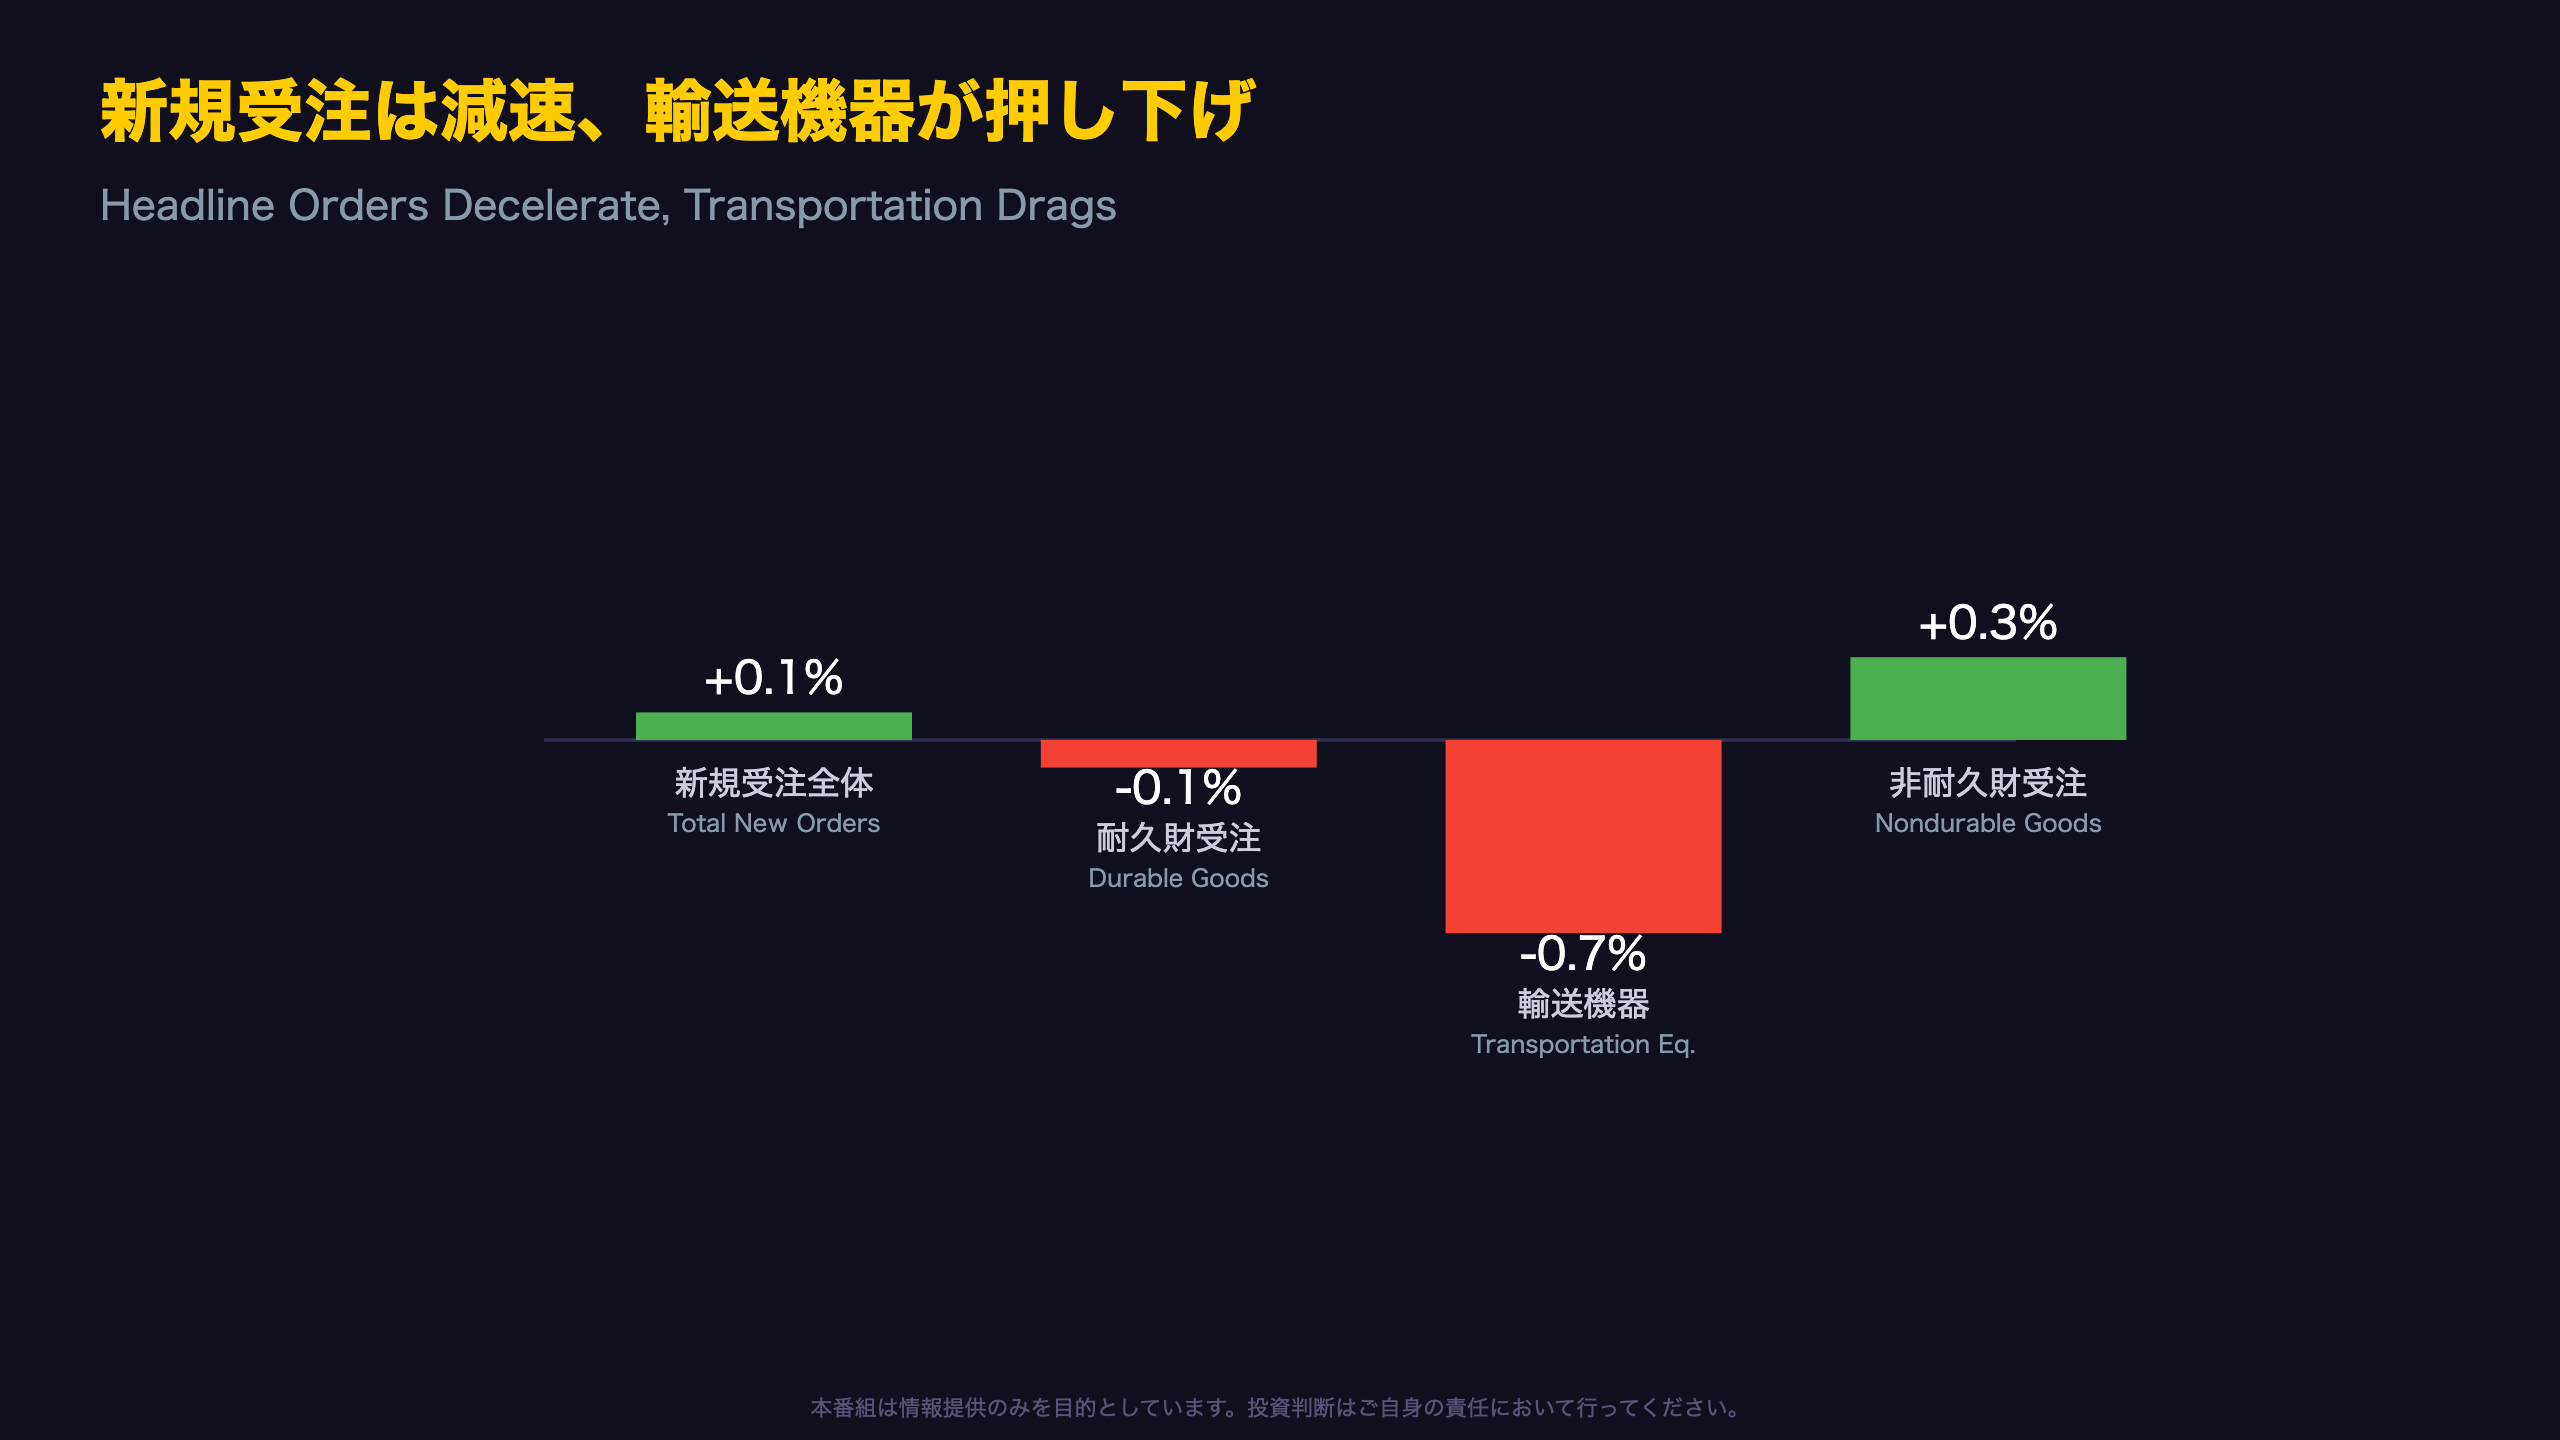
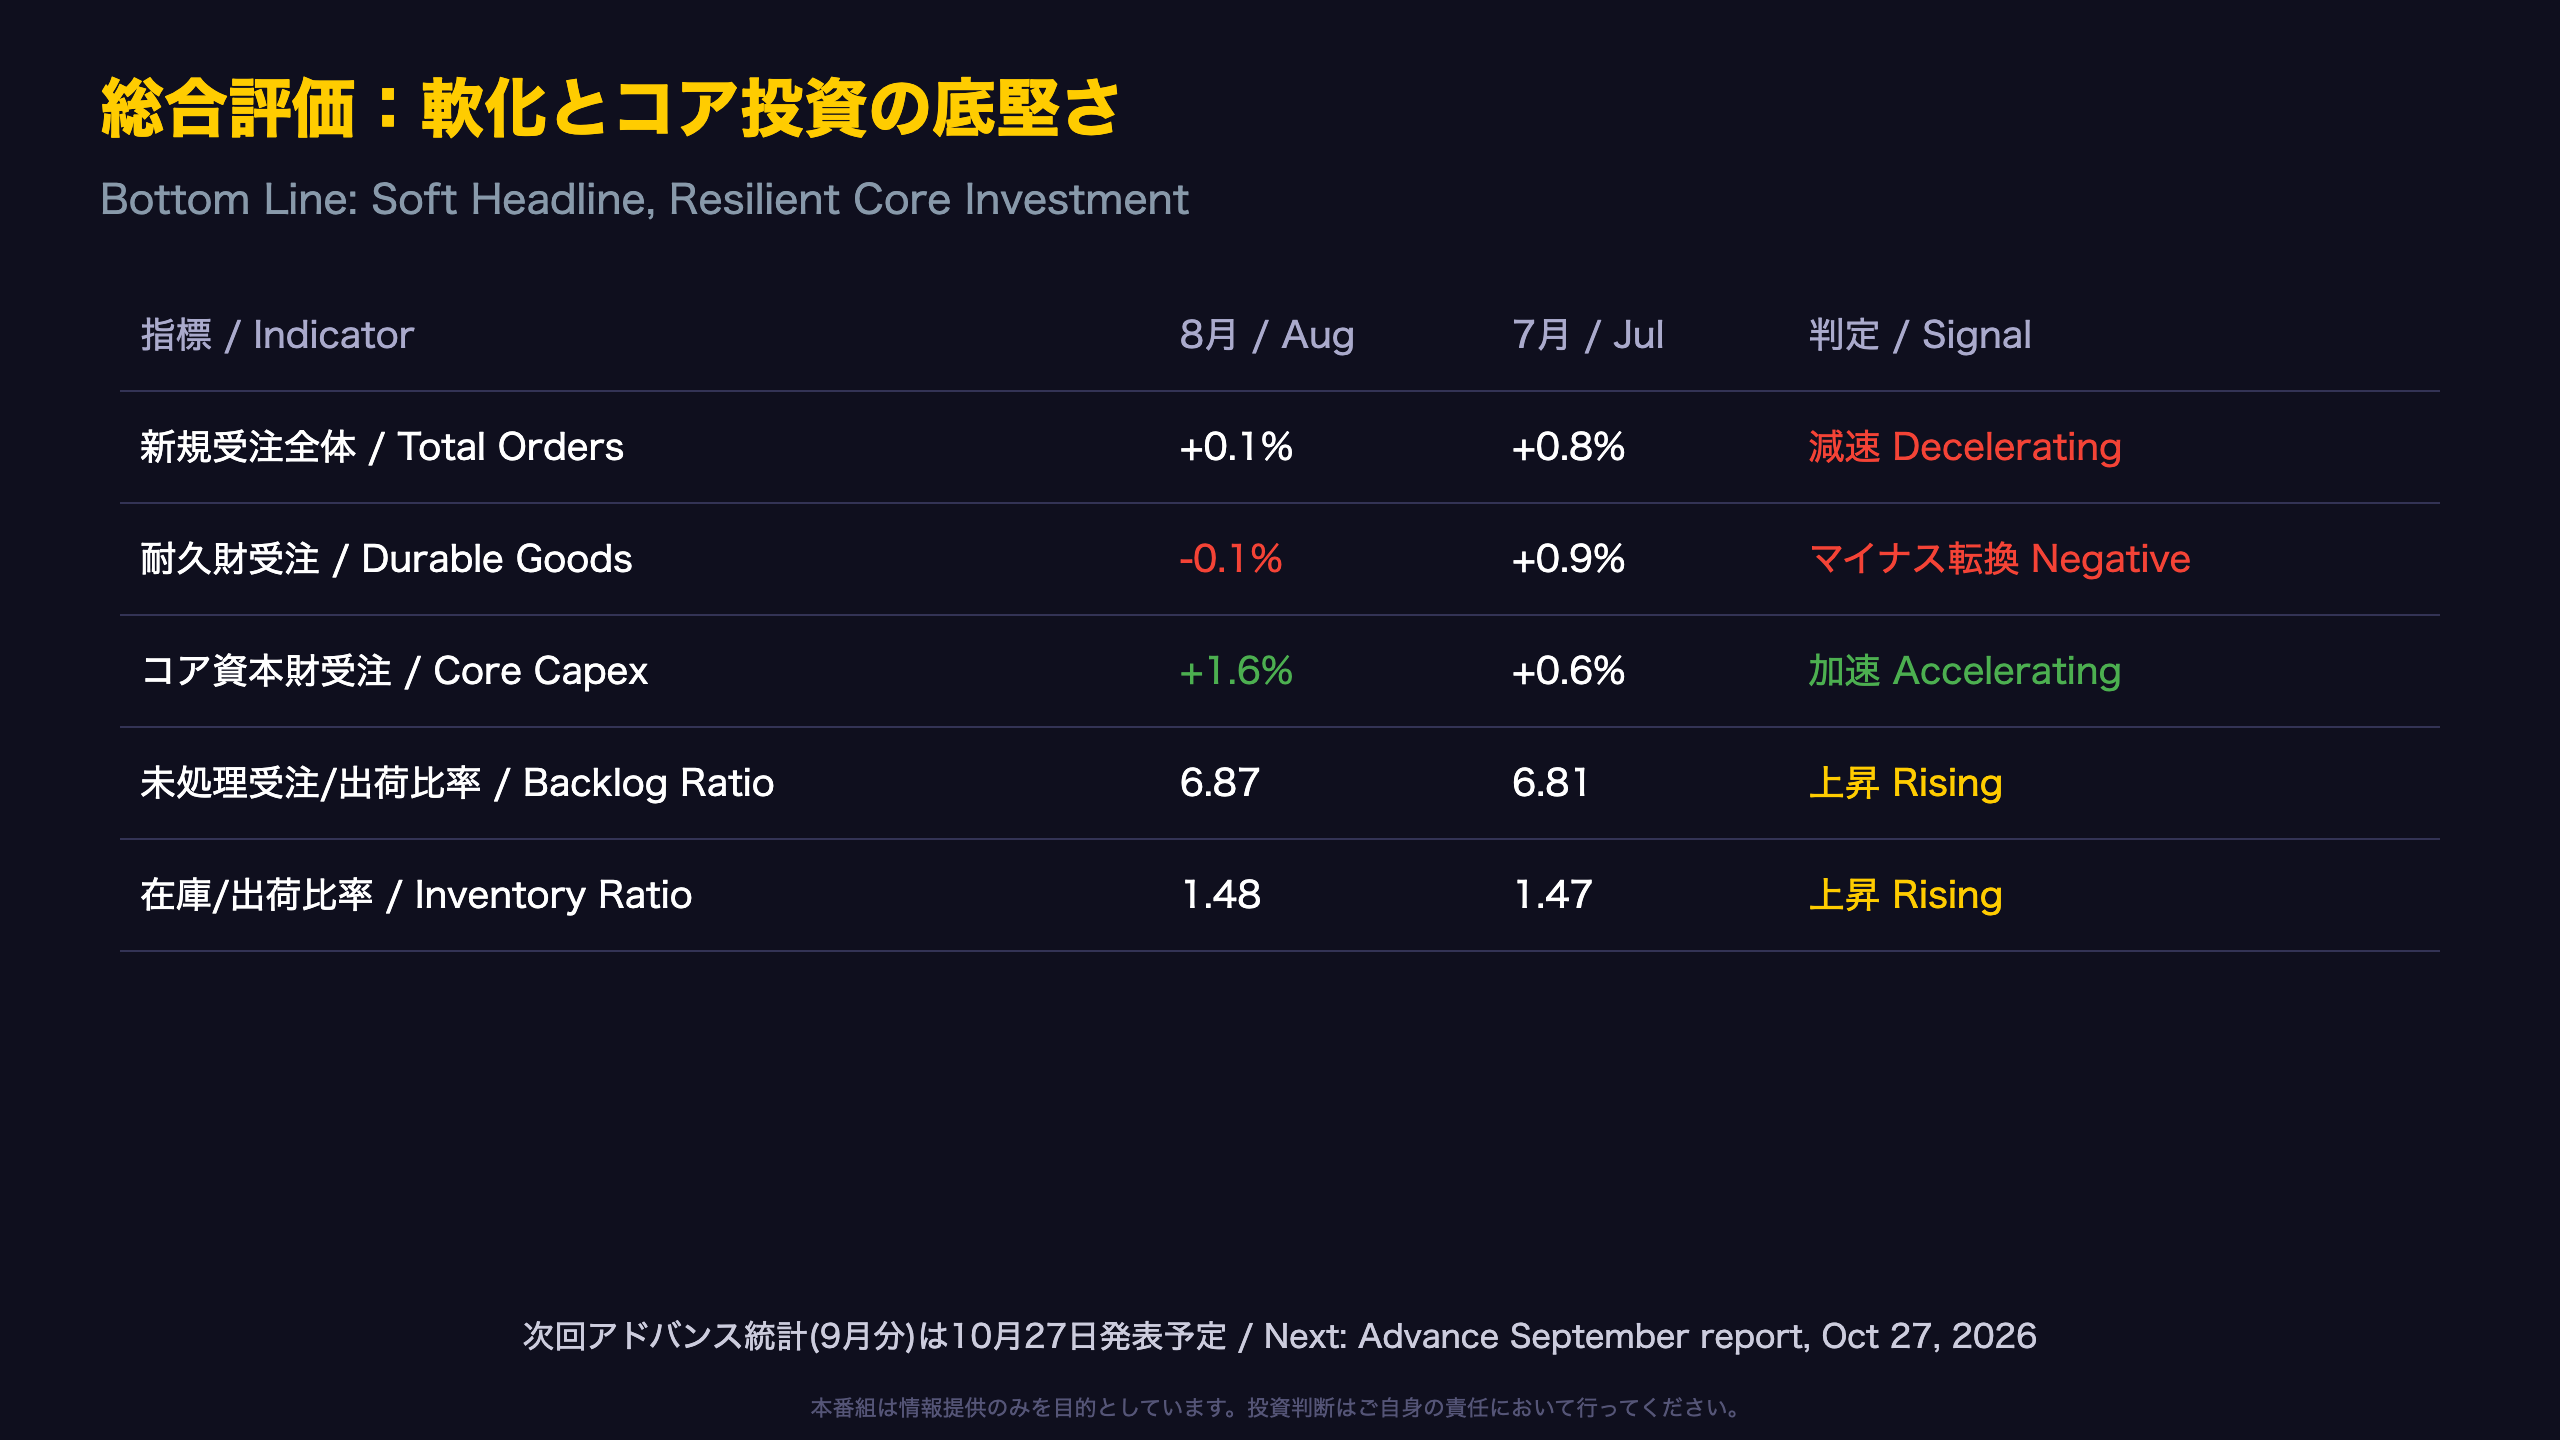
Total new orders grew just +0.1% MoM, down from July’s +0.8%, while durable goods orders turned negative at -0.1%.
📉 The main drag: nondefense aircraft orders, down -4.3%.
💡 But core capital goods orders (ex-defense, ex-aircraft)—the key business investment proxy—rose +1.6%, accelerating for a third straight month.
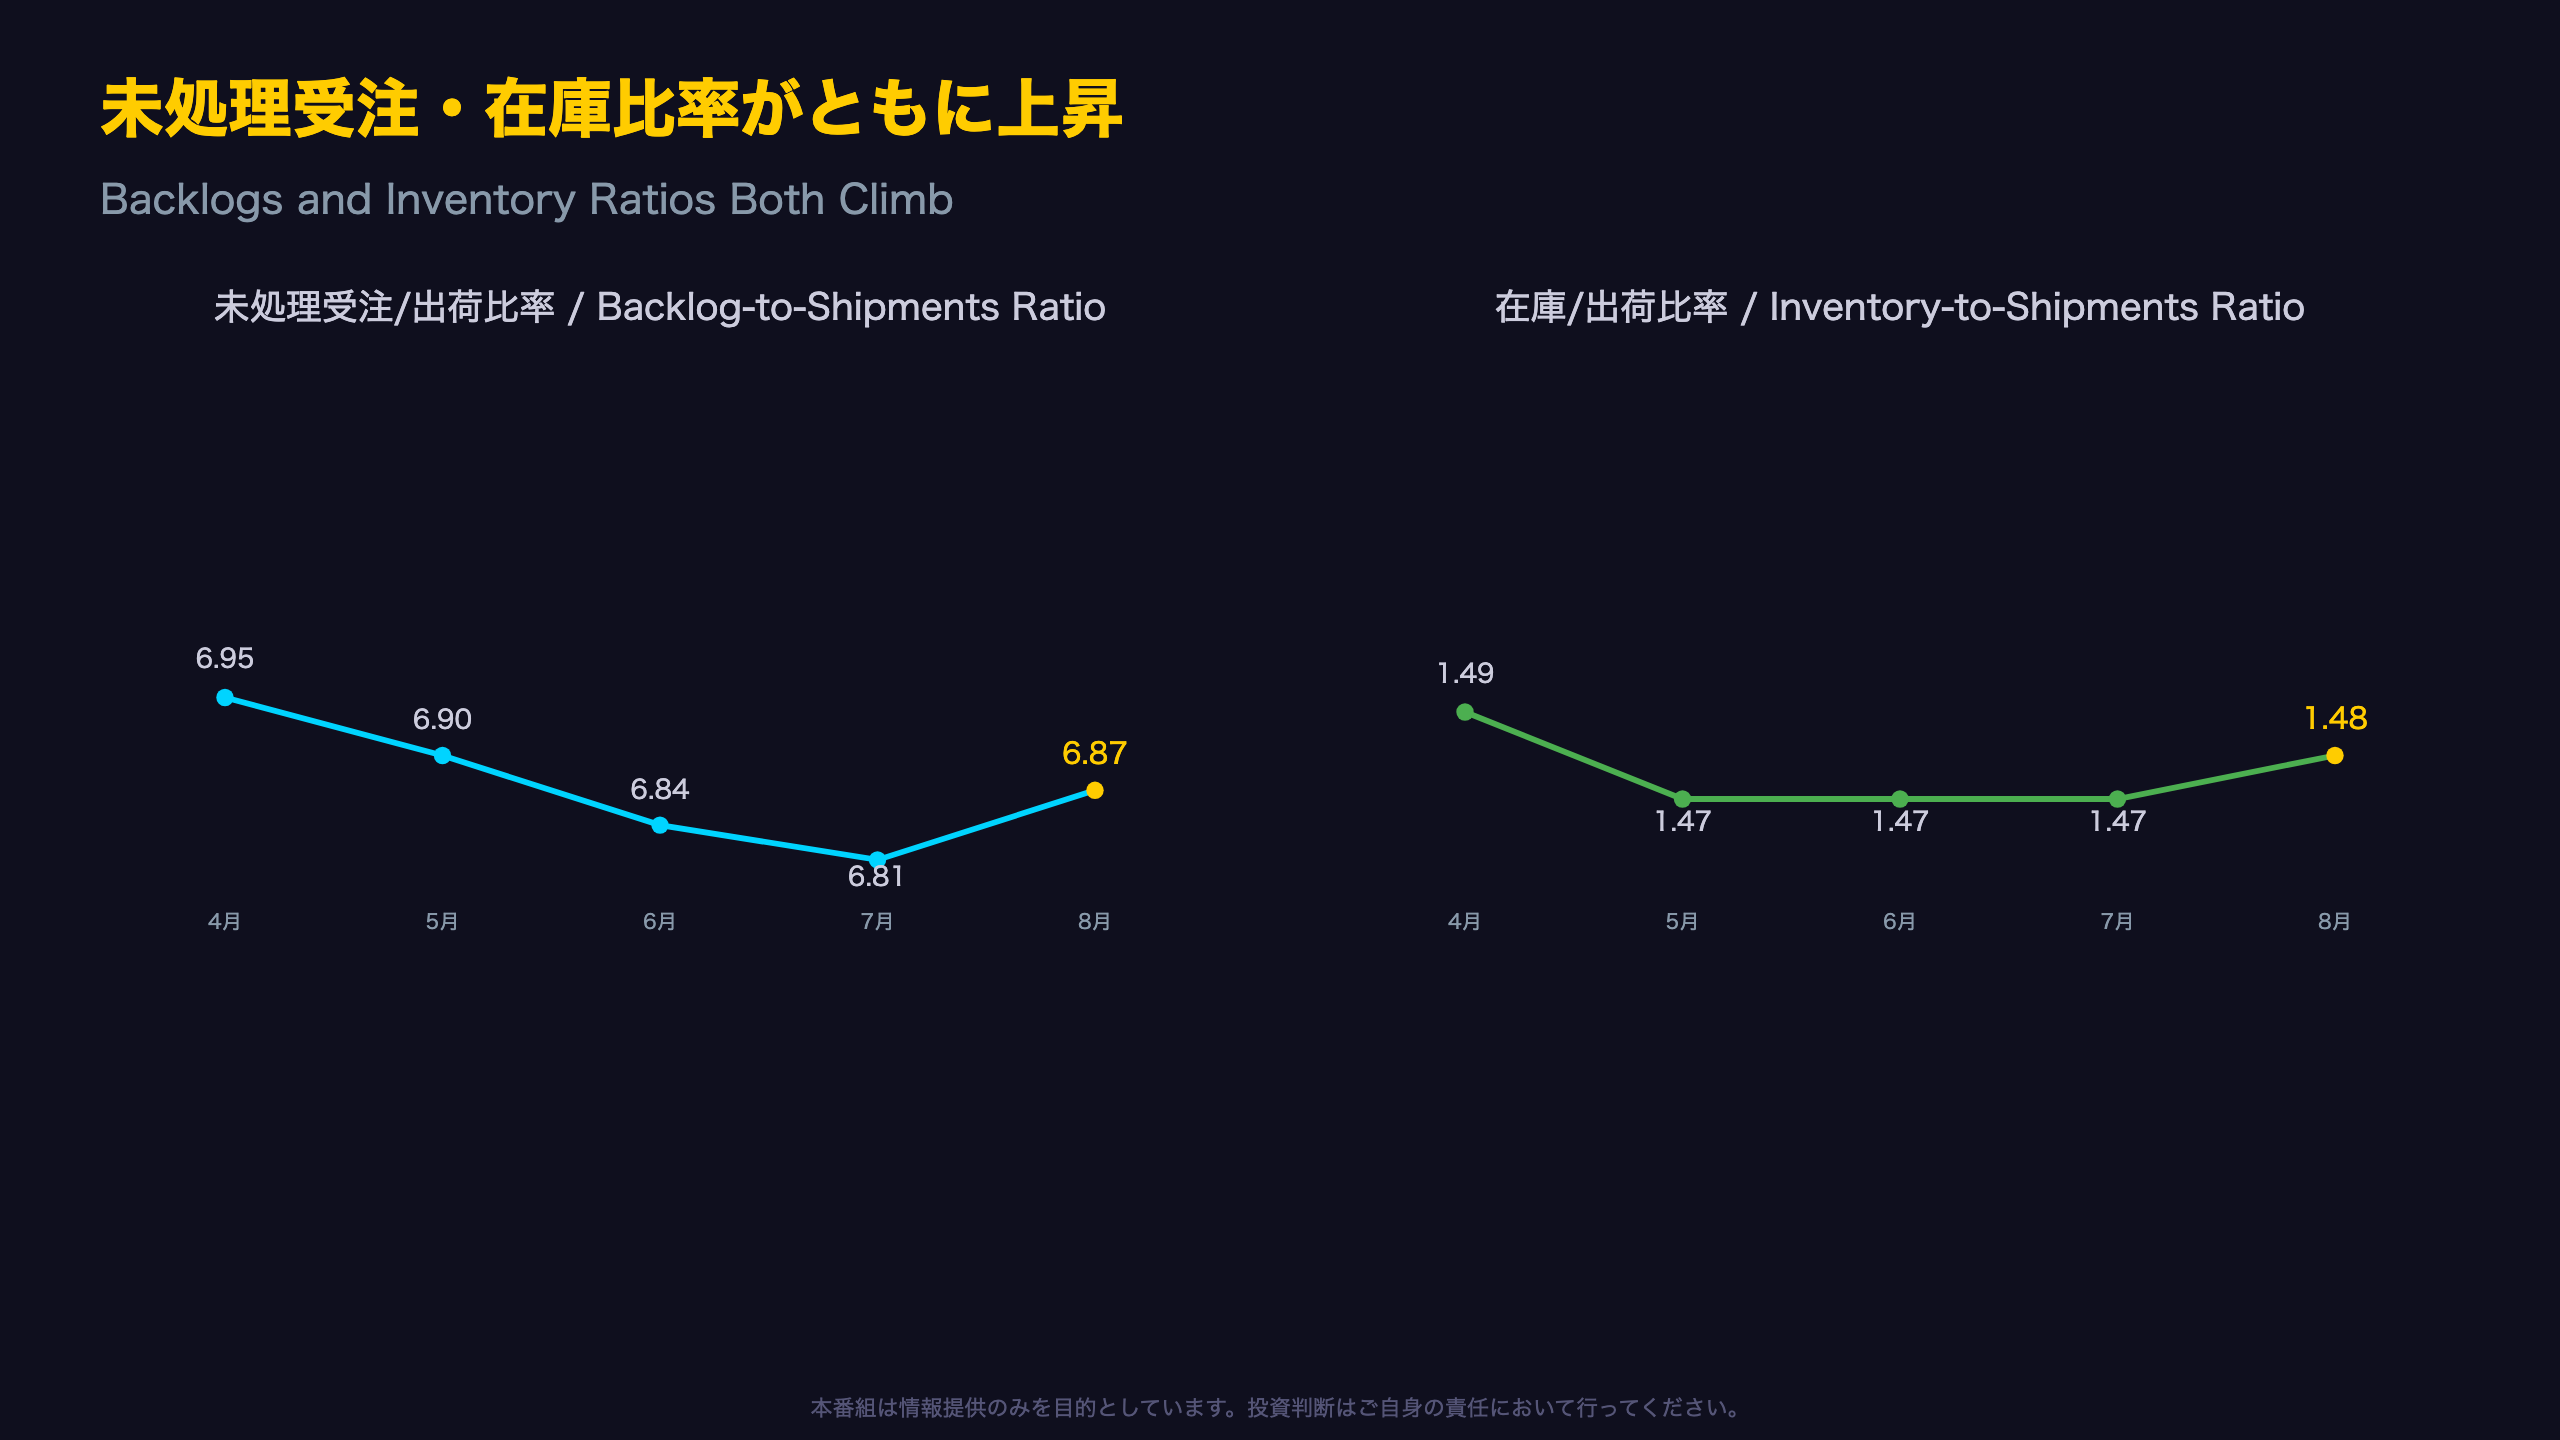
⚠️ Both the unfilled orders and inventory ratios to shipments rose, a sign worth watching.
Next release: Advance September report, October 27.
耐久財受注:ヘッドライン軟化とコア資本財加速の二面性 / Durable Goods: Soft Headline, Accelerating Core Capex
Understanding the M3 Survey: Why Durable Goods Data Is Noisy
The U.S. Census Bureau’s Manufacturers’ Shipments, Inventories, and Orders (M3) survey is a voluntary, non-probability survey covering roughly 4,700 reporting units (about 3,000 companies). Because it isn’t a random sample, the Census Bureau explicitly states that sampling error \”cannot be measured, nor can confidence intervals be computed.\” This matters enormously for durable goods, where a handful of aircraft orders can swing the entire category by billions of dollars in a single month.
Why \”Core Capex\” Matters More Than the Headline
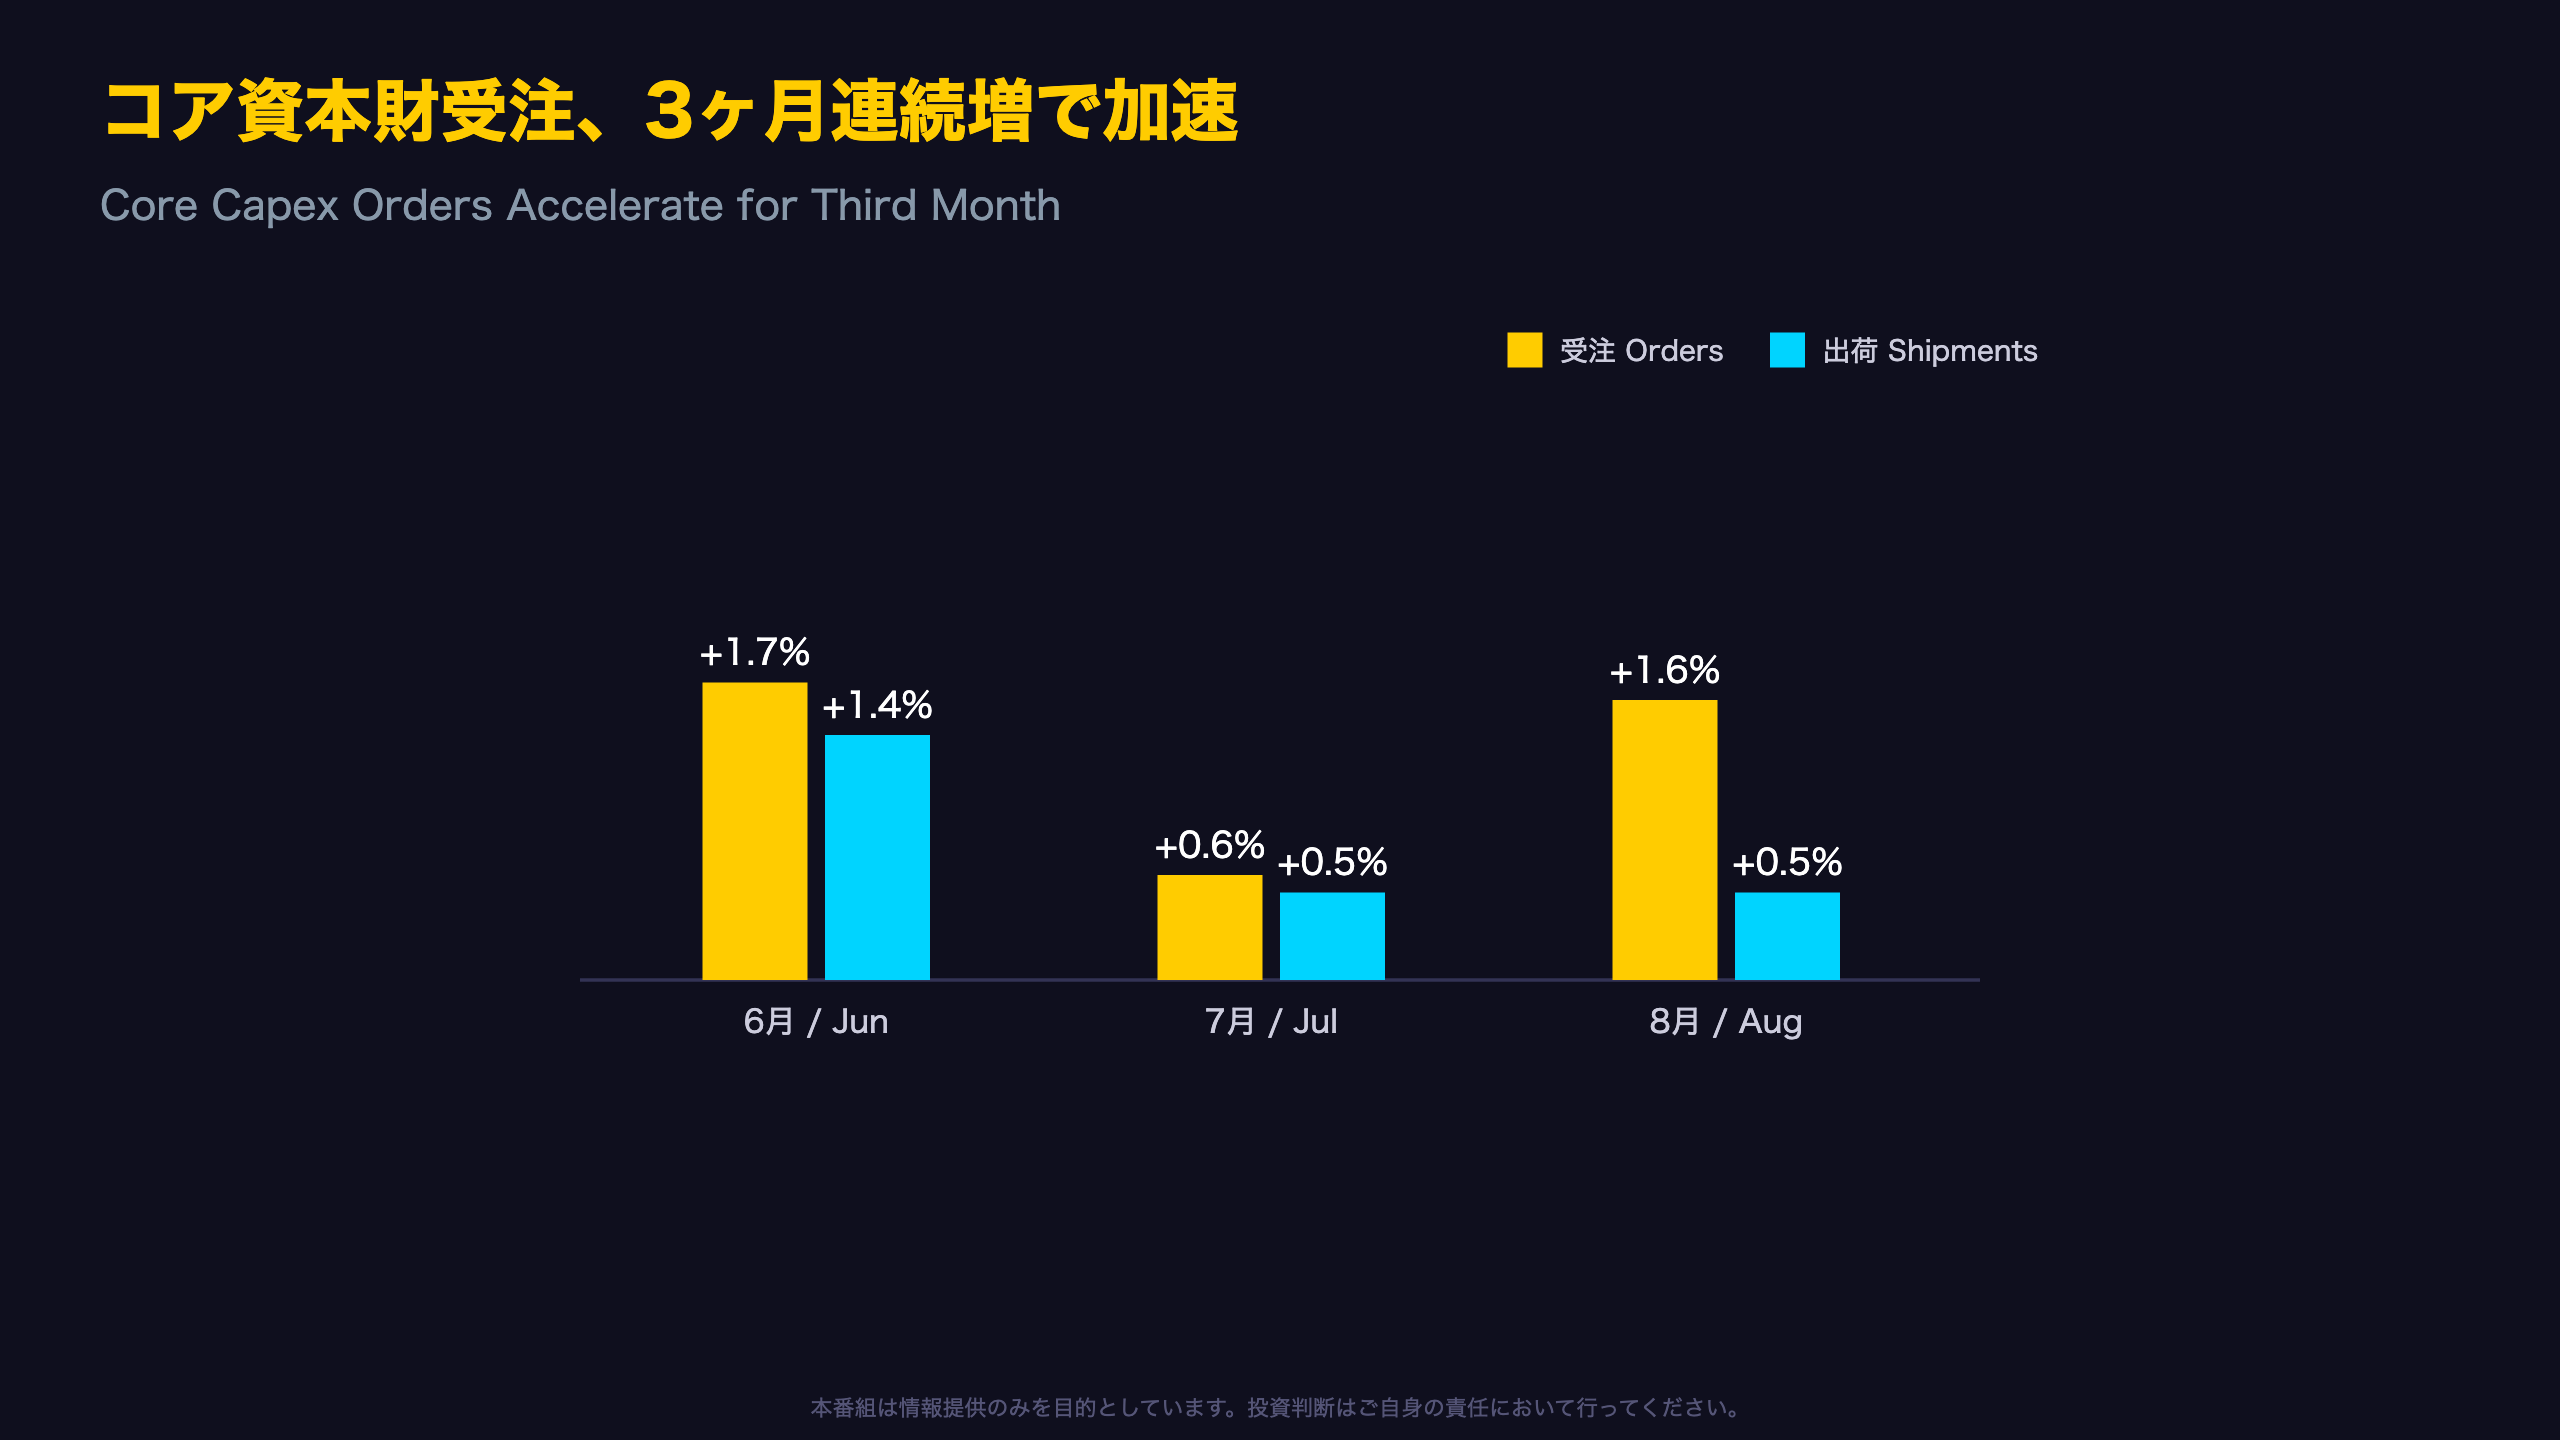
Economists and Fed staff routinely strip out defense and aircraft orders to isolate \”core capital goods orders\”—arguably the best monthly proxy for private business investment in the GDP accounts. This series rose 1.7% in June, 0.6% in July, and accelerated to 1.6% in August, marking three consecutive increases—a notably steadier signal than recent ISM Manufacturing PMI new orders readings.
Market Implications
A resilient core capex trend, if sustained, supports the soft-landing narrative and could modestly reduce urgency for aggressive Fed rate cuts, while the cooling headline keeps bond markets hedged against downside growth surprises. Industrials and capital goods equity investors may find the core data more decision-relevant than the noisy headline.
Next data point: Advance September durable goods report, October 27, 2026.
新規受注は減速、輸送機器が押し下げ / Headline Orders Decelerate, Transportation Drags
Decoding the Transportation Drag
For investors unfamiliar with U.S. manufacturing data, \”transportation equipment\” in this report is dominated by commercial aircraft orders and motor vehicle parts. A single large aircraft order—or its absence—can move this entire sub-category by several percentage points in a given month. In August, nondefense aircraft orders fell 4.3% to $18.8 billion, while motor vehicle parts orders slipped 2.7% to $6.1 billion. Defense aircraft orders, by contrast, rose 5.9%, illustrating how government versus private-sector demand can diverge sharply.
Revisions Are Routine, Not Alarming
The August durable goods decline (-0.1%) was revised slightly more negative than the earlier Advance estimate (previously \”virtually unchanged\”). Shipments were similarly revised from -0.2% to -0.3%. Given the Census Bureau’s own disclosure that this survey is not based on a probability sample, these revisions fall well within normal noise.
Nondurables Provided an Offset
Nondurable goods orders rose 0.3% to $325.0 billion, with petroleum and coal product shipments climbing 1.4% to $70.7 billion. Year-to-date, total manufacturing new orders remain up 6.8% versus 2025, and durable goods are up 7.7%—a reminder that single-month volatility can obscure a steadier underlying growth trajectory.
コア資本財受注、3ヶ月連続増で加速 / Core Capex Orders Accelerate for Third Month
Why \”Core Capex Orders\” Is a Fed-Watched Indicator
Among U.S. manufacturing data series, \”nondefense capital goods orders excluding aircraft\”—often called \”core capex orders\”—holds outsized importance for macro forecasters because it strips out the two most volatile categories: defense spending (government contracts, not market demand) and aircraft (dominated by lumpy large orders that can single-handedly swing headline durable goods).
Three-Month Trend
| Month | Orders MoM | Shipments MoM |
|---|---|---|
| June | +1.7% | +1.4% |
| July | +0.6% | +0.5% |
| August | +1.6% | +0.5% |
Both orders and shipments have posted gains for three straight months—a pattern difficult to explain as pure survey noise (a Level-B inference given multiple corroborating data points).
A Note of Caution
That said, the M3 survey remains a non-probability sample, and the reacceleration from +0.6% to +1.6% could partly reflect lumpy large-ticket orders rather than genuinely broadening investment intent. Three data points do not yet constitute conclusive evidence of a structural capex upcycle.
Market Read-Through
For industrials and capital goods equities, a steady core capex trend is constructive, particularly against tariff and rate uncertainty that has weighed on sentiment surveys like the ISM new orders index. Fixed income markets may read this as modestly reducing the case for front-loaded Fed rate cuts.
Next release: Advance September report, October 27, 2026 — watch for a potential fourth consecutive monthly gain.
未処理受注・在庫比率がともに上昇 / Backlogs and Inventory Ratios Both Climb
Reading Between the Lines: Backlog and Inventory Ratios
The unfilled orders-to-shipments ratio of 6.87 sits in the middle of its recent range—it touched 6.95 in April and 6.90 in May before dipping to 6.81 in July. Viewed this way, August’s increase looks more like a reversion toward the recent range than an alarming acceleration in backlog buildup.
Inventory Build by Stage of Fabrication
The Census Bureau’s stage-of-fabrication breakdown shows materials and supplies up 0.6% (durable) and 0.9% (nondurable), work-in-process up 0.8% (durable) and 1.1% (nondurable), while finished goods rose just 0.1% (durable) and were essentially flat (nondurable). Finished goods barely moved while work-in-process and raw materials grew faster, suggesting manufacturers are building pipeline inventory for future production rather than accumulating unsold finished products.
The Bull and Bear Case
Bull case: A robust order backlog, especially in transportation equipment ($1,009.9 billion, up for the 12th time in 13 months), provides revenue visibility well into 2027.
Bear case: Rising inventory-to-shipments ratios alongside flat shipments could indicate production capacity starting to outpace near-term demand, worth monitoring in subsequent releases.
For context, U.S. manufacturing inventory-to-shipments ratios in the 1.4-1.5 range are broadly consistent with pre-pandemic norms, suggesting current levels, while elevated, are not yet historically extreme.
総合評価:ヘッドラインの軟化とコア投資の底堅さ / Bottom Line: Soft Headline, Resilient Core Investment
Checkpoints for the Next Release
Key Metrics At a Glance
| Indicator | August | July | Signal |
|---|---|---|---|
| Total New Orders | $663.5B (+0.1%) | +0.8% | Decelerating |
| Durable Goods Orders | $338.5B (-0.1%) | +0.9% | Turned negative |
| Core Capex Orders | $87.6B (+1.6%) | +0.6% | Accelerating |
| Backlog/Shipments Ratio | 6.87 | 6.81 | Rising |
| Inventory/Shipments Ratio | 1.48 | 1.47 | Rising |
Scenario Analysis
If core capital goods orders extend their streak to a fourth consecutive monthly gain in September, it would meaningfully reinforce the case for resilient business investment heading into year-end. Conversely, a deceleration or reversal would suggest August’s acceleration reflected one-off large-ticket orders. Given that headline durable goods figures remain highly sensitive to aircraft order timing, investors should expect continued divergence between the noisy headline and the steadier core series.
Related Indicators to Watch
Cross-referencing this release against the ISM Manufacturing PMI’s New Orders sub-index and regional Fed capex surveys can help confirm whether core capex strength is corroborated by survey-based sentiment, or whether a gap is opening between hard and soft data.
Next release: Advance September Durable Goods Report, October 27, 2026, 8:30 AM EDT; Full Report, November 3, 2026.
Disclaimer: This article is for informational purposes only. All investment decisions are made solely at your own risk.







