📺 Watch the Full Video Analysis
This article was automatically generated by the NFC Market Live AI analysis system. (Updated: 2026-10-11 10:12 JST)
📊 NFC Market Live Weekly Programming Review (Oct 4-10)
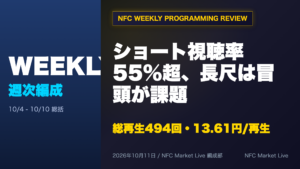
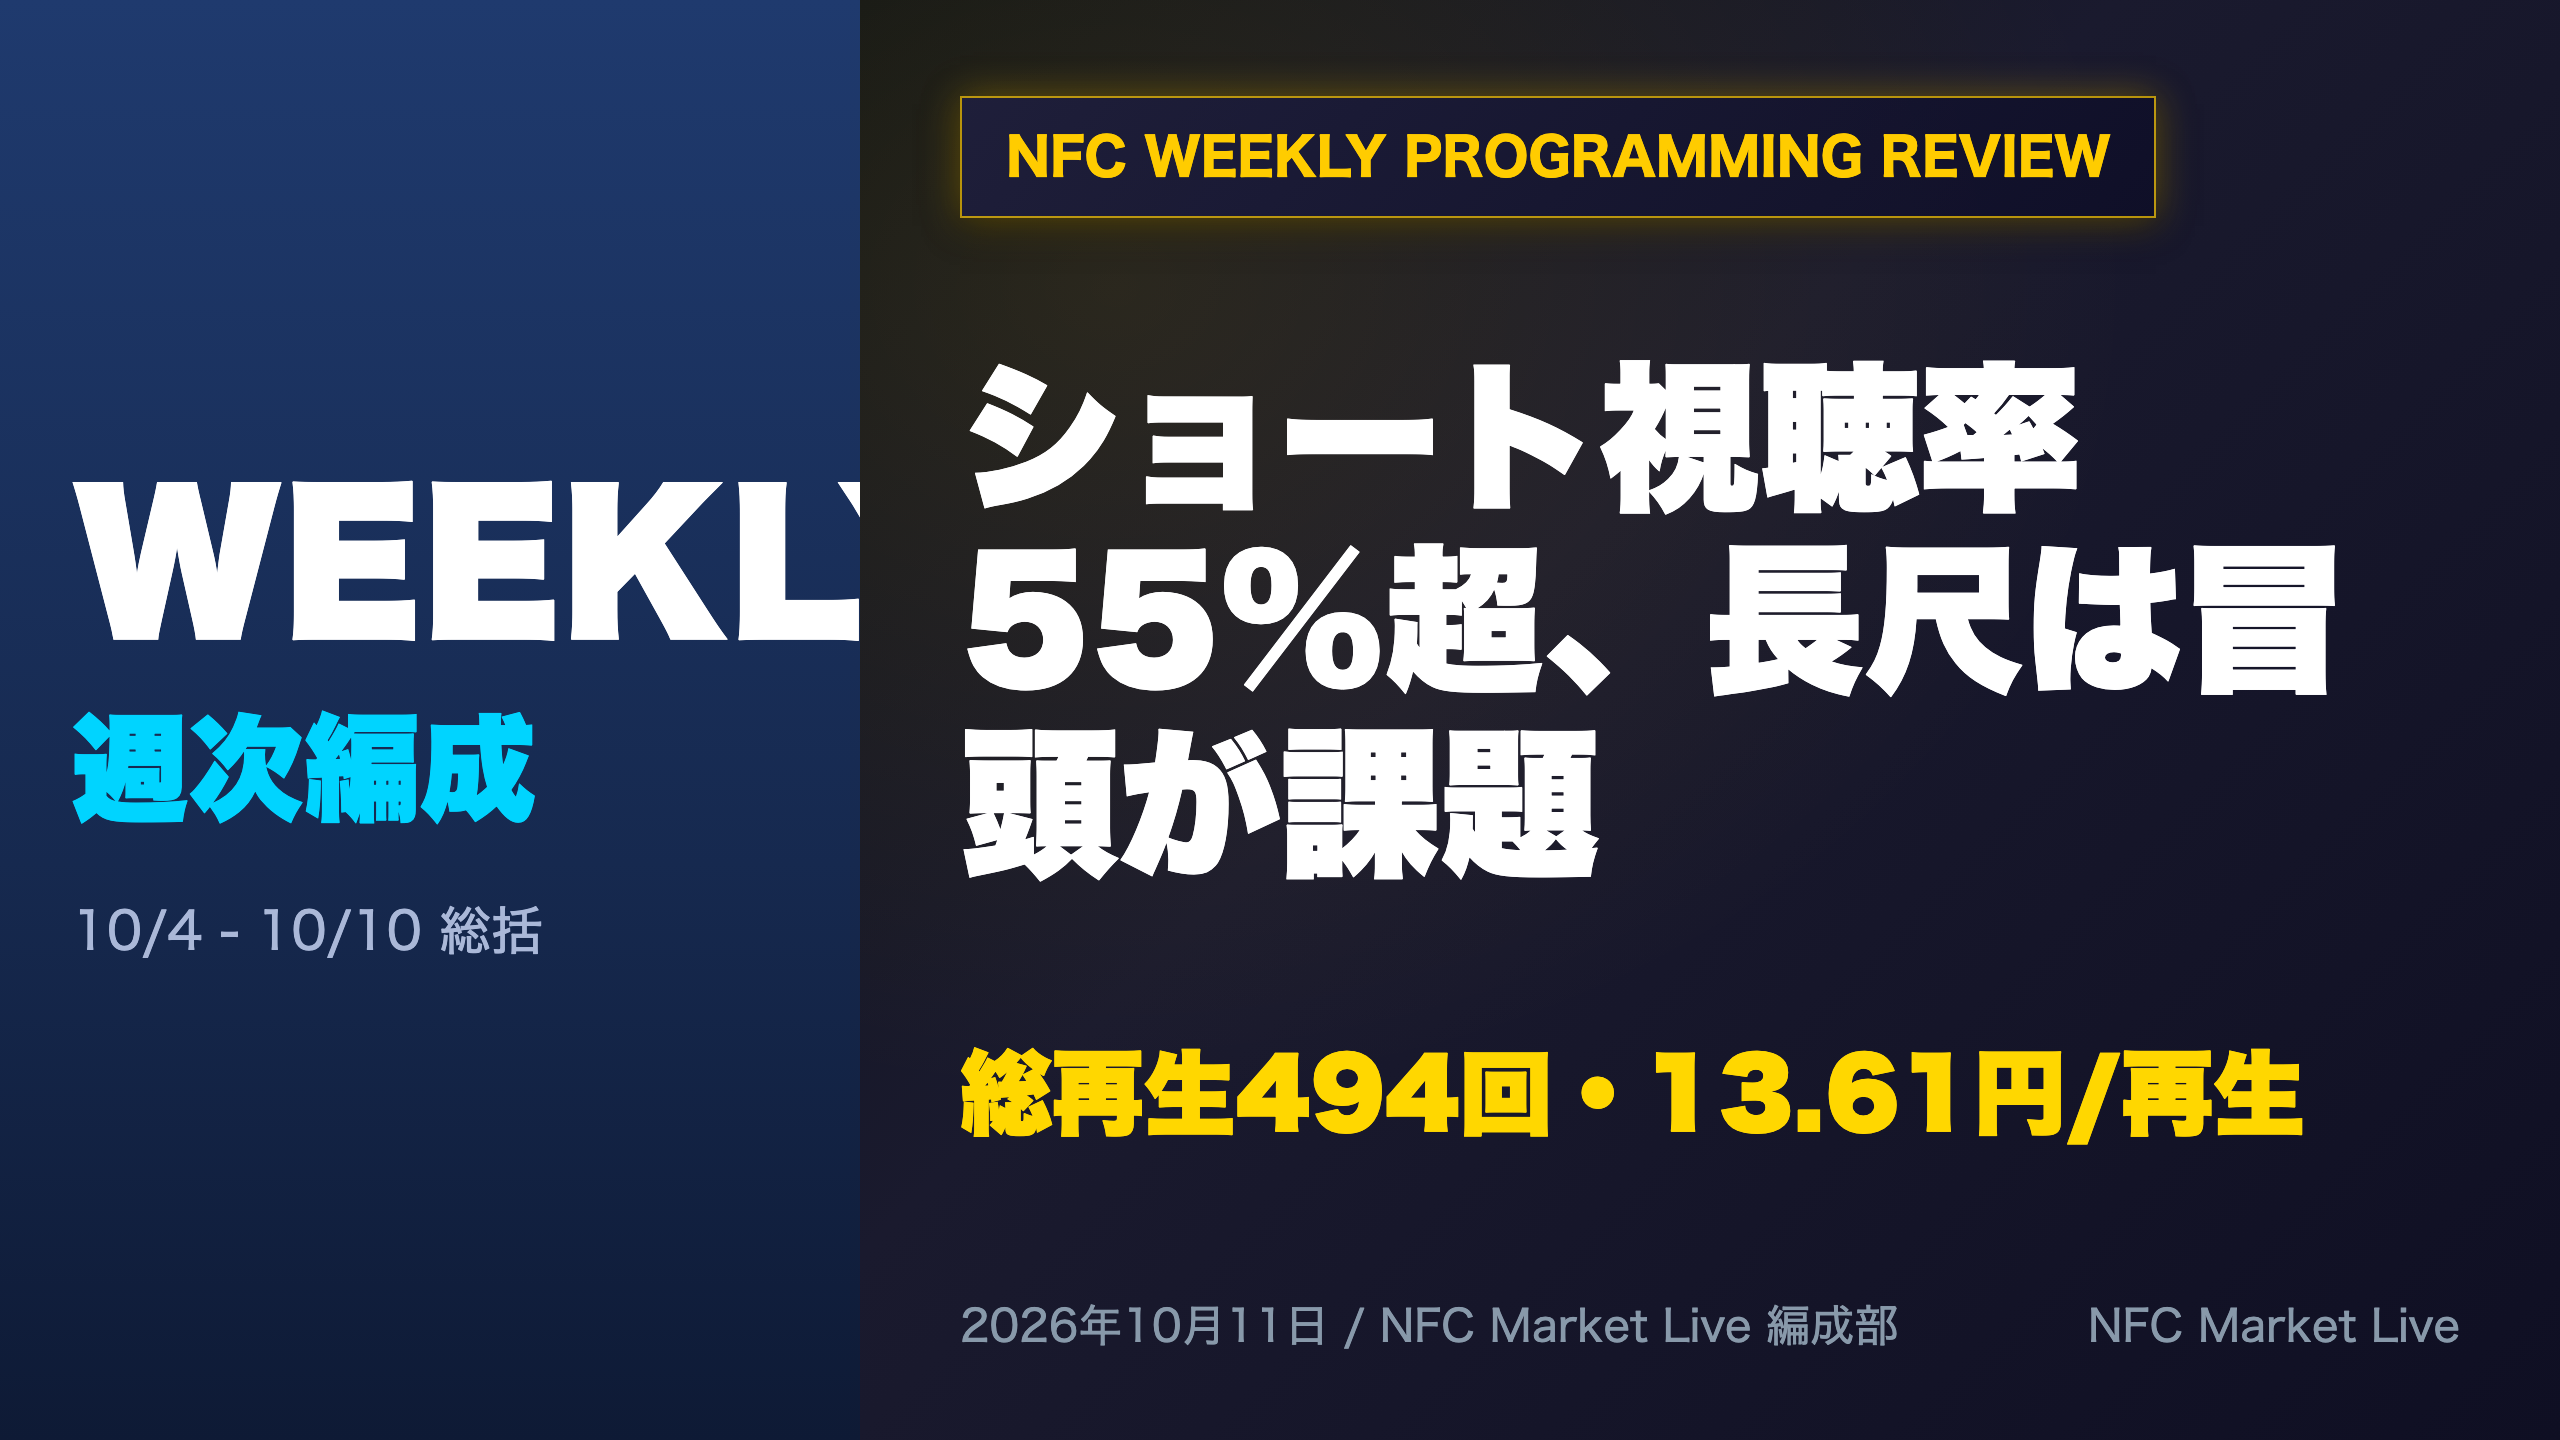
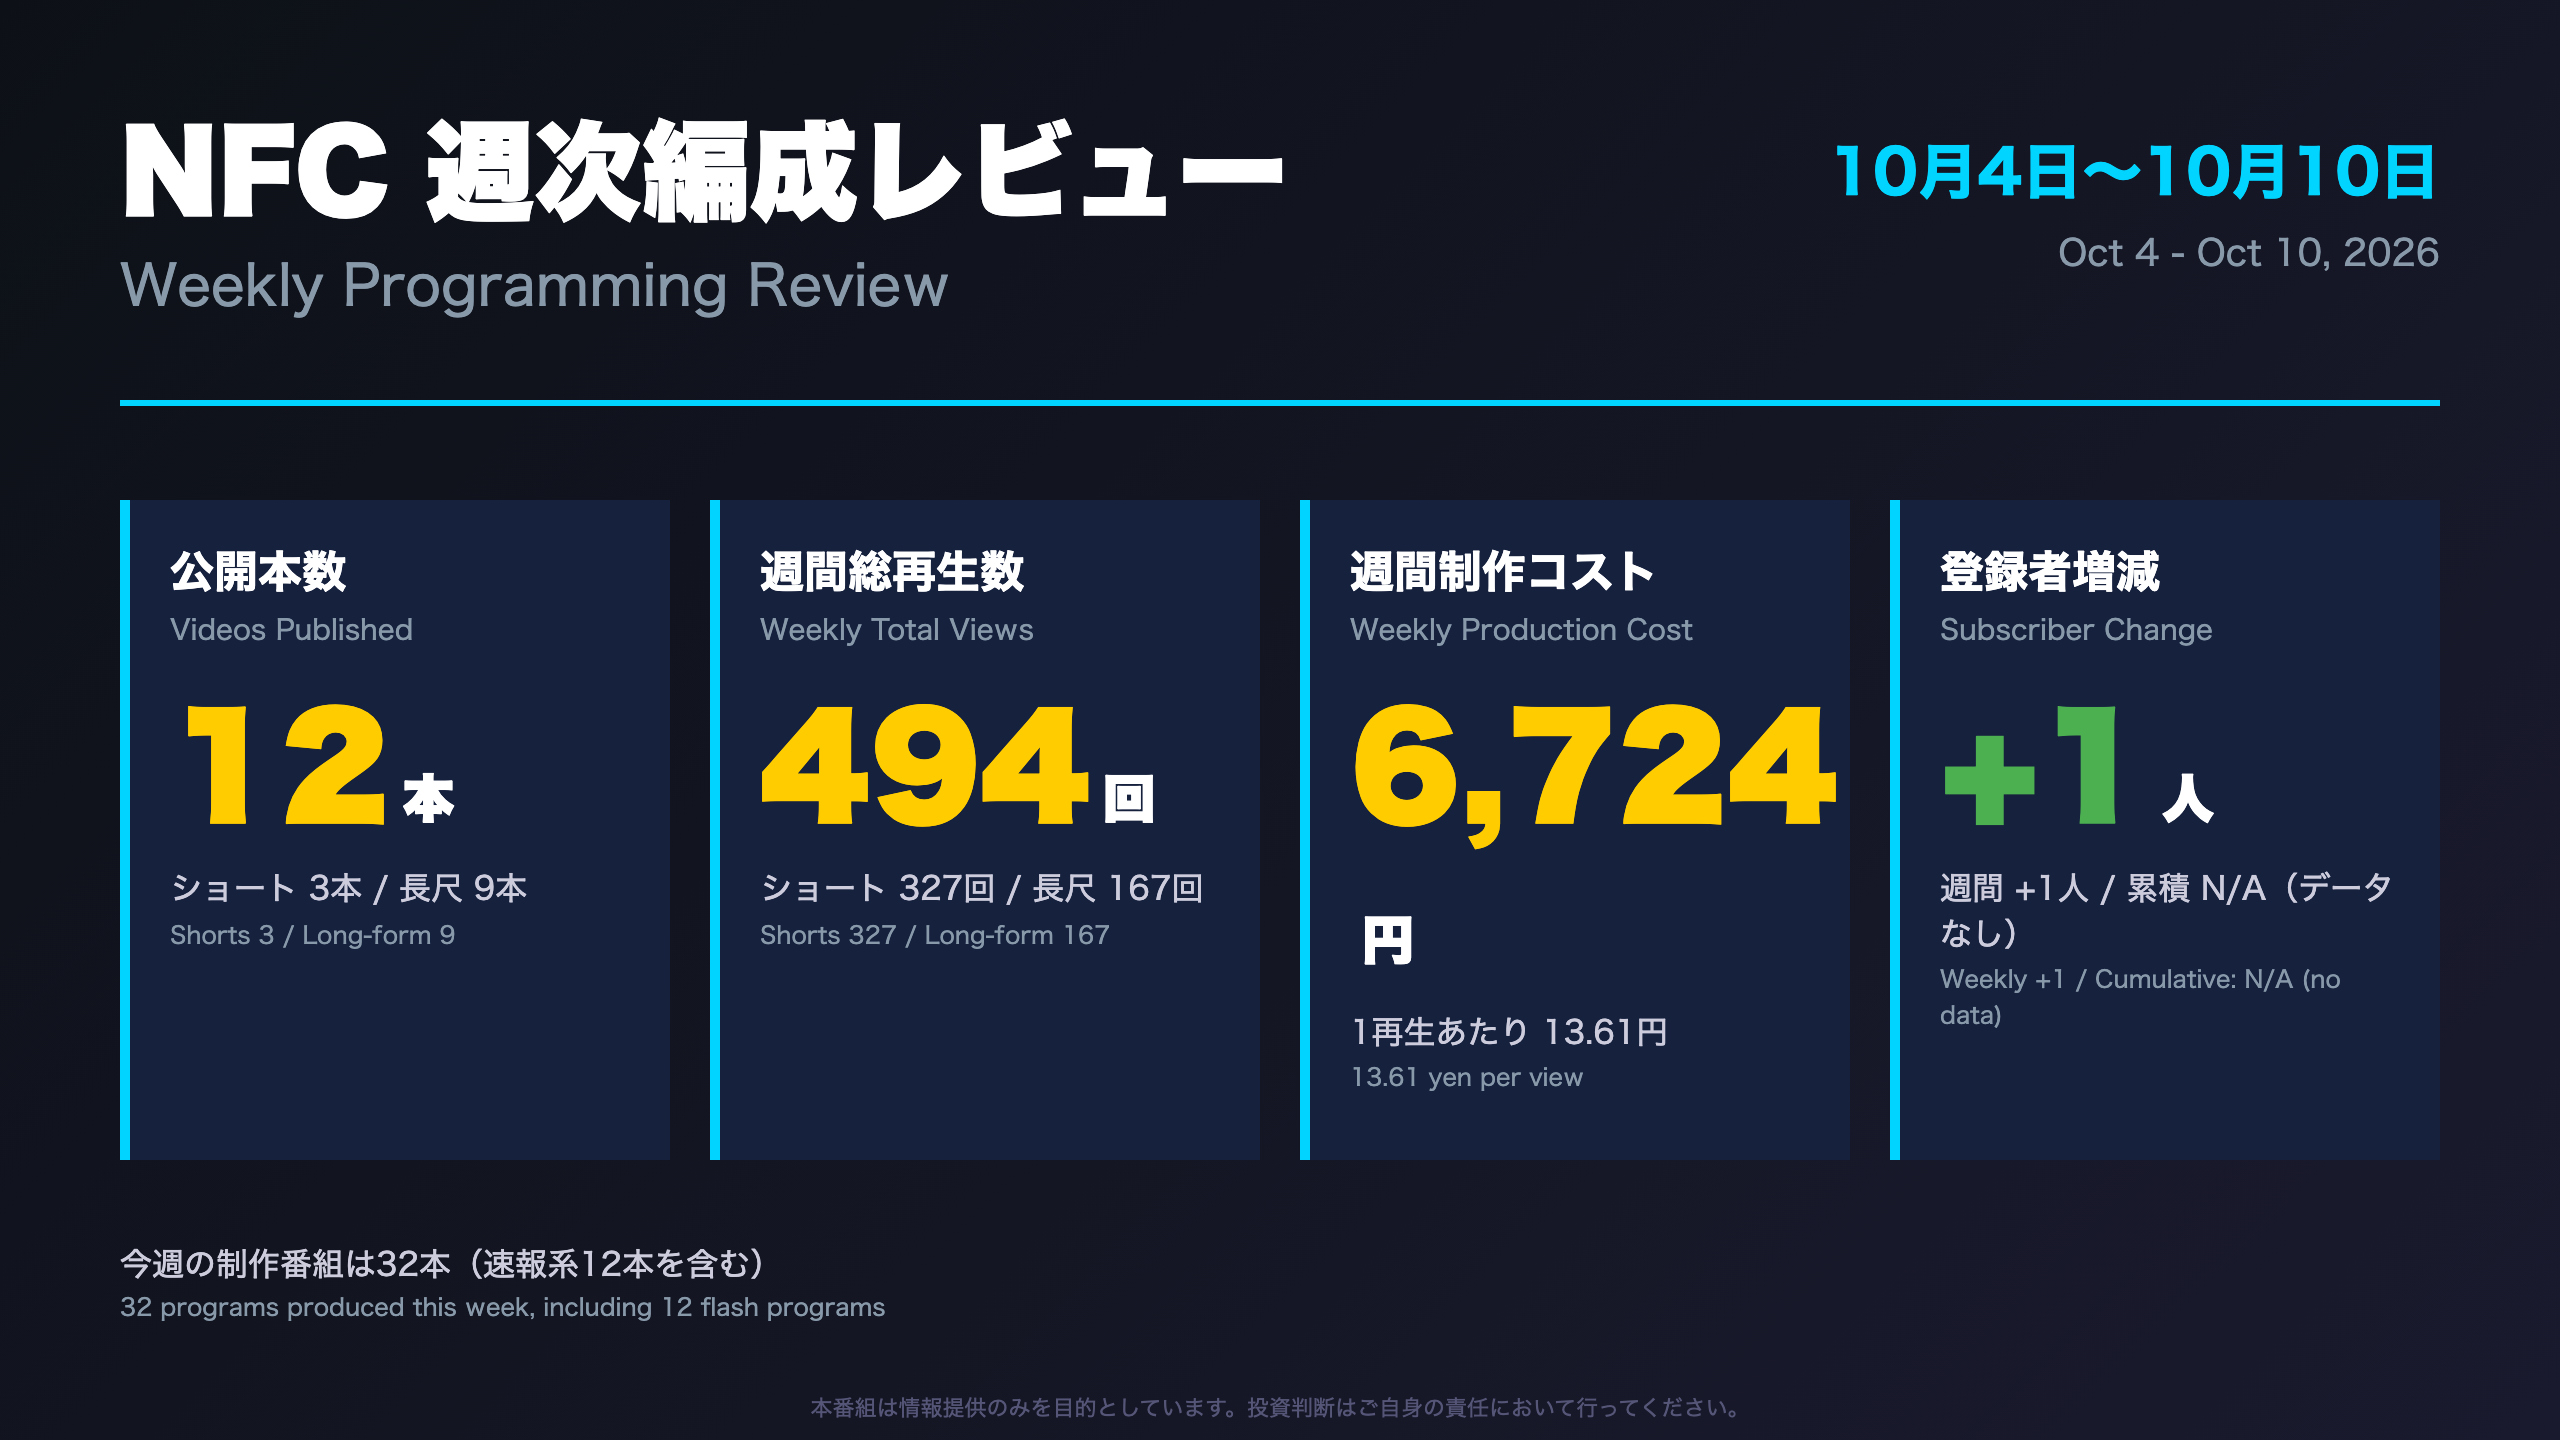
Total views 494 (327 Shorts, 167 long-form), production cost 6,724 yen or 13.61 yen per view, +1 subscriber.
📈 The three new Shorts averaged 55-59% view rates; two trade-balance videos and one Fed rate-hike video led.
📉 Some long-form episodes retained only 3.5% and 0.2%, pointing to early drop-off.
💡 Daily views rose from 36 to 182 after the Oct 5-8 changes, but four days are too few to confirm an effect.
⚠️ Samples are small, and three long-form videos with pending analytics are excluded from judgment.
オープニング:今週の編成サマリー
Weekly Programming Review: How to Read This Week’s Numbers
NFC Market Live is an AI-narrated channel covering Japanese and US macro releases and US earnings. This review is an internal scorecard that checks whether the production mix (many programs, low unit cost) is converting into audience.
Headline figures
- 494 views (327 Shorts, 167 long-form)
- 6,724 yen production cost, or 13.61 yen per view
- +1 subscriber; cumulative count not provided
- Engagement rate 0.703% over the last 7 days vs 0.028% in the prior 7
Caveats for analysts
- Comparison window unclear. The ‘prior 7-day views’ figure of 7,218 equals the sum of weeks 1-3 in the daily table (21 days), so a week-on-week drop cannot be inferred safely.
- Definitions differ. 32 programs were produced, yet only 12 new videos (3 Shorts, 9 long-form) were published; the source does not reconcile the two.
- Data lag. YouTube Analytics usually trails by about 48 hours, so watch time (133 minutes) is provisional.
- Small base. Six engagement actions in total make the engagement-rate jump statistically fragile.
The 13.61 yen cost per view is an internal benchmark only; the dataset has no peer comparison.
今週新規ショート動画 成績リスト
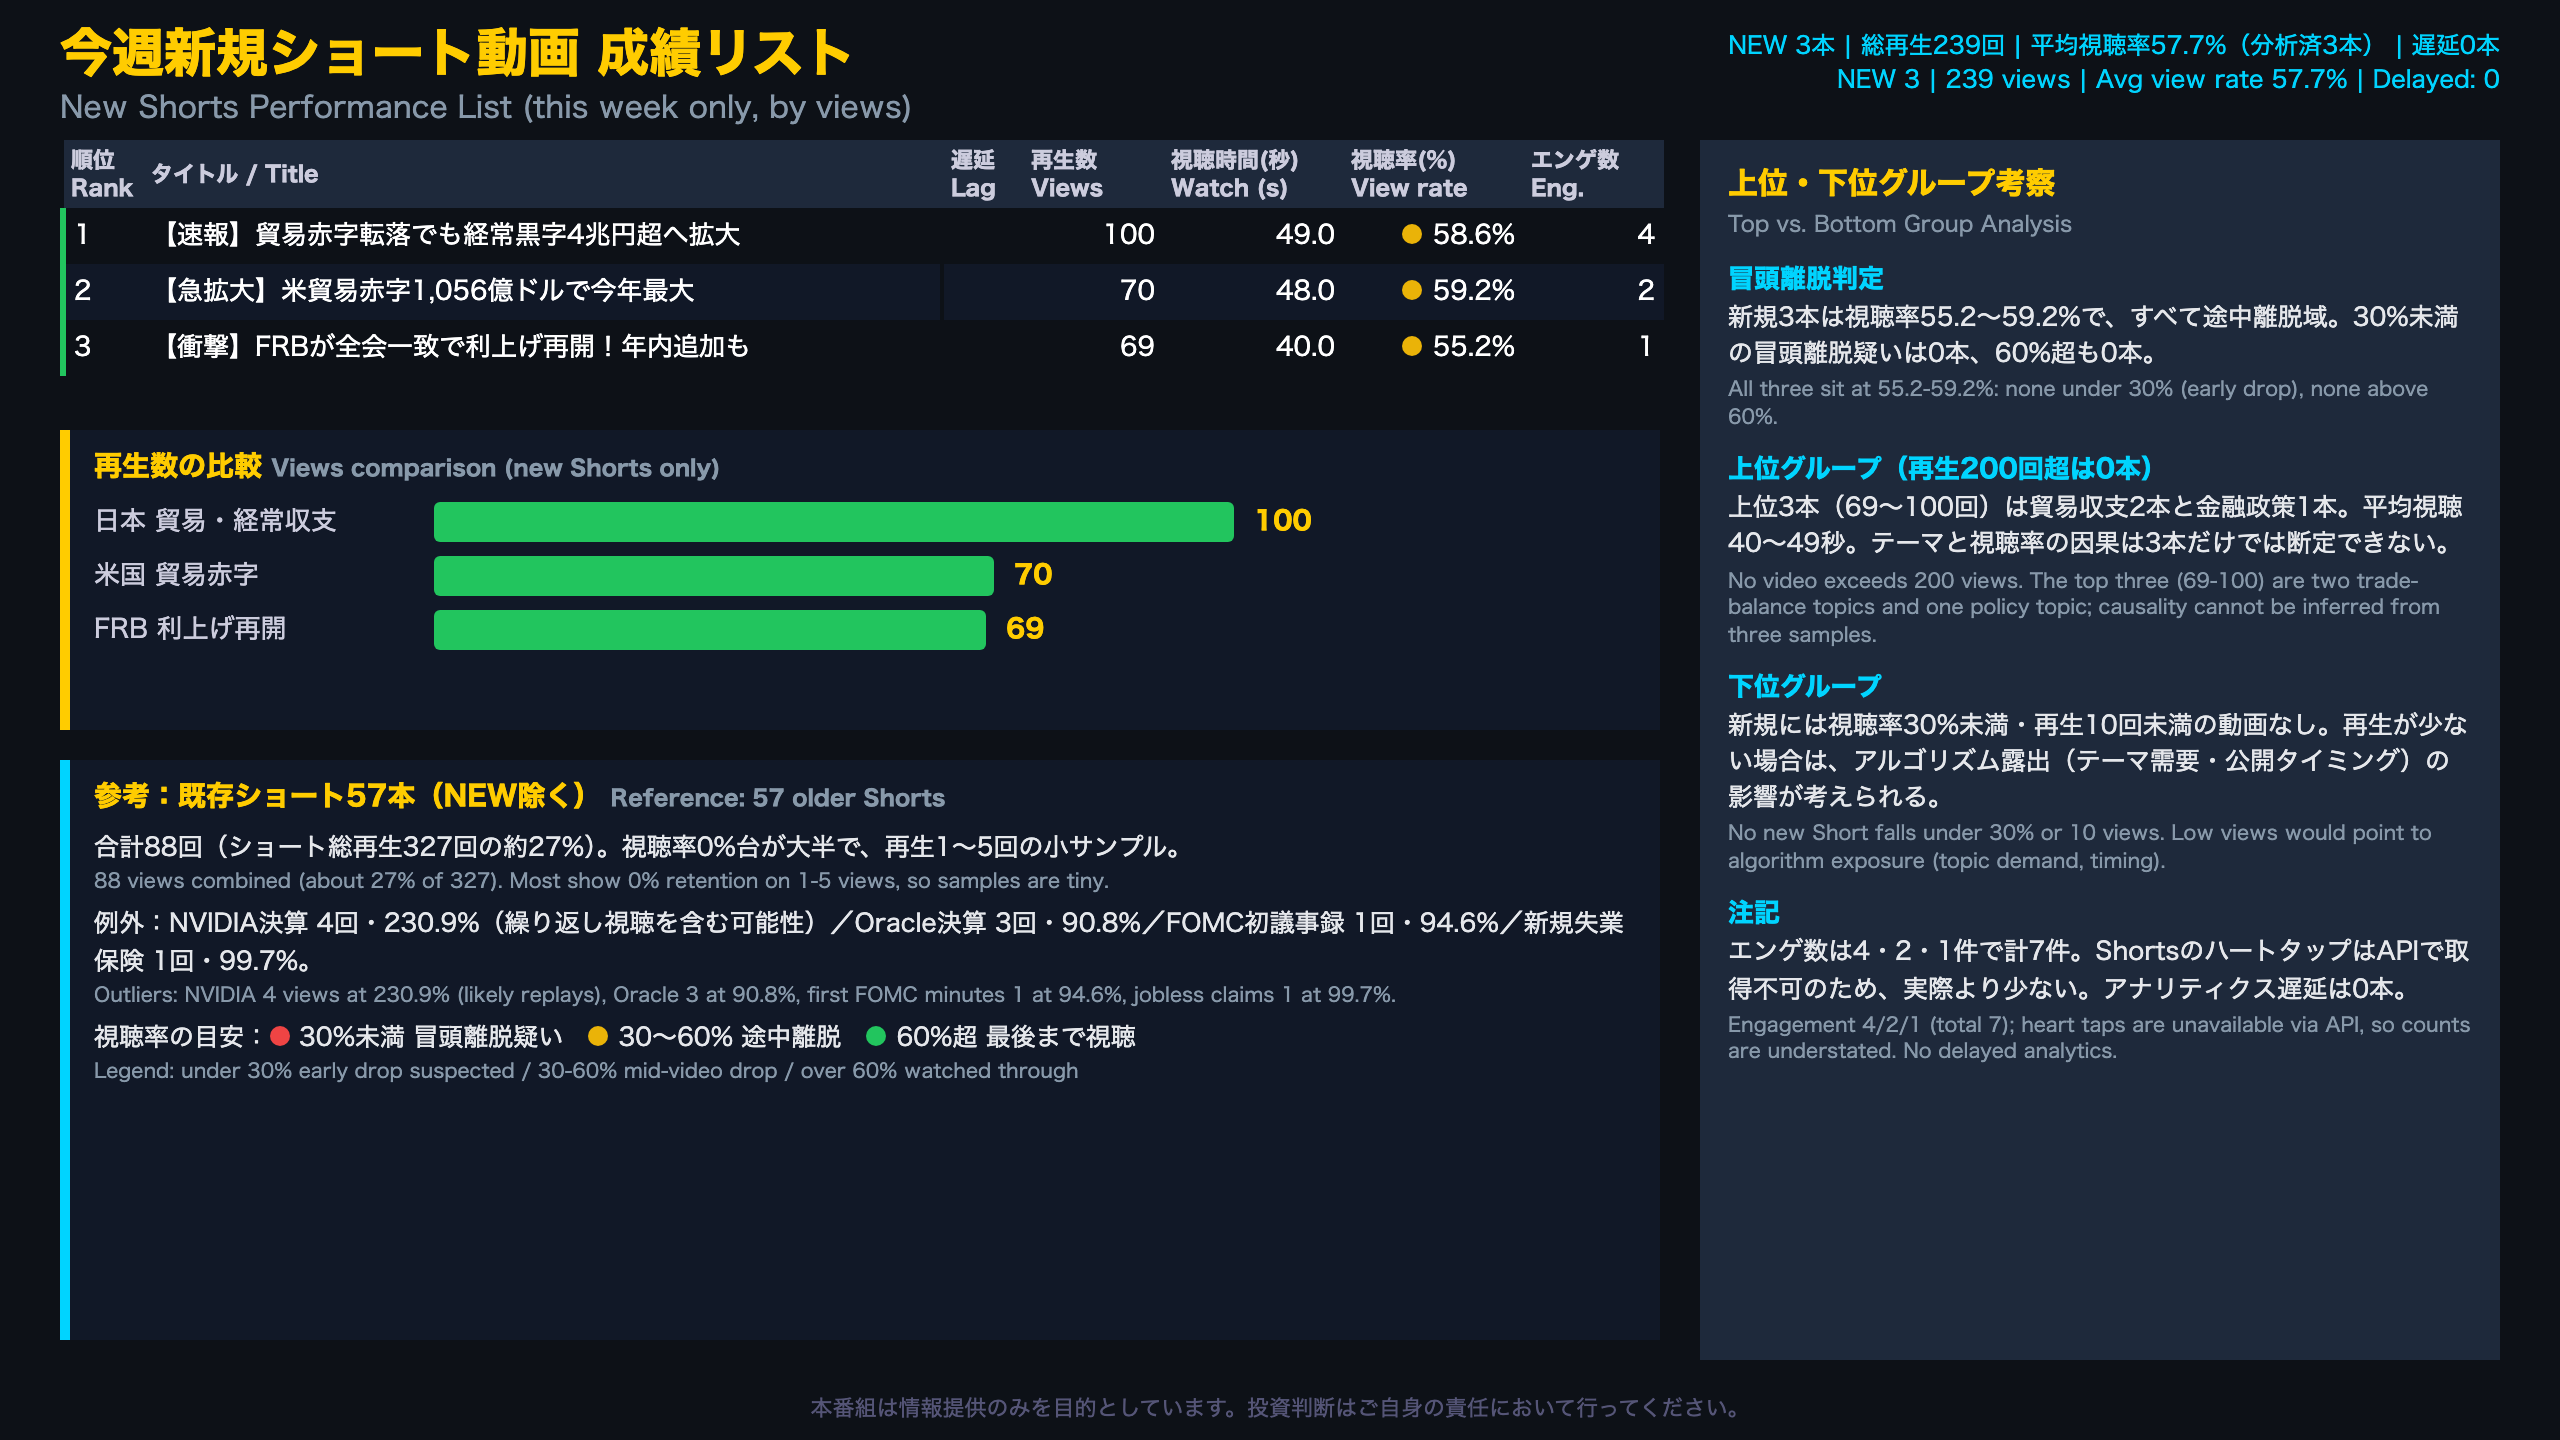
Shorts Deep Dive: What the Three New Videos Tell Us
Retention is the signal that matters on Shorts. Viewers decide within seconds whether to swipe, so average percentage viewed is a better gauge than the title or raw views.
| Short | Views | Avg watch | Avg viewed | Implied length |
|---|---|---|---|---|
| Japan balance of payments | 100 | 49 s | 58.6% | ~84 s |
| US trade deficit | 70 | 48 s | 59.2% | ~81 s |
| Fed resumes hikes | 69 | 40 s | 55.2% | ~72 s |
(Implied length = average watch time / average percentage viewed; an estimate, not reported.)
Context
- Across all 60 Shorts with analytics, average retention is only 16.2%, versus 57.7% for the new trio. Most older Shorts have 1-5 views, so many show 0.0; the gap should not be read as a pure quality difference.
- A 4-view Nvidia earnings Short at 230.9% implies looped replays; Shorts retention can exceed 100%.
- Heart taps are not exposed by the YouTube API, so engagement is understated.
Bull vs. bear
Bull: retention clustered in the high 50s, suggesting openings are not losing viewers early.
Bear: two of three cover trade balances and all three are small samples, so format and topic effects cannot be separated.
Next week: does 55%+ retention hold once more Shorts are published?
今週新規長尺動画 成績リスト
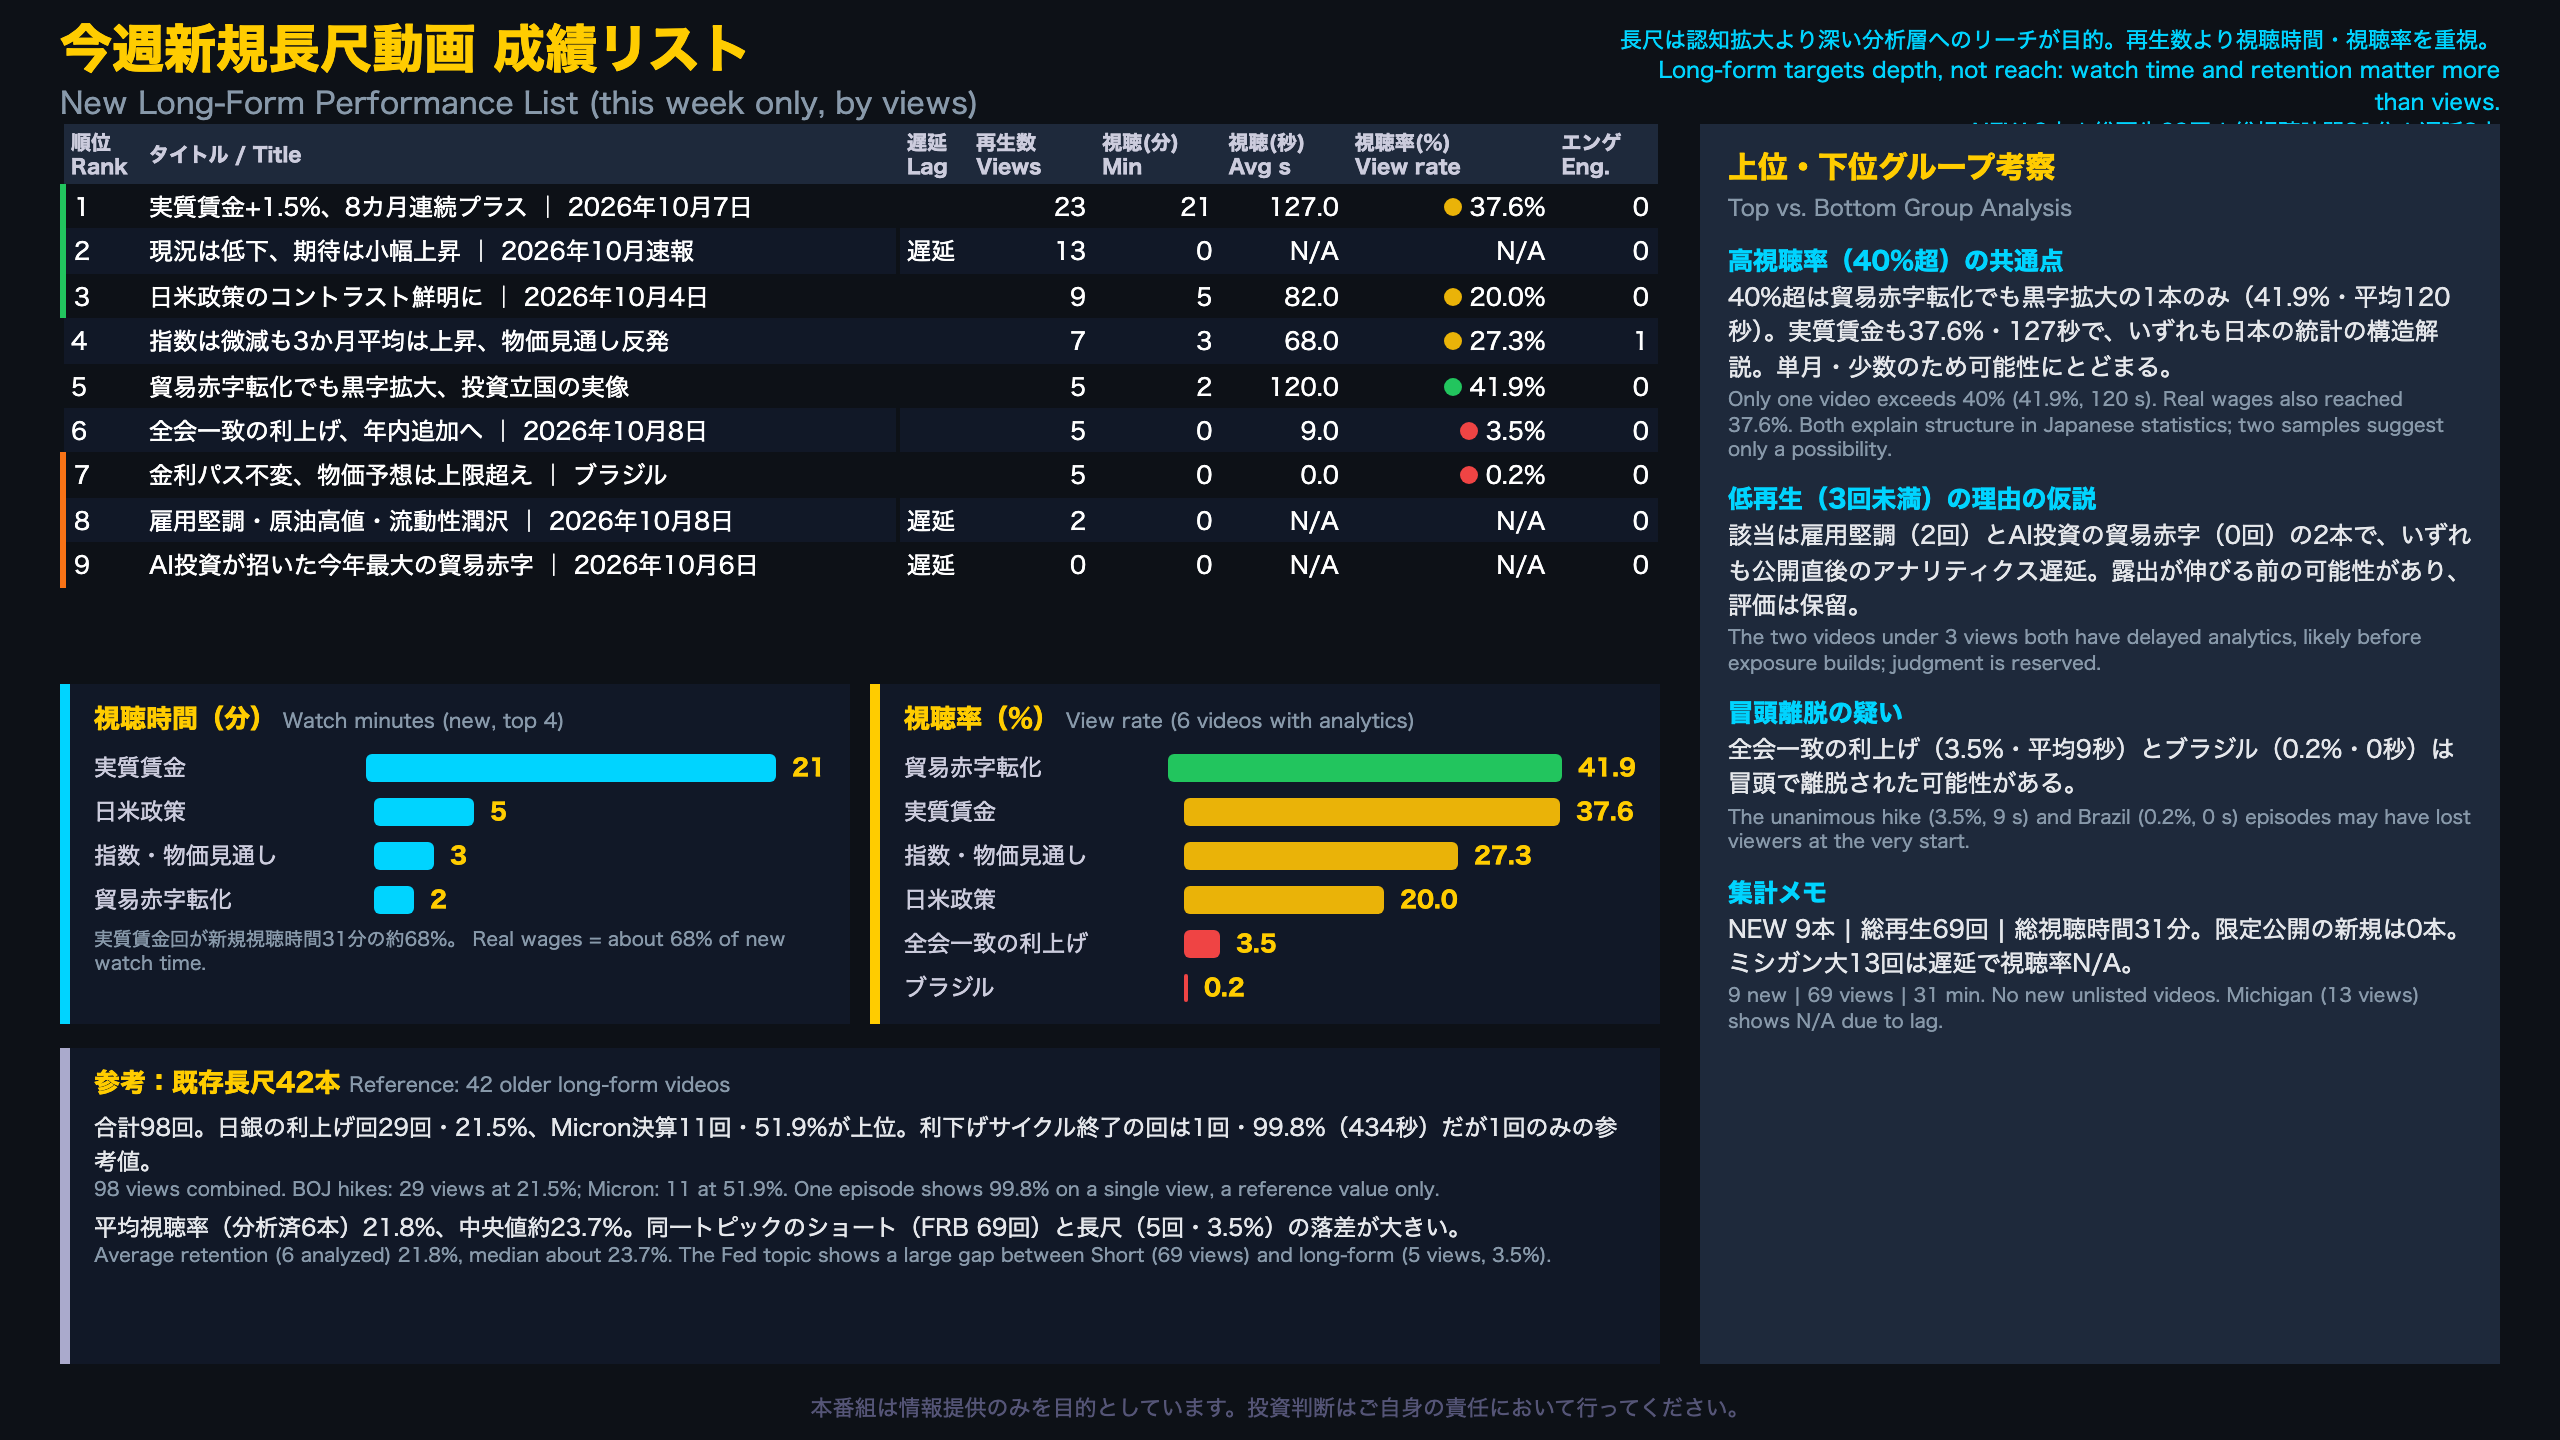
Long-Form Deep Dive: Depth Over Reach
Long-form episodes are meant to reach a smaller audience that wants detailed analysis, so watch time and retention matter more than raw views.
| Episode | Views | Watch min | Avg watch | Avg viewed | Implied length |
|---|---|---|---|---|---|
| Real wages +1.5% | 23 | 21 | 127 s | 37.6% | ~5.6 min |
| Trade deficit, wider surplus | 5 | 2 | 120 s | 41.9% | ~4.8 min |
| Japan-US policy contrast | 9 | 5 | 82 s | 20.0% | ~6.8 min |
| Index dips, 3-mo avg rises | 7 | 3 | 68 s | 27.3% | ~4.2 min |
Context
- Real wages come from Japan’s labor ministry monthly survey, a headline input for Bank of Japan policy debate, so this topic fits the ‘deep analysis’ audience.
- The 42 older long-form videos drew only 98 views combined; the top older episode (BOJ rate hikes) has 29 views at 21.5%.
- Average retention across the six new videos with analytics is 21.8%; the median is about 23.7%.
Bull vs. bear
Bull: one video above 40% shows a deeper-viewing segment exists.
Bear: the Fed unanimous-hike episode kept 3.5% (9 seconds) although its Short drew 69 views, so Shorts interest did not carry over.
Three videos with pending analytics (Michigan sentiment, jobless claims, US trade deficit) are excluded until data settles.
26日間 チャンネル成長トレンド
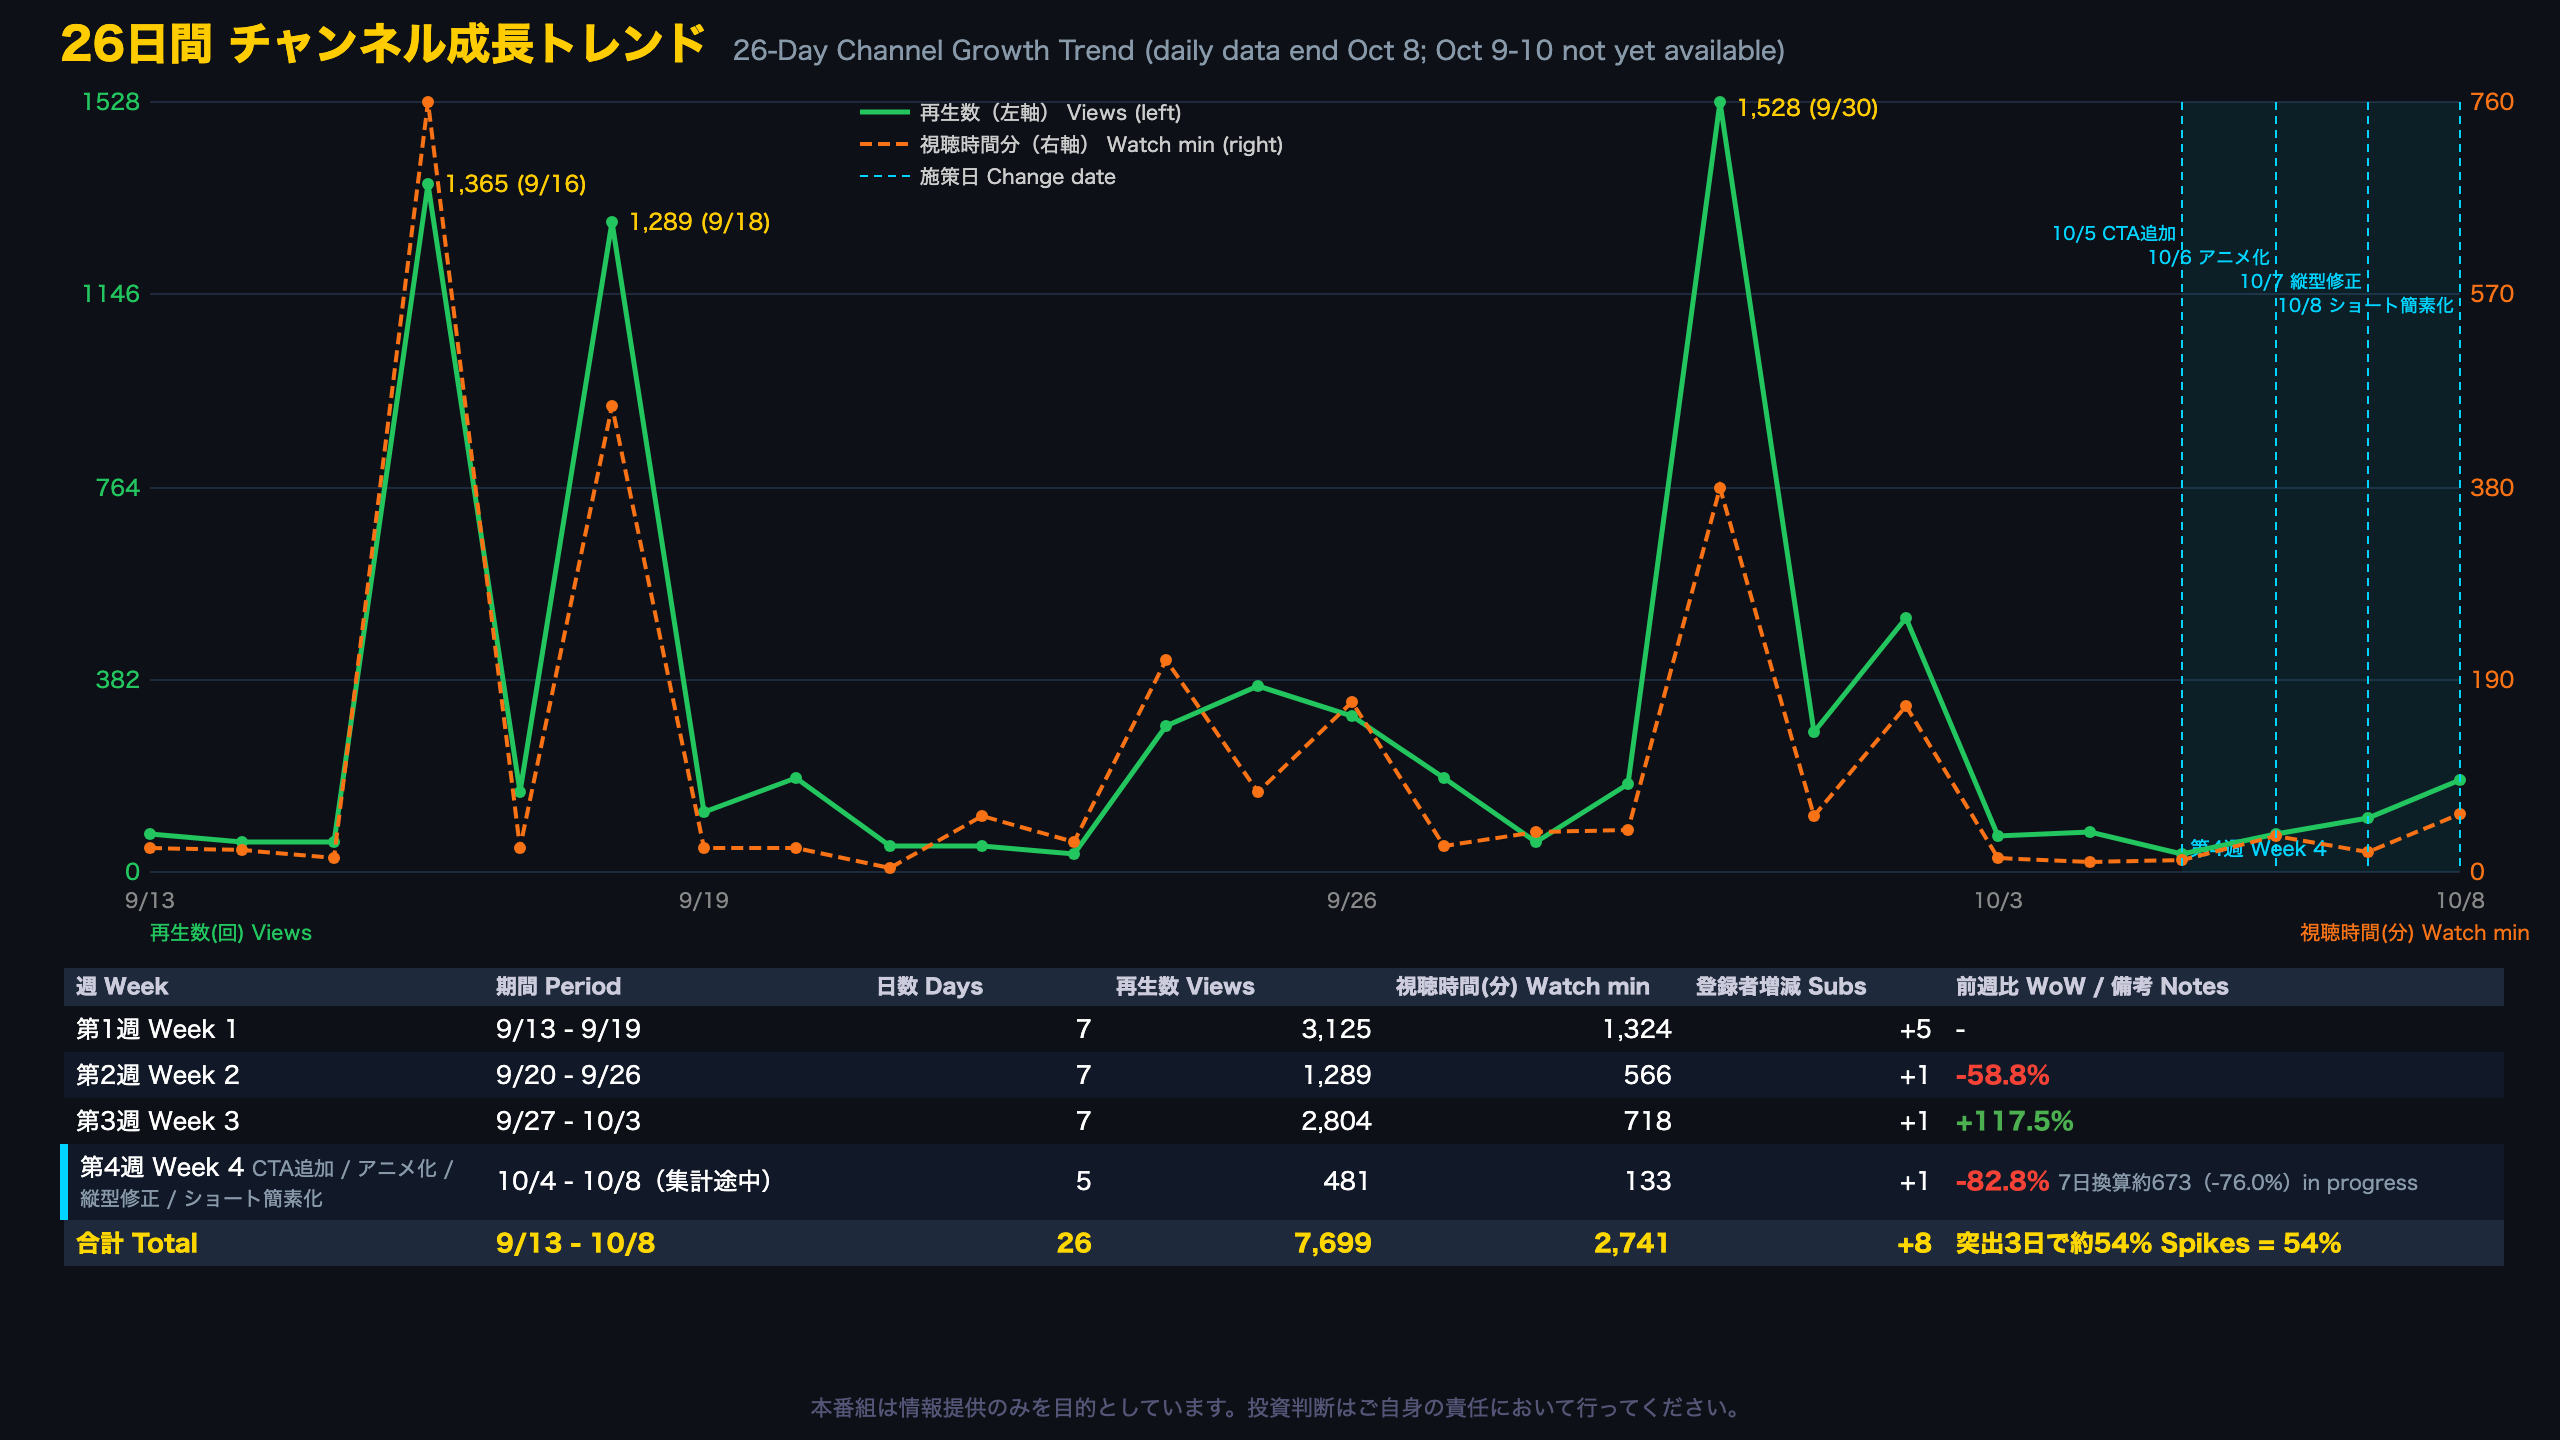
Reading the 26-Day Trend
The daily table covers Sept 13 to Oct 8 (26 days); Oct 9-10 are not yet available, so the prompt’s 28-day window is effectively 26 days.
Weekly averages
| Week | Views/day | Watch min per view |
|---|---|---|
| 1 | 446 | 0.42 |
| 2 | 184 | 0.44 |
| 3 | 401 | 0.26 |
| 4 (5 days) | 96 | 0.28 |
What stands out
- Three spike days (Sept 16, 18, 30) delivered 4,182 of 7,699 views, about 54%. The cause is not stated in the data; such jumps often reflect a single piece of content being surfaced by recommendations, but that is an assumption.
- Subscribers rose by a net 8 over 26 days, four of them on Sept 16.
- Watch time per view fell from about 0.43 to about 0.27 minutes after week 2, suggesting recent views are shallower.
The change log
Oct 5 added tailored subscribe calls, Oct 6 introduced animated slides, Oct 7 fixed vertical layout safe zones, and Oct 8 simplified Shorts. Daily views climbed 36, 75, 107, 182, yet that sits inside the normal non-spike range of 36-506.
Bull: four consecutive daily gains, and Oct 8 beats the 107-view median. Bear: four days are not a trend, and depth per view has not improved. Check whether daily views stay above 100 after Oct 9.
今週の番組制作コスト分析
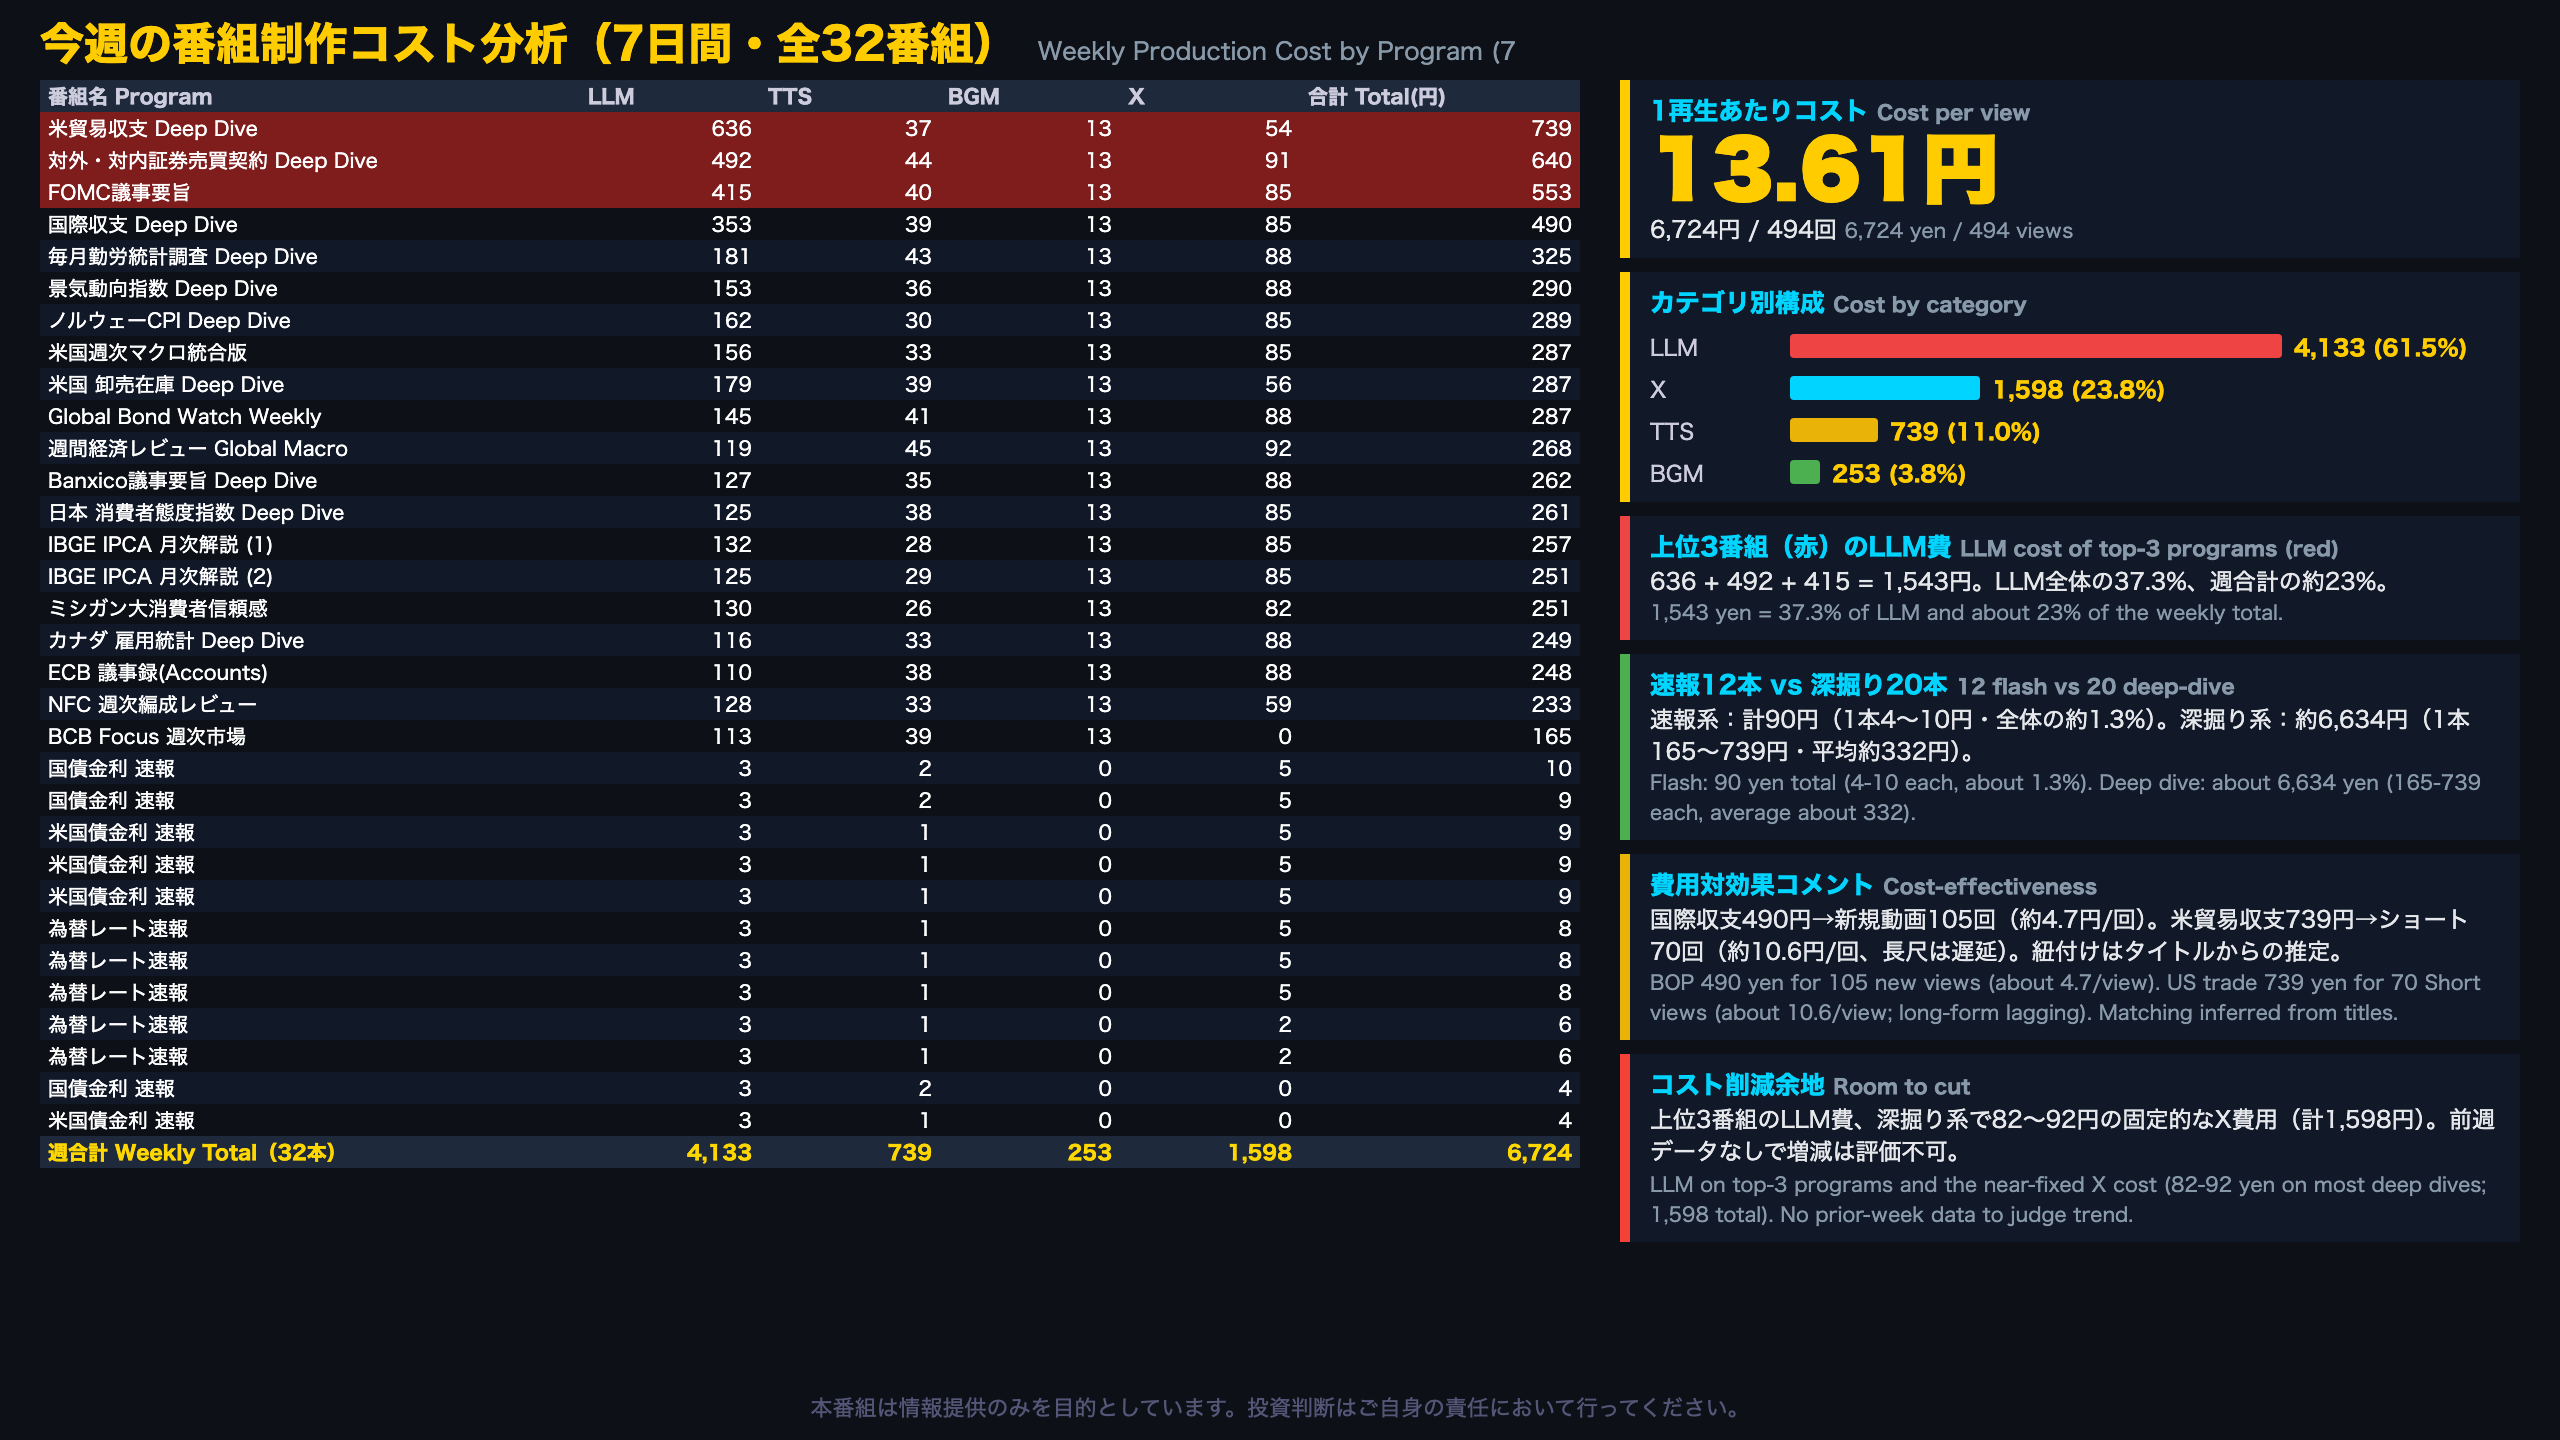
Cost Structure in Detail
Costs are tracked in four buckets: LLM (script and slide generation), TTS (voice), BGM (music generation) and X (social posting).
| Bucket | Yen | Share | Avg per program (32) |
|---|---|---|---|
| LLM | 4,133 | 61.5% | ~129 |
| X | 1,598 | 23.8% | ~50 |
| TTS | 739 | 11.0% | ~23 |
| BGM | 253 | 3.8% | ~8 |
Two production models
- Flash programs (12) on JGB yields, US Treasury yields and FX cost 4-10 yen each, 90 yen in total (about 1.3%).
- Deep-dive programs (20) cost 165-739 yen, averaging about 332 yen. LLM spend ranges from 110 to 636 yen, roughly 200 times a flash program’s 3 yen.
- Posting cost on X is nearly flat at 82-92 yen for most deep dives, so it behaves like a fixed fee.
Cost versus audience
Views are not reported per program, so we matched by title. Balance of payments: 490 yen for 105 new views (about 4.7 yen per view). US trade balance: 739 yen for 70 Short views (about 10.6 yen), with its long-form video still in the analytics lag window. Spillover views to older videos are not counted.
Efficient: 13.61 yen per view overall and flash programs at only 1.3% of spend. Worth examining: the top three programs absorb 37.3% of LLM cost, but without last week’s data we cannot say whether this is rising or falling.
来週の番組制作方針
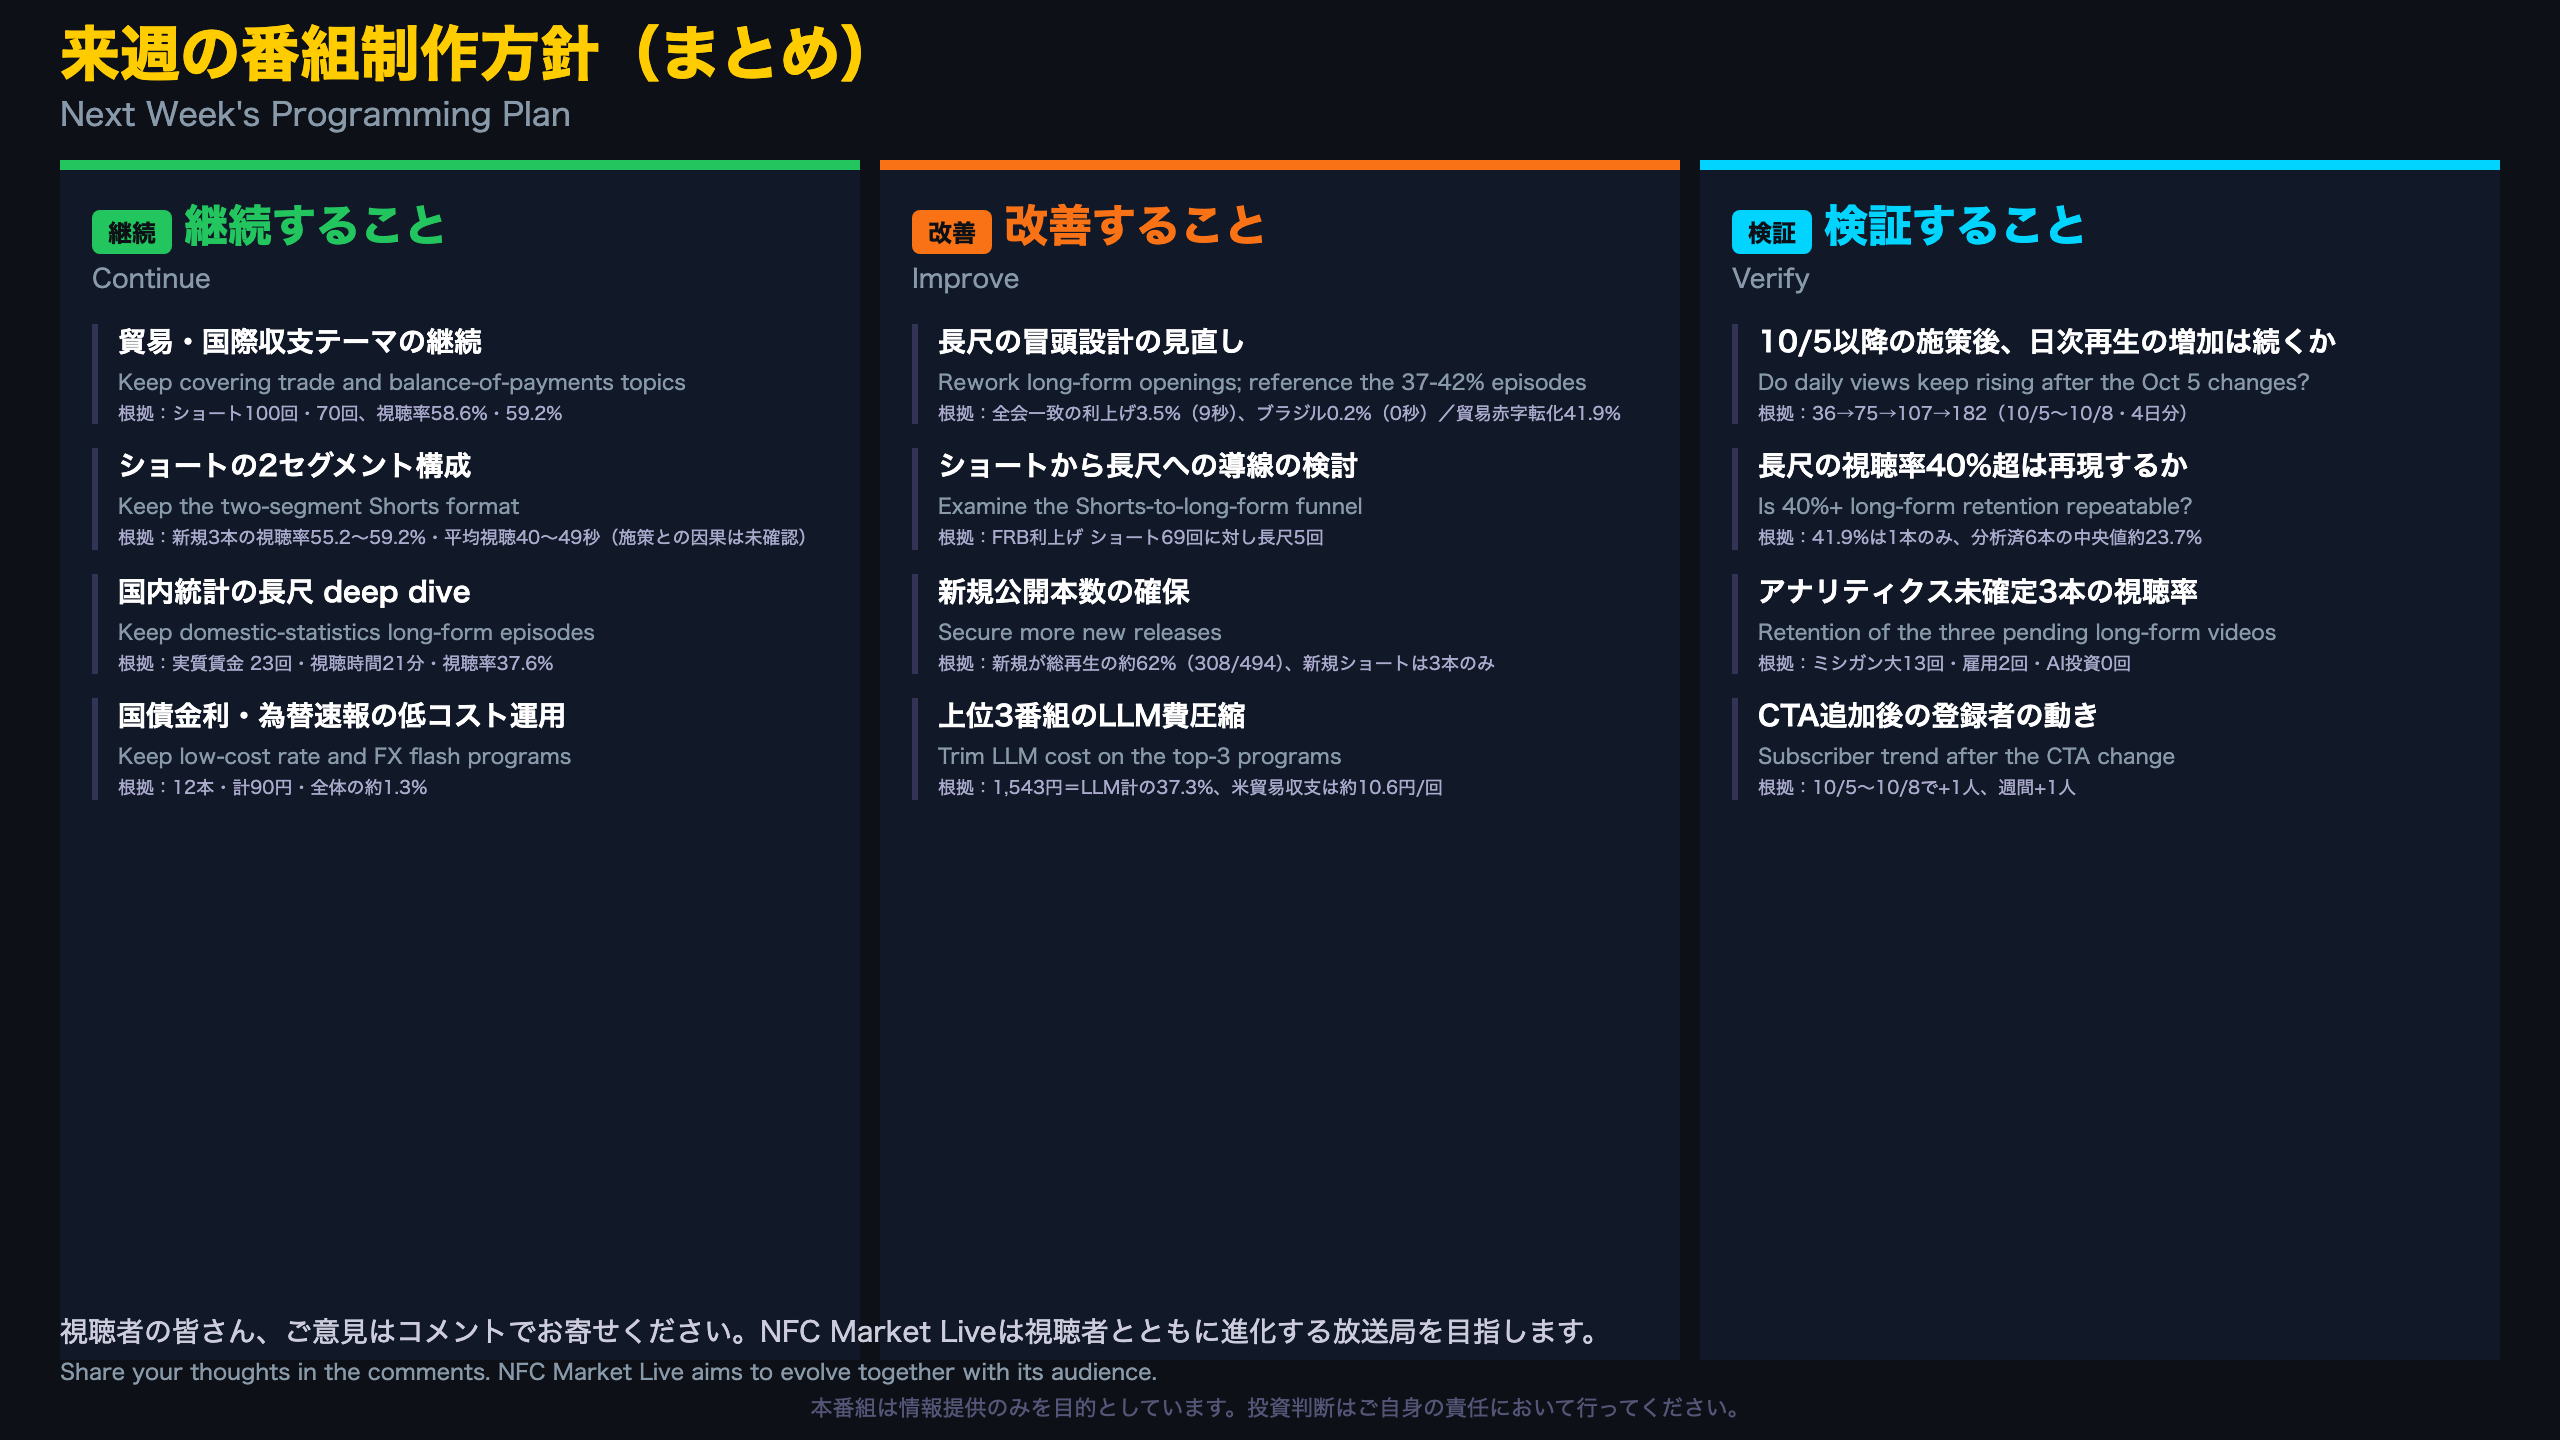
Next Week’s Programming Plan: Evidence and Decision Rules
Proposed checkpoints
| Topic | This week | Checkpoint next week (proposal) |
|---|---|---|
| New Shorts retention | 55.2-59.2% | Stay at 50%+ |
| Long-form retention | Best 41.9%, median ~23.7% | More episodes at 30%+ |
| Daily views (Oct 5-8) | 36 to 182 | Stay above 100 |
| Cost per view | 13.61 yen | Same or lower |
These are operating targets derived from this week’s data, not forecasts.
Why these choices
- Continue: Trade and balance-of-payments Shorts drew the most views (100 and 70). Flash programs cost 90 yen in total, about 1.3% of spend.
- Improve: The Fed rate-hike long-form lost viewers after about 9 seconds. Its Short drew 69 views but the long-form only 5, so the Shorts-to-long-form funnel may not be working.
- Verify: The four changes landed within Oct 5-8, so their individual effects cannot be separated. Testing one change at a time would give cleaner answers.
Balanced view
Positives: Shorts retention in the high 50s, one long-form above 40%, four straight daily gains.
Concerns: week 4 delivered 481 views in five days versus 2,804 in week 3, subscribers rose by only one, and watch time per view is trending lower.
Once Oct 9-10 data settle, recompute week 4 on seven days and compare it with this review.
Disclaimer: This article is for informational purposes only. All investment decisions are made solely at your own risk.