
📺 Watch the Full Video Analysis
This article was automatically generated by the NFC Market Live AI analysis system. (Updated: 2026-10-10 07:11 JST)
📄 Primary Source
米国労働省(DOL)— 新規失業保険申請件数
https://www.dol.gov/newsroom/releases/eta/eta20261008
米国エネルギー情報局(EIA)— 週間石油状況レポート
https://www.eia.gov/petroleum/supply/weekly/pdf/highlights.pdf
連邦準備制度理事会(FRB)— H.4.1 バランスシート
https://www.federalreserve.gov/releases/h41/current/h41.htm
📊 A full check of three weekly US releases: DOL jobless claims, the EIA Weekly Petroleum Status Report, and the Fed H.4.1 balance sheet.
👷 Seasonally adjusted initial claims were 197,000 (down 2,000 on the week). The four-week average of 198,000 is the lowest in the series shown in the release.
🛢️ WTI rose to $97.89 from $85.23 a week earlier and sits far above $61.65 a year ago, while retail gasoline eased to $4.354.
💰 Fed reserve balances averaged $3.03 trillion, lifted by a lower Treasury General Account.
💡 Labor and liquidity look resilient, while energy costs weigh: a mixed picture.
⚠️ Note the timing gap: the EIA highlights text covers the week ending Sep 11, while the tables show the week ending Oct 2.
今週のアルティメット・サマリー
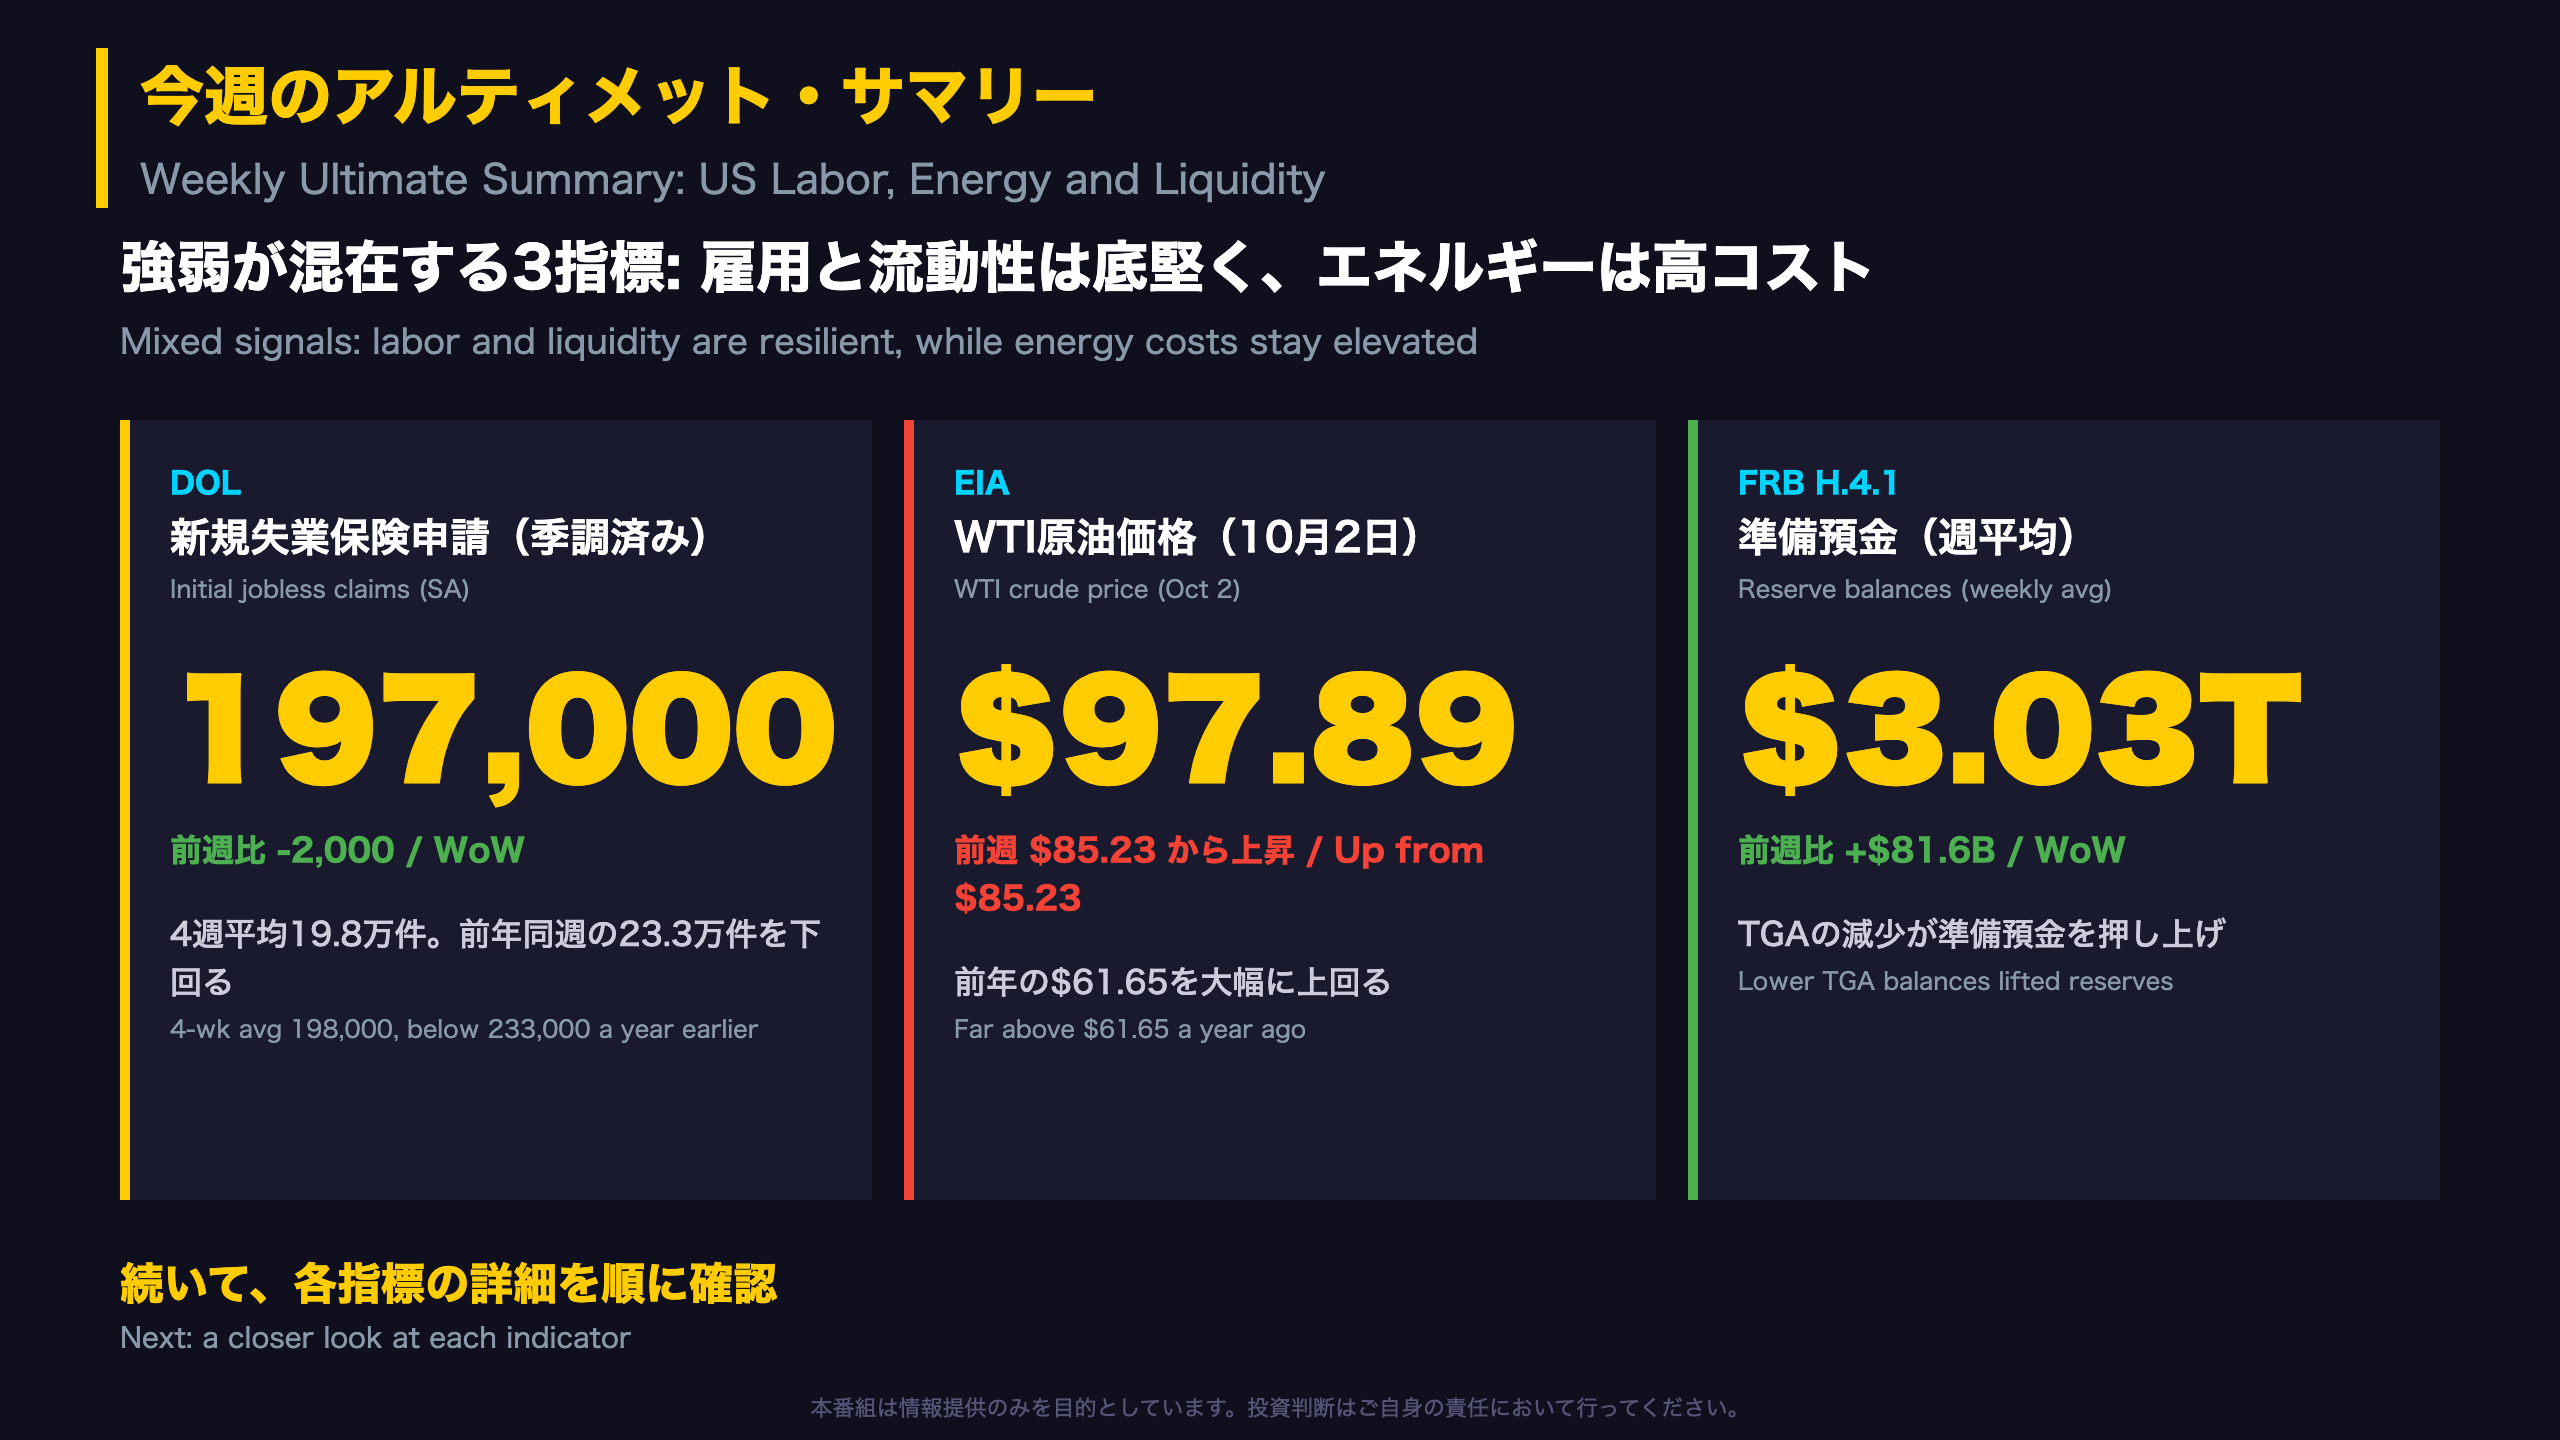
Weekly US Macro Check: Labor, Energy, Liquidity
This edition combines three weekly US releases: the Department of Labor (DOL) unemployment insurance claims report, the Energy Information Administration (EIA) Weekly Petroleum Status Report, and the Federal Reserve’s H.4.1 balance sheet release.
Snapshot
- Labor: Seasonally adjusted initial claims were 197,000, down 2,000 from the prior week’s revised level.
- Energy: WTI crude was $97.89 in the week ending October 2, versus $85.23 a week earlier and $61.65 a year ago.
- Liquidity: Reserve balances averaged $3.03 trillion, up $81.6 billion on the week.
Why these three
Claims are an early read on layoffs, WTI is a key input to headline inflation, and reserve balances show how much cash the banking system holds at the Fed. Together they offer a quick read on labor conditions, cost pressure, and funding conditions. Unlike Japan’s monthly CPI or the quarterly Tankan survey, these US series are weekly and therefore noisier.
Caveat
The EIA highlights text refers to the week ending September 11, while the stock and price tables show the week ending October 2. Keep that timing gap in mind when comparing figures. Our weekly regime model has stayed in regime R0 for five straight weeks.
労働市場の現在地(DOL 新規失業保険申請)
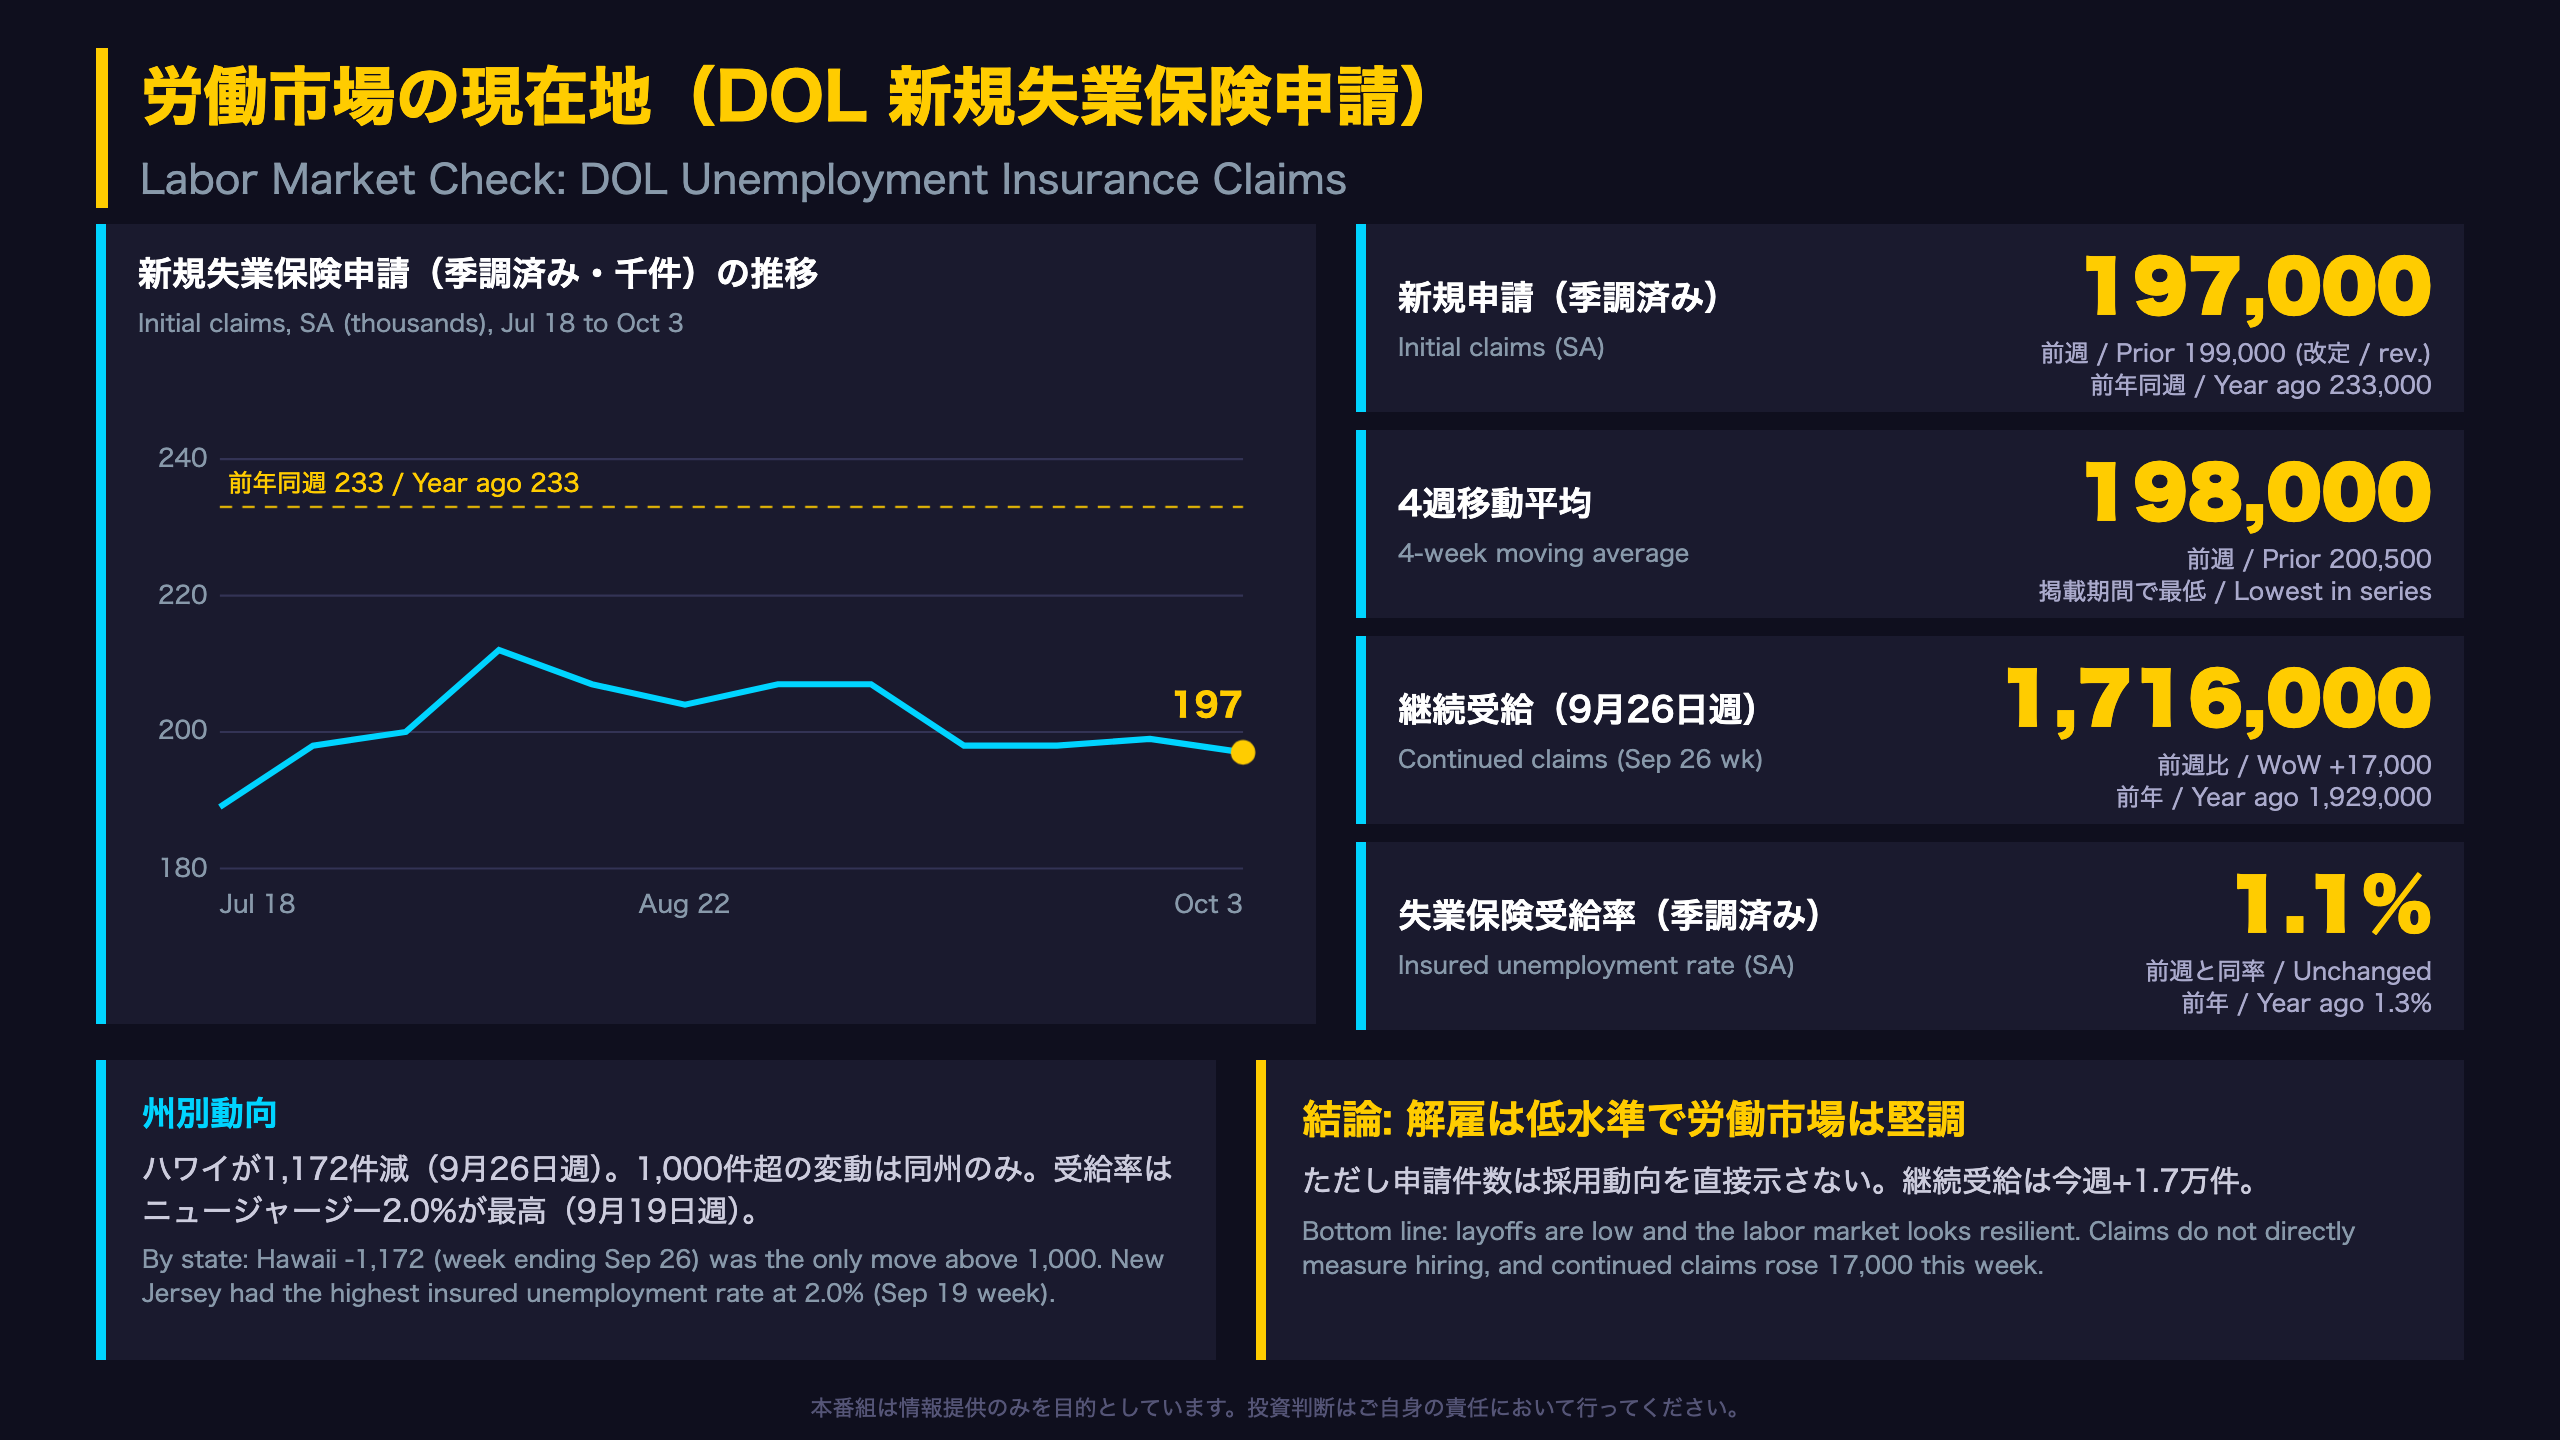
Inside the Jobless Claims Report
What is it? The Department of Labor’s weekly Unemployment Insurance Claims report counts new filings (initial claims) and ongoing benefit claims (continued claims). Initial claims are treated as an early indicator of layoffs; continued claims confirm the direction of the labor market with a lag. The US figure is weekly, unlike Japan’s monthly jobless rate.
Key numbers (seasonally adjusted)
- Initial claims: 197,000 (prior week revised up to 199,000; year-ago 233,000).
- Four-week average: 198,000, the lowest in the table covering the past year.
- Continued claims (week ending Sep 26): 1.716 million, up 17,000 on the week but below the 1.929 million of a year earlier.
- Insured unemployment rate: 1.1%.
Unadjusted detail
Unadjusted initial claims rose 7.6% to 170,333, but seasonal factors had expected an 8.7% rise, so the increase was smaller than the usual seasonal pattern. No state triggered Extended Benefits.
Two readings
- Constructive: low levels on every measure suggest limited layoffs.
- Cautious: DOL notes that continued claims roughly coincide with cycle peaks and lag at troughs, and that the weekly data are difficult to seasonally adjust. Claims also say little about hiring.
Context for global investors
The Fed watches labor conditions alongside inflation, so this series is a frequent input to US rates discussions. We simply flag the data; the release itself offers no forecast.
エネルギー需給の現在地(EIA 週間石油状況)
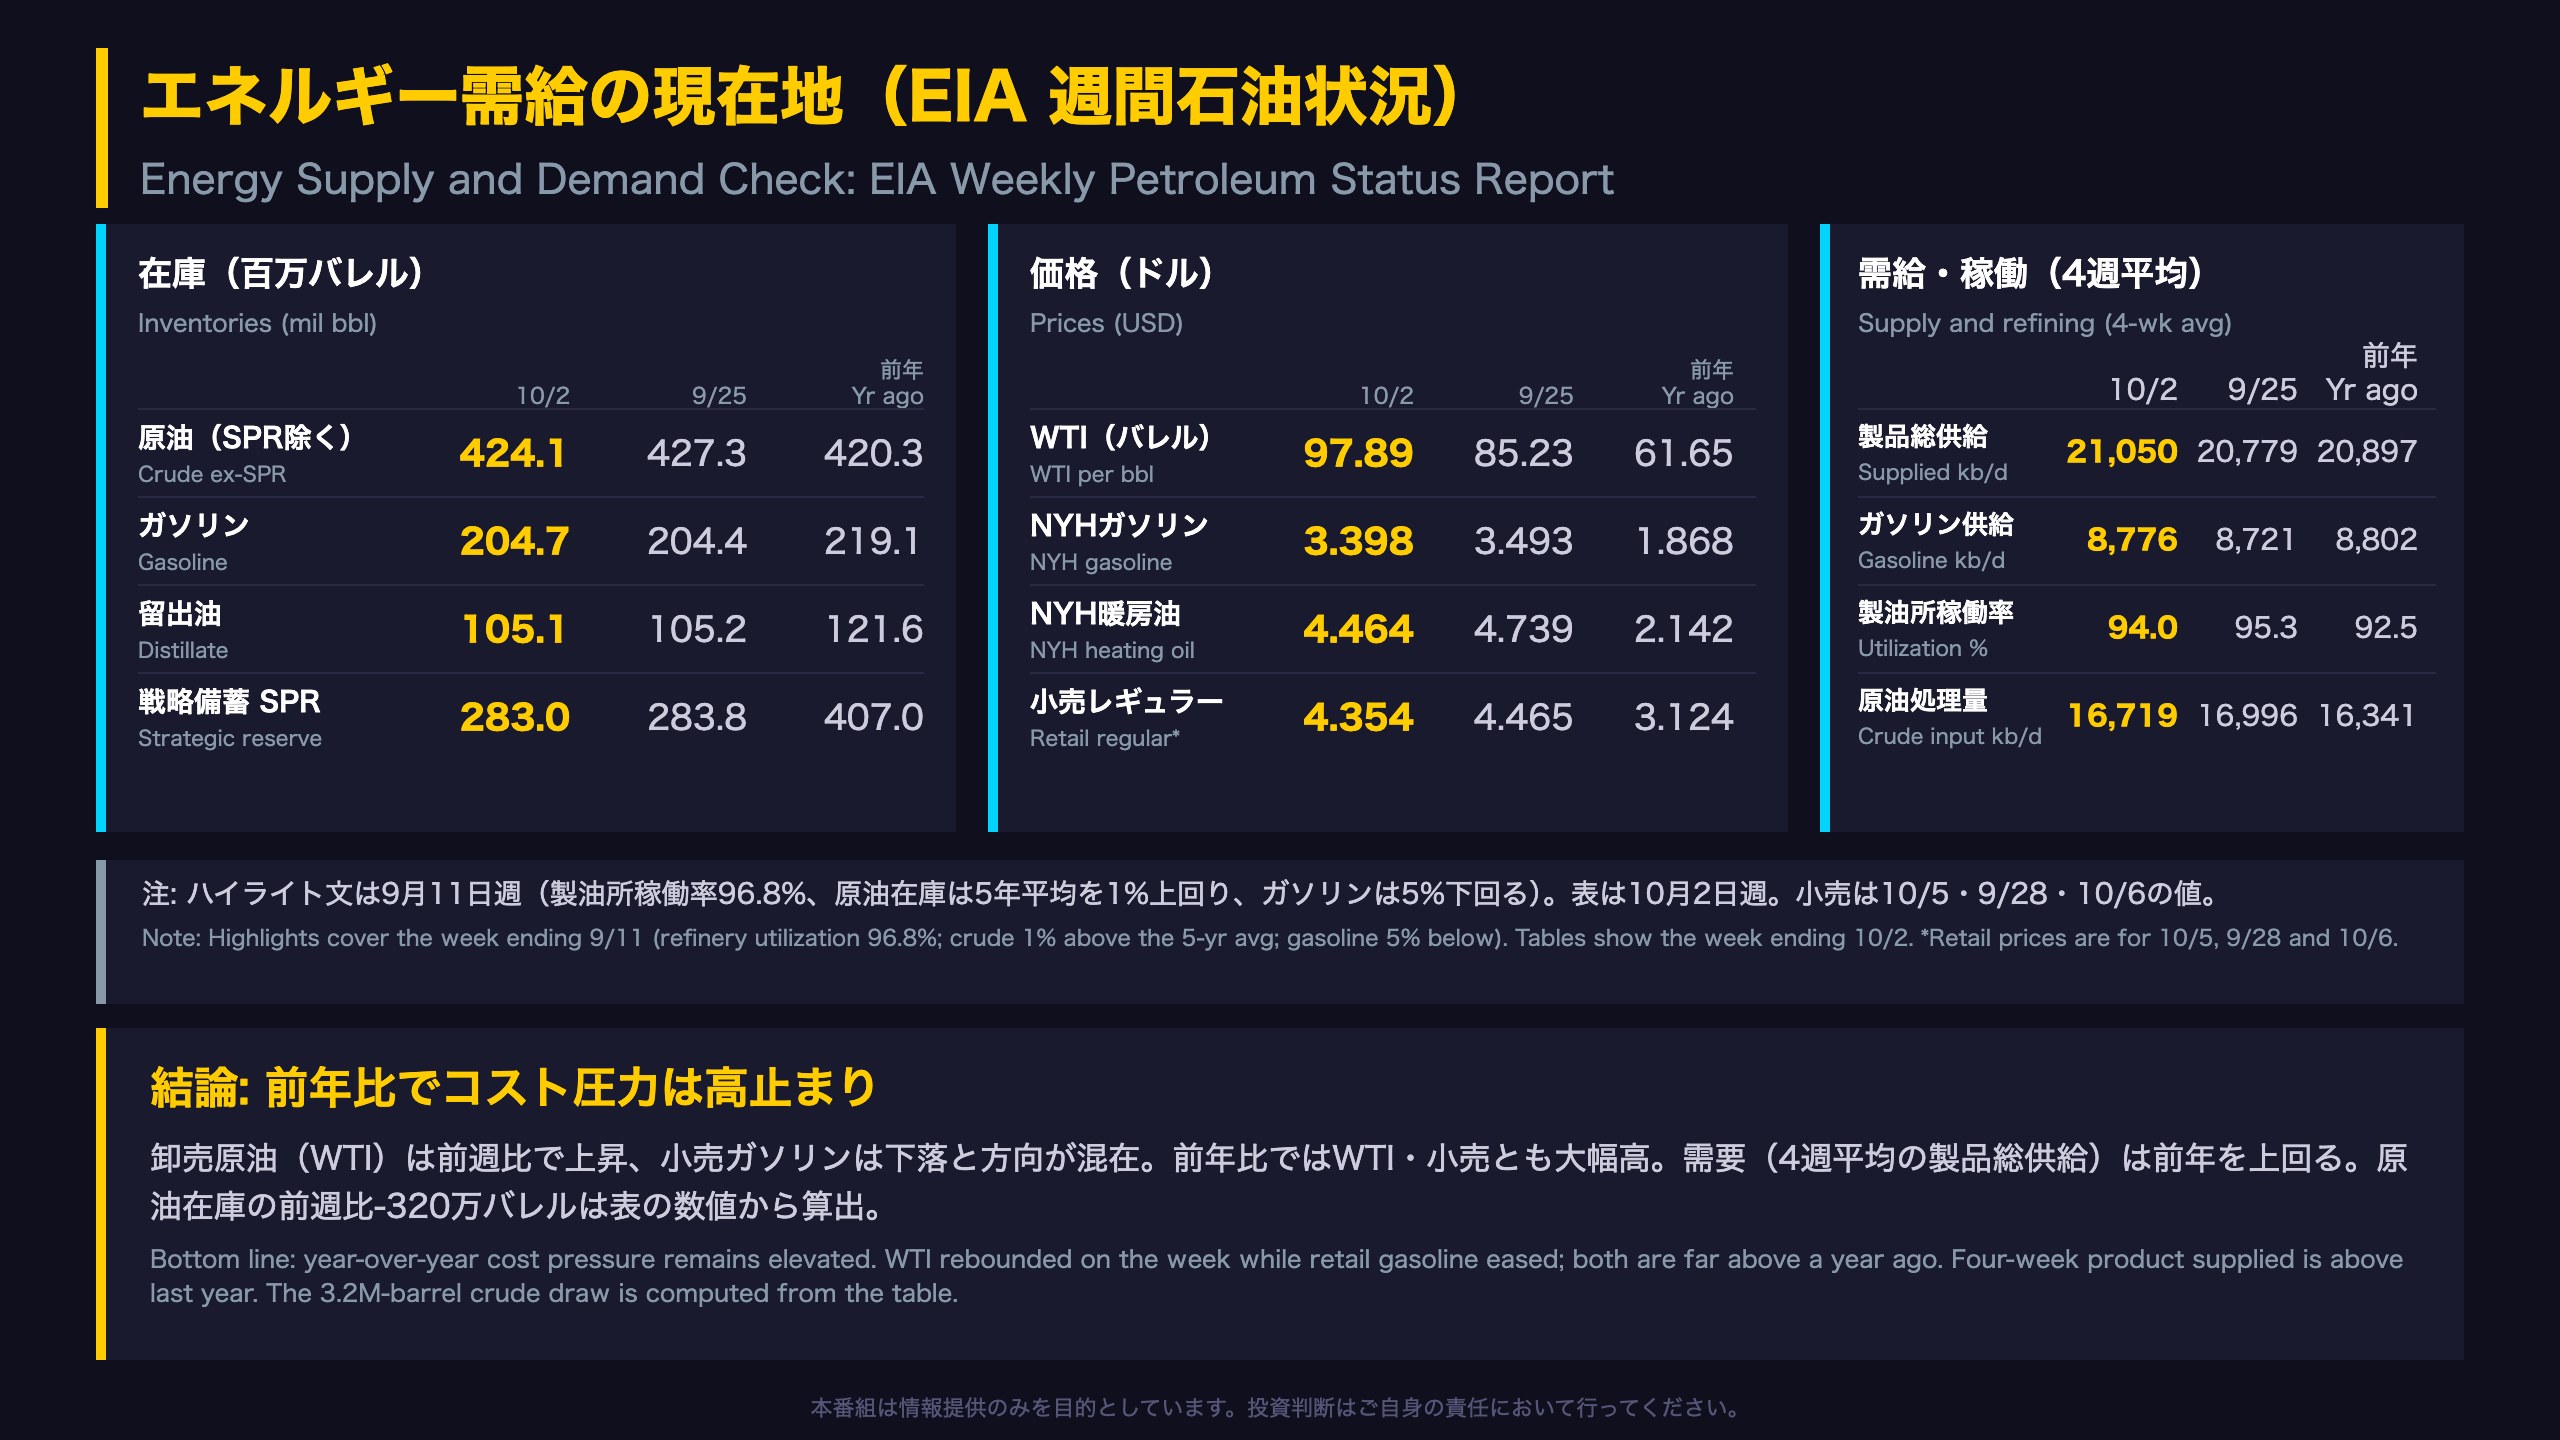
EIA Weekly Petroleum Status Report: Inventories, Prices, Refining
About the report: The Energy Information Administration (EIA), part of the US Department of Energy, publishes this weekly snapshot of crude oil and product stocks, refinery activity, imports, and prices. It is a standard input for US energy and inflation analysis, similar in role to Japan’s METI oil statistics but published weekly.
Timing note
The highlights text covers the week ending September 11, while the stock, price, and supply tables show the week ending October 2 (and four-week averages). We flag both sets rather than blend them.
September 11 highlights
- Refinery runs of 17.3 million b/d at 96.8% utilization.
- Commercial crude stocks fell 0.6 million barrels to 423.4 million, 1% above the five-year average; gasoline stocks were 5% below and distillates 13% below.
- WTI was $101.27, up $8.58 on the week and $38.25 on the year.
October 2 tables
- Crude (ex-SPR) 424.1 million barrels vs 427.3 million prior and 420.3 million a year ago.
- SPR holdings 283.0 million barrels vs 407.0 million a year ago.
- WTI $97.89 vs $85.23 prior and $61.65 a year ago.
- Retail regular gasoline $4.354 vs $4.465 prior and $3.124 a year ago.
Two readings
Demand looks steady in the table-based four-week average (21.05 million b/d versus 20.90 million a year ago), yet the September 11 highlights showed a 0.6% year-over-year decline. Prices are the clearer pressure point: levels are far above a year ago even though retail gasoline eased on the week.
Why it matters internationally
Energy is a core component of headline inflation measures worldwide, including Japan’s CPI. We present the data as reported and make no price forecast.
FRB流動性の現在地(H.4.1 バランスシート)
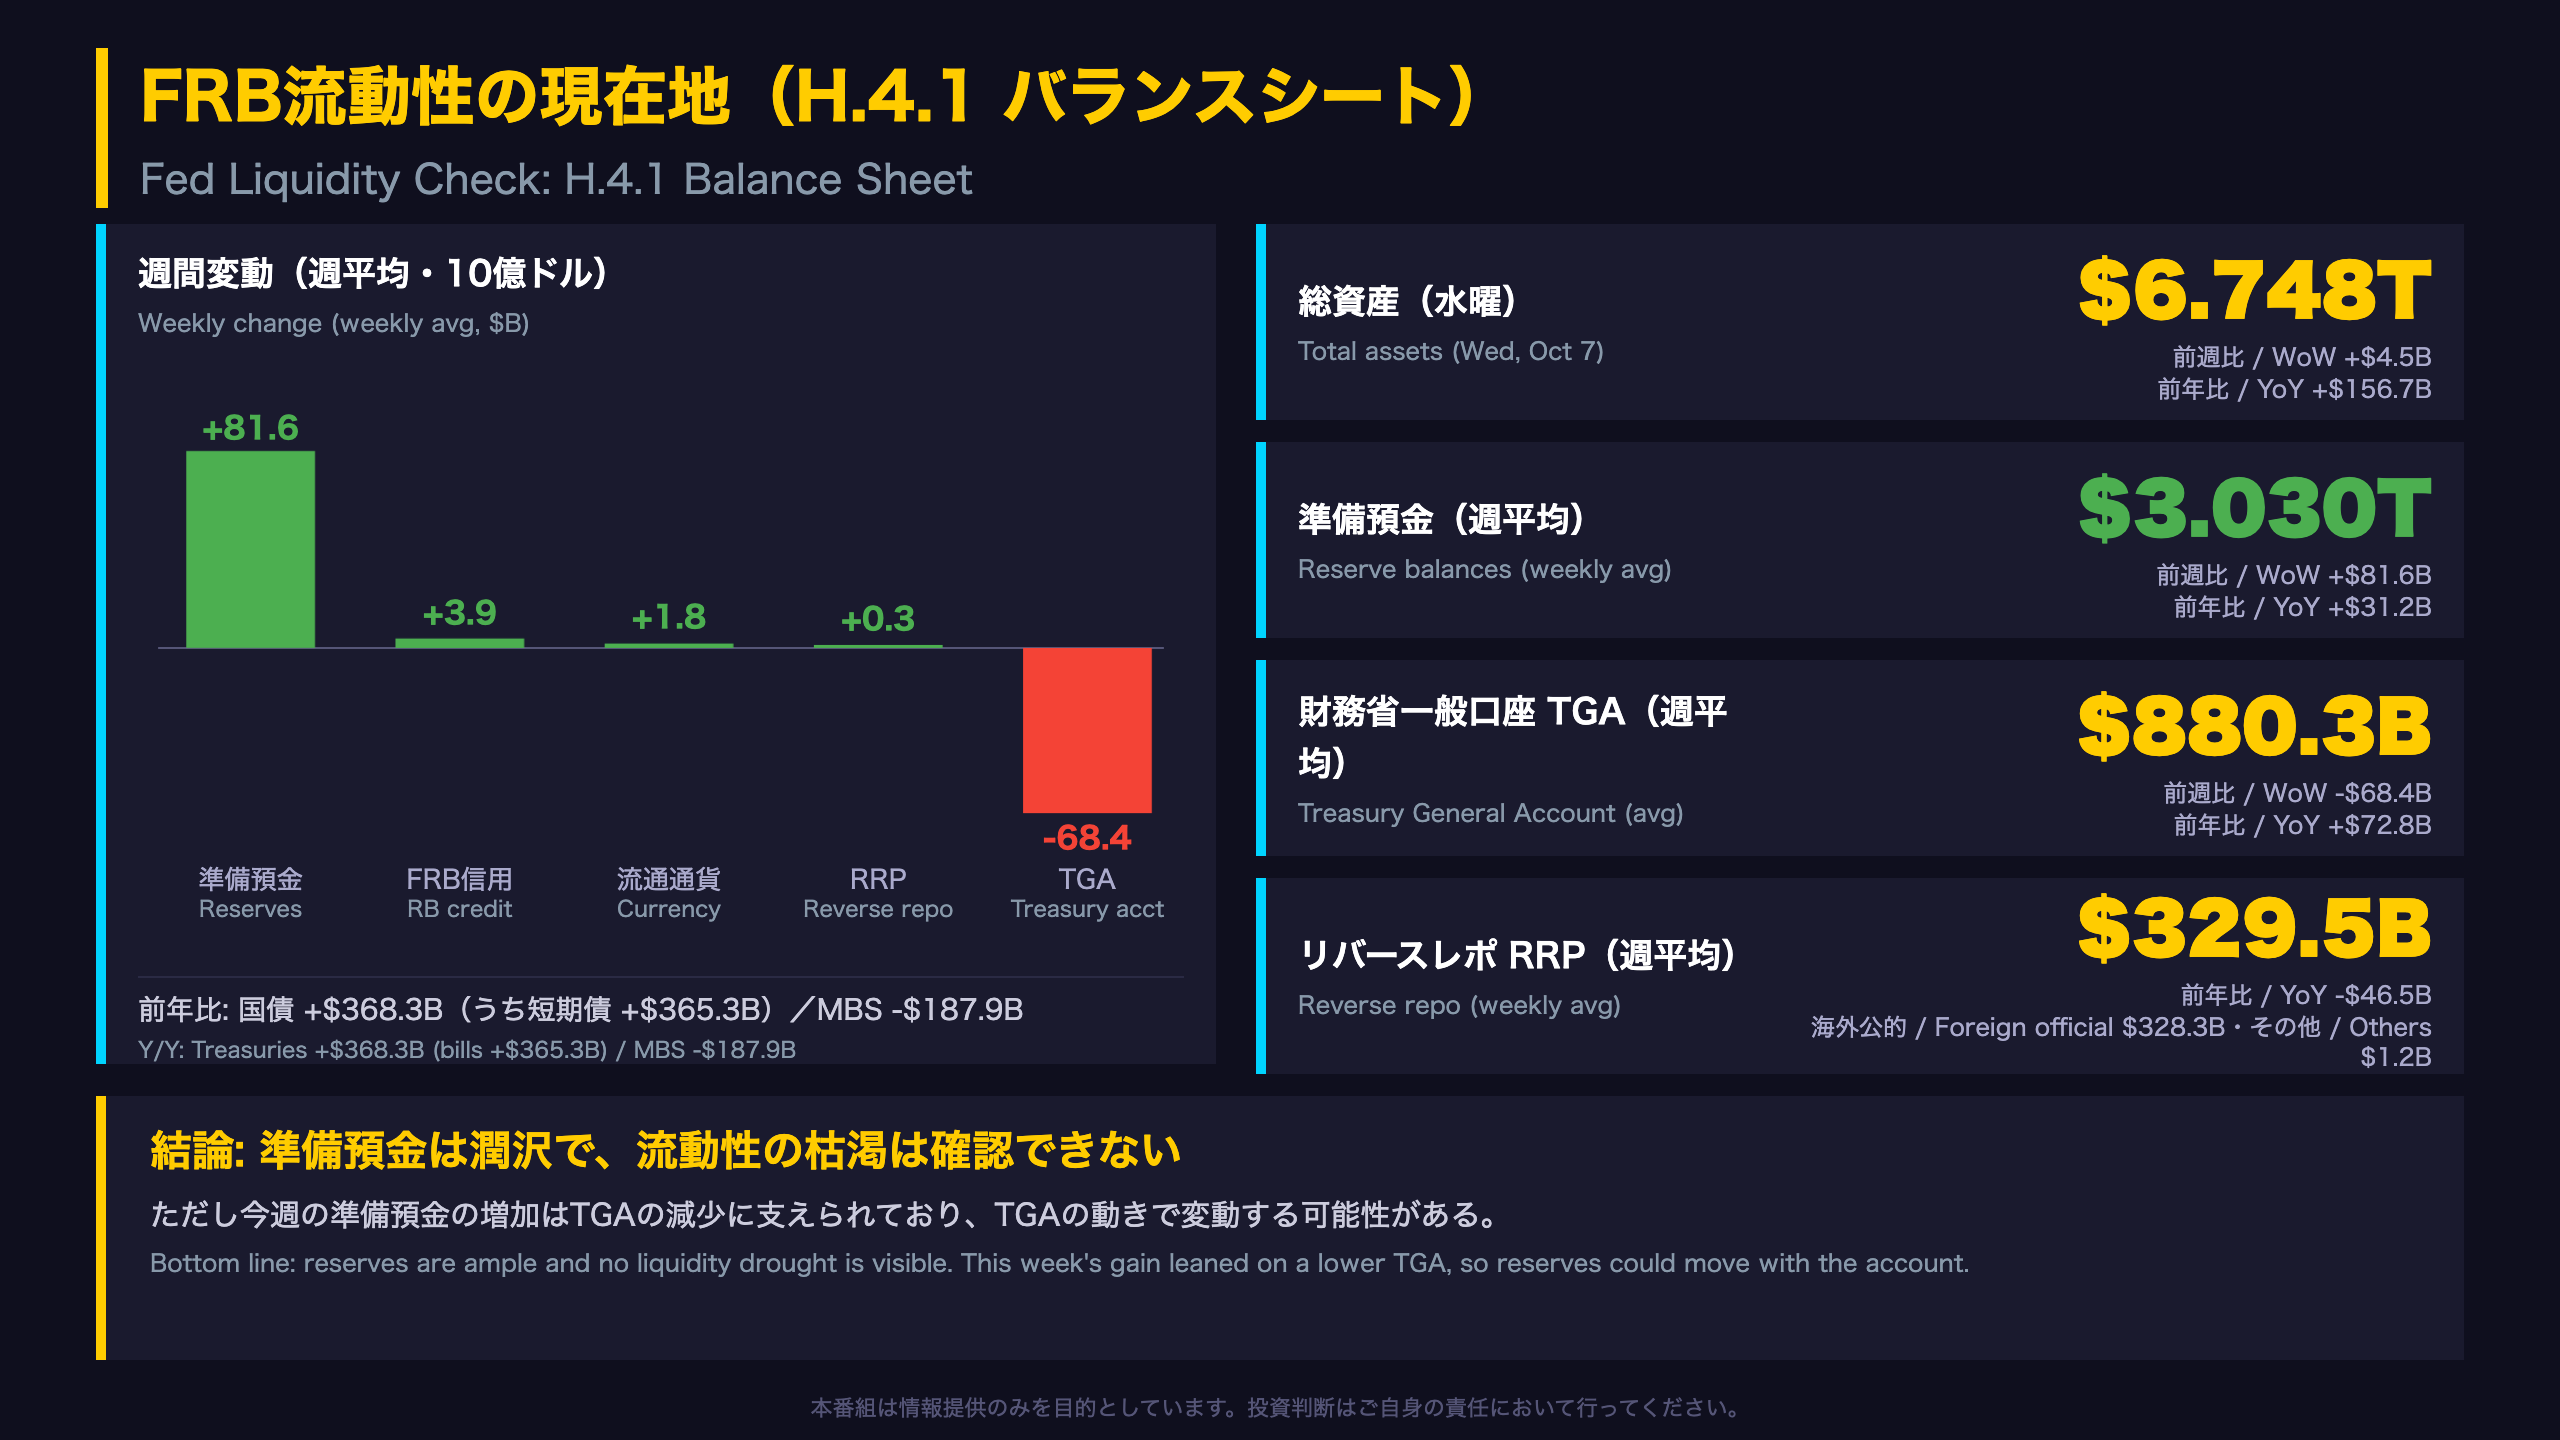
Reading the Fed’s H.4.1 Release
What is H.4.1? The Federal Reserve’s weekly release, formally called Factors Affecting Reserve Balances, shows the central bank’s balance sheet and the items that add or drain reserves. The figures here are averages of daily values for the week ended October 7, 2026, unless stated otherwise. It is the US counterpart to the Bank of Japan’s weekly accounts.
Asset side
- Reserve Bank credit averaged $6.696 trillion (+$3.9 billion w/w, +$155.8 billion y/y).
- Treasury securities were $4.565 trillion, up $368.3 billion y/y; bills alone rose $365.3 billion.
- Mortgage-backed securities were $1.898 trillion, down $187.9 billion y/y, so the mix has shifted toward Treasuries rather than shrinking overall.
- Loans were just $7.7 billion.
Liabilities and reserves
- Reserve balances: $3.03 trillion (+$81.6 billion w/w).
- Treasury General Account (the government’s cash account): $880.3 billion, down $68.4 billion w/w.
- Reverse repos: $329.5 billion, down $46.5 billion y/y, almost entirely foreign official accounts ($328.3 billion).
- Currency in circulation: $2.484 trillion.
The arithmetic
Reserves rose because supplying factors added $3.8 billion while absorbing factors fell $77.8 billion, mostly the TGA drop.
Two readings
Reserves look ample and the RRP buffer has shrunk, which points to less surplus cash parked at the Fed. But the weekly reserve gain leaned on a lower TGA, so it can move as the Treasury’s balance changes. We report the data as is and offer no rate or market call.
ストラテジスト総括:3指標の連関と来週の確認点

Connecting the Three Releases
Signal map
| Area | Latest fact | Direction |
|---|---|---|
| Labor (DOL) | Initial claims 197,000; four-week average 198,000 | Resilient |
| Energy (EIA) | WTI $97.89 (year ago $61.65) | Elevated cost |
| Liquidity (Fed) | Reserves $3.03 trillion (weekly avg) | Ample |
The three series do not point the same way. Low layoffs and ample reserves sit alongside high energy prices, so we describe the picture as mixed rather than forcing one narrative.
Two things to check, with numbers
- WTI to the pump. WTI rose $12.66 on the week (from $85.23 to $97.89). Retail regular gasoline slipped to $4.354 from $4.465, yet it is $1.23 above $3.124 a year ago. Energy is a core component of headline inflation measures in the US and in Japan alike.
- Reserves and the TGA. Reserves rose $81.6 billion while the Treasury General Account fell $68.4 billion. Year over year, the TGA is up $72.8 billion versus a $31.2 billion rise in reserves. The weekly gain therefore leaned on the TGA.
Supplementary model readings
Our weekly regime model sits in R0 for a fifth week. Two extended indicators, EIA total products supplied (Z=2.45, low) and Fed currency in circulation (Z=2.10, high), deviate from R0 norms but stay below the 3.0 alert level.
Calendar
The dates for the FOMC, payrolls, and CPI are not included in these materials. The DOL claims report and H.4.1 are published each Thursday. This post presents data and cross-readings only, not a market forecast.
Disclaimer: This article is for informational purposes only. All investment decisions are made solely at your own risk.