📺 Watch the Full Video Analysis
This article was automatically generated by the NFC Market Live AI analysis system. (Updated: 2026-09-09 08:58 JST)
📄 Primary Source
日本銀行
https://www.boj.or.jp/statistics/money/ms/ms2608.pdf
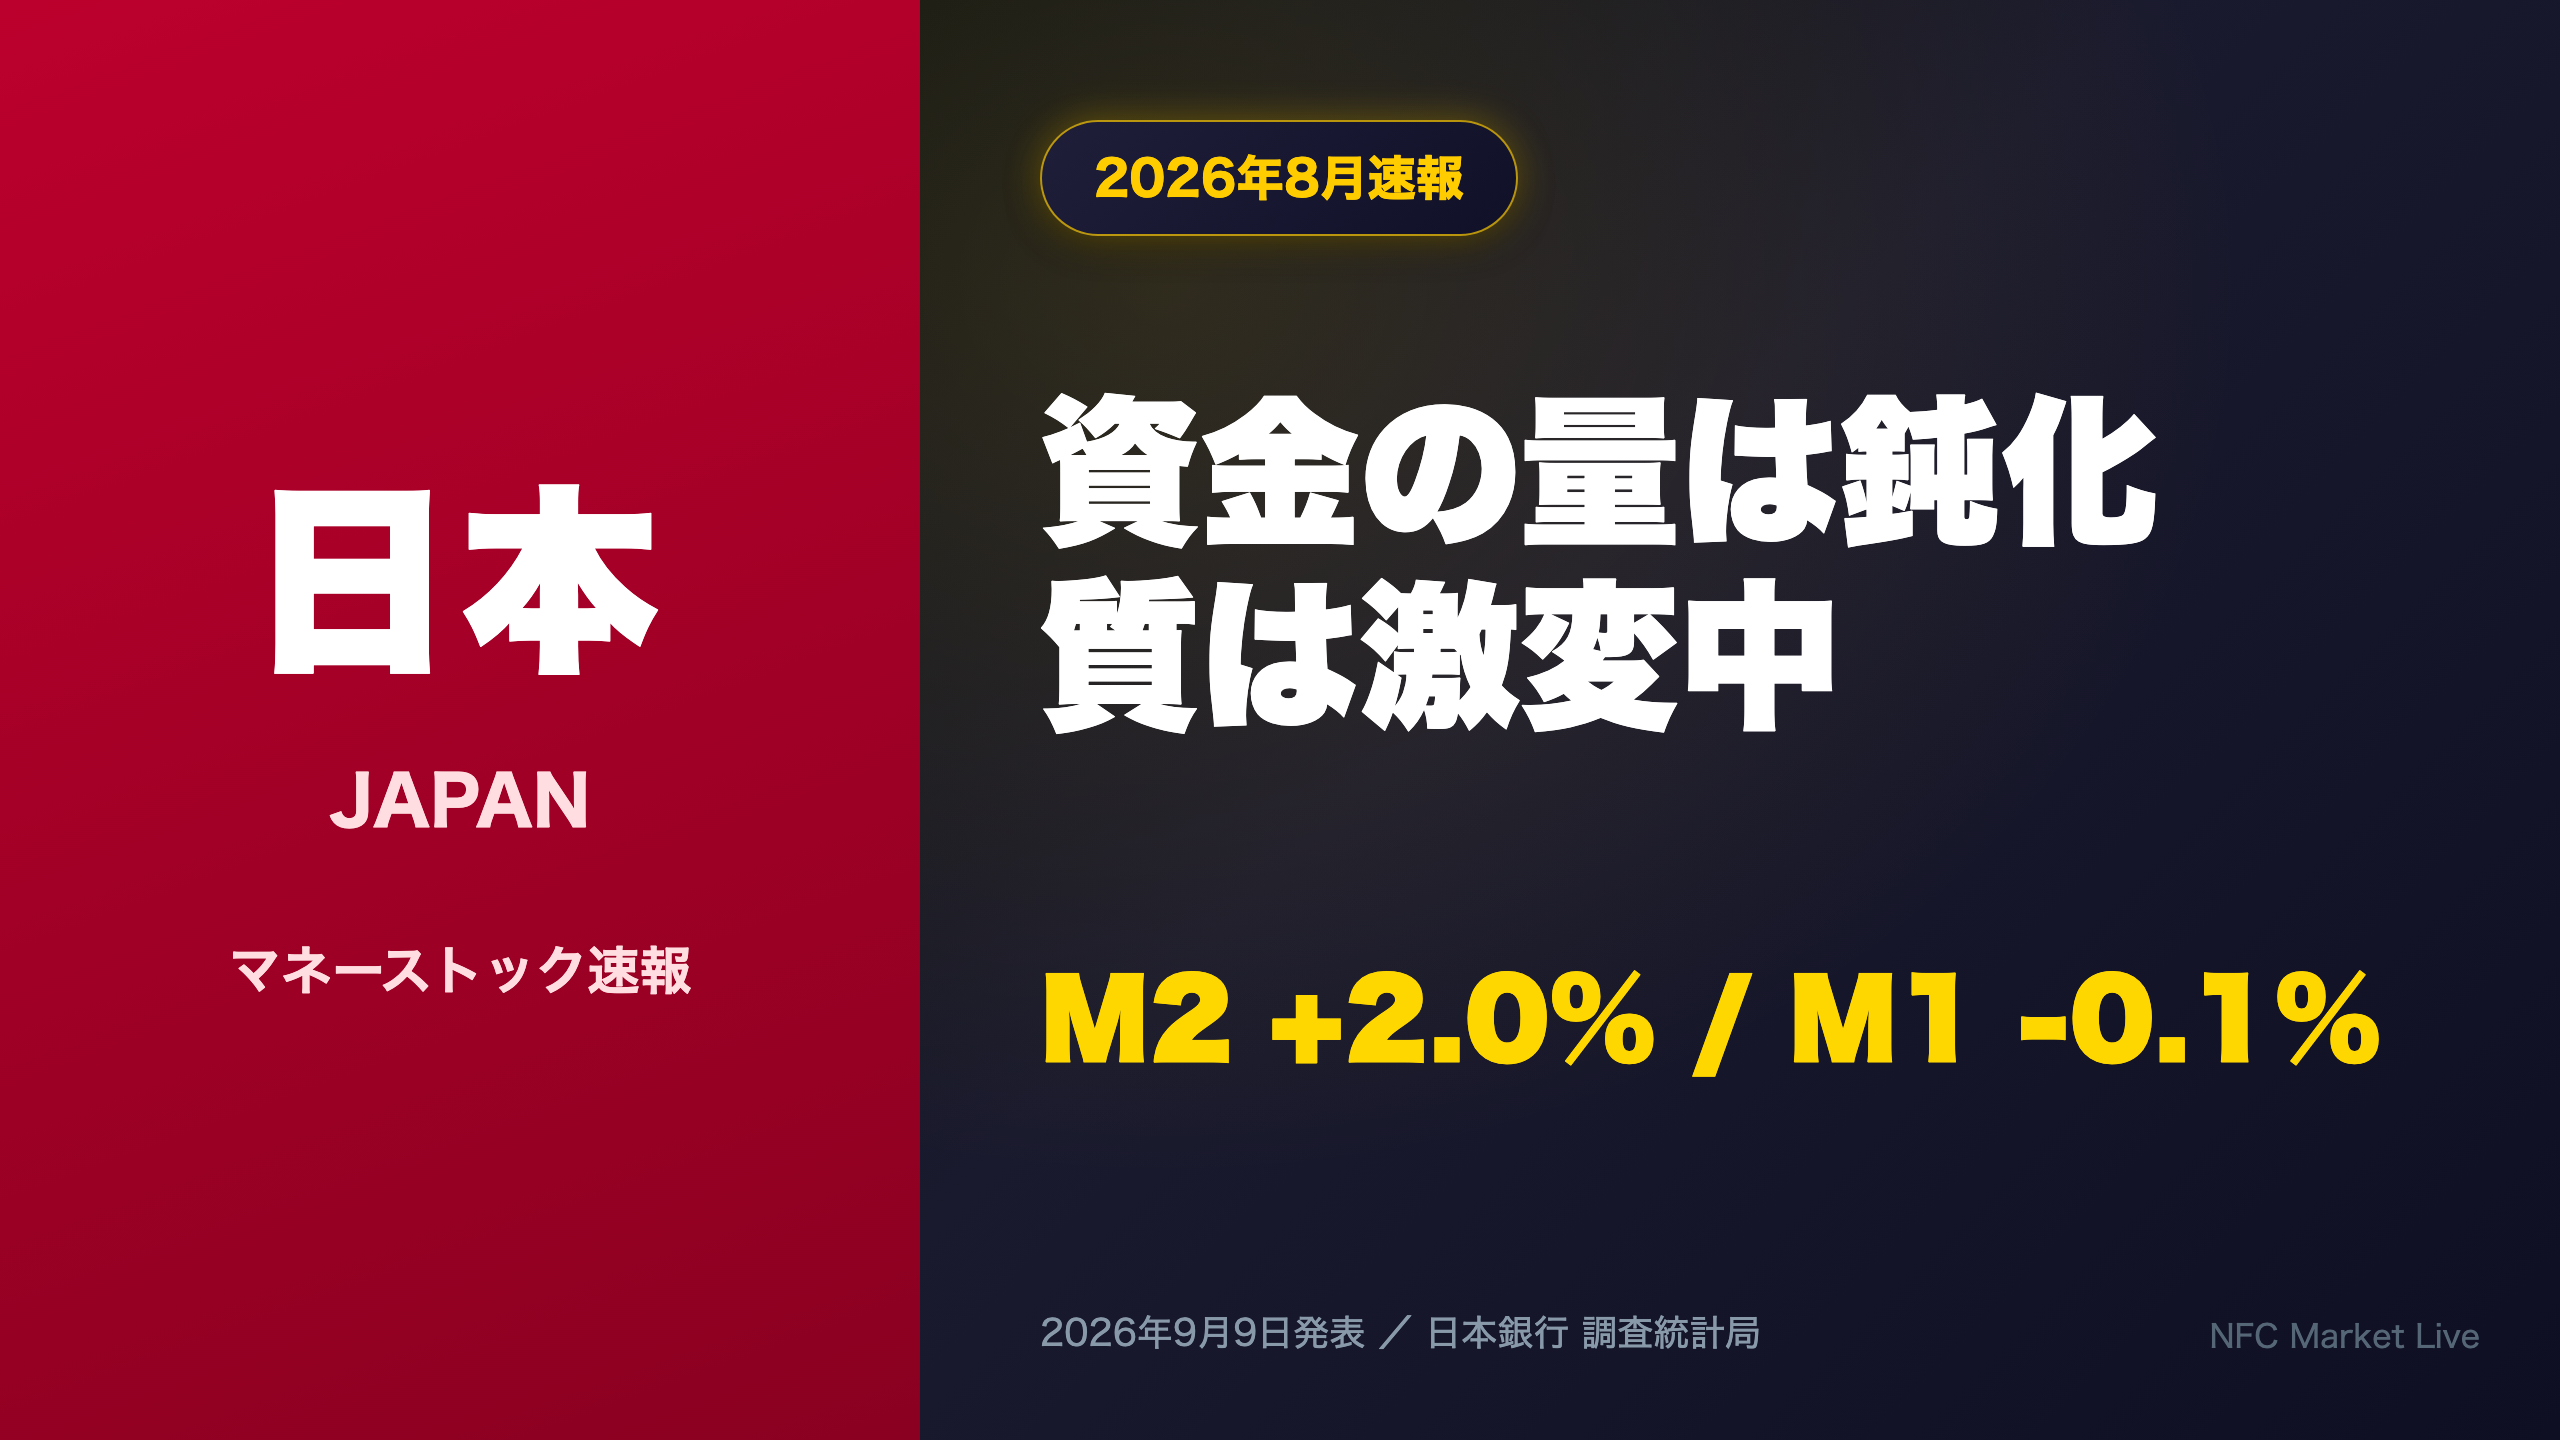
Deep dive into the Bank of Japan’s August 2026 Money Stock preliminary report.
📊 M2 grew +2.0% YoY, M3 +1.2% YoY — both slowing for a 4th straight month.
💰 Quasi-money (time deposits) held firm at +4.4%, while M1 (settlement deposits) turned negative at -0.1%.
📈 Broadly-defined liquidity stayed high at +4.4%, driven by investment trusts (+12.0%) and foreign bonds (+7.1%).
⚠️ CDs plunged -8.0% YoY.
We analyze what this means for BOJ policy normalization and the yen — with balanced, data-driven analysis.
資金の「量」は鈍化、「質」は激変
The Headline
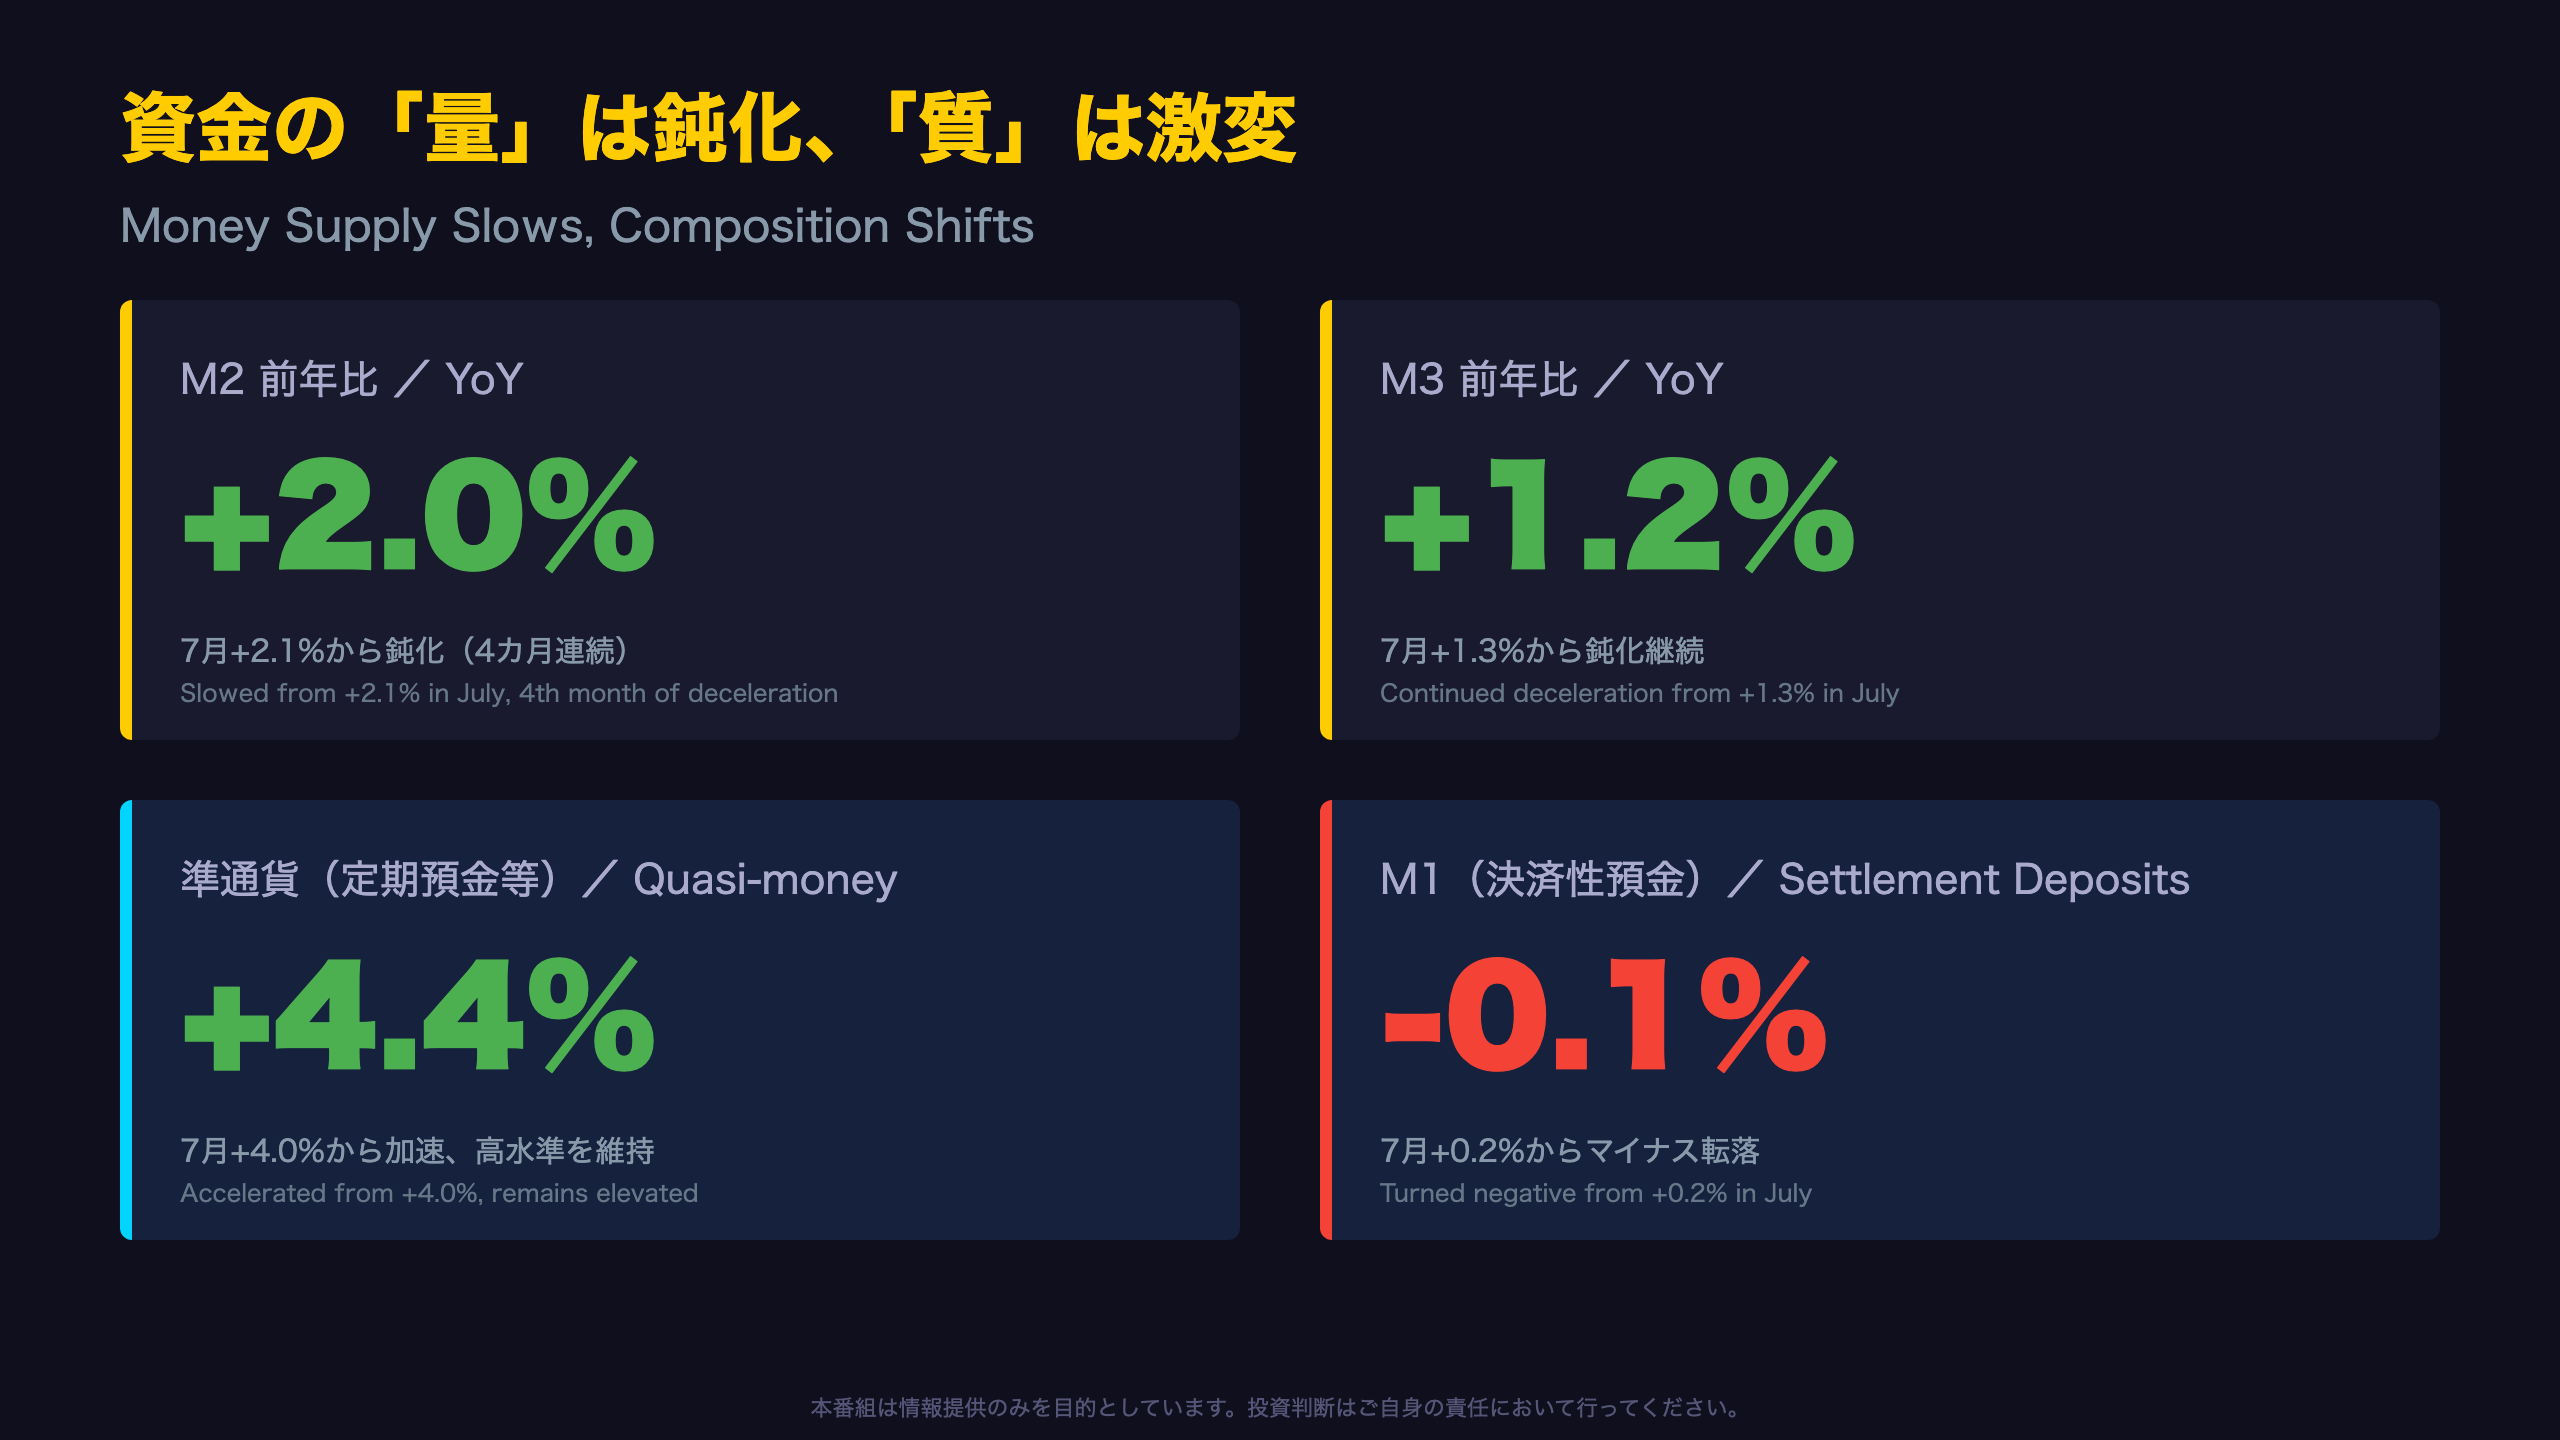
The most important signal in the Bank of Japan’s August 2026 Money Stock report isn’t just slower growth — it’s a shift in composition.
Key Figures
- M2: +2.0% YoY (July: +2.1%)
- M3: +1.2% YoY (July: +1.3%)
- M1 (settlement deposits): -0.1% (July: +0.2%) — turned negative
- Quasi-money (time deposits): +4.4% (July: +4.0%)
Understanding Japan’s Money Stock Framework
For readers unfamiliar with Japanese monetary statistics: the BOJ publishes M2, M3, and L (broadly-defined liquidity) monthly. Unlike the US Fed’s M2 (which excludes large time deposits differently), Japan’s M3 includes all deposit-taking institutions including credit unions and agricultural cooperatives, making it a broader gauge of domestic liquidity than the US equivalent.
Why This Matters
The swing of M1 into negative territory — the first such move since March 2026 — suggests households and firms are moving liquid, low-yield cash into interest-bearing time deposits, a plausible response to Japan’s rising rate environment. This is a level-B inference: multiple indicators (rising quasi-money, falling M1) point the same direction, though we stop short of declaring a structural shift from a single month’s data.
Market Angle
For foreign investors, decelerating M2/M3 growth combined with resilient time-deposit growth is consistent with a central bank whose tightening is beginning to bite at the margin — a data point worth watching alongside JGB yields and BOJ rate guidance ahead of the next policy meeting.
M2・M3、4カ月連続の伸び鈍化
A Clear Peak-and-Decline Pattern
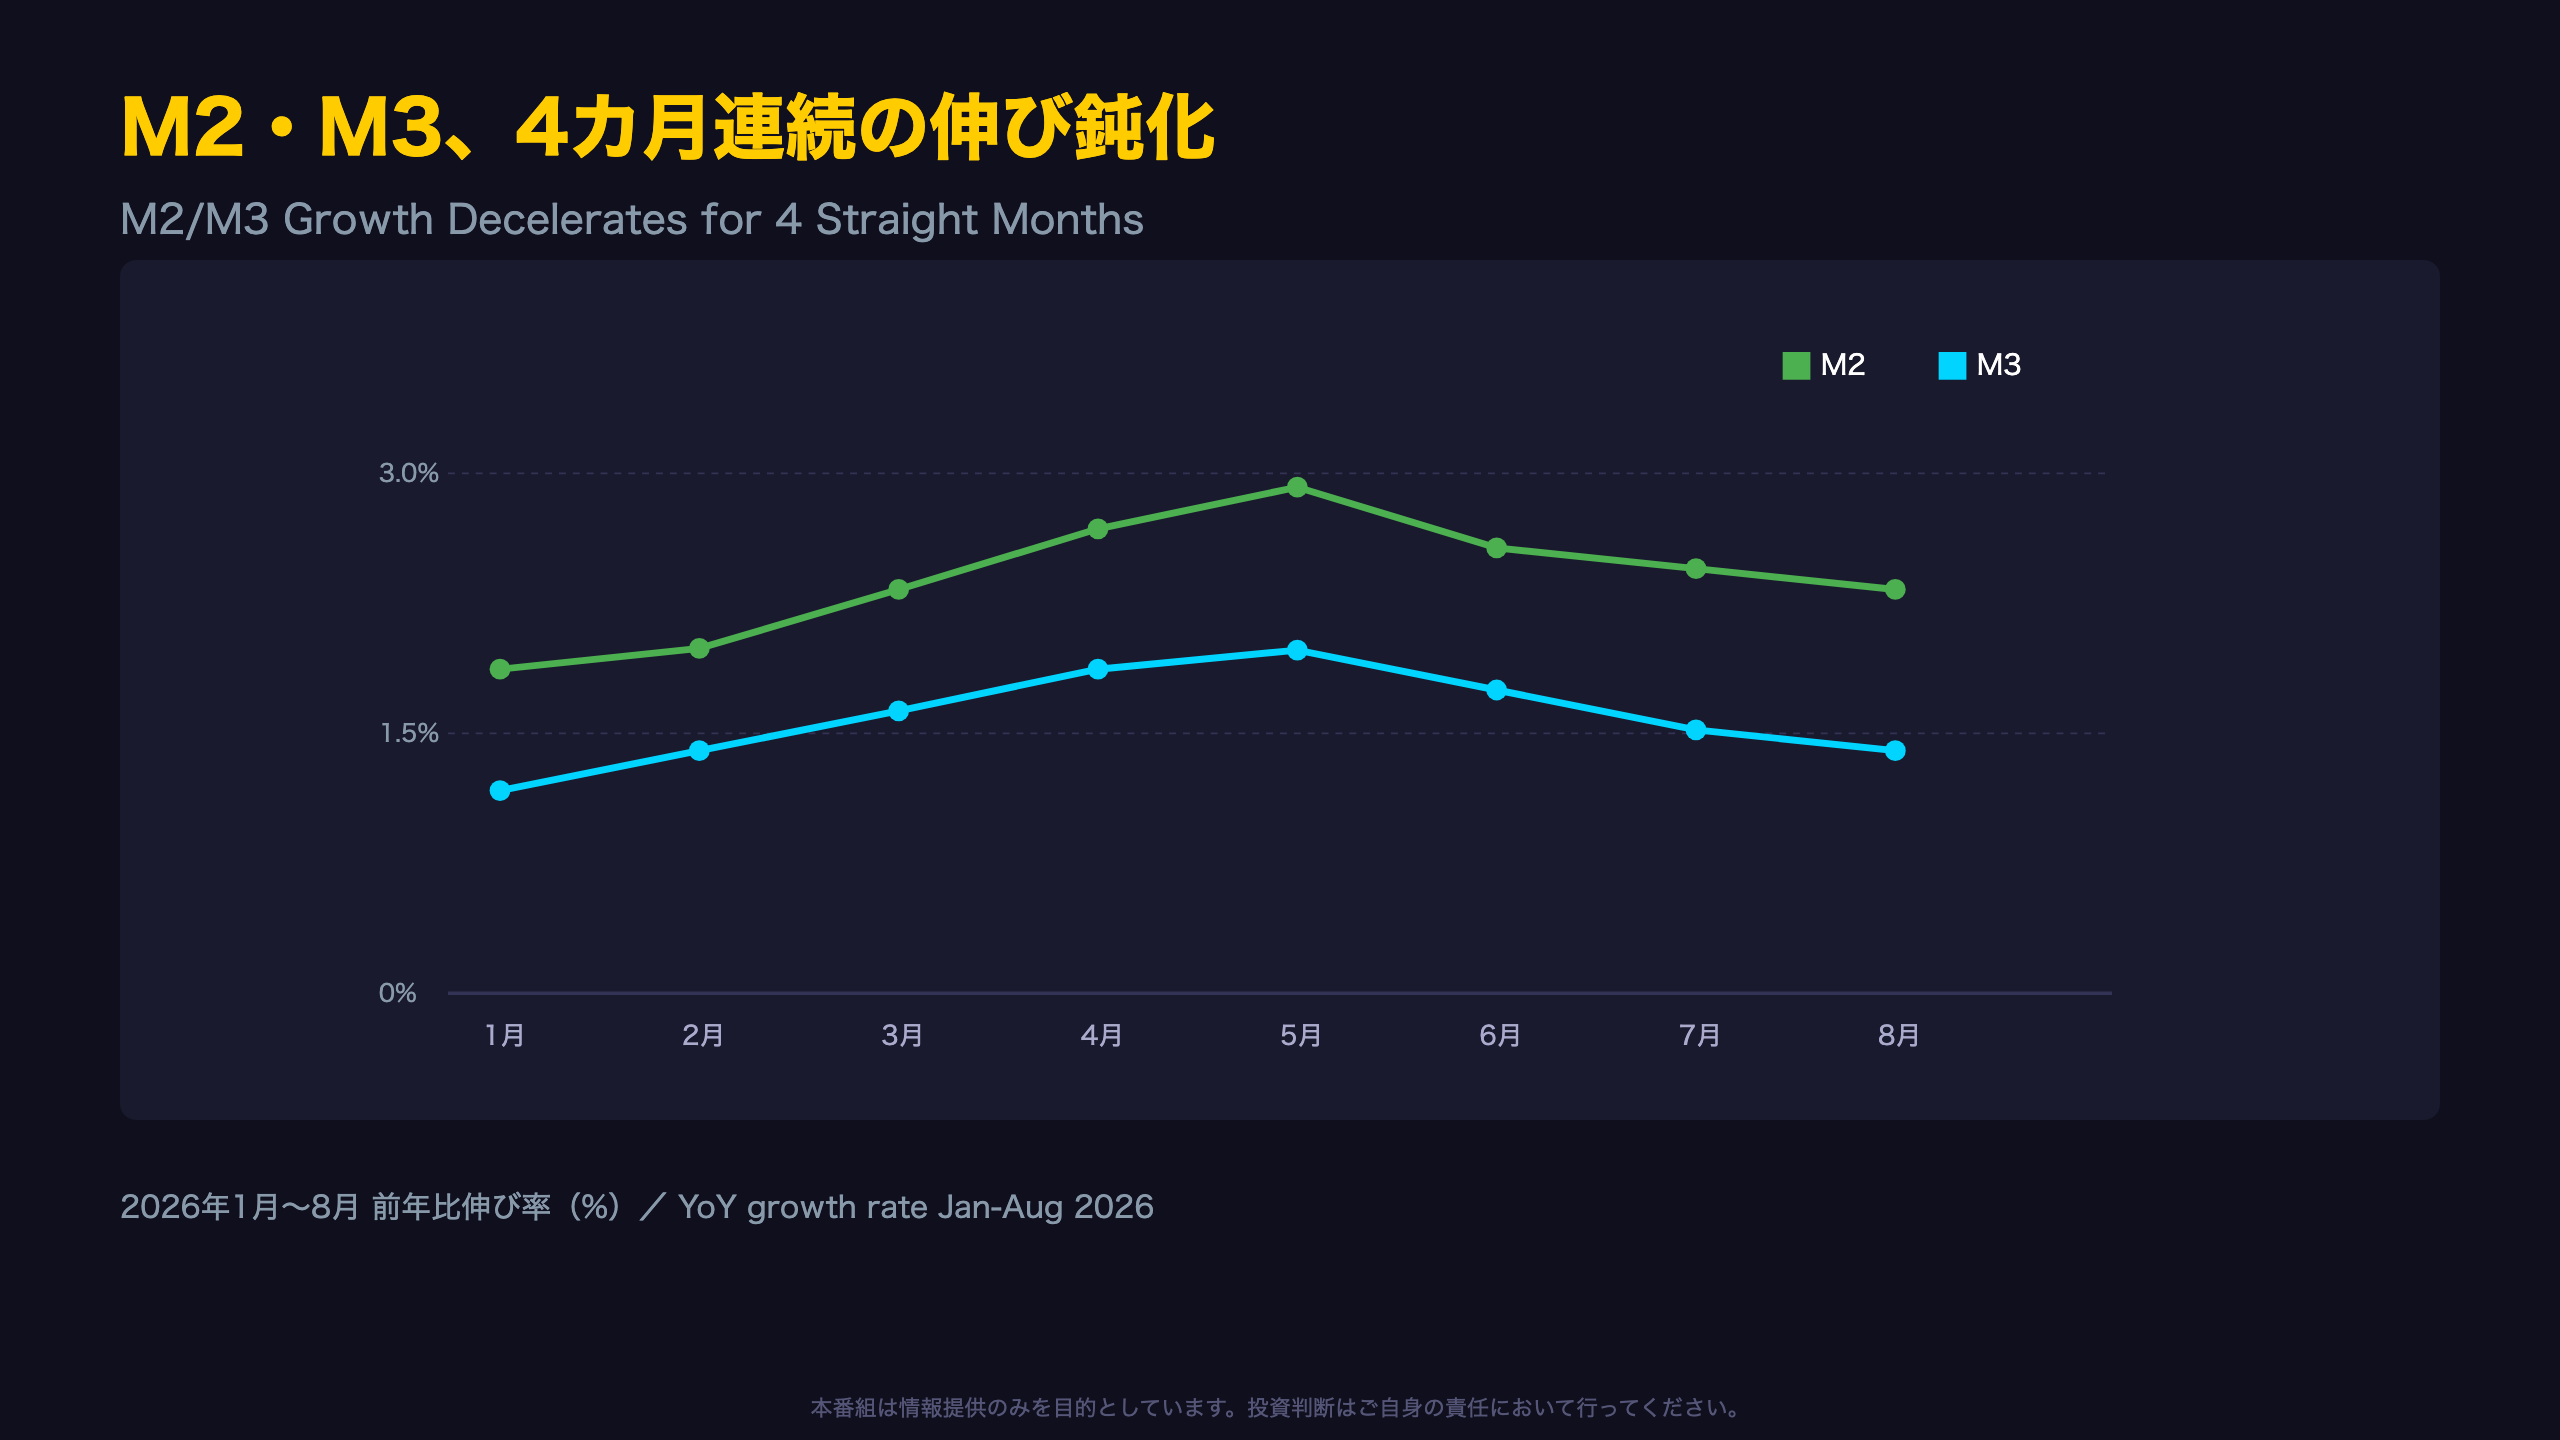
Tracking Japan’s money supply growth month by month in 2026 reveals a distinct hump-shaped trajectory.
| Month | M2 (YoY) | M3 (YoY) |
|---|---|---|
| Jan | +1.6% | +1.0% |
| Feb | +1.7% | +1.2% |
| Mar | +2.0% | +1.4% |
| Apr | +2.3% | +1.6% |
| May | +2.5% (peak) | +1.7% (peak) |
| Jun | +2.2% | +1.5% |
| Jul | +2.1% | +1.3% |
| Aug | +2.0% | +1.2% |
Four consecutive months of deceleration since the May peak is a pattern robust enough to call a trend, not just monthly noise (Level-B inference).
Context for International Readers
Japan’s M2 definition differs from the US Federal Reserve’s: it includes deposits at all deposit-taking institutions plus CDs, and BOJ tracks it primarily as a year-on-year gauge rather than the Fed’s seasonally-adjusted level approach. A 2.0% YoY M2 growth rate in Japan is historically modest — for comparison, US M2 growth ran near zero or negative through much of 2023-2024 during the Fed’s tightening cycle, making Japan’s trajectory relatively more accommodative even as it slows.
Historical Reference
Full-year M2 growth averaged +1.7% in 2024 and +1.2% in 2025. The 2026 acceleration into spring has now partially reversed, suggesting the initial re-acceleration may have been transitory.
What to Watch
Whether September data extends the deceleration — or stabilizes — will be a key input for gauging the pace of BOJ policy normalization.
決済性資金から定期性資金へのシフト
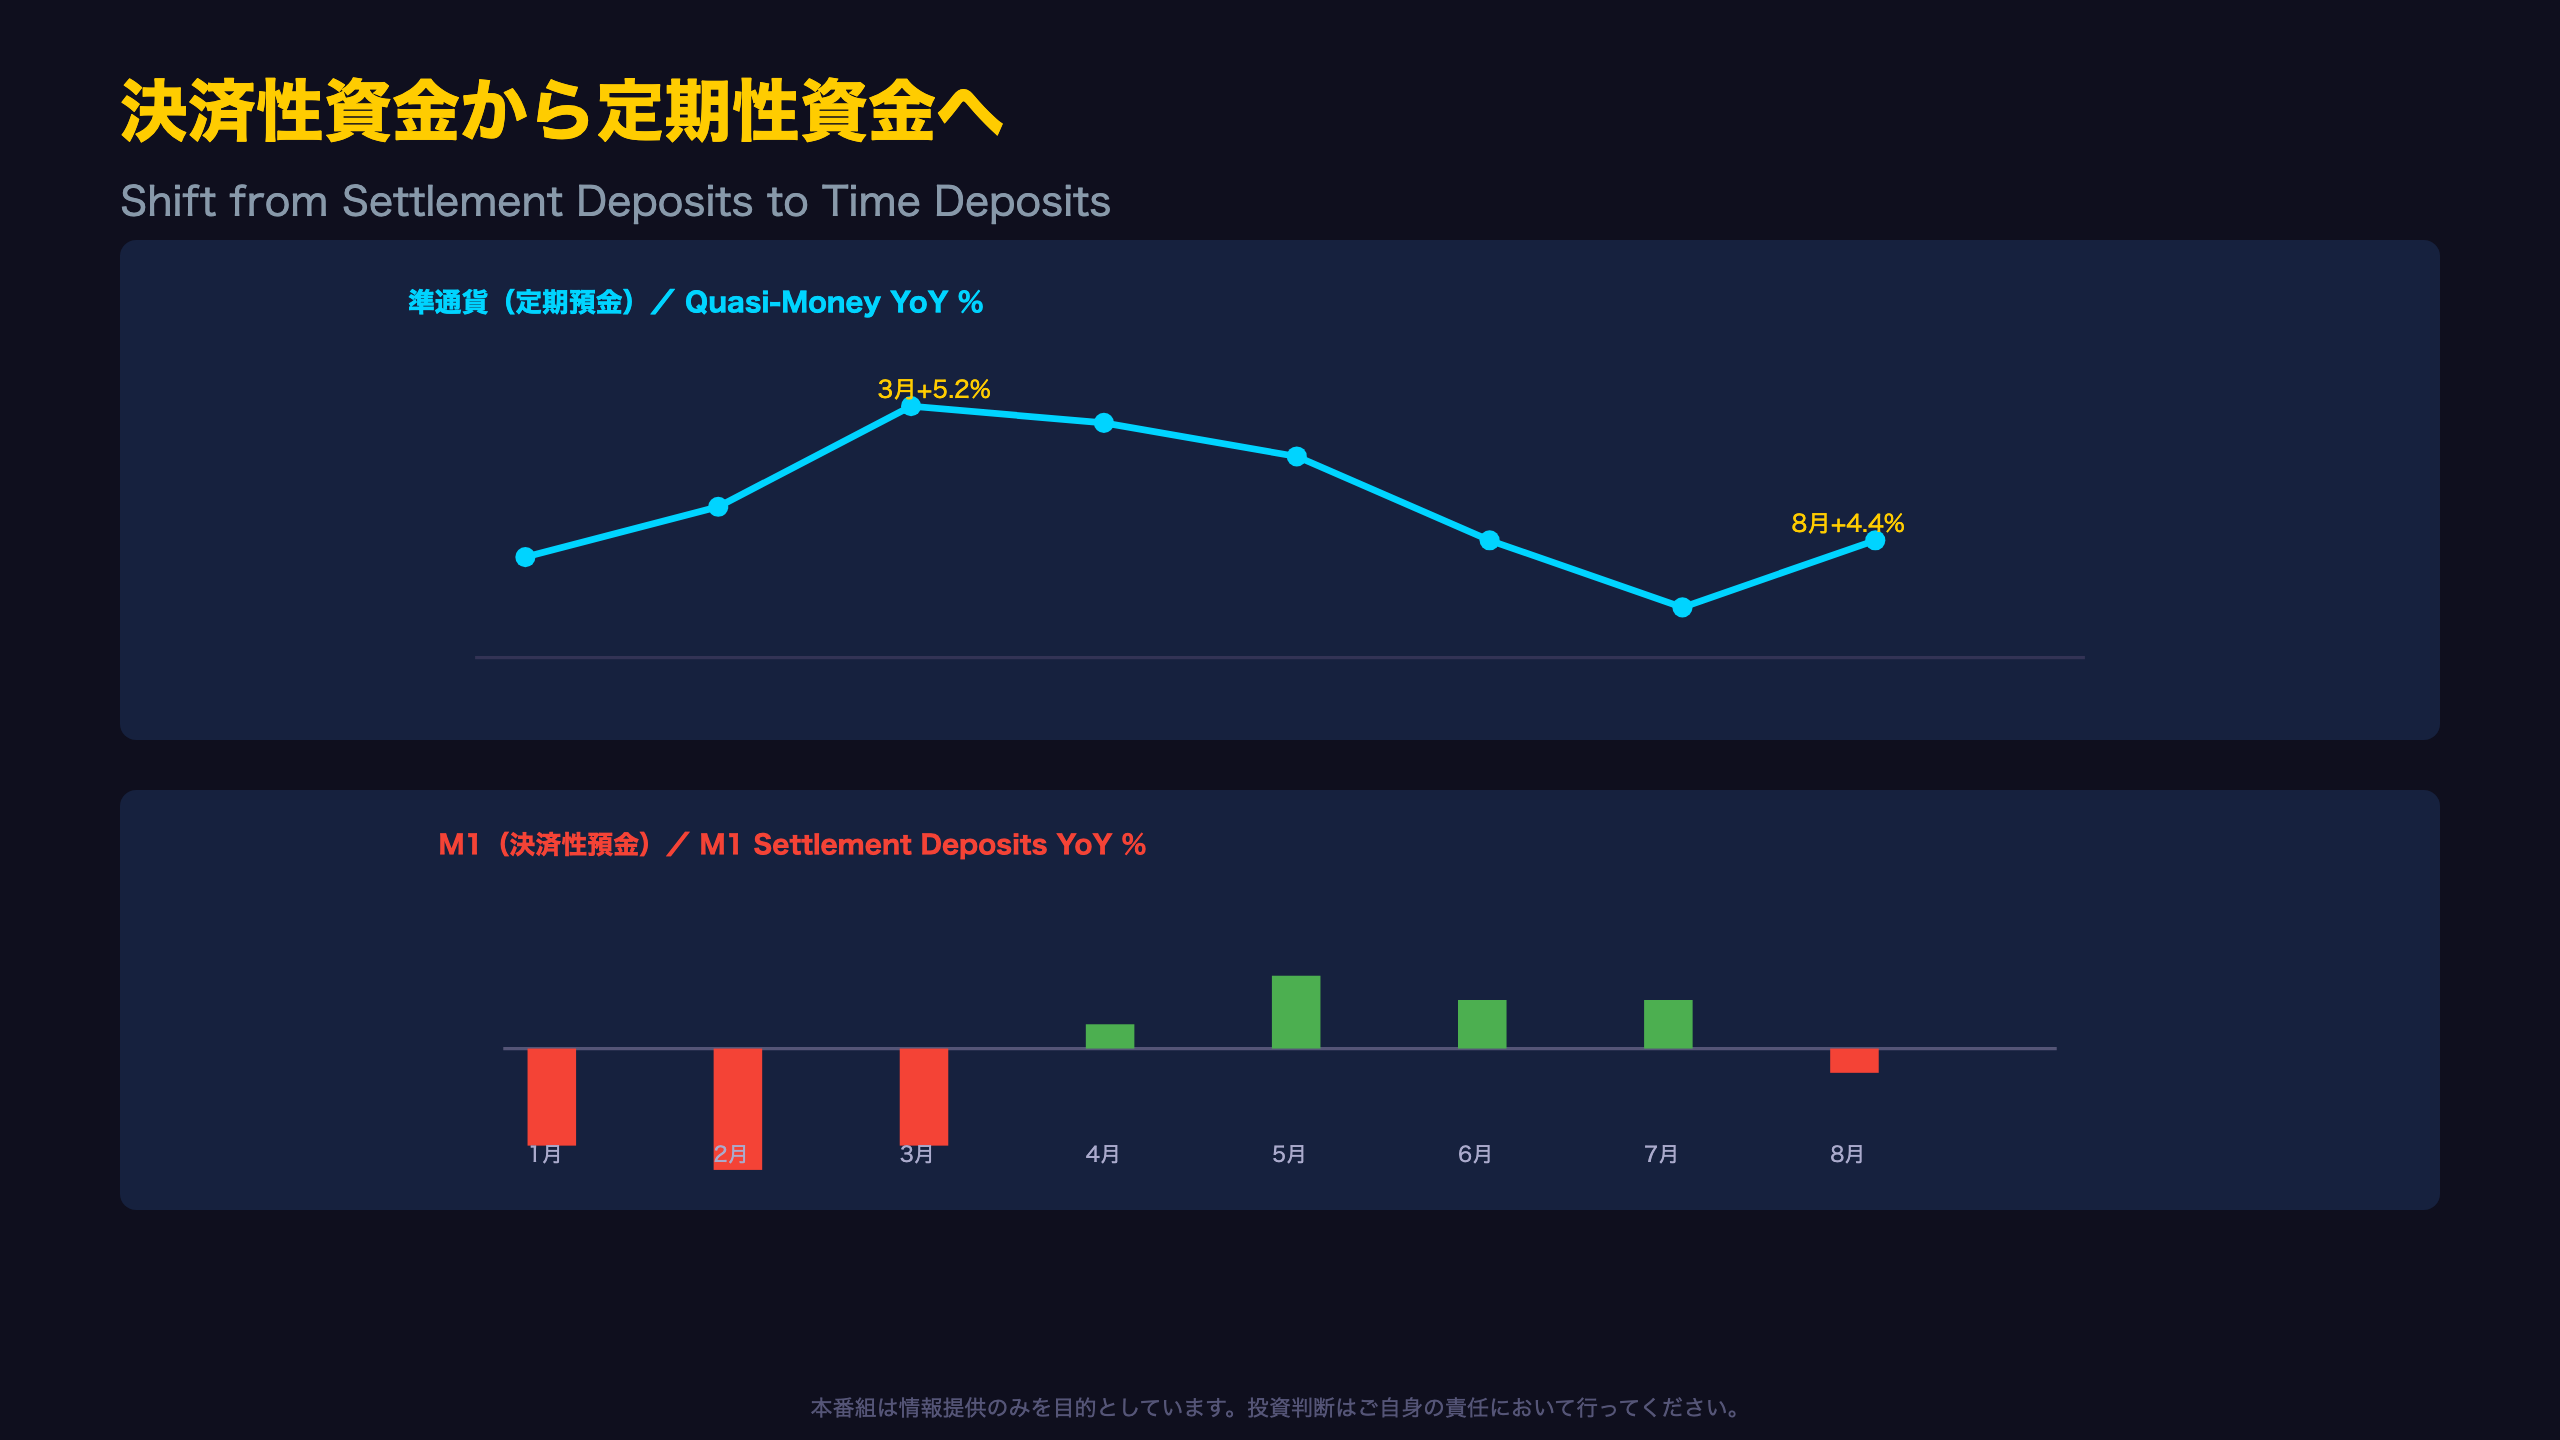
M1 and Quasi-Money: Diverging Paths
The most intriguing feature of the August data is the opposite trajectories of settlement deposits (M1) and time deposits (quasi-money).
| Month | M1 | Quasi-Money | Cash |
|---|---|---|---|
| Jan | -0.4% | +4.3% | -1.1% |
| Mar | -0.4% | +5.2% (peak) | -1.1% |
| May | +0.3% (peak) | +4.9% | -1.0% |
| Jun | +0.2% | +4.4% | -1.2% |
| Jul | +0.2% | +4.0% | -1.2% |
| Aug | -0.1% | +4.4% | -1.3% |
A Note on Revisions
The BOJ report flags multiple June-July series with \”r\” (revised) tags, meaning current figures could still be adjusted in later releases — a standard feature of Japan’s preliminary statistics that international readers should factor into their confidence level.
Two Competing Interpretations
The bullish read: The shift toward time deposits signals that BOJ rate hikes are finally reaching household behavior — a textbook sign that monetary policy transmission is working, similar to how US savers shifted into money-market funds as the Fed hiked in 2022-2023.
The cautious read: A negative M1 combined with persistently falling cash in circulation could also reflect softening transactional demand — i.e., weaker underlying consumption or business activity — though this remains a single-month observation (Level-C inference) and should not be treated as confirmed.
Distinguishing between these two readings will require at least two to three more months of data.
広義流動性を牽引する市場性資産
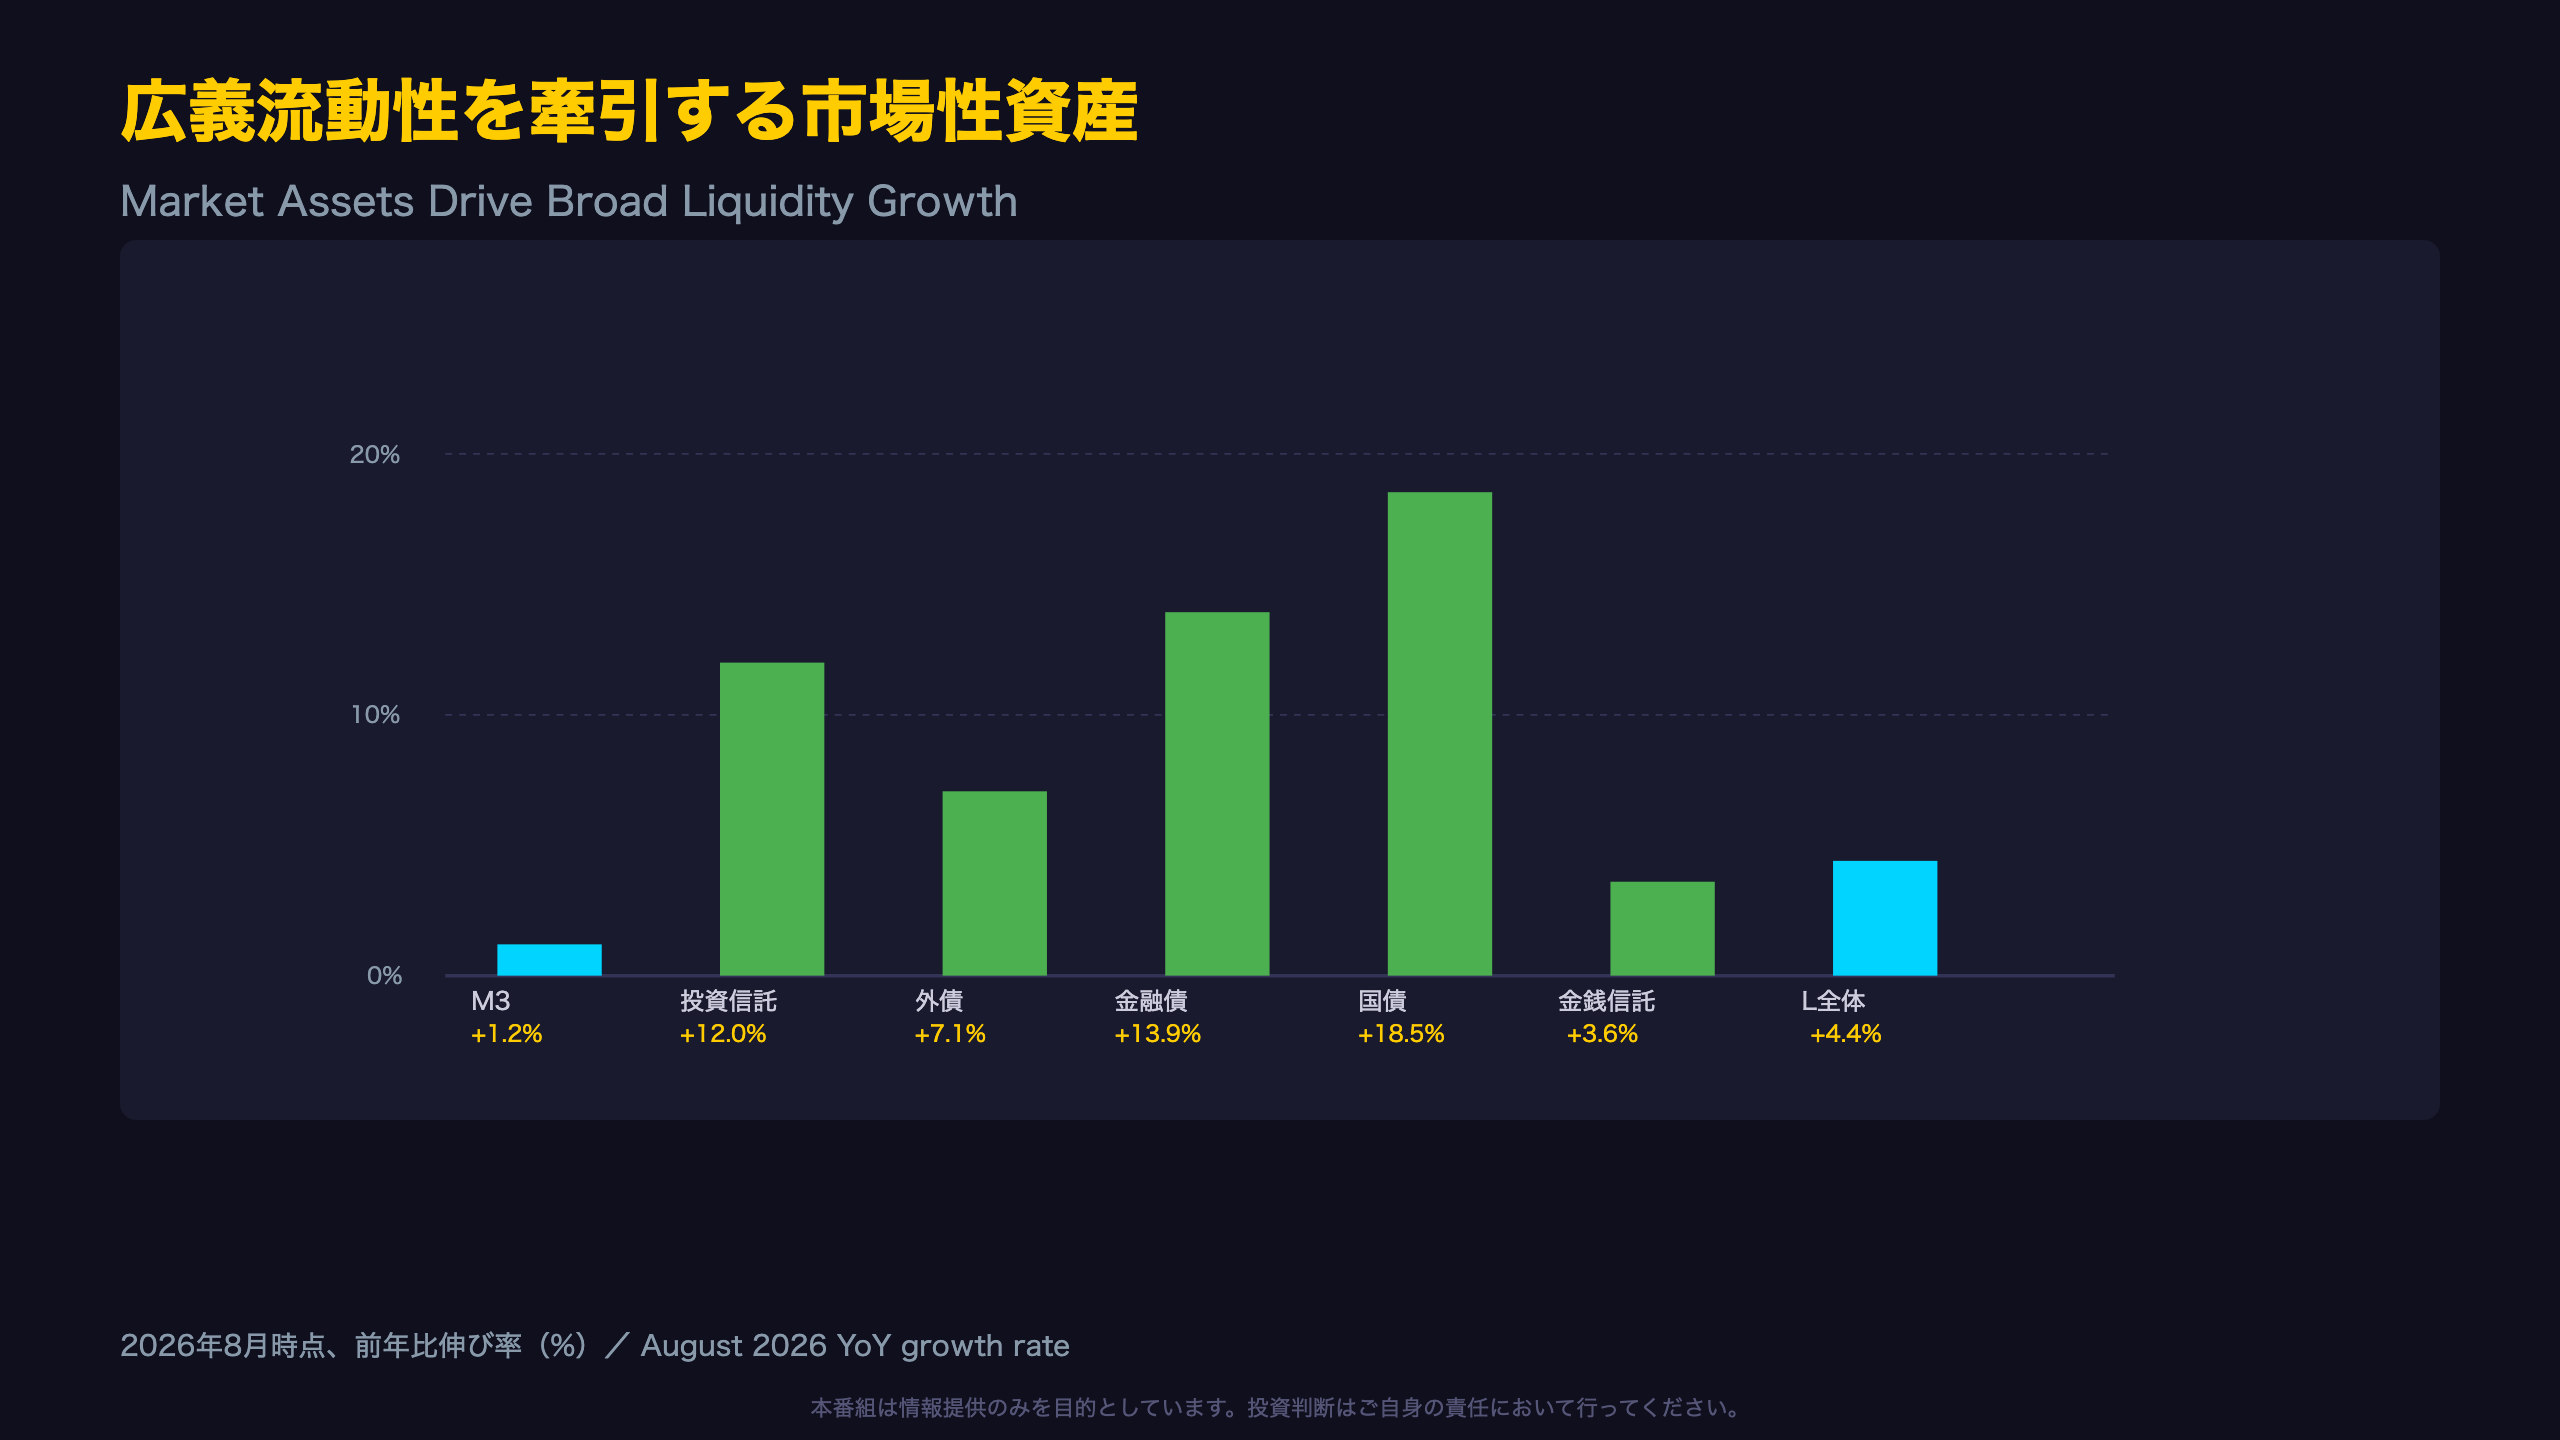
Breaking Down Broad Liquidity (L)
L, or broadly-defined liquidity, is the BOJ’s widest money gauge, encompassing M3 plus pecuniary trusts, investment trusts, bank debentures, commercial paper, government securities, and foreign bonds. In August, growth outside of M3 dramatically outpaced M3 itself.
| Component | Aug YoY | Jul YoY |
|---|---|---|
| M3 | +1.2% | +1.3% |
| Investment Trusts | +12.0% | +12.6% |
| Foreign Bonds | +7.1% | +6.5% |
| Bank Debentures | +13.9% | +13.1% |
| Government Securities | +18.5% | +18.9% (r) |
| Pecuniary Trusts | +3.6% | +3.2% (r) |
| Total L | +4.4% | +4.5% |
Context: Japan’s \”From Savings to Investment\” Policy
For readers unfamiliar with Japanese policy debates: successive Japanese governments have promoted a shift of the nation’s roughly \”savings-heavy\” household balance sheets toward investment products (similar in spirit to encouraging 401(k)-style participation in the US). The 12.0% growth in investment trusts is consistent with this multi-year policy push, and the fact that it appears alongside rising foreign bond holdings strengthens the case for a genuine — not just seasonal — reallocation trend (Level-B inference).
A Caveat on Government Securities
The standout 18.5% YoY growth in government securities holdings should be read cautiously, as base effects and issuance patterns can distort single-month readings (Level-C).
FX Transmission Channel
Rising foreign bond holdings represent capital outflow via outward portfolio investment, a channel that can theoretically add modest depreciation pressure on the yen — though this must be weighed against interest-rate differentials and other larger FX drivers, not treated in isolation.
CD急減速と政策・市場へのインプリケーション
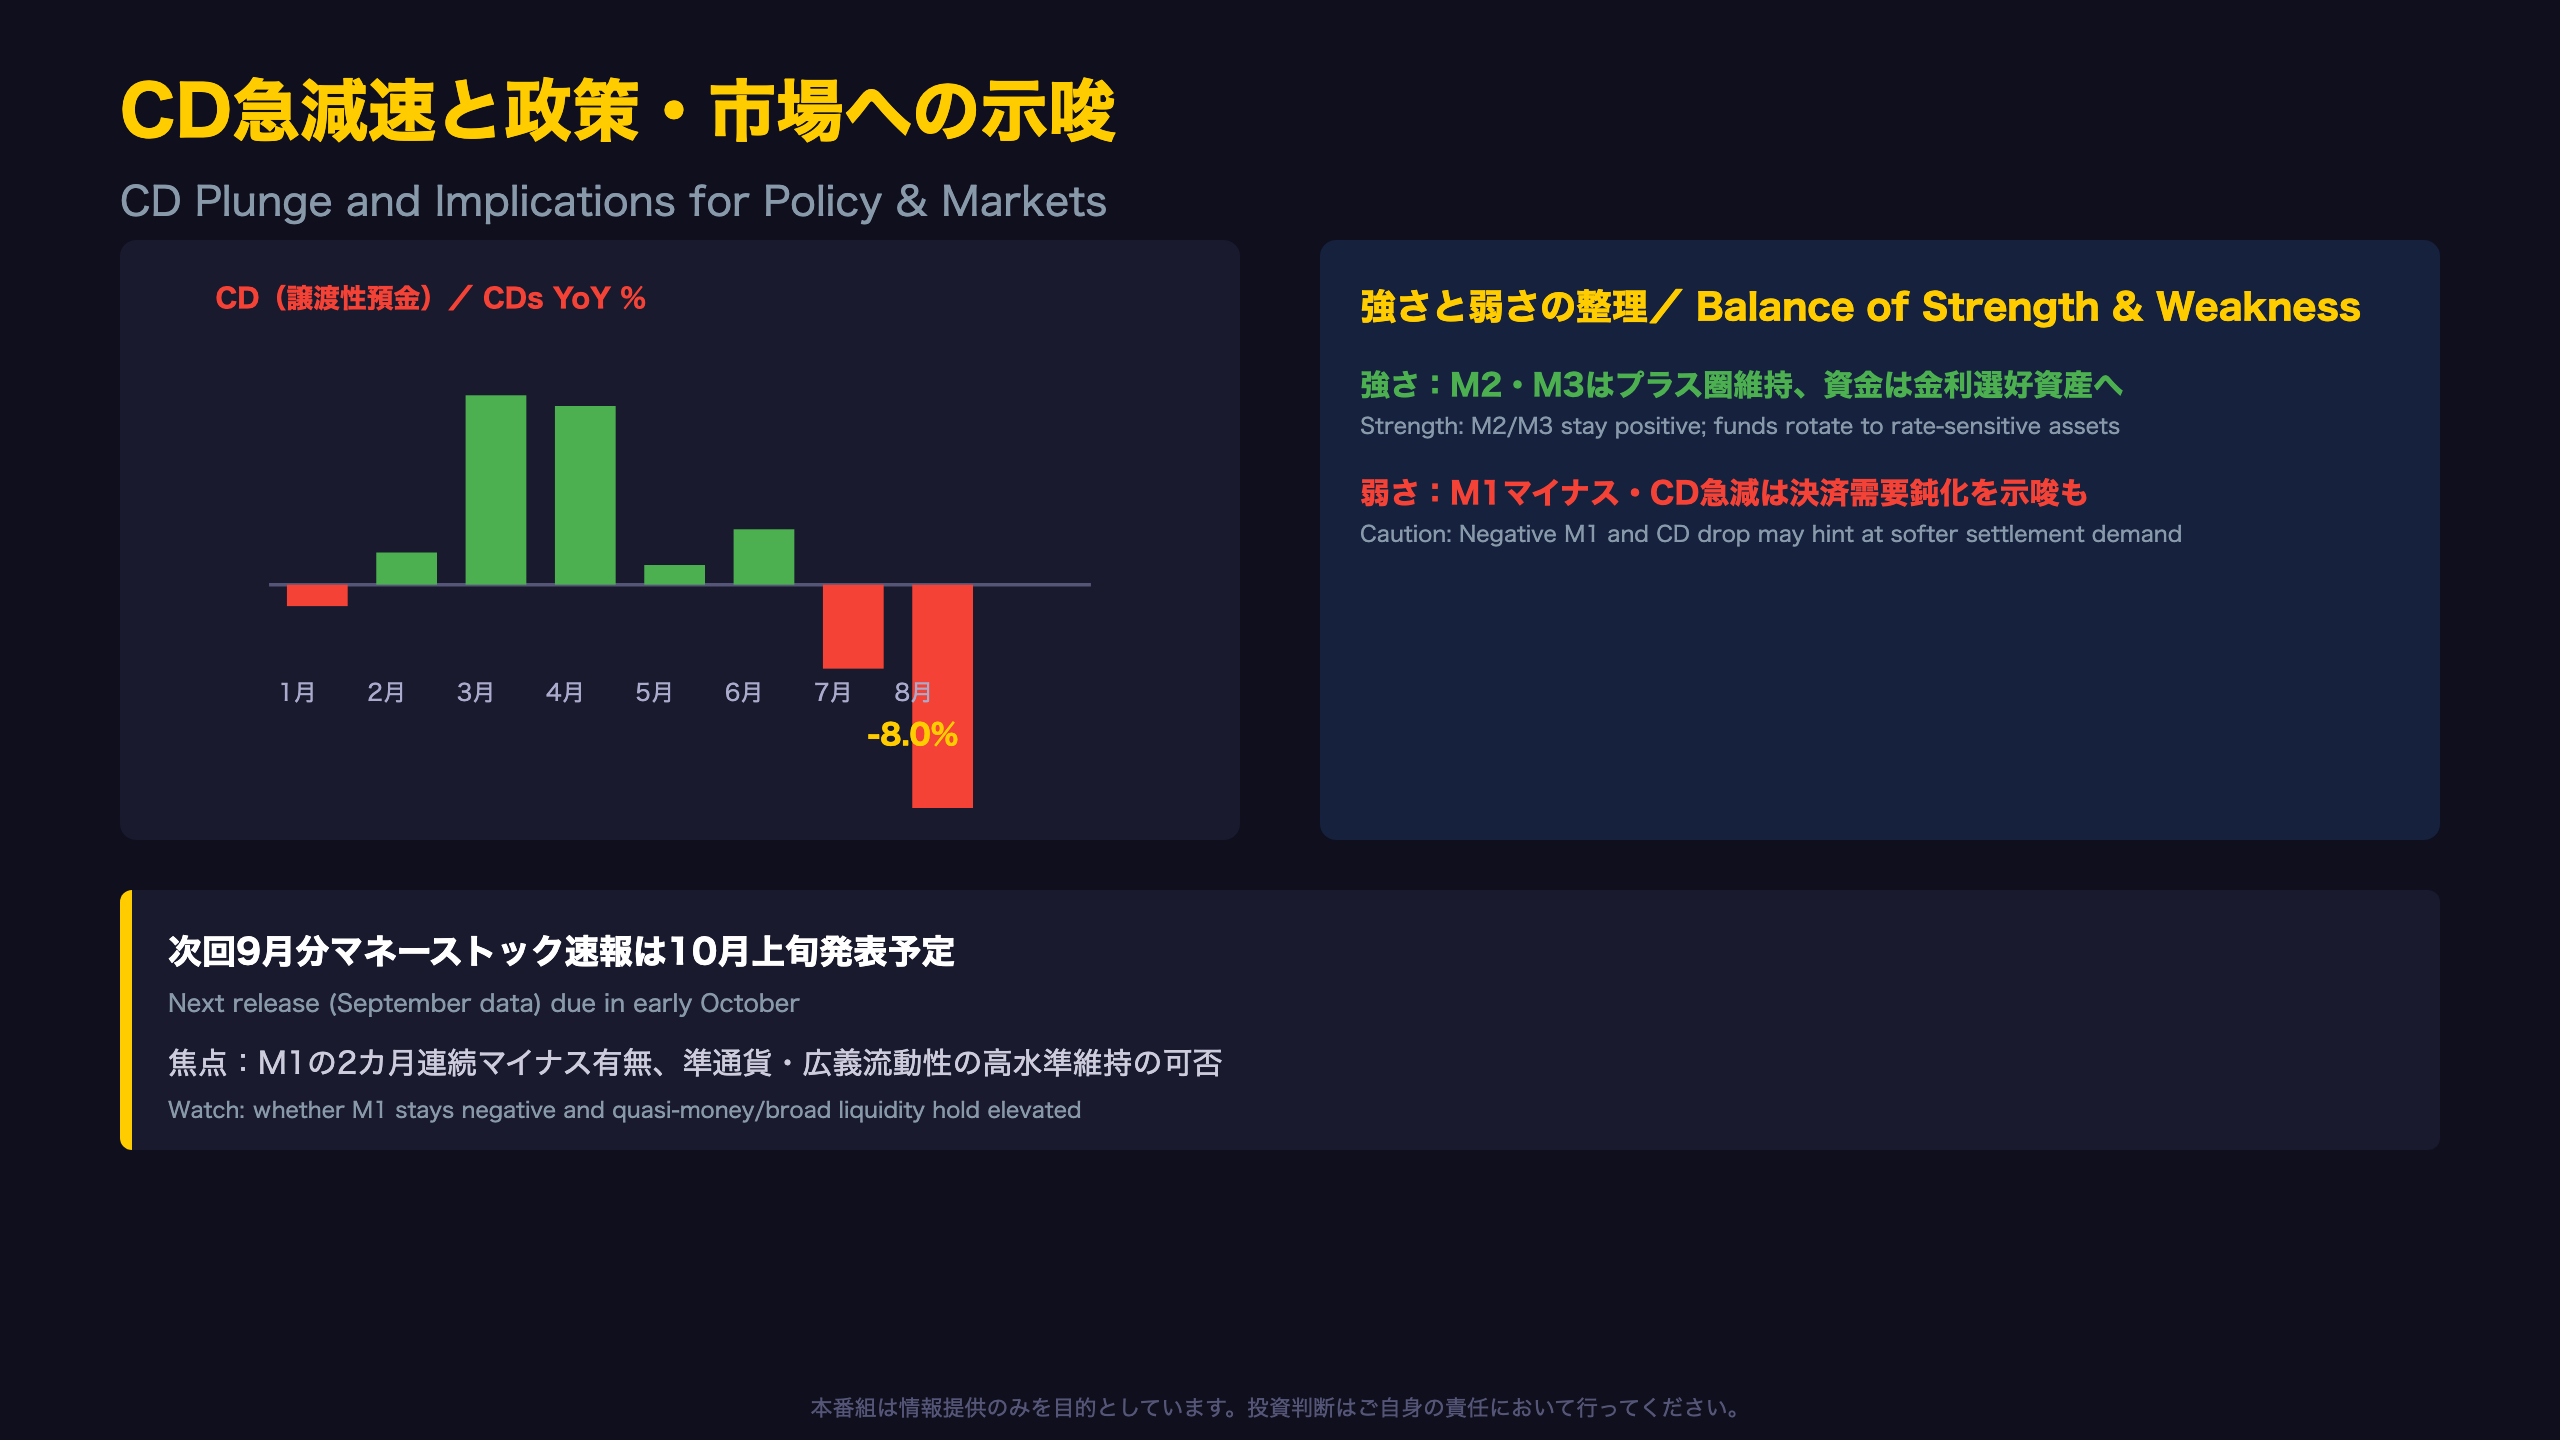
Interpreting the CD Plunge
Certificates of deposit fell 8.0% year-on-year in August, a sharp deterioration from July’s -3.0%. Looking back over the past year, the CD series has swung wildly: -6.7% (Jul 2025) → +1.2% (Jan 2026) → +6.8% (Mar 2026) → -8.0% (Aug 2026).
As the underlying data itself illustrates, CDs are a market-based funding instrument that reacts sensitively to short-term funding conditions and market rates at financial institutions — making them one of the more volatile series in the money stock report.
Given this volatility, a single month’s sharp CD decline should be treated as a Level-C observation (single indicator, single month) rather than evidence of a structural tightening in bank funding.
Balanced Assessment: Strengths and Weaknesses
Signs of resilience
– M2 and M3 remain solidly positive — money supply is decelerating, not contracting
– Strong growth in time deposits, investment trusts, and foreign bonds suggests households and firms are adapting constructively to a higher-rate environment, a healthy sign of monetary transmission
– Broad liquidity (L) remains elevated at +4.4%
Points of caution
– The negative M1 print and ongoing decline in cash in circulation could reflect softening transactional/settlement demand
– The CD plunge suggests changing funding dynamics at financial institutions, though based on one volatile month
– Four consecutive months of M2/M3 deceleration is becoming an established trend, not just noise
For Global Investors
Unlike the Fed’s balance-sheet-driven QT framework, the BOJ’s money stock trends offer a more indirect read on policy transmission. Slowing M2/M3 growth alongside resilient time deposits is broadly consistent with a central bank whose rate hikes are gradually taking hold — a data point worth tracking alongside JGB yields and USD/JPY ahead of the next BOJ policy meeting. The next Money Stock release, covering September data, is due in early October.
Disclaimer: This article is for informational purposes only. All investment decisions are made solely at your own risk.