📺 Watch the Full Video Analysis
This article was automatically generated by the NFC Market Live AI analysis system. (Updated: 2026-09-11 11:55 JST)
📄 Primary Source
日本銀行
https://www.boj.or.jp/statistics/pi/cgpi_release/cgpi2608.pdf
Deep dive into Japan’s August 2026 Corporate Goods Price Index (CGPI) 📊
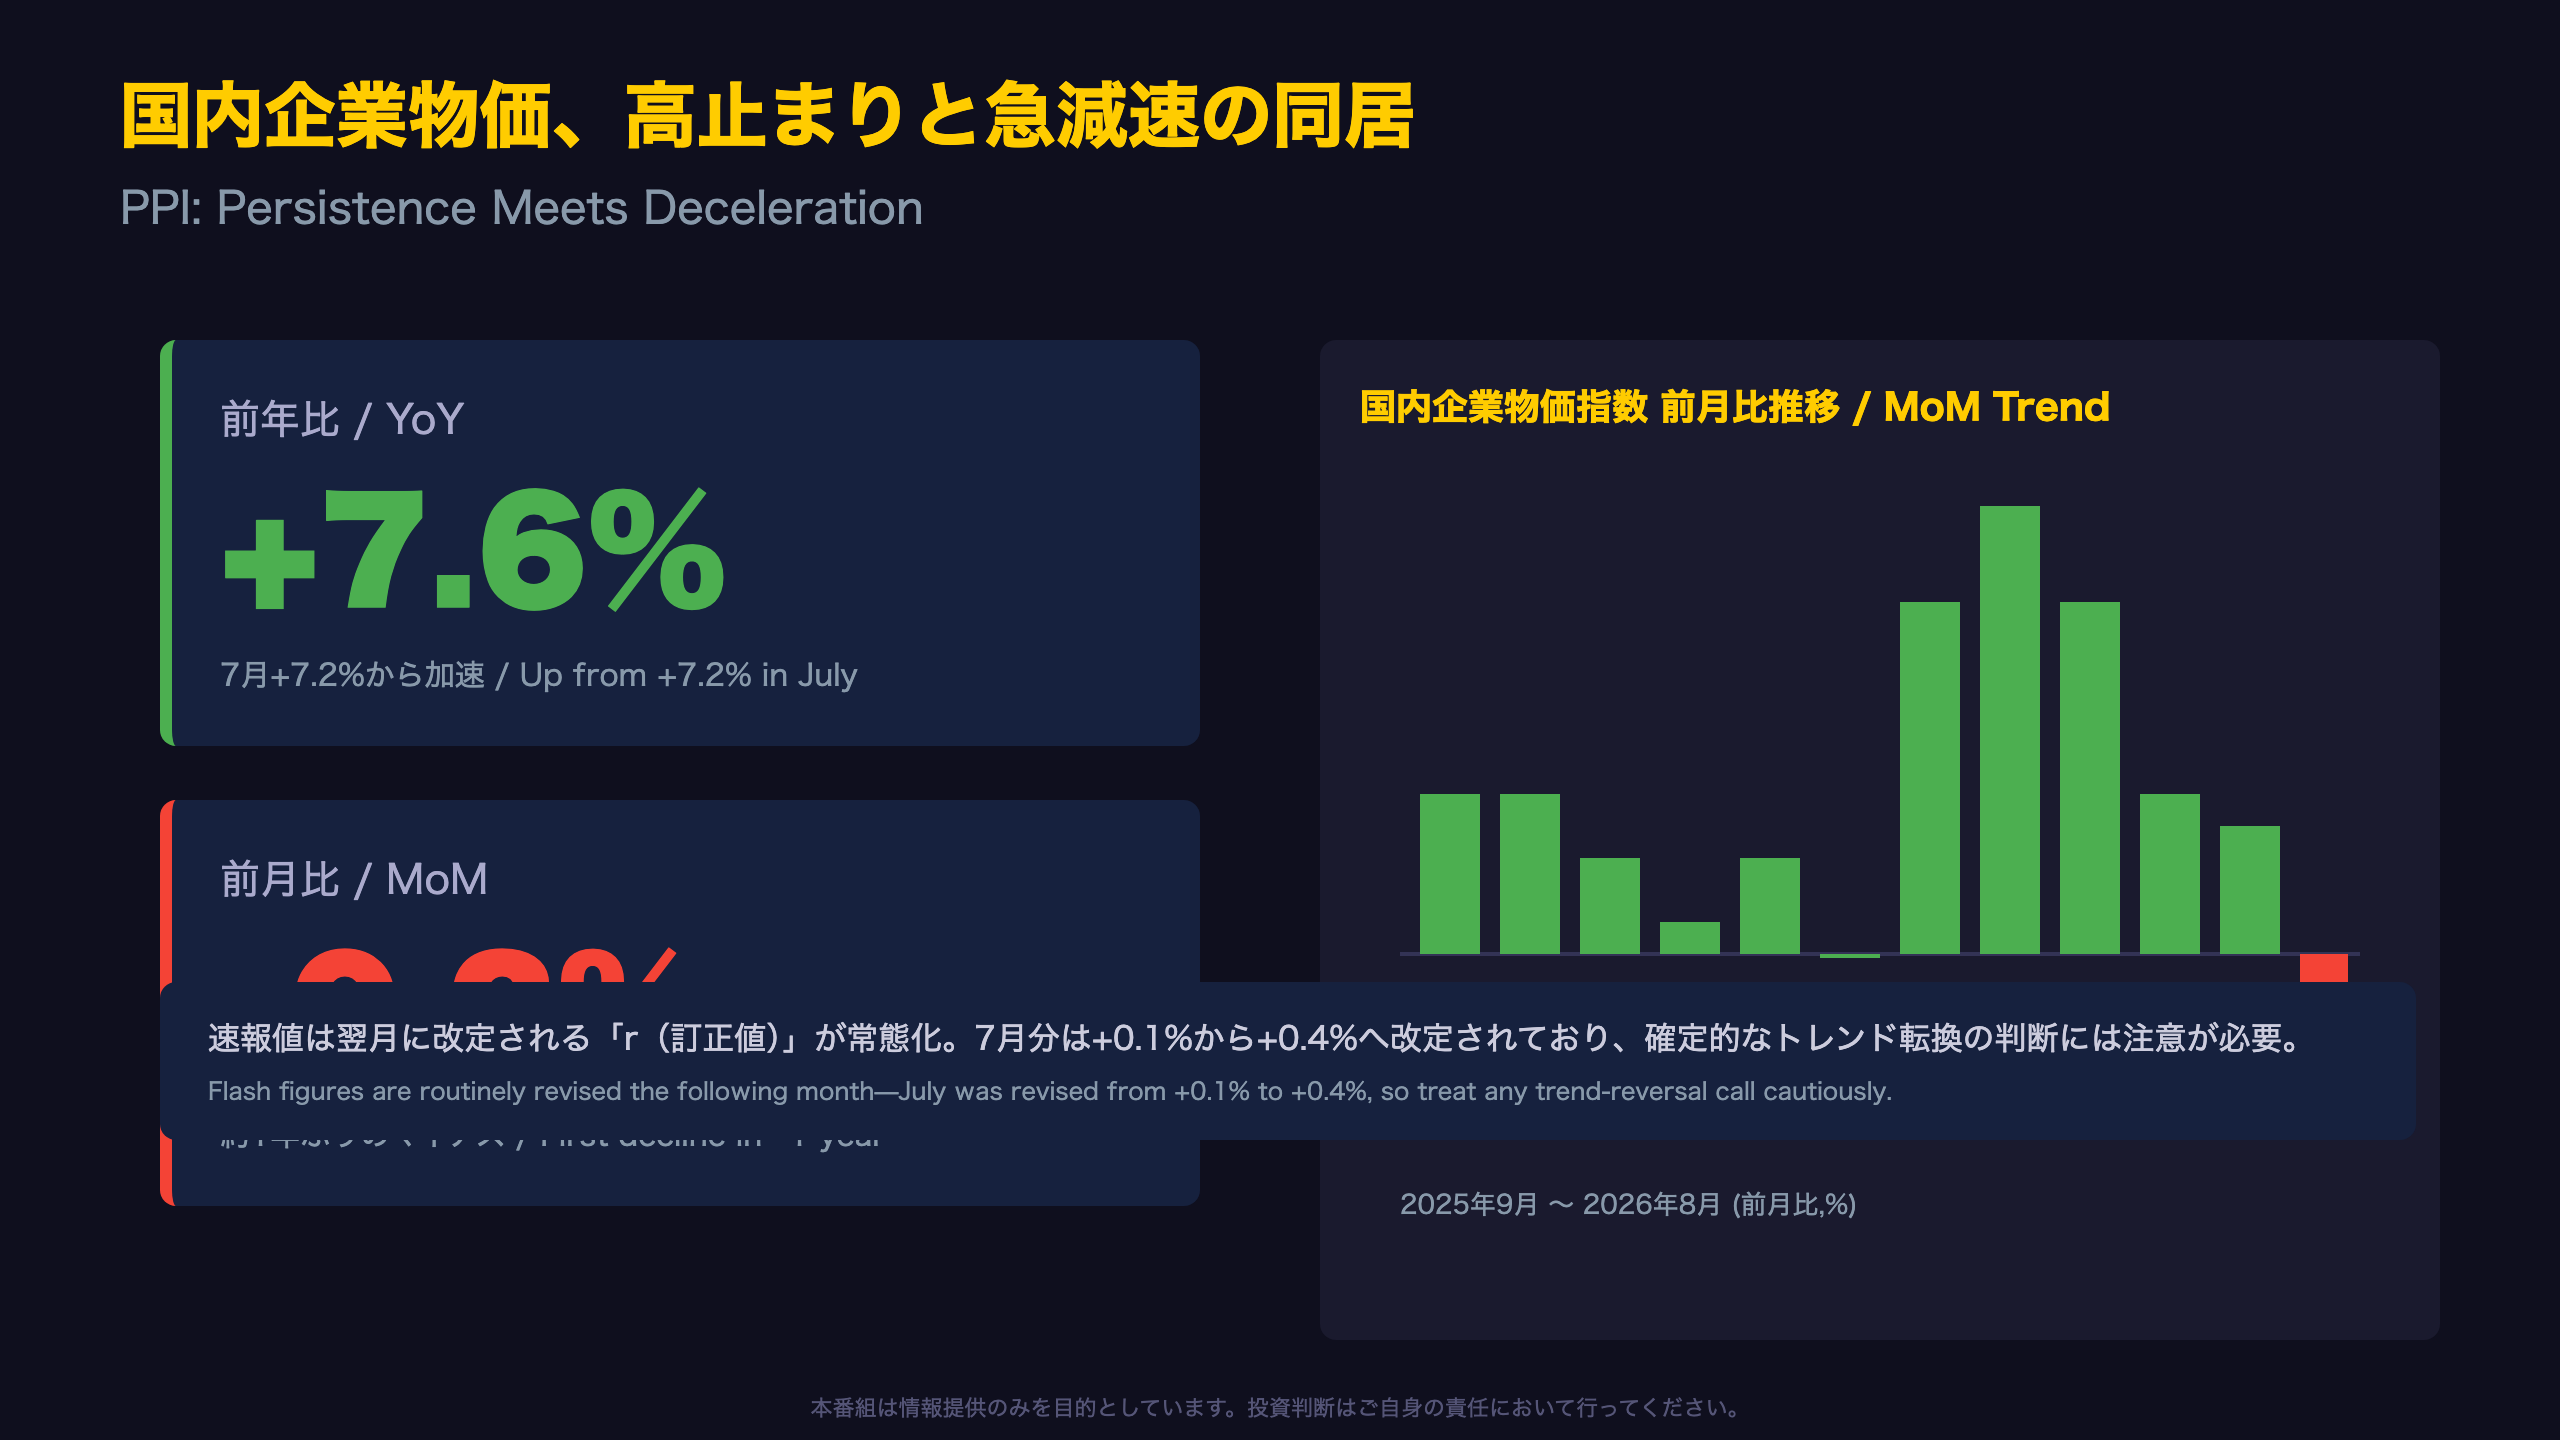
Domestic CGPI YoY accelerated to +7.6%, near cycle highs. But the MoM print turned negative (-0.2%) for the first time in about a year ⚠️
Import prices decelerated sharply (YoY +29.1%→+24.8%) as yen appreciation and falling energy prices combined 📉. Yet metals and gold-linked categories kept rising 💹
Upstream inflation pressure shows both persistence and deceleration at once—key signals for the BOJ’s next policy move.
国内企業物価、高止まりと急減速の同居 / PPI: Persistence Meets Deceleration
Two Faces of the Same Data
The Bank of Japan’s (BOJ) Research and Statistics Department released the August 2026 Corporate Goods Price Index (CGPI)—Japan’s equivalent of the U.S. Producer Price Index (PPI)—showing an unusual split: a still-accelerating annual rate alongside the first monthly decline in roughly a year.
Institutional Context
CGPI tracks prices at the wholesale/producer level for goods transacted between Japanese firms, distinct from the Consumer Price Index (CPI) which the BOJ targets at 2%. CGPI is often viewed as a leading indicator for future CPI, since cost increases at the producer level eventually pass through to consumers—though the timing and completeness of that pass-through varies.
The Numbers
- Domestic CGPI YoY: +7.6% (vs +7.2% in July, per the original release; revised to +7.7%)
- Domestic CGPI MoM: -0.2% — the first negative monthly print in roughly 12 consecutive months of increases
For comparison, U.S. core PPI has generally run in the 2-3% YoY range in recent cycles—making Japan’s +7.6% look extraordinarily elevated, though base effects from a weak prior-year period play a significant role.
Market Implications
A sustained gap between a hot YoY print and a cooling MoM trend is exactly the kind of ambiguous signal that keeps rate markets guessing. JGB yields and USD/JPY are likely to stay sensitive to whether September’s data confirms the MoM downturn or reverts to the prior uptrend. Note that CGPI is a flash (preliminary) release and subject to revision—July’s figure was already revised upward from +0.1% to +0.4% between reports.
前月比マイナスの正体:季節要因と実勢の切り分け / Decomposing the MoM Decline
Decomposing the “Minus 0.2%” Headline
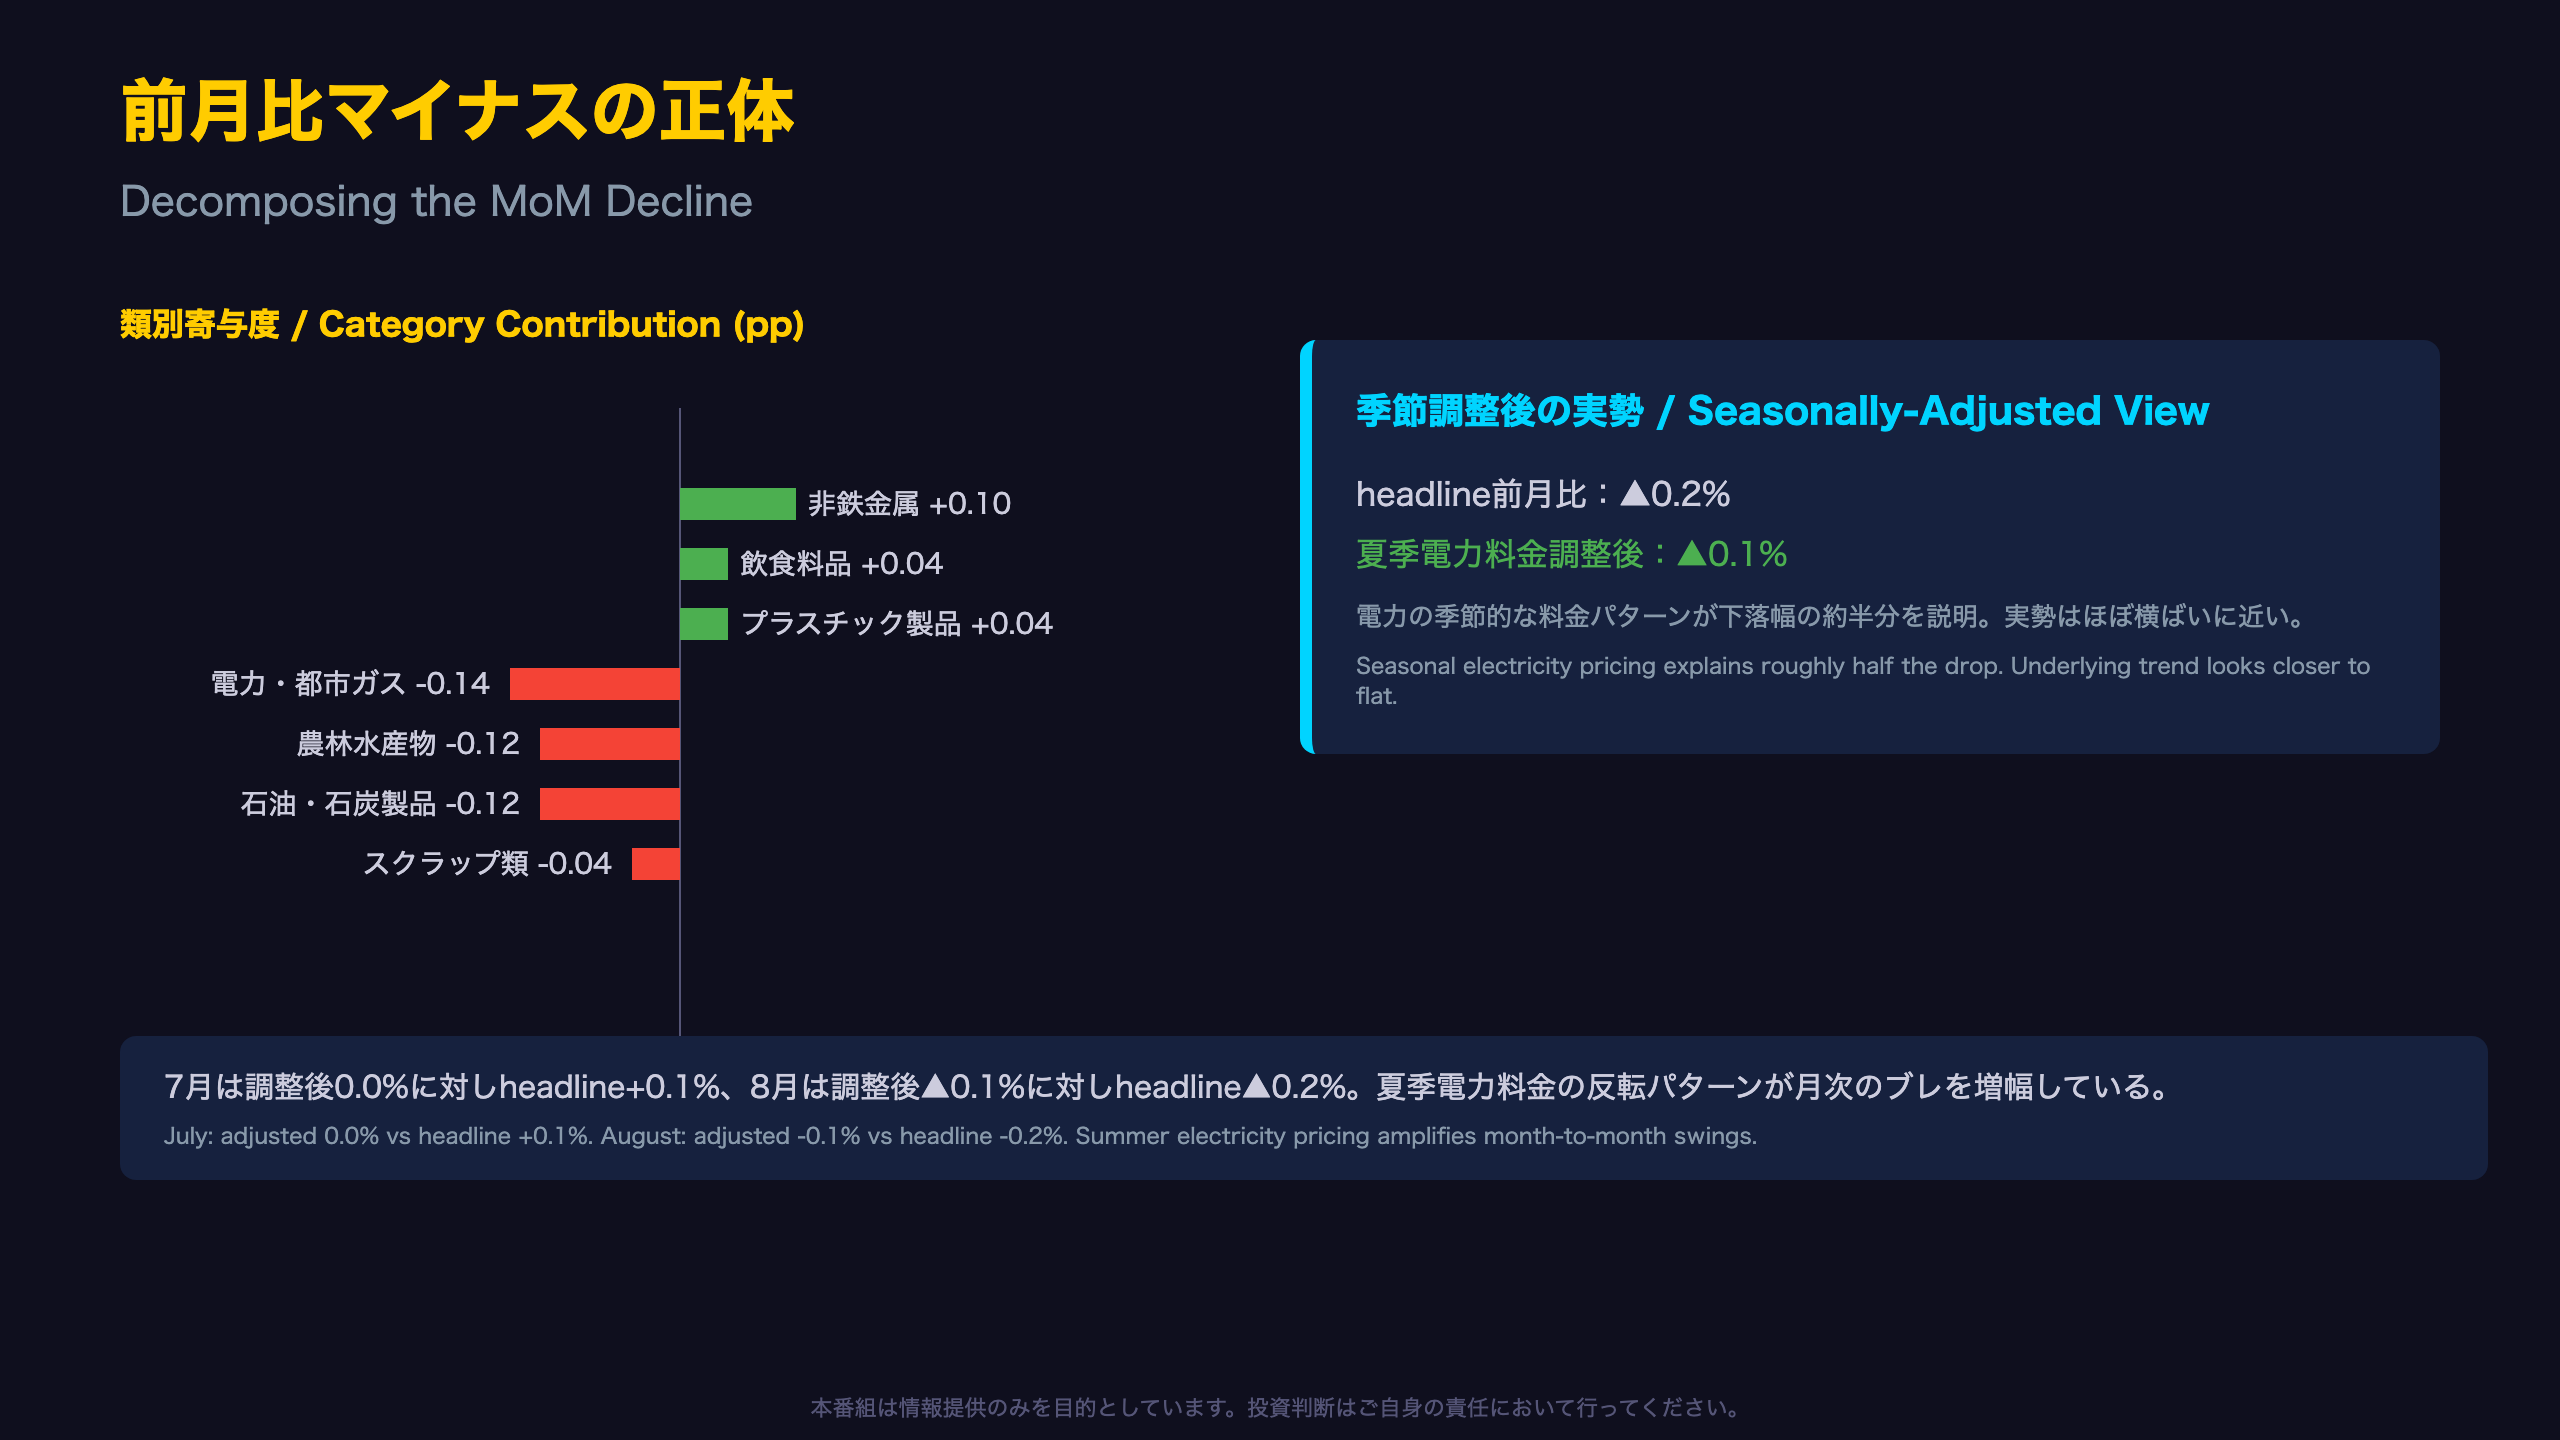
A single negative headline number can obscure a more nuanced picture. The BOJ’s category-level contribution data shows a clear split between decliners and gainers.
What pulled the index down
- Electricity, gas, water: -0.14pp (city gas, electricity for business use)
- Agriculture/forestry/fishery products: -0.12pp (polished rice, pork, whitebait)
- Petroleum & coal products: -0.12pp (heavy fuel oil, jet fuel, lubricants)
- Scrap: -0.04pp
What pushed it up
- Nonferrous metals: +0.10pp (copper, aluminum die-cast alloy, gold bullion)
- Food products and plastics: +0.04pp each
Why the seasonal-adjustment note matters
The BOJ separately publishes a series that strips out Japan’s summer electricity surcharge, applied every July-September. On this adjusted basis, August fell just -0.1% versus the -0.2% headline—while July’s adjusted figure was flat (0.0%) versus a +0.1% headline. That means roughly two-thirds of the swing between July and August is a seasonal electricity-pricing artifact, not a fresh disinflationary signal.
Cross-market read
For investors used to U.S. PPI, this is analogous to looking through seasonally volatile categories like used vehicles or airfares. The takeaway: rather than a genuine trend break, August’s dip looks closer to broadly flat underlying momentum, with energy/food declines offsetting continued strength in metals—itself linked to the global gold rally. This nuance matters for JGB and rate-sensitive asset positioning, since a false “deflation signal” could be quickly reversed in September’s data.
輸入物価:円高とエネルギー安の二重の重し / Import Prices: A Double Drag
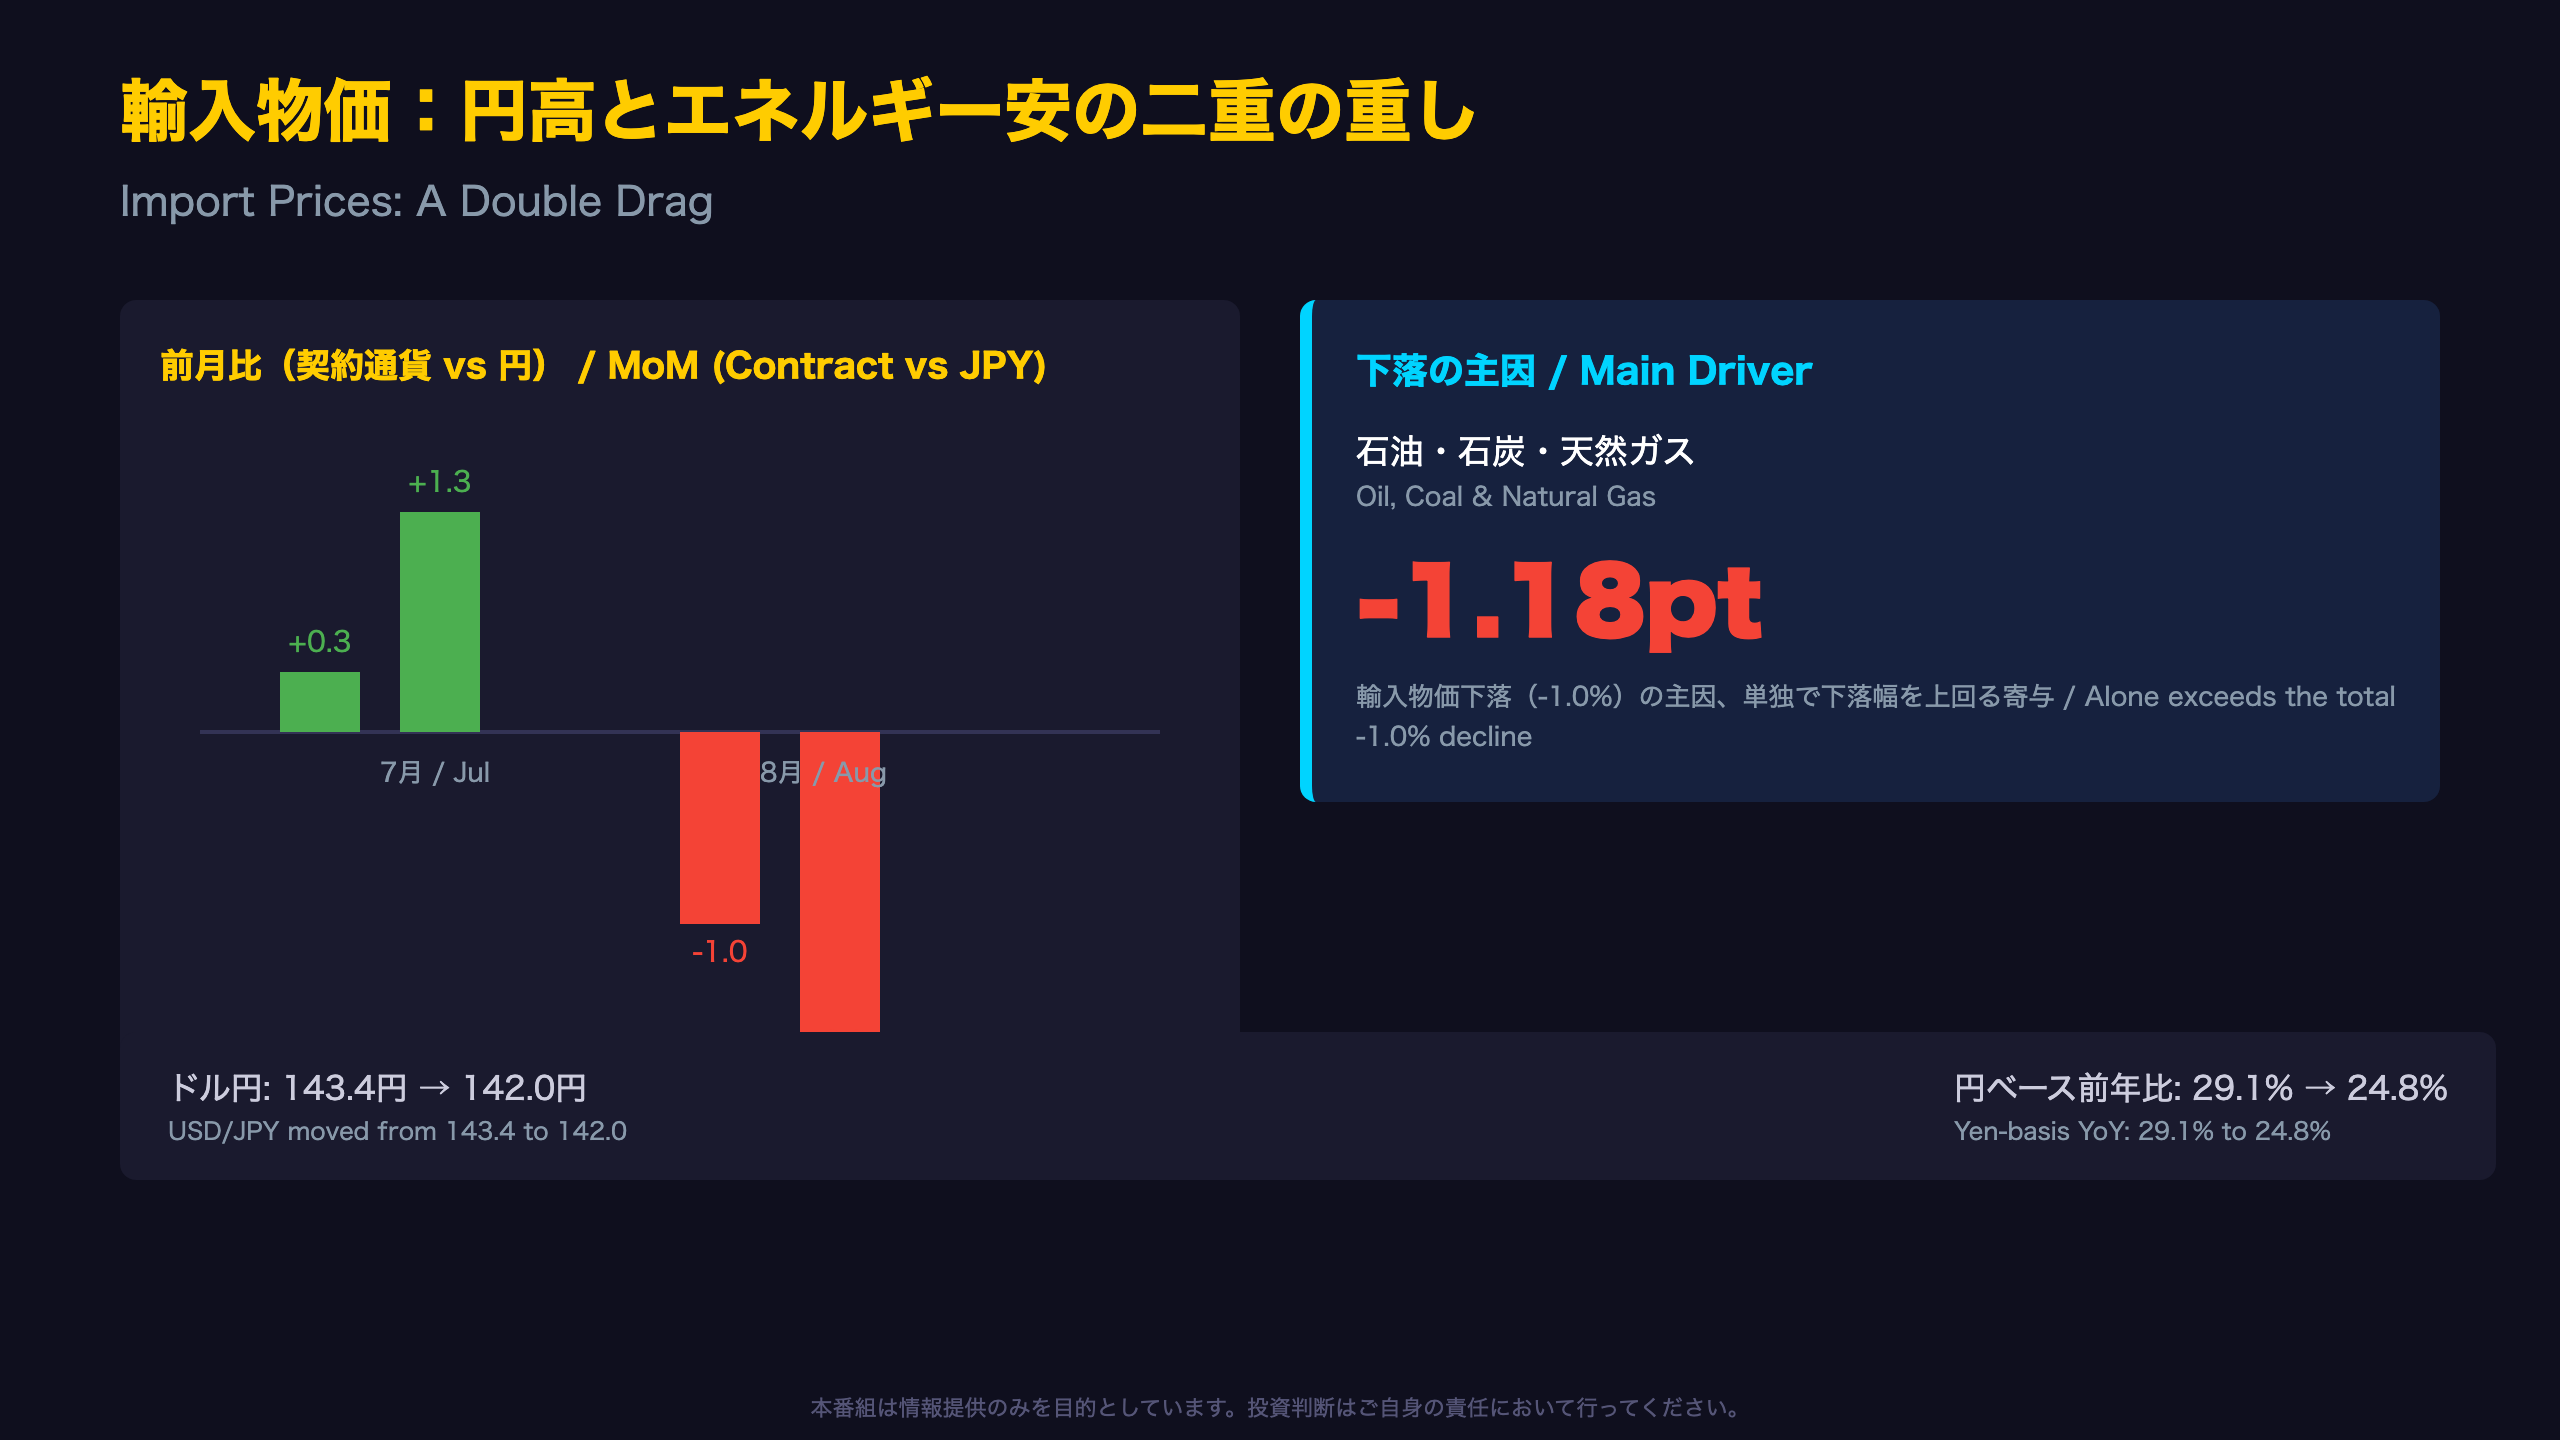
Two Headwinds: FX and Commodities
August’s import price data is the clearest reversal signal in this month’s CGPI release, and it carries direct relevance for anyone tracking the yen (JPY) or Japan-linked commodity plays.
Contract-currency vs Yen-denominated prices
Japan’s CGPI uniquely reports import (and export) prices in two ways: contract-currency basis (the price in the currency actually used in the trade, e.g. USD) and yen basis (converted to JPY). Comparing the two isolates the pure FX effect—something U.S. PPI readers don’t typically need to consider.
| Metric | July | August |
|---|---|---|
| Contract-currency MoM | +0.3% | -1.0% |
| Yen-basis MoM | +1.3% | -3.0% |
| Yen-basis YoY | +29.1% | +24.8% |
The yen-basis decline (-3.0%) is steeper than the contract-currency decline (-1.0%), consistent with USD/JPY moving from 143.4 to 142.0—a roughly 1% yen appreciation that amplified the import-price drop once converted back to yen.
Energy is doing the heavy lifting
Oil, coal, and natural gas alone contributed -1.18 percentage points to the -1.0% headline import-price move—meaning excluding energy, other categories (electronics +0.10pp, general machinery +0.08pp) were actually rising. This is a commodity-specific story, not broad-based import deflation.
Why this matters for markets
A cooling import-price pipeline, if sustained, reduces cost-push pressure feeding into Japan’s CPI over coming months—an argument foreign investors watching JGB yields and USD/JPY should weigh against the still-hot +7.6% domestic CGPI headline. This is a plausible directional signal, not a confirmed trend, given it is based on a single month’s data.
輸出物価の逆転現象:円高が輸出採算を圧迫 / Export Prices: FX Squeezes Margins
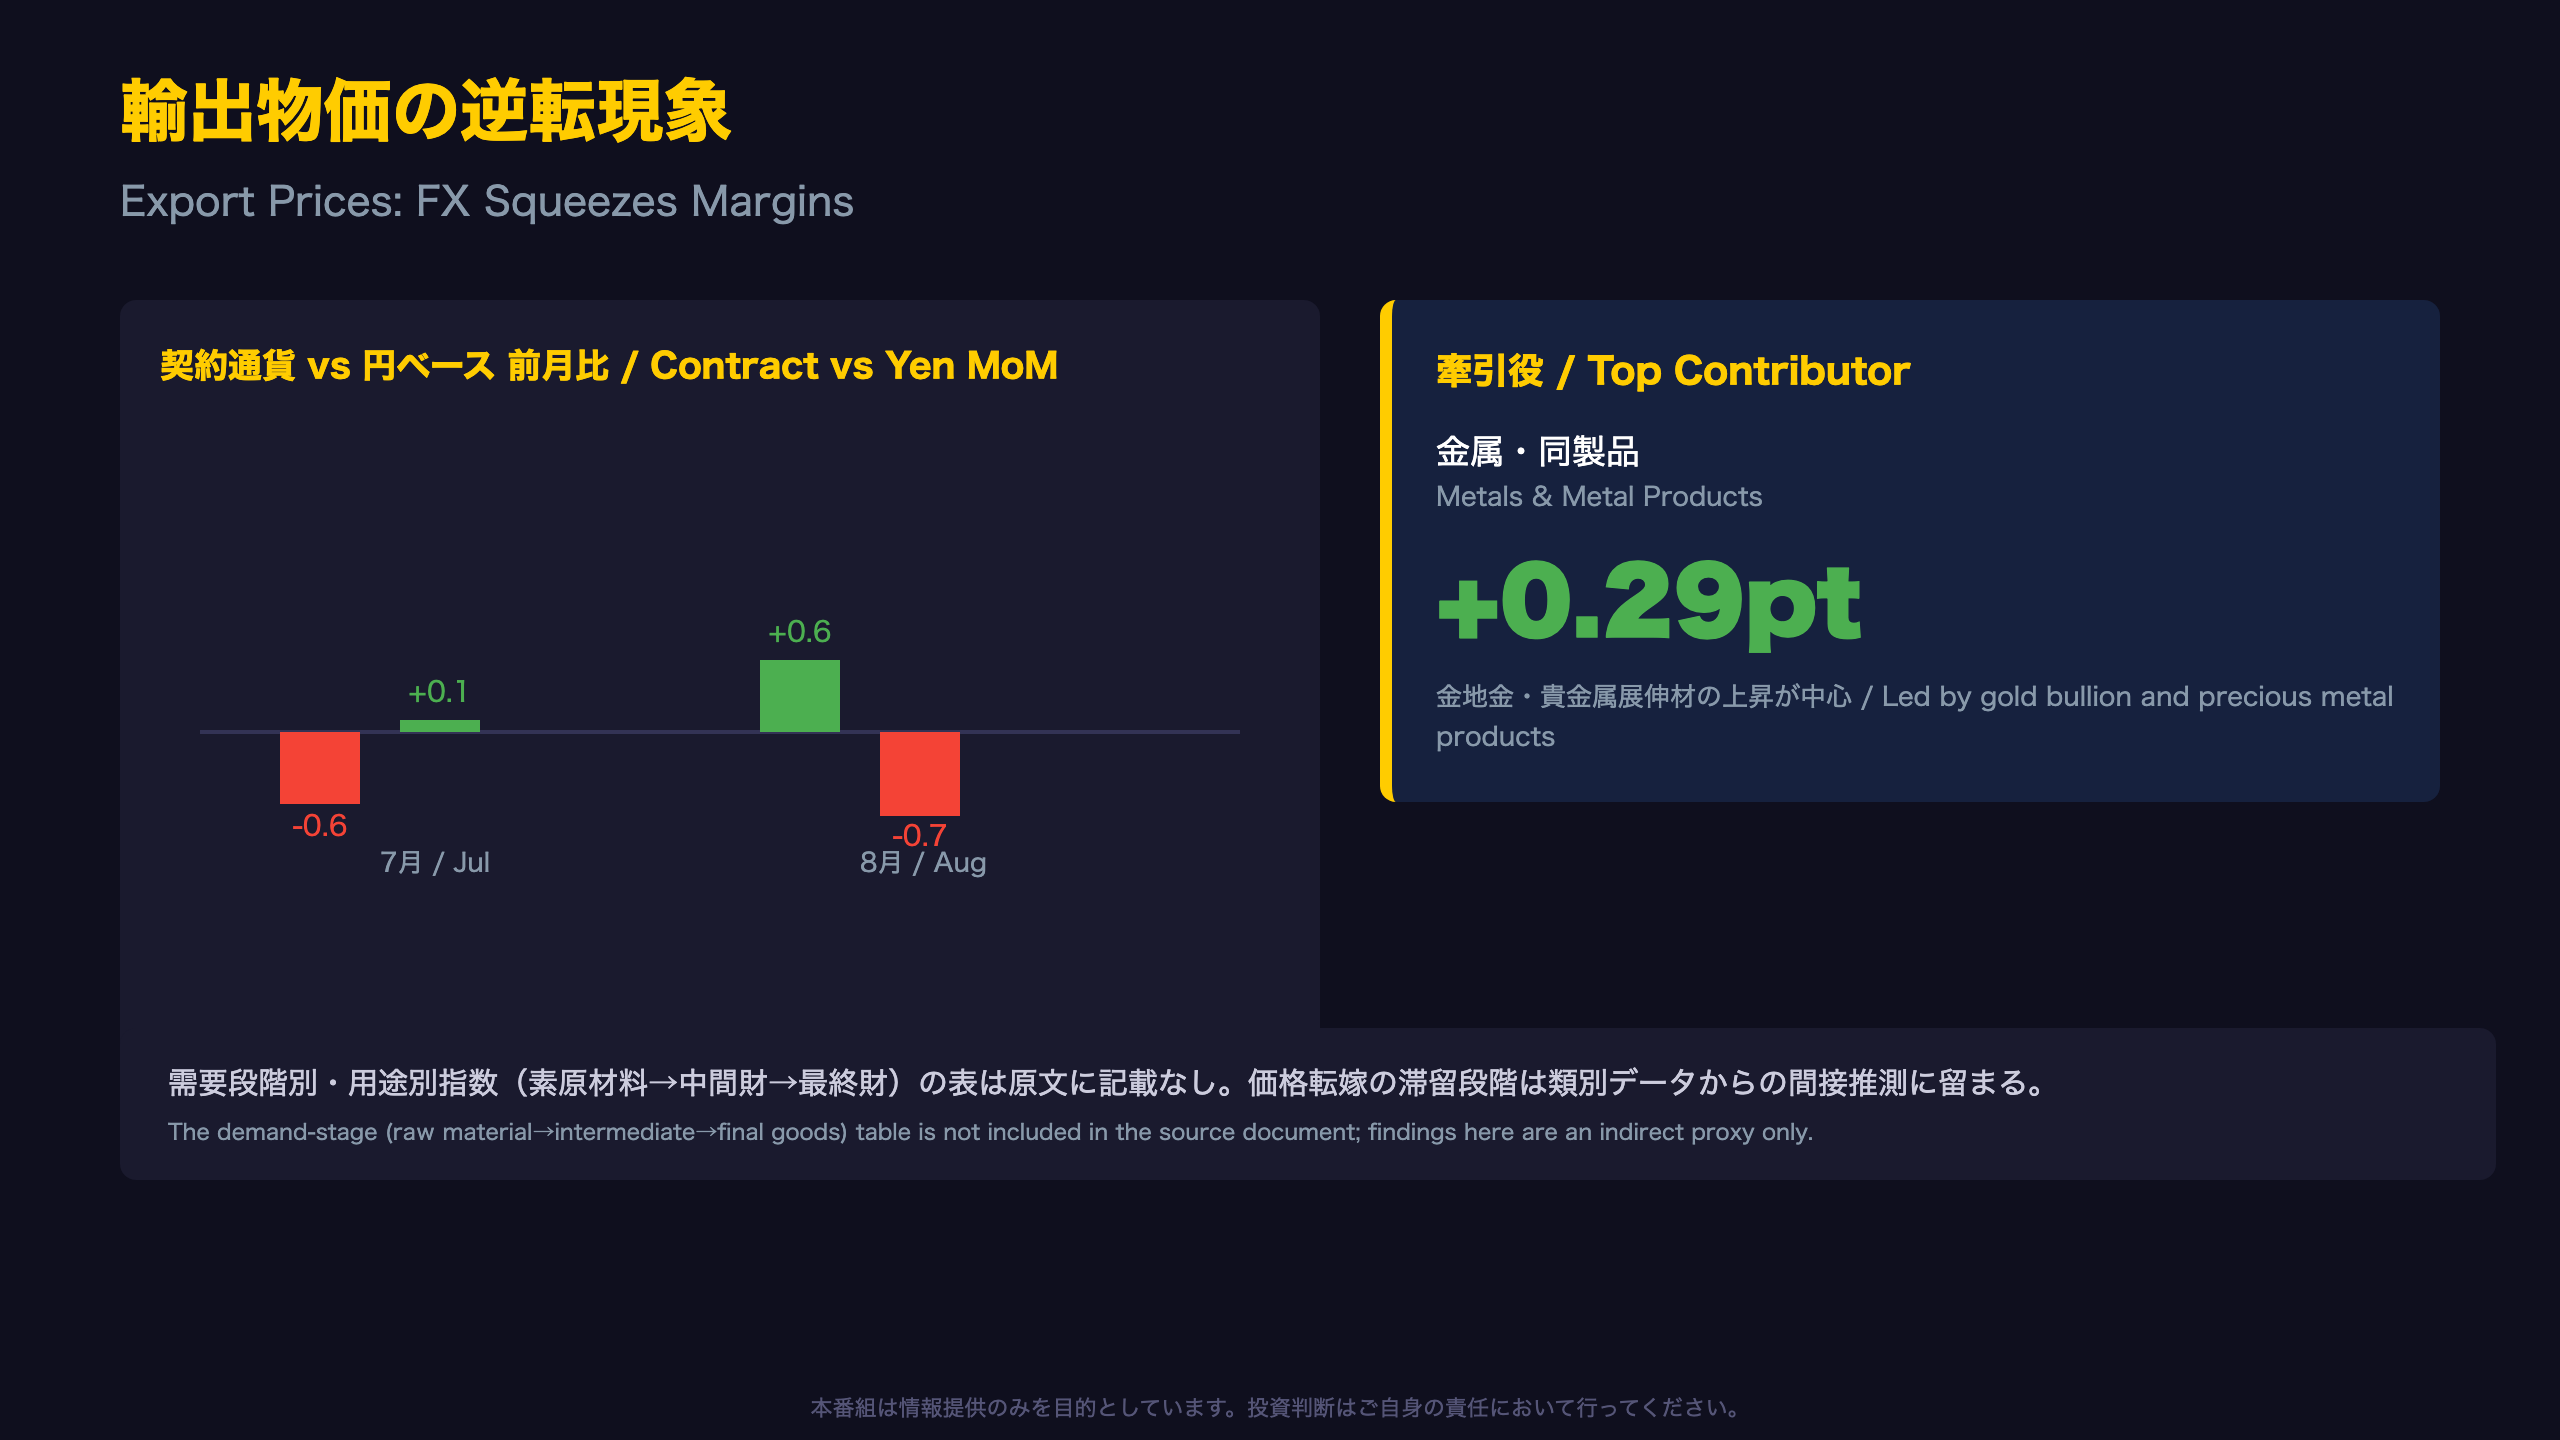
The Invisible Erosion for Exporters
A note on data scope: the original release does not include the demand-stage classification table (raw materials → intermediate goods → final goods) that BOJ sometimes publishes separately. So any claim about where price pass-through is “stuck” in the production chain should be treated as not stated in the source rather than inferred.
A sign flip between July and August
| Metric | July | August |
|---|---|---|
| Contract-currency MoM | -0.6% | +0.6% |
| Yen-basis MoM | +0.1% | -0.7% |
| Yen-basis YoY | +18.9% | +17.9% |
| Contract-currency YoY | +10.1% | +11.1% |
In July, contract-currency export prices fell while yen-basis prices rose—yen weakness cushioned exporters. In August, the pattern flipped entirely: contract-currency prices rose, but yen-basis prices fell as the yen appreciated. For English-speaking investors, this is the mirror image of how a stronger dollar affects U.S. multinationals’ overseas revenue when translated back to USD—except here it’s Japanese exporters facing currency-driven margin compression even when underlying foreign-currency demand is firm.
Metals lead the gain
Metals & metal products contributed +0.29 percentage points to the +0.6% contract-currency gain, led by gold bullion and precious metal semi-finished products—likely tracking the global gold rally, a theme also visible in domestic CGPI’s nonferrous metals category.
Investor takeaway
Export-oriented Japanese equities (autos, machinery, electronics) may see reported yen revenues lag underlying dollar-denominated demand strength if the yen continues appreciating—a dynamic worth monitoring alongside BOJ rate-differential expectations.
日銀への含意:根拠の鎖でたどる政策インパクト / Chain of Reasoning for BOJ Policy
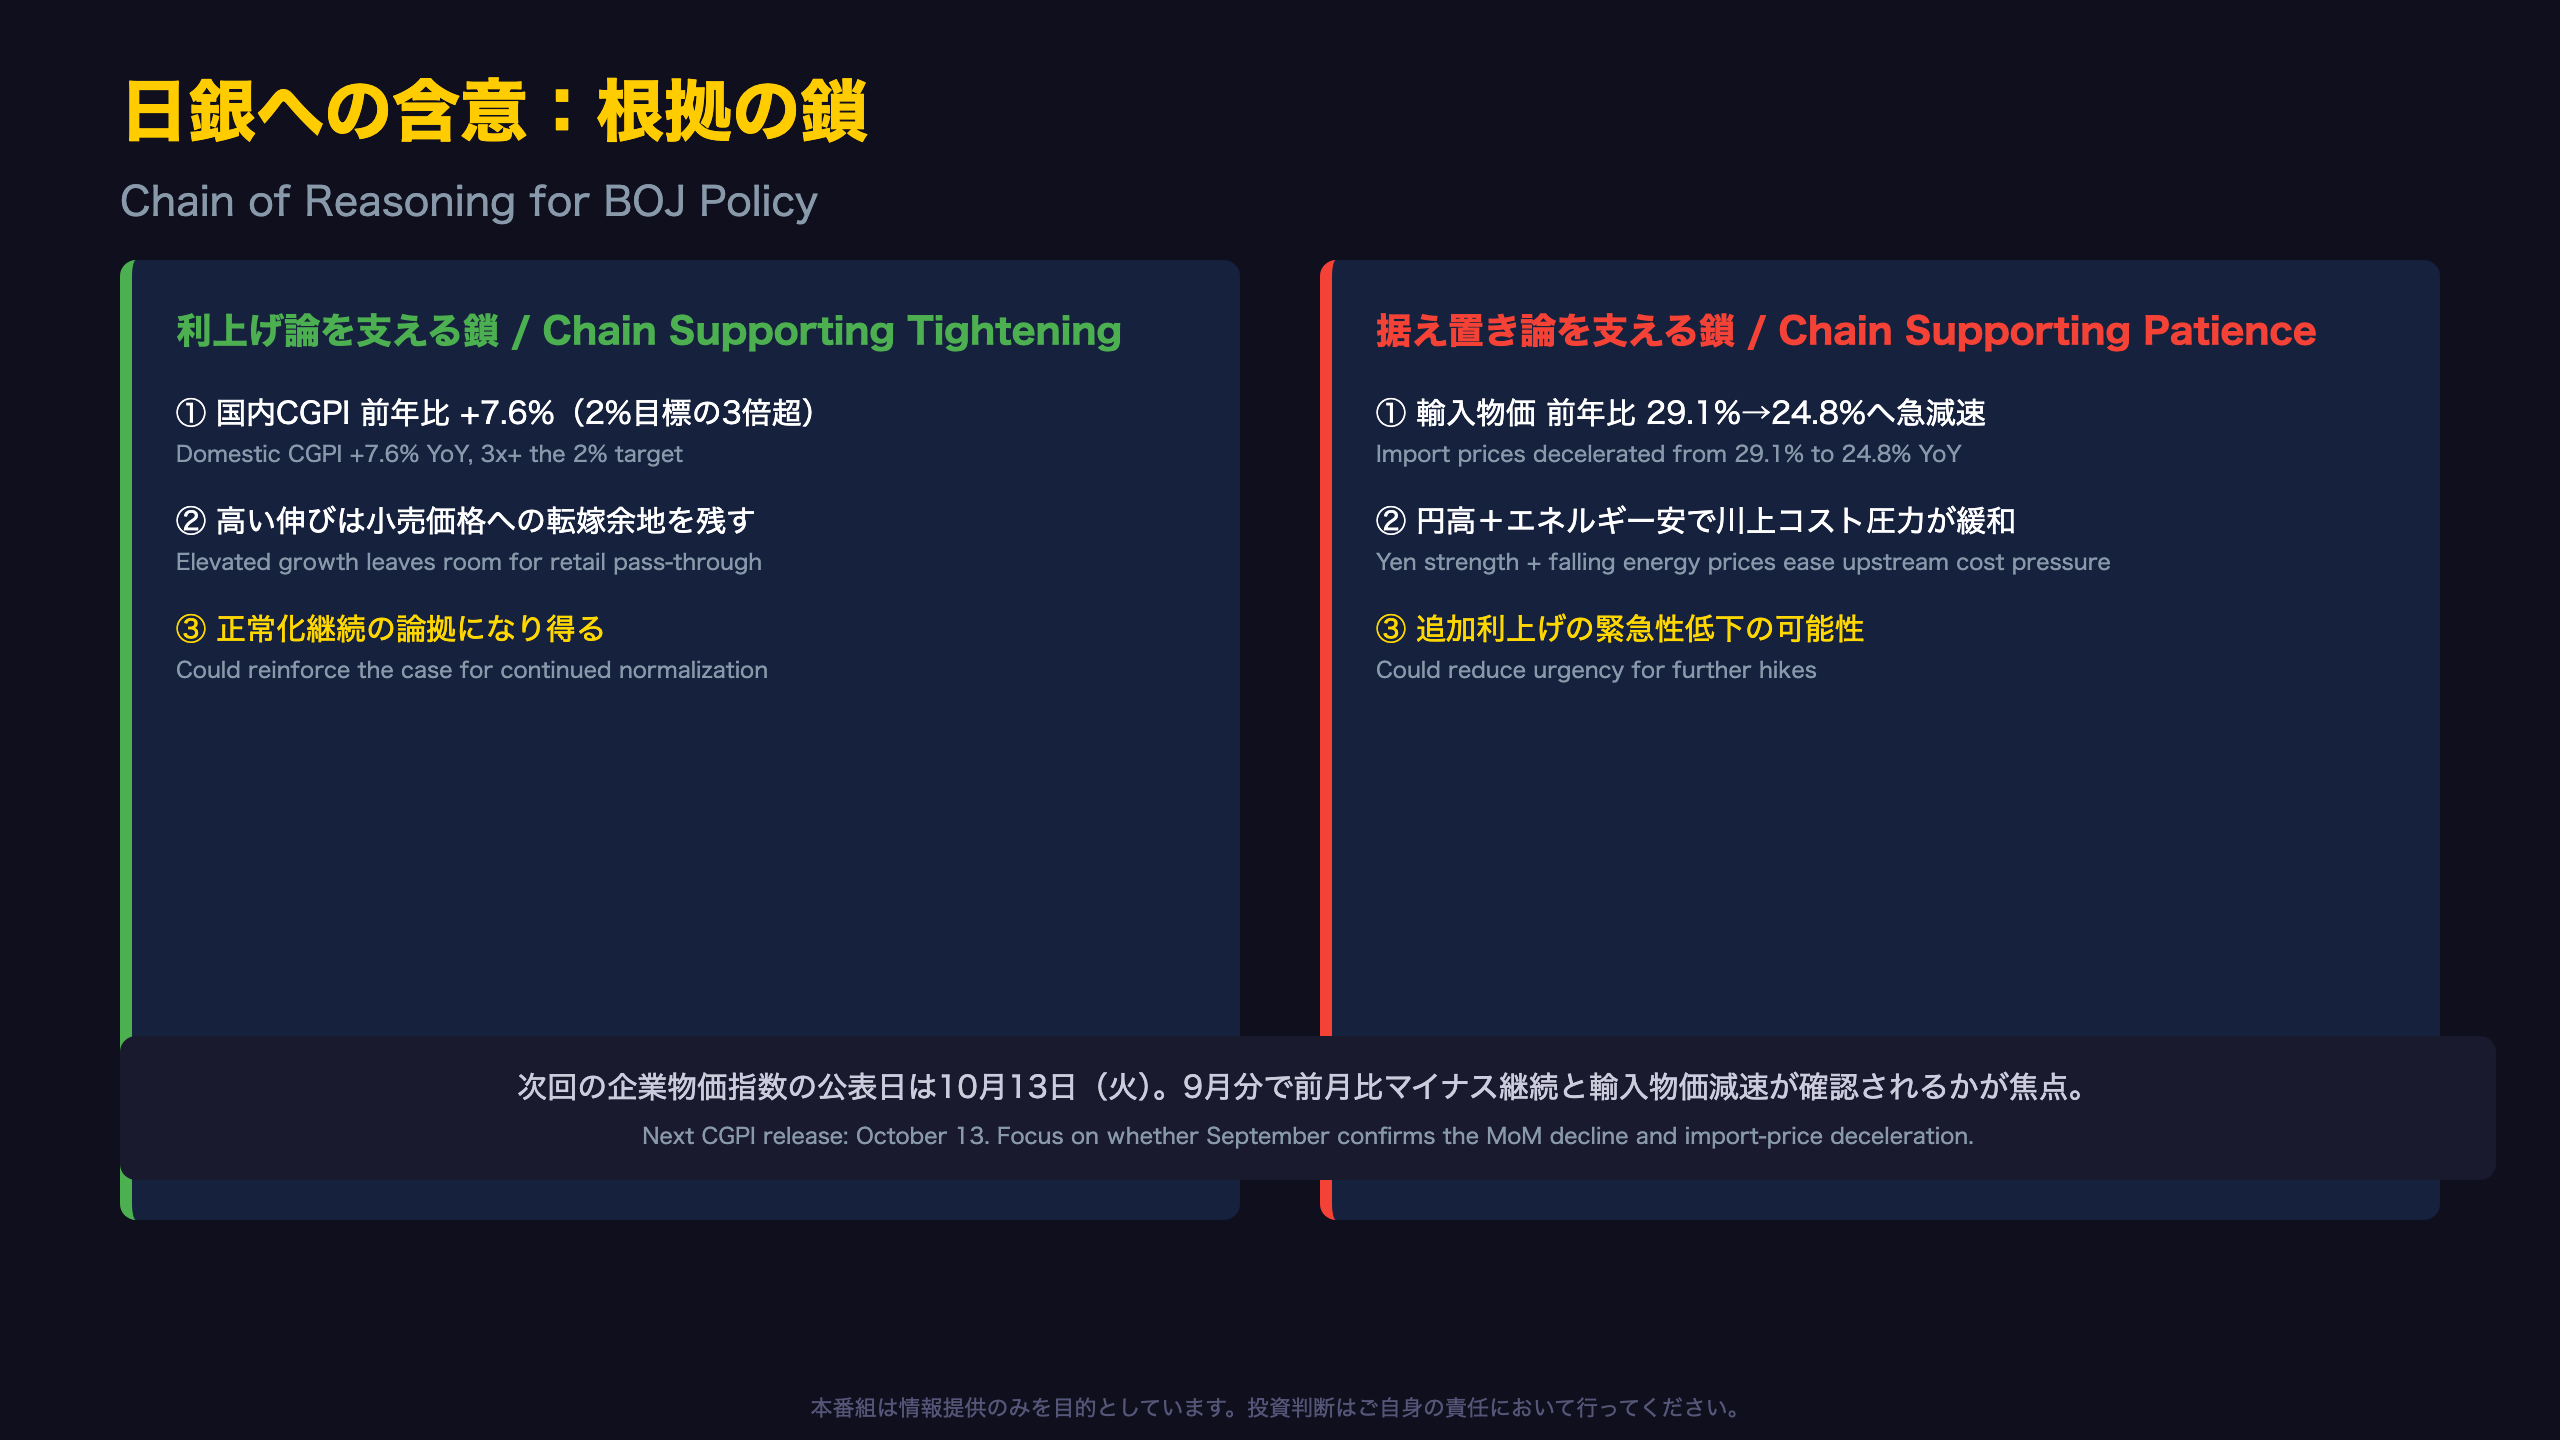
Chain of Reasoning: Data → Mechanism → Policy Implication
Here is how this month’s CGPI release maps onto the Bank of Japan’s (BOJ) policy calculus, following the evidence chain from raw figures to potential implications.
Chain 1: Elevated levels support continued tightening
Data point: Domestic CGPI +7.6% YoY, more than three times the BOJ’s 2% CPI target
Mechanism: Persistently high producer-level price growth leaves room for further pass-through into retail prices with a lag
Policy read: If this elevated trend persists, it reinforces the case for the BOJ to continue policy normalization (rate hikes) rather than pause
Chain 2: Cooling import costs support a patient approach
Data point: Import prices (yen basis) decelerated from +29.1% to +24.8% YoY; MoM fell -1.0% (contract-currency) and -3.0% (yen basis)
Mechanism: Yen appreciation (USD/JPY 143.4→142.0) combined with falling energy prices reduces upstream import-cost pressure
Policy read: A sustained deceleration in imported inflation would gradually ease pass-through pressure to consumer prices, potentially reducing urgency for aggressive additional hikes
A balanced conclusion
These two chains point in opposite directions, and neither should be cherry-picked in isolation. The fairest characterization of this month’s data: elevated levels persist, but early signs of deceleration are emerging beneath the surface.
For context, this dynamic is similar to how the U.S. Federal Reserve weighs a still-high core PCE print against decelerating import/producer costs—both matter, and neither alone determines the policy path.
The next CGPI release is scheduled for October 13. Whether September confirms a continuing MoM decline and further import-price deceleration will be the key data point to watch.
Disclaimer: This article is for informational purposes only. All investment decisions are made solely at your own risk.