📺 Watch the Full Video Analysis
This article was automatically generated by the NFC Market Live AI analysis system. (Updated: 2026-09-08 09:00 JST)
📄 Primary Source
財務省
https://www.mof.go.jp/policy/international_policy/reference/itn_transactions_in_securities/month.pdf
📊 Deep dive into Japan MOF’s August 2026 International Transactions in Securities (released Sep 8, 2026).
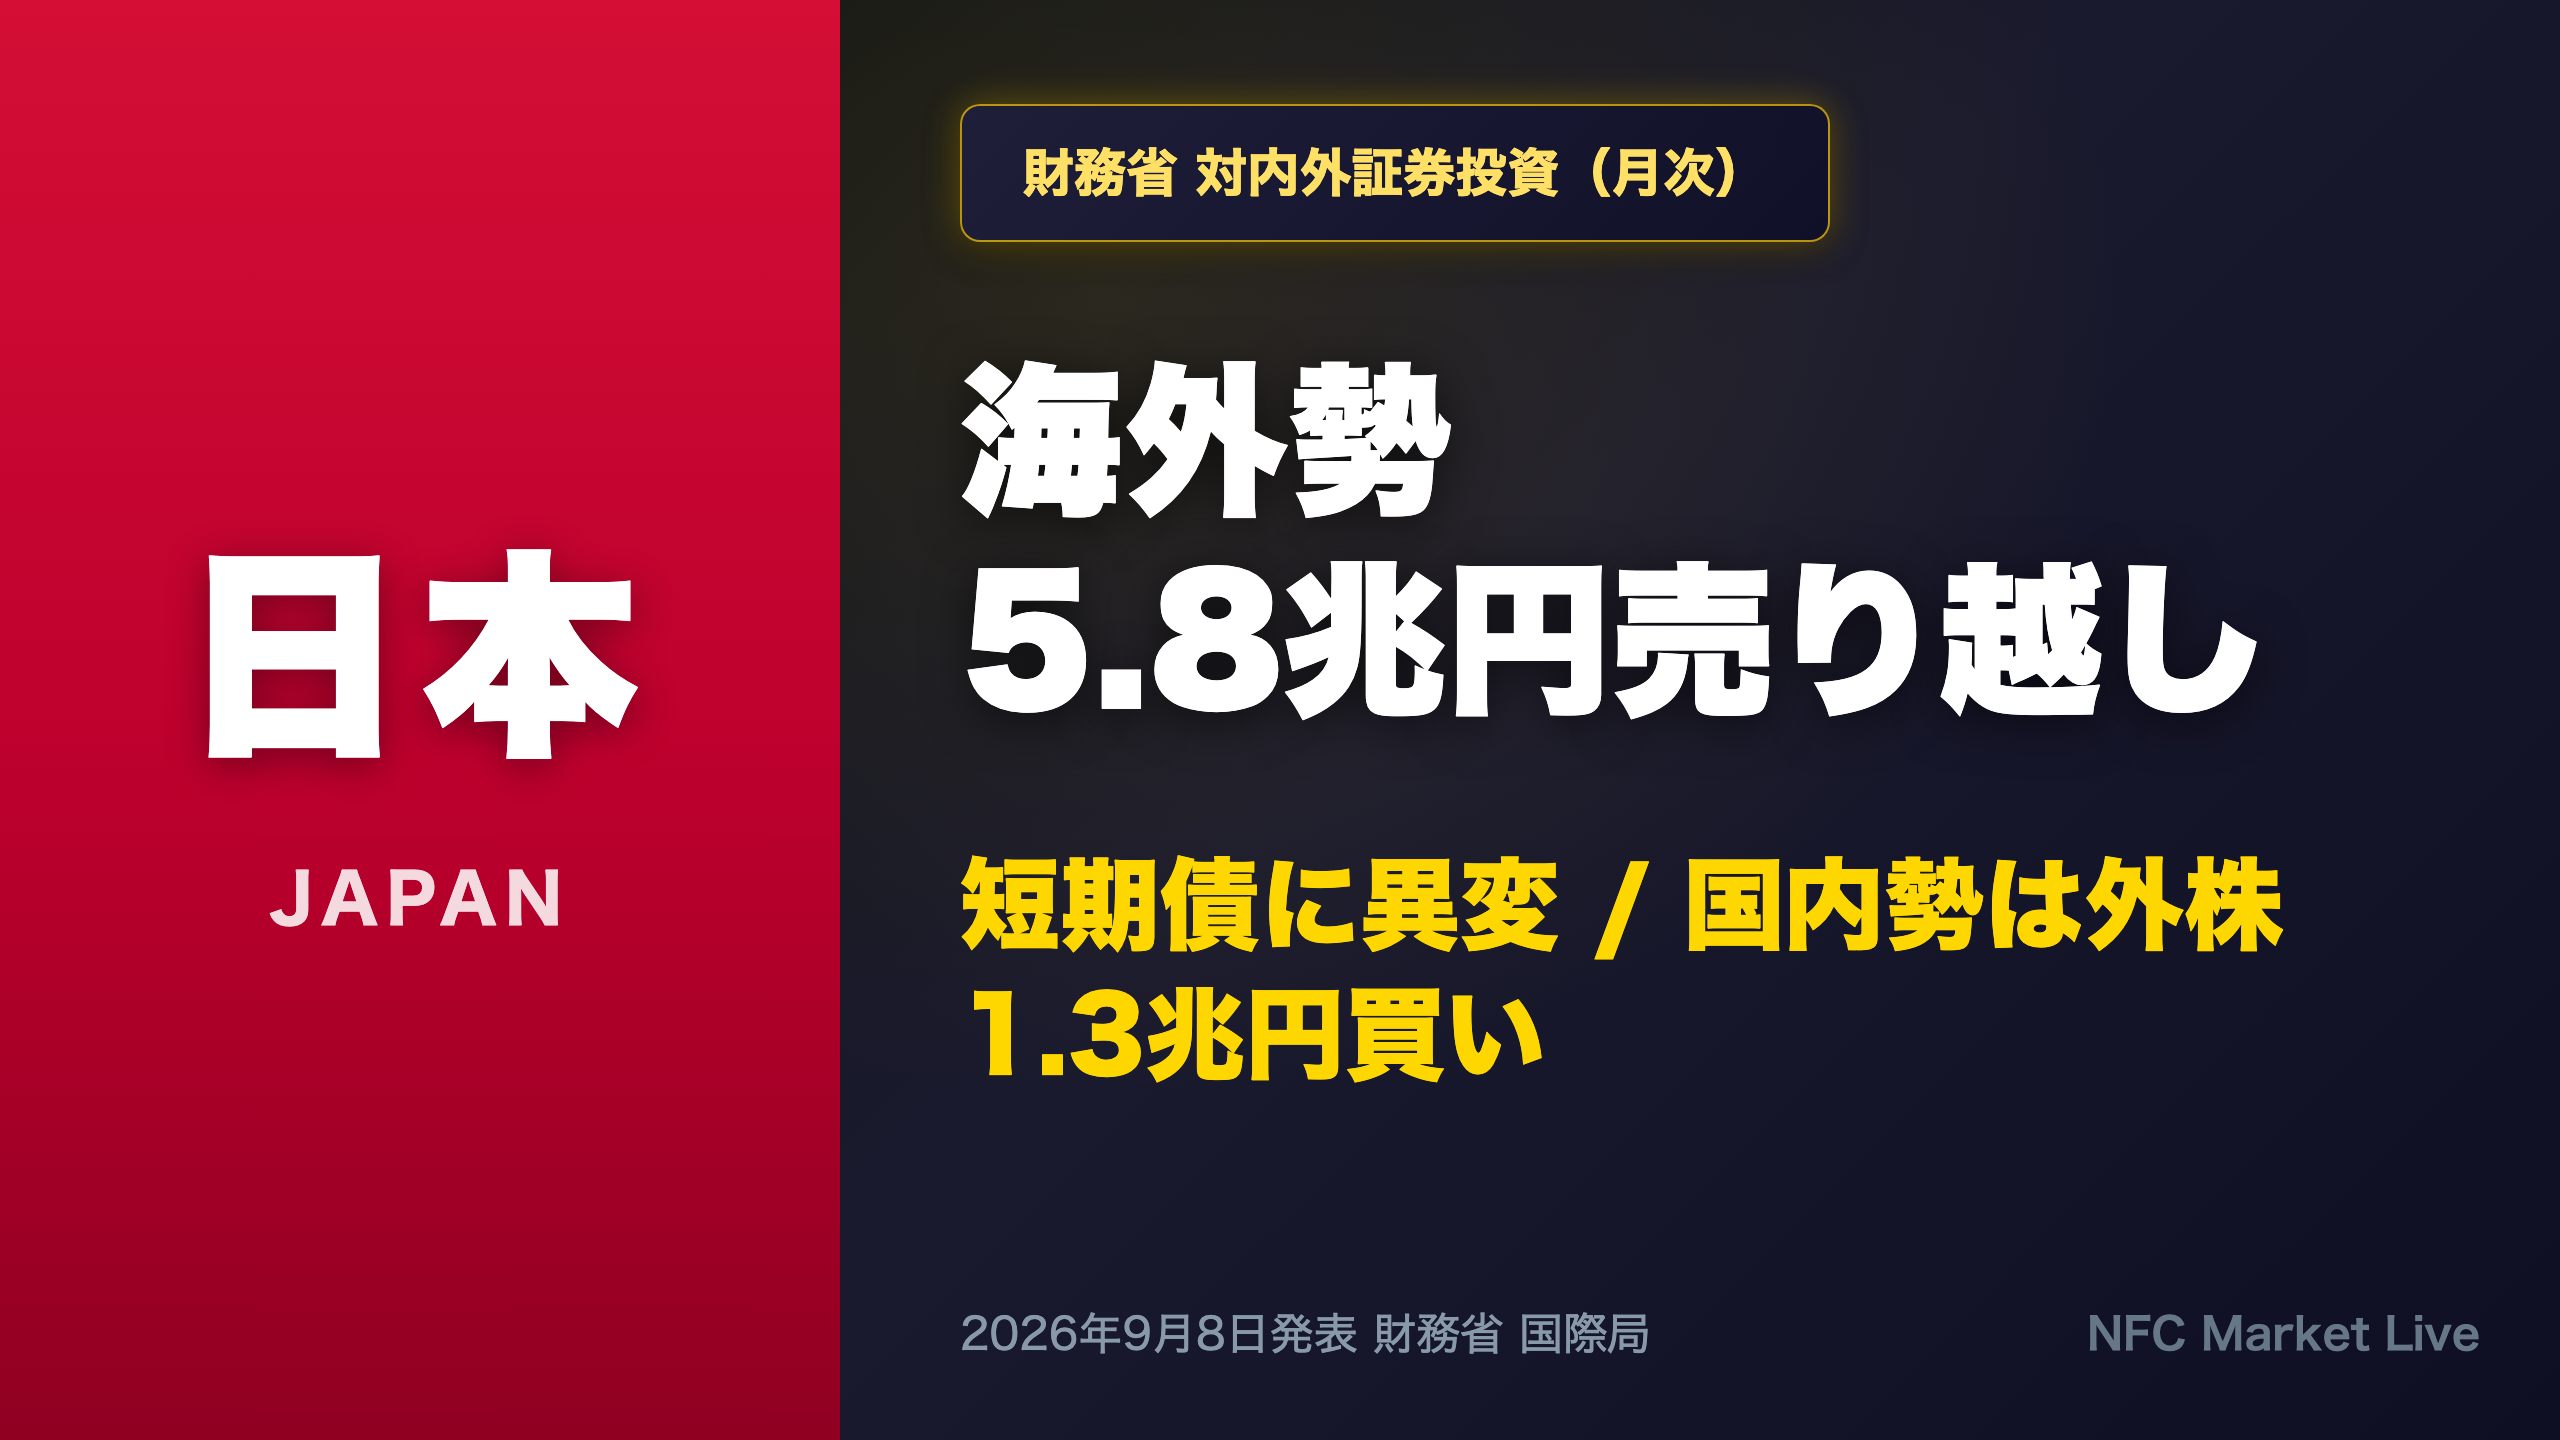
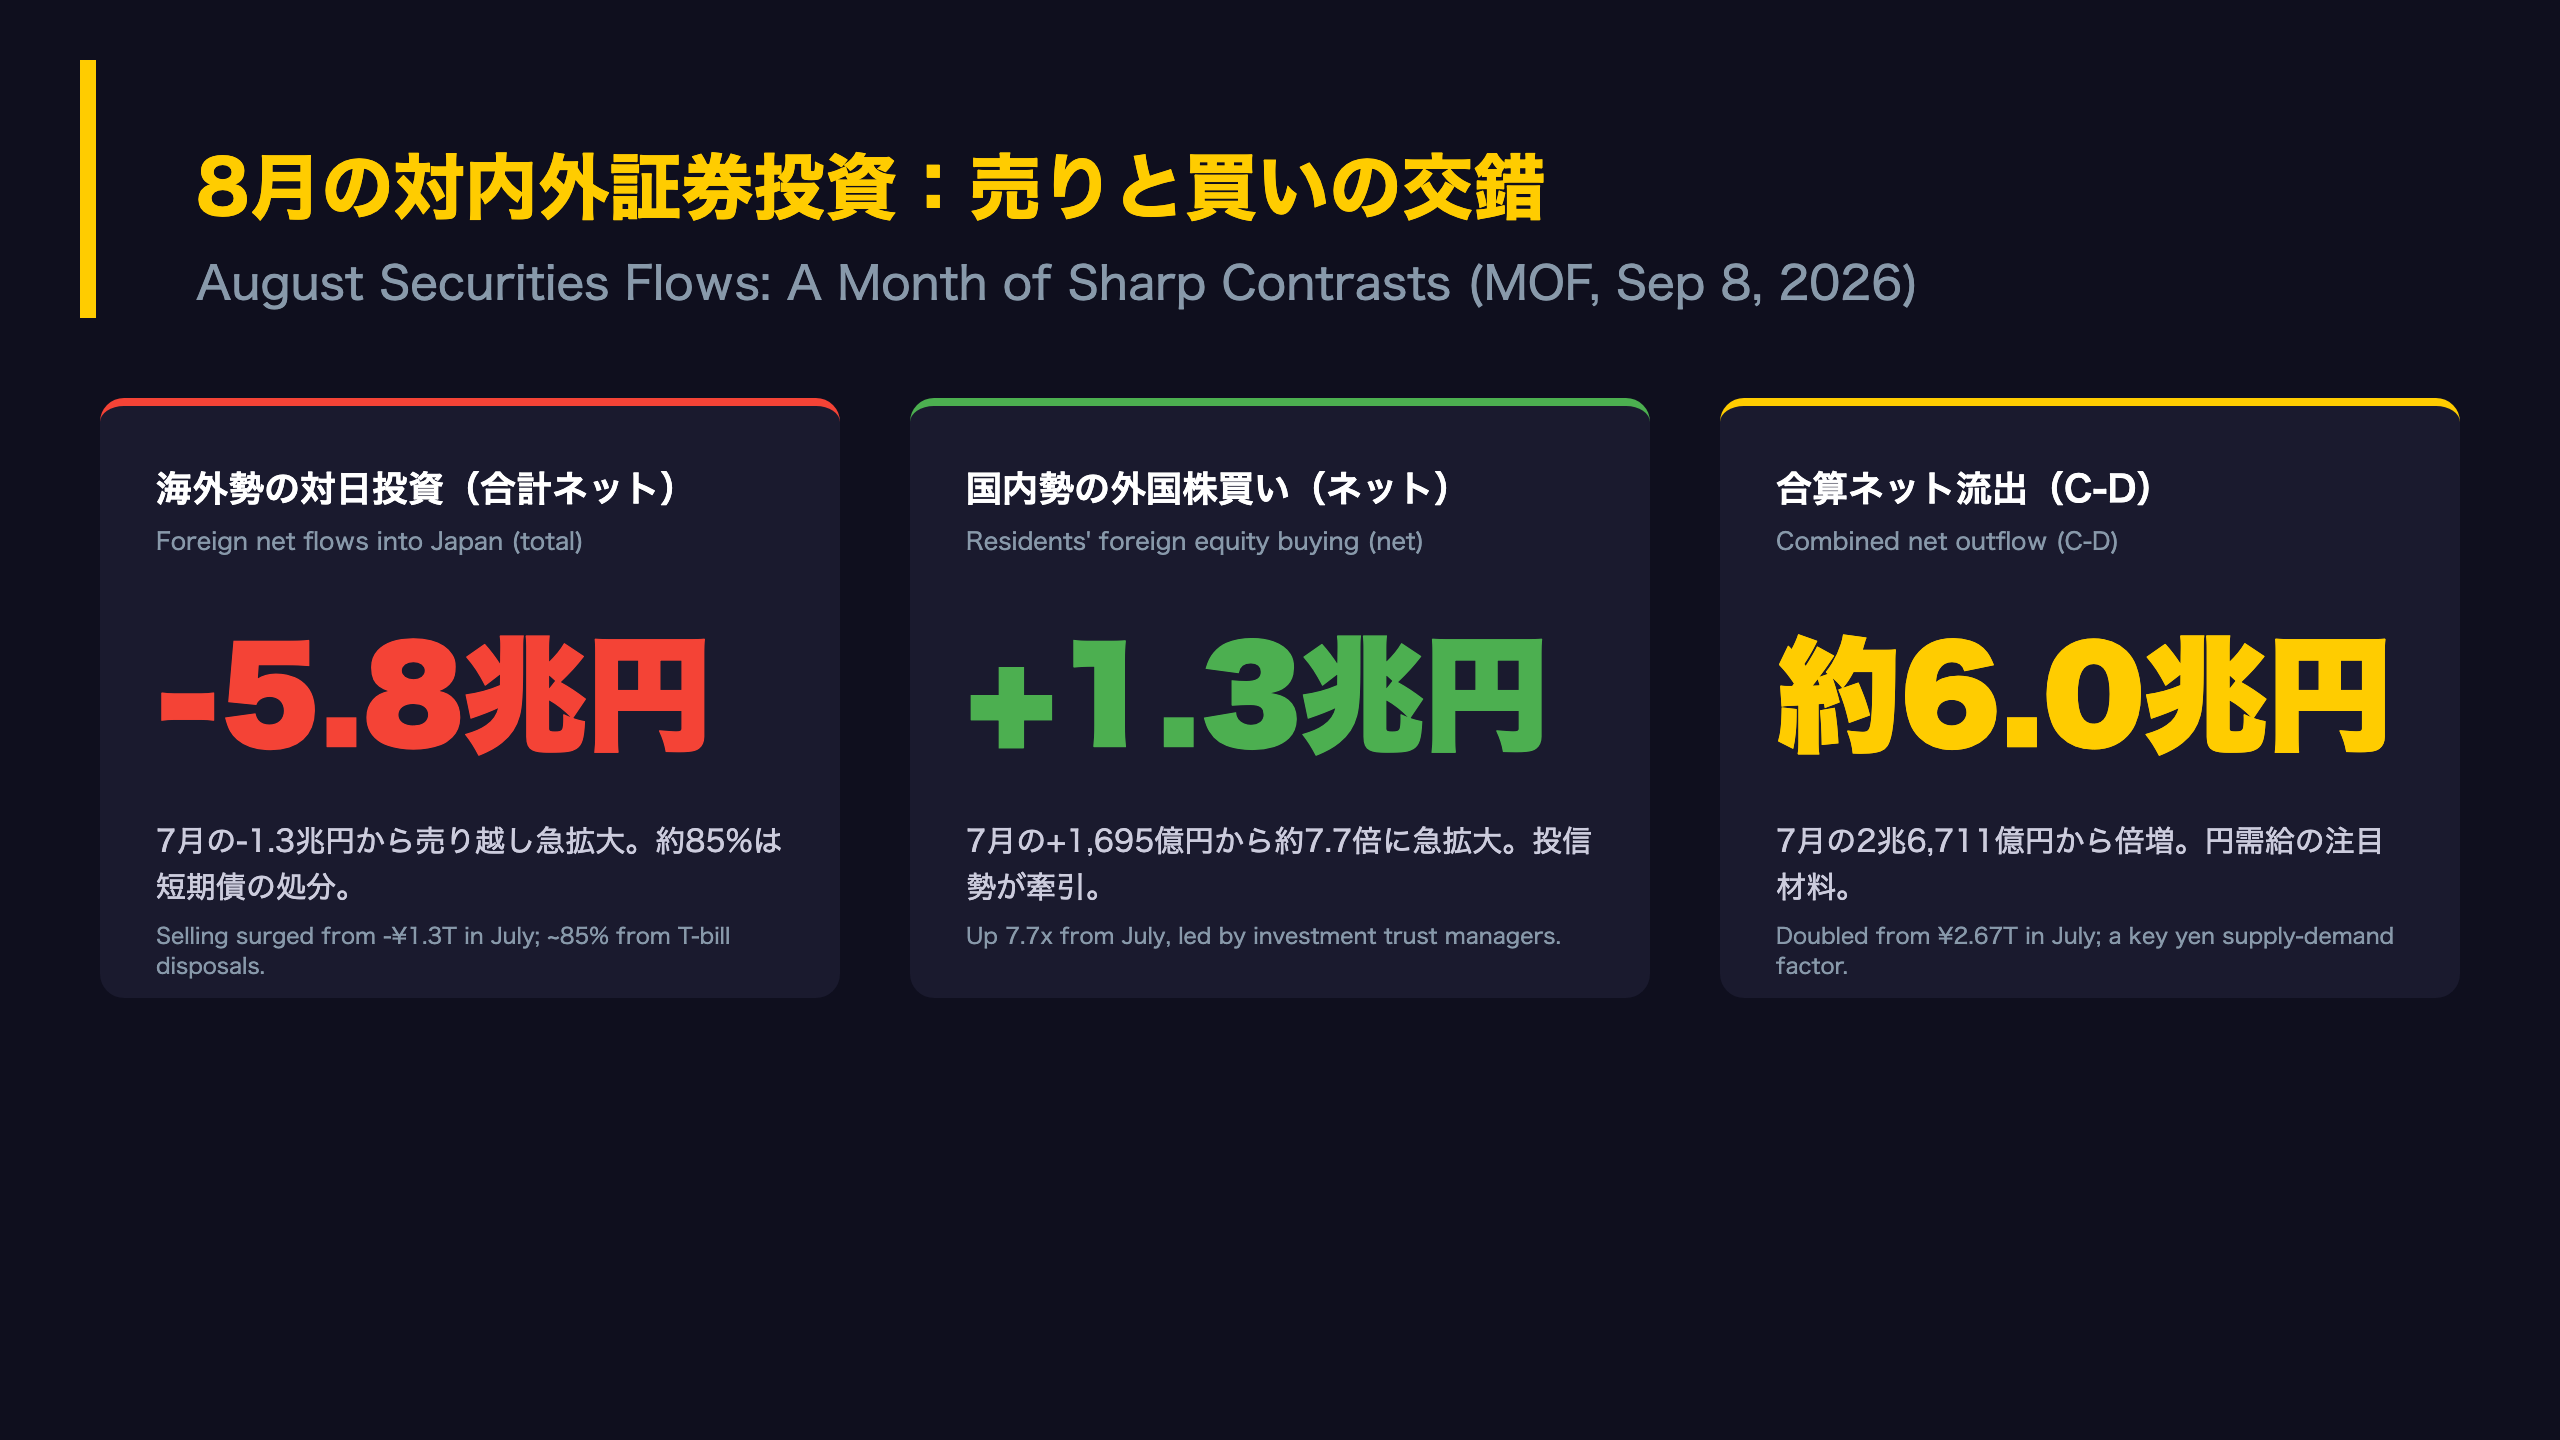
📉 Foreign investors sold a net ¥5.82 trillion of Japanese securities — driven by a ¥4.97T net disposal of short-term debt (T-bills), 3.8x July’s pace. Foreign flows into Japanese equities also flipped to a modest net sale.
📈 Meanwhile, Japanese residents bought a net ¥1.3T of foreign equities, led by investment trust managers — evidence that retail money continues shifting overseas via mutual funds.
💡 Combined net outflow doubled to roughly ¥6T, a potential yen headwind. But the exodus was front-loaded and faded within the month. Full sector-by-sector breakdown inside.
The Ultimate Summary:海外勢5.8兆円売り越し、国内勢は外株買い
Japan’s August Securities Flows: The Big Picture
Japan’s Ministry of Finance (MOF) publishes a monthly report titled \”International Transactions in Securities,\” compiled from designated major investors — banks, brokers, insurers, and asset managers. It is the most granular official window into cross-border portfolio flows in and out of Japan, conceptually similar to the US Treasury’s TIC data.
Headline numbers for August 2026
- Foreign investors sold a net ¥5.82 trillion (~$40B equivalent) of Japanese securities, versus a net sale of ¥1.31 trillion in July.
- The bulk — ¥4.97 trillion — came from short-term debt (T-bill) disposals, 3.8x July’s pace.
- Foreign flows into Japanese equities flipped from a ¥1.3 trillion net purchase in July to a modest ¥174 billion net sale.
- Japanese residents bought a net ¥1.3 trillion of foreign equities, up sharply from ¥170 billion in July.
Why it matters for global investors
Japanese T-bills are a favored vehicle for foreign investors running FX-hedged yen trades; large swings in this category often reflect money-market positioning rather than long-term conviction. The contrast — foreigners trimming yen paper while Japanese households keep exporting capital via equity funds — matters for USD/JPY supply-demand dynamics, as both legs point in the same direction: out of the yen. Subsequent sections dissect the intra-month pattern and the sector breakdown to judge whether this is noise or signal.
最大の特異点:海外勢の短期債売却5兆円
Dissecting the ¥5 Trillion T-Bill Exodus
A heavily front-loaded sell-off
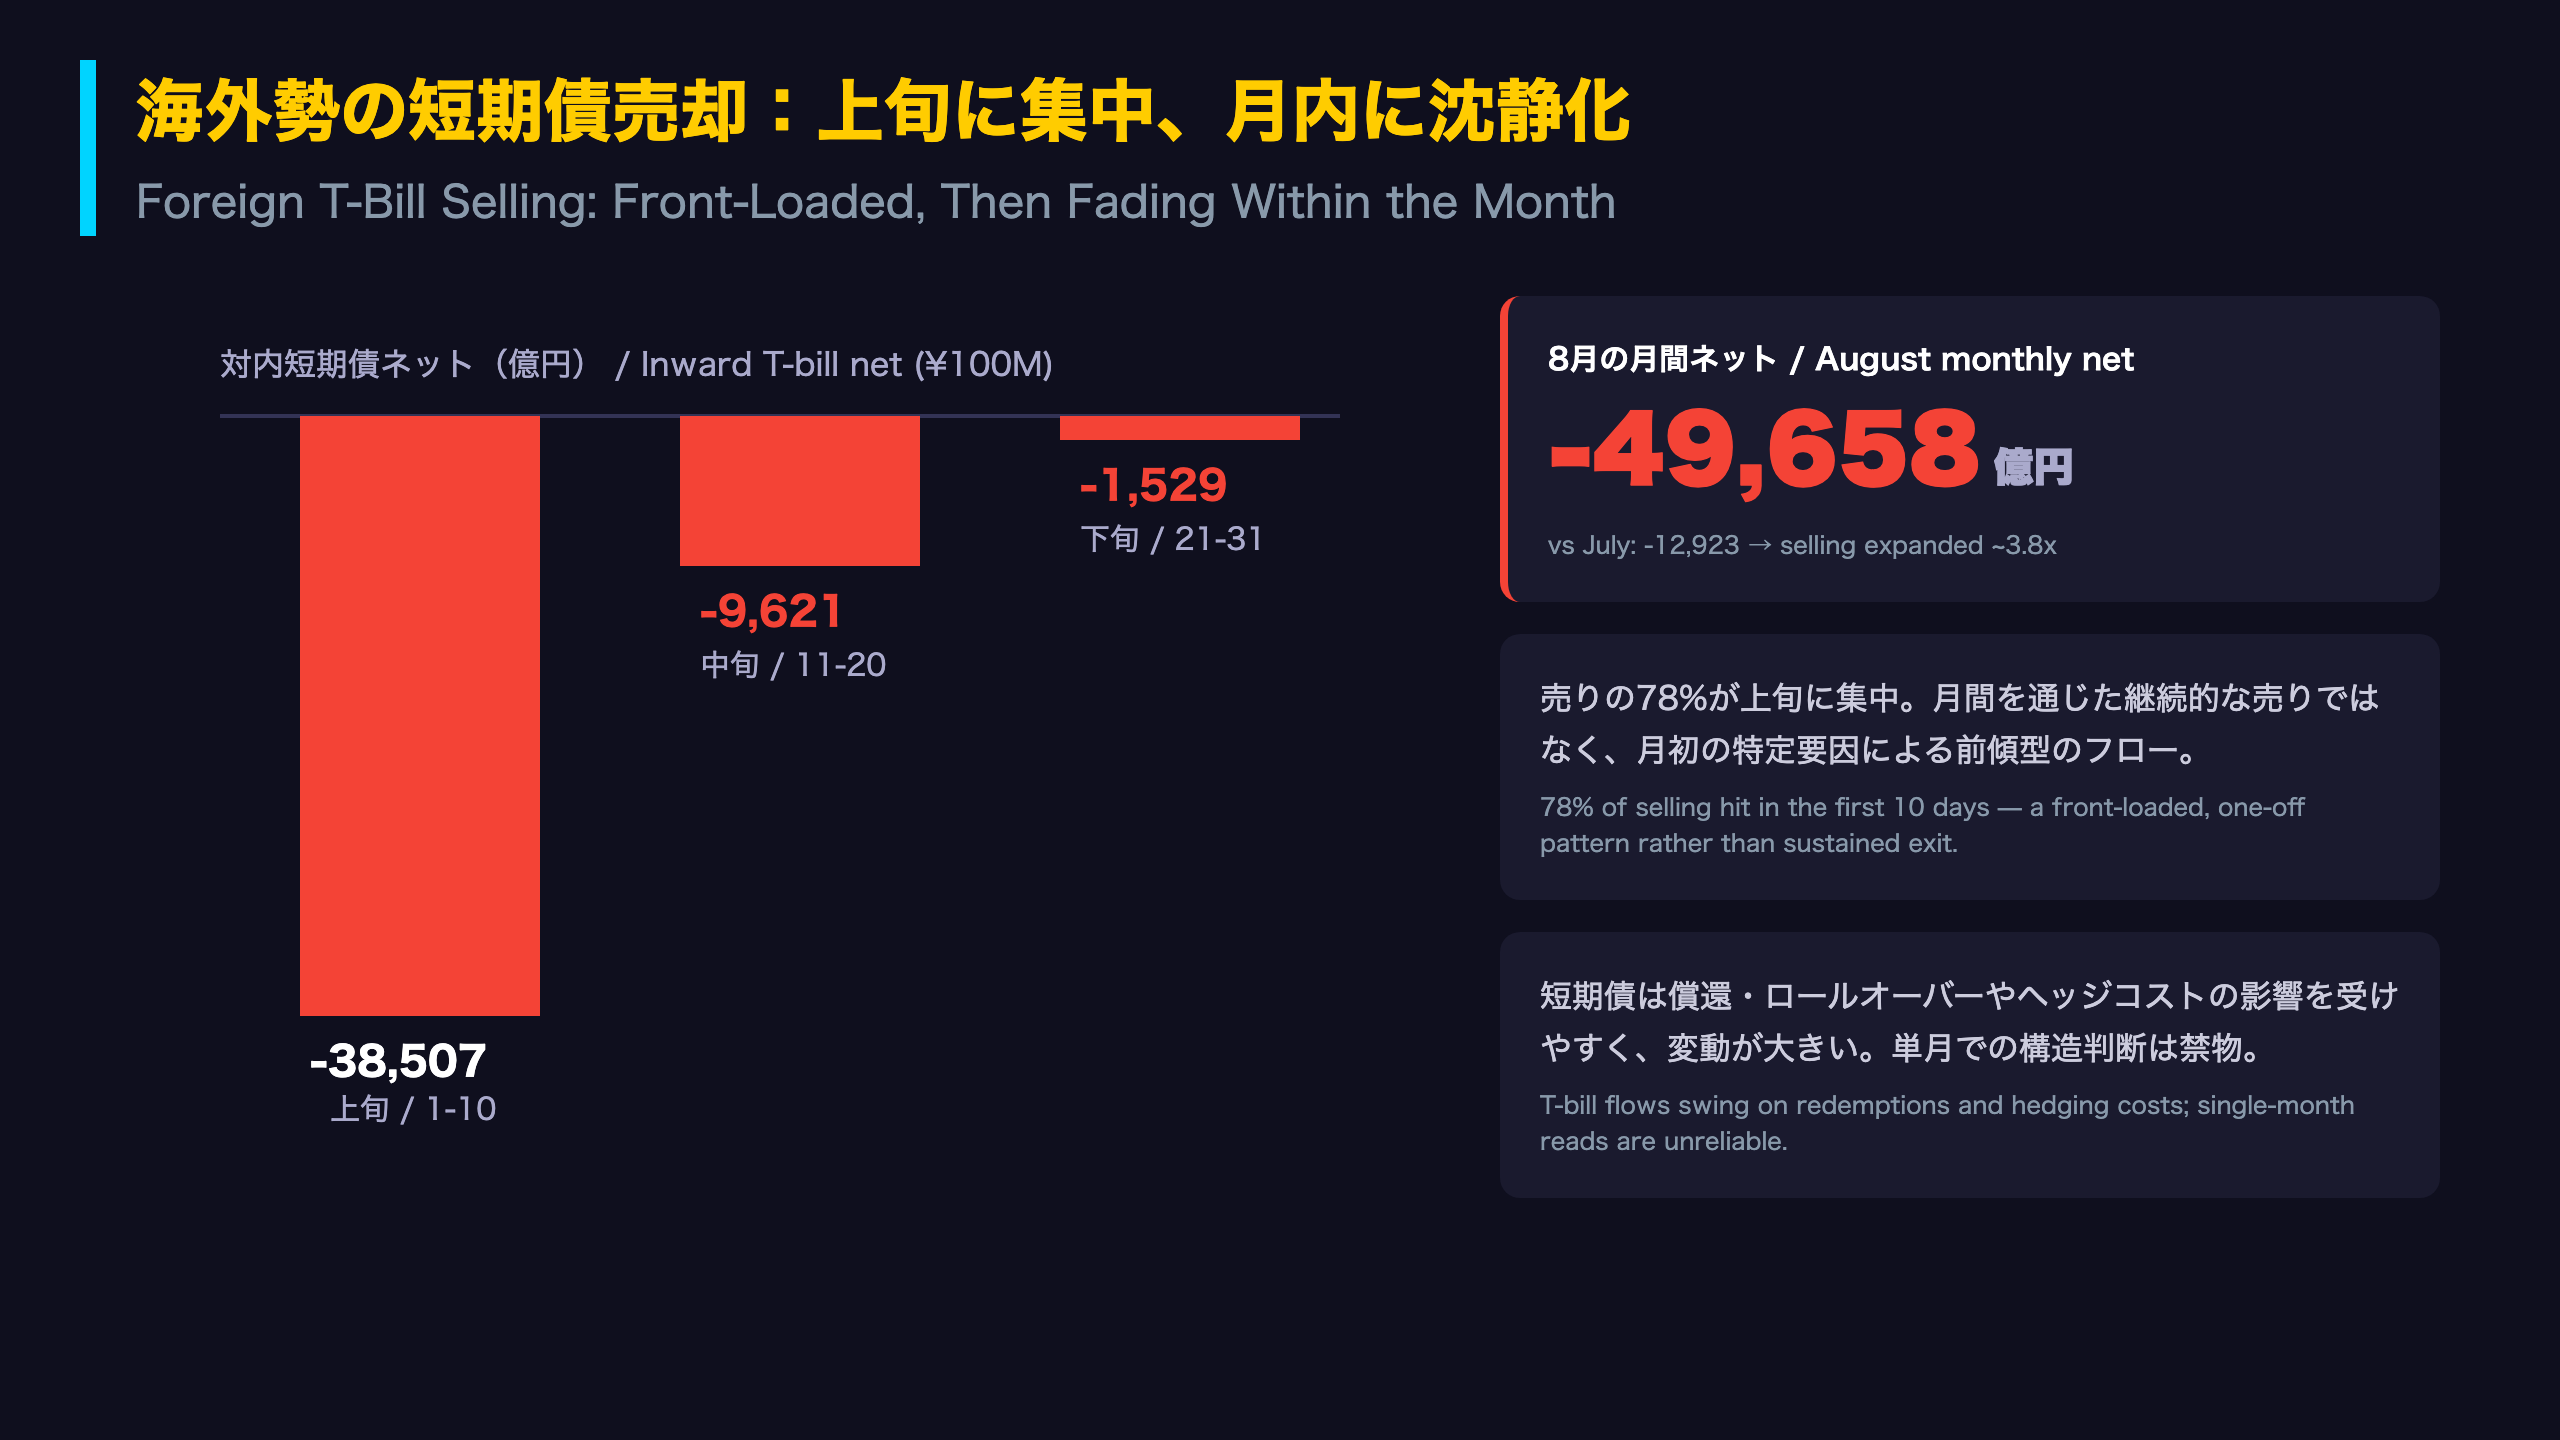
The ten-day breakdown of foreign net flows into Japanese short-term debt reveals a striking pattern:
- Aug 1–10: -¥3.85 trillion (78% of the month’s total selling)
- Aug 11–20: -¥962 billion
- Aug 21–31: -¥153 billion
The selling was concentrated at the start of the month and had nearly vanished by month-end. This looks less like a sustained exit and more like a one-off adjustment that ran its course.
Why foreigners hold Japanese T-bills in the first place
Foreign investors — particularly those running FX-hedged strategies — routinely swap dollars into yen and park the proceeds in Japanese treasury discount bills (TDBs). These positions are highly sensitive to FX hedging costs, cross-currency basis, and redemption schedules rather than long-term views on Japan. This is a crucial distinction from, say, foreign selling of 10-year JGBs, which would signal conviction-driven repositioning. US readers can think of this as the difference between money-market flows and duration flows in TIC data.
Scale context
Gross activity dwarfs the net figure: foreigners bought ¥13.8 trillion and sold ¥18.8 trillion of short-term paper during the month, underscoring how fast this book turns over. July also saw net selling of ¥1.29 trillion, so August marks the second consecutive month of disposals — but the step-change in magnitude is what stands out. Whether this reflects shifting swap economics or temporary positioning cannot be determined from a single month’s data.
海外勢の日本株:売り越し転換も下旬は買い戻し
Testing the \”Foreign Exit from Japan\” Narrative
Equities: a rounding error, not a retreat
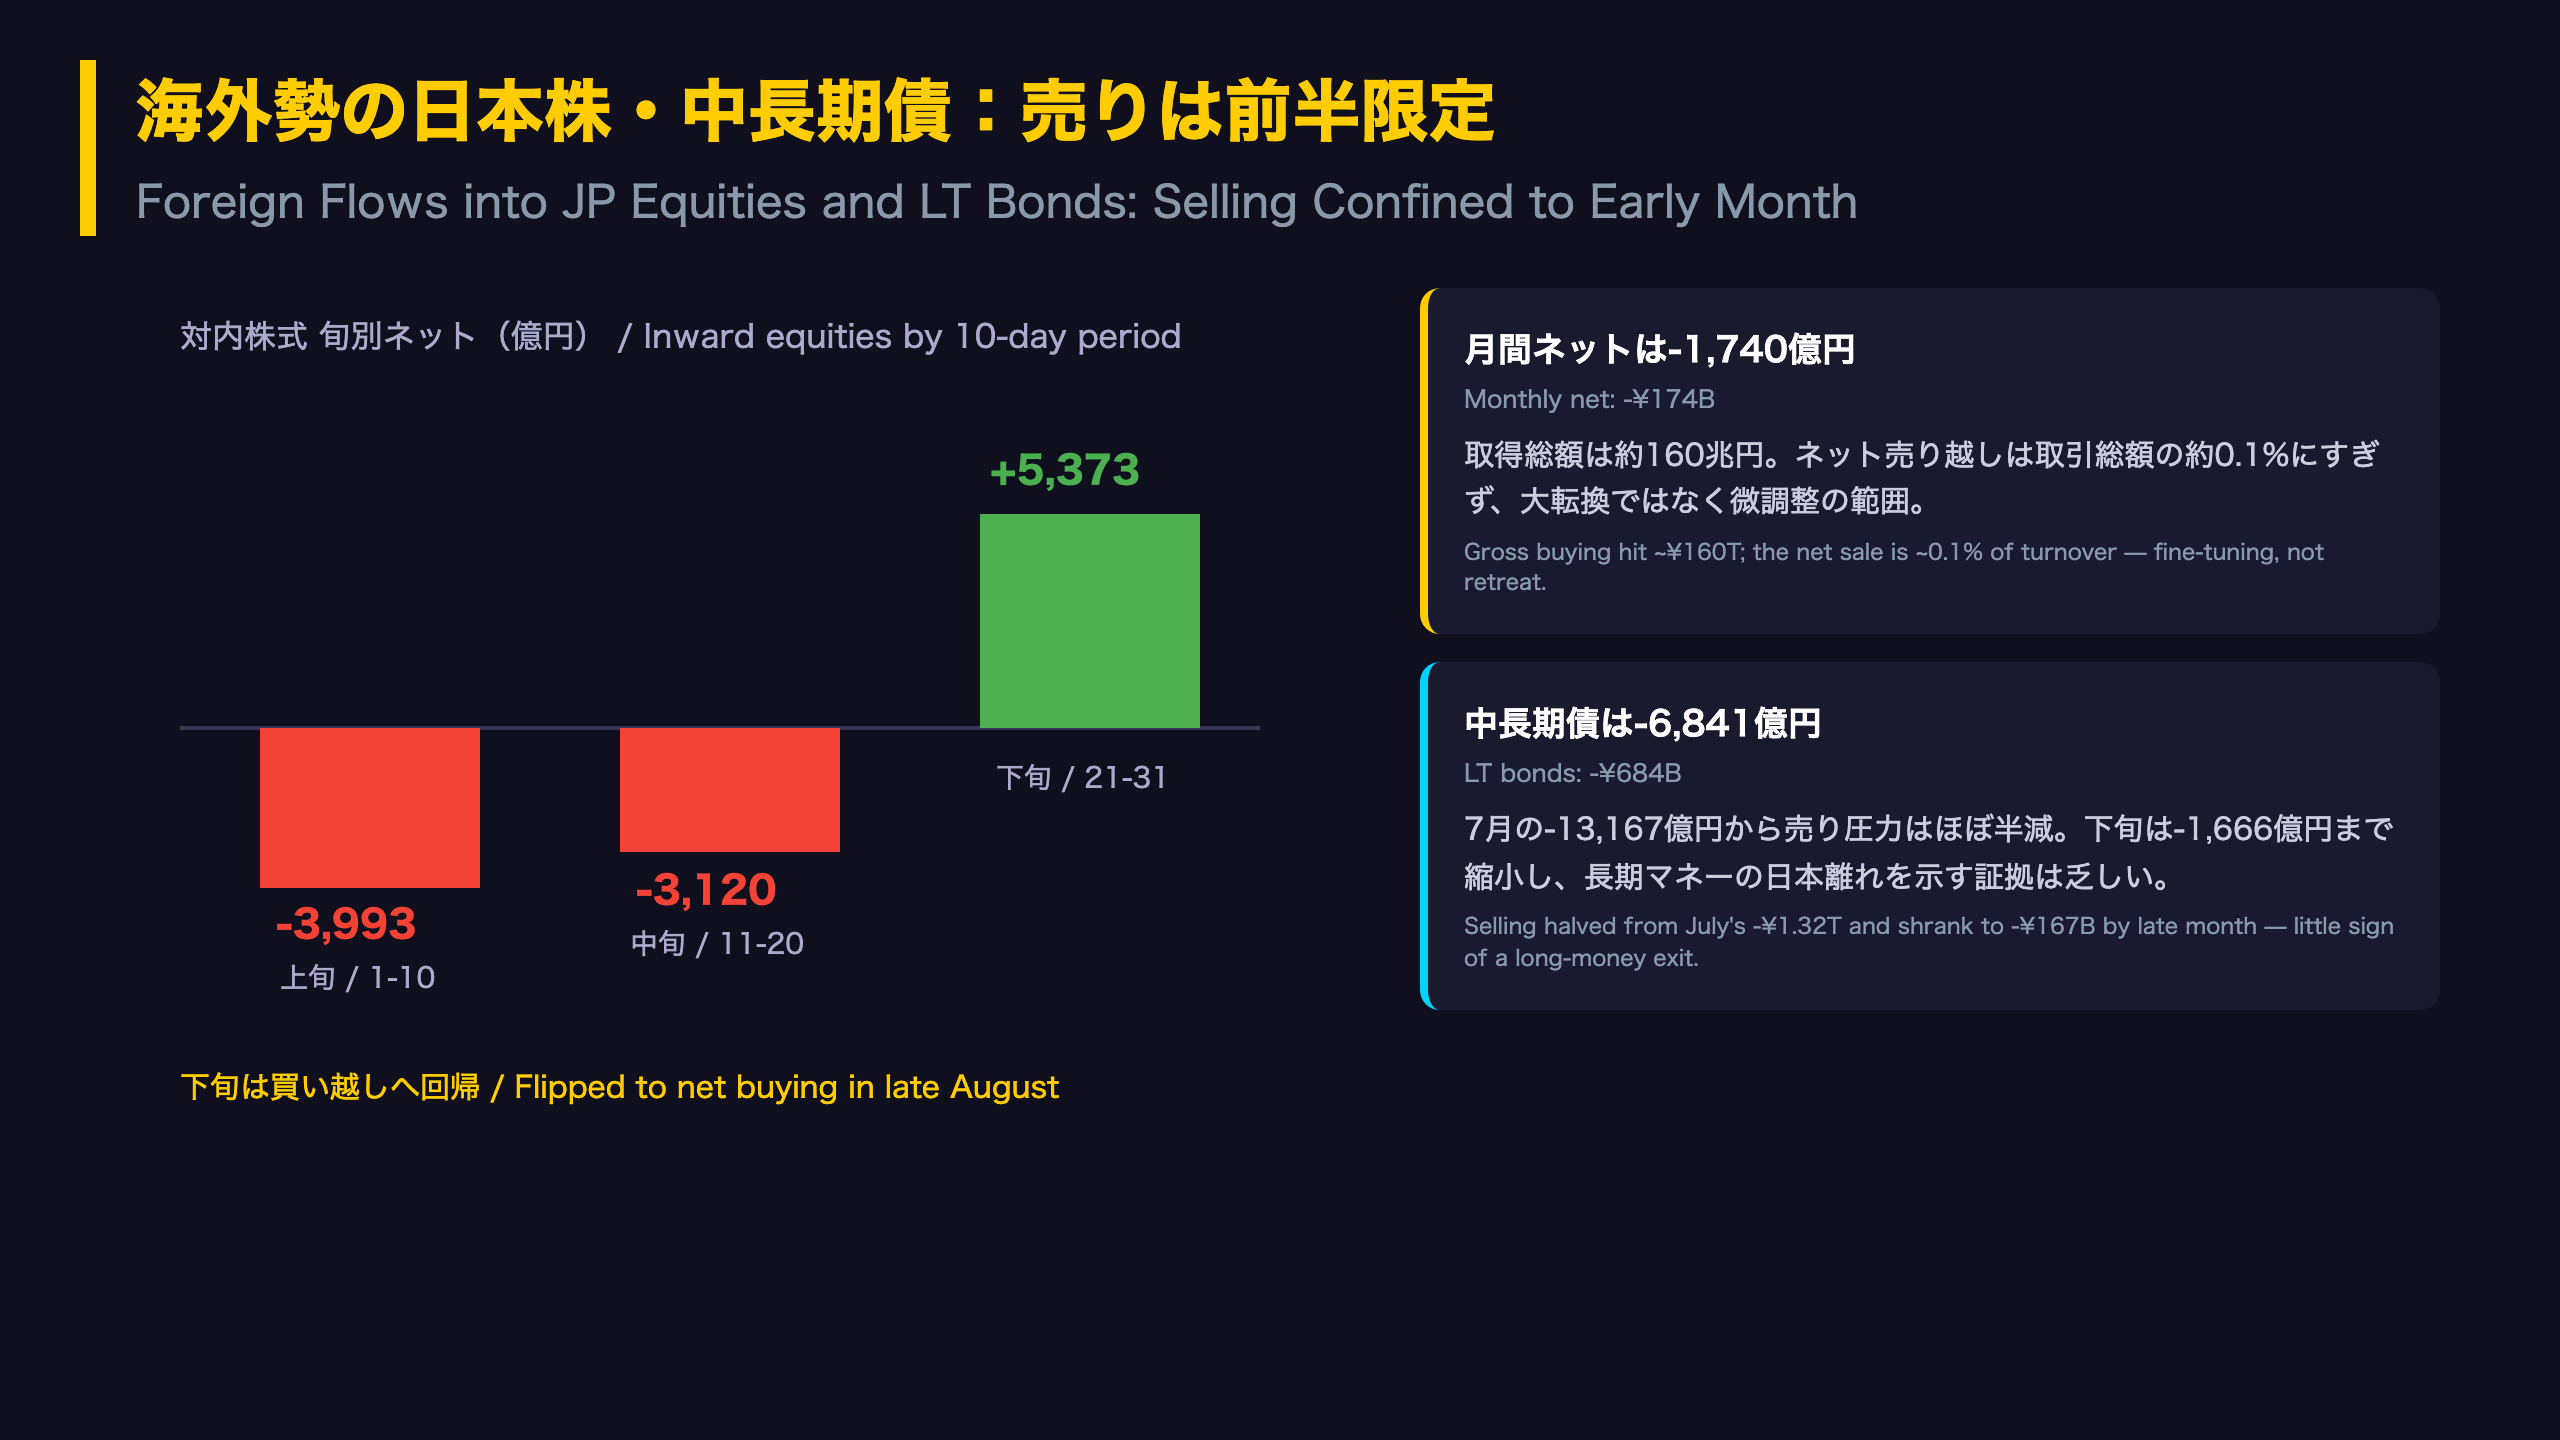
Foreign net flows into Japanese equities turned negative in August at -¥174 billion, after a ¥1.3 trillion net purchase in July. The headline flip sounds dramatic — until you look at gross turnover. Foreigners bought ¥160 trillion and sold ¥160.1 trillion of Japanese equities during the month. The net sale amounts to roughly 0.1% of gross activity. For comparison, this is akin to reading a $1 billion net flow against a trillion-dollar trading book: statistically real, economically marginal.
The V-shaped intra-month pattern
- Aug 1–10: -¥399B
- Aug 11–20: -¥312B
- Aug 21–31: +¥537B (net buying)
Foreigners returned as buyers in late August, meaning the selling was confined to the first two-thirds of the month. Whether this late-month bid persists into September is the key watch item for Nikkei/TOPIX supply-demand.
Long-term bonds: pressure easing, not building
Foreign net sales of Japanese long-term debt (mostly JGBs) came to ¥684 billion — the second straight month of disposals, but roughly half of July’s ¥1.32 trillion. By late August, selling had shrunk to ¥167 billion. Against the backdrop of BOJ policy normalization debates, the absence of accelerating foreign JGB selling is notable.
Balanced read
Bearish: all three inward categories (equities, LT bonds, T-bills) were net sold. Bullish: the long-duration selling was small and shrinking, and equities flipped to net buying at month-end. The data does not support a \”wholesale exit from Japan\” narrative.
国内勢の対外投資:外株買い1.3兆円も月内で減速
Japanese Outward Investment: Big Equity Buying, Fading Momentum
Foreign equities: the standout on the asset side
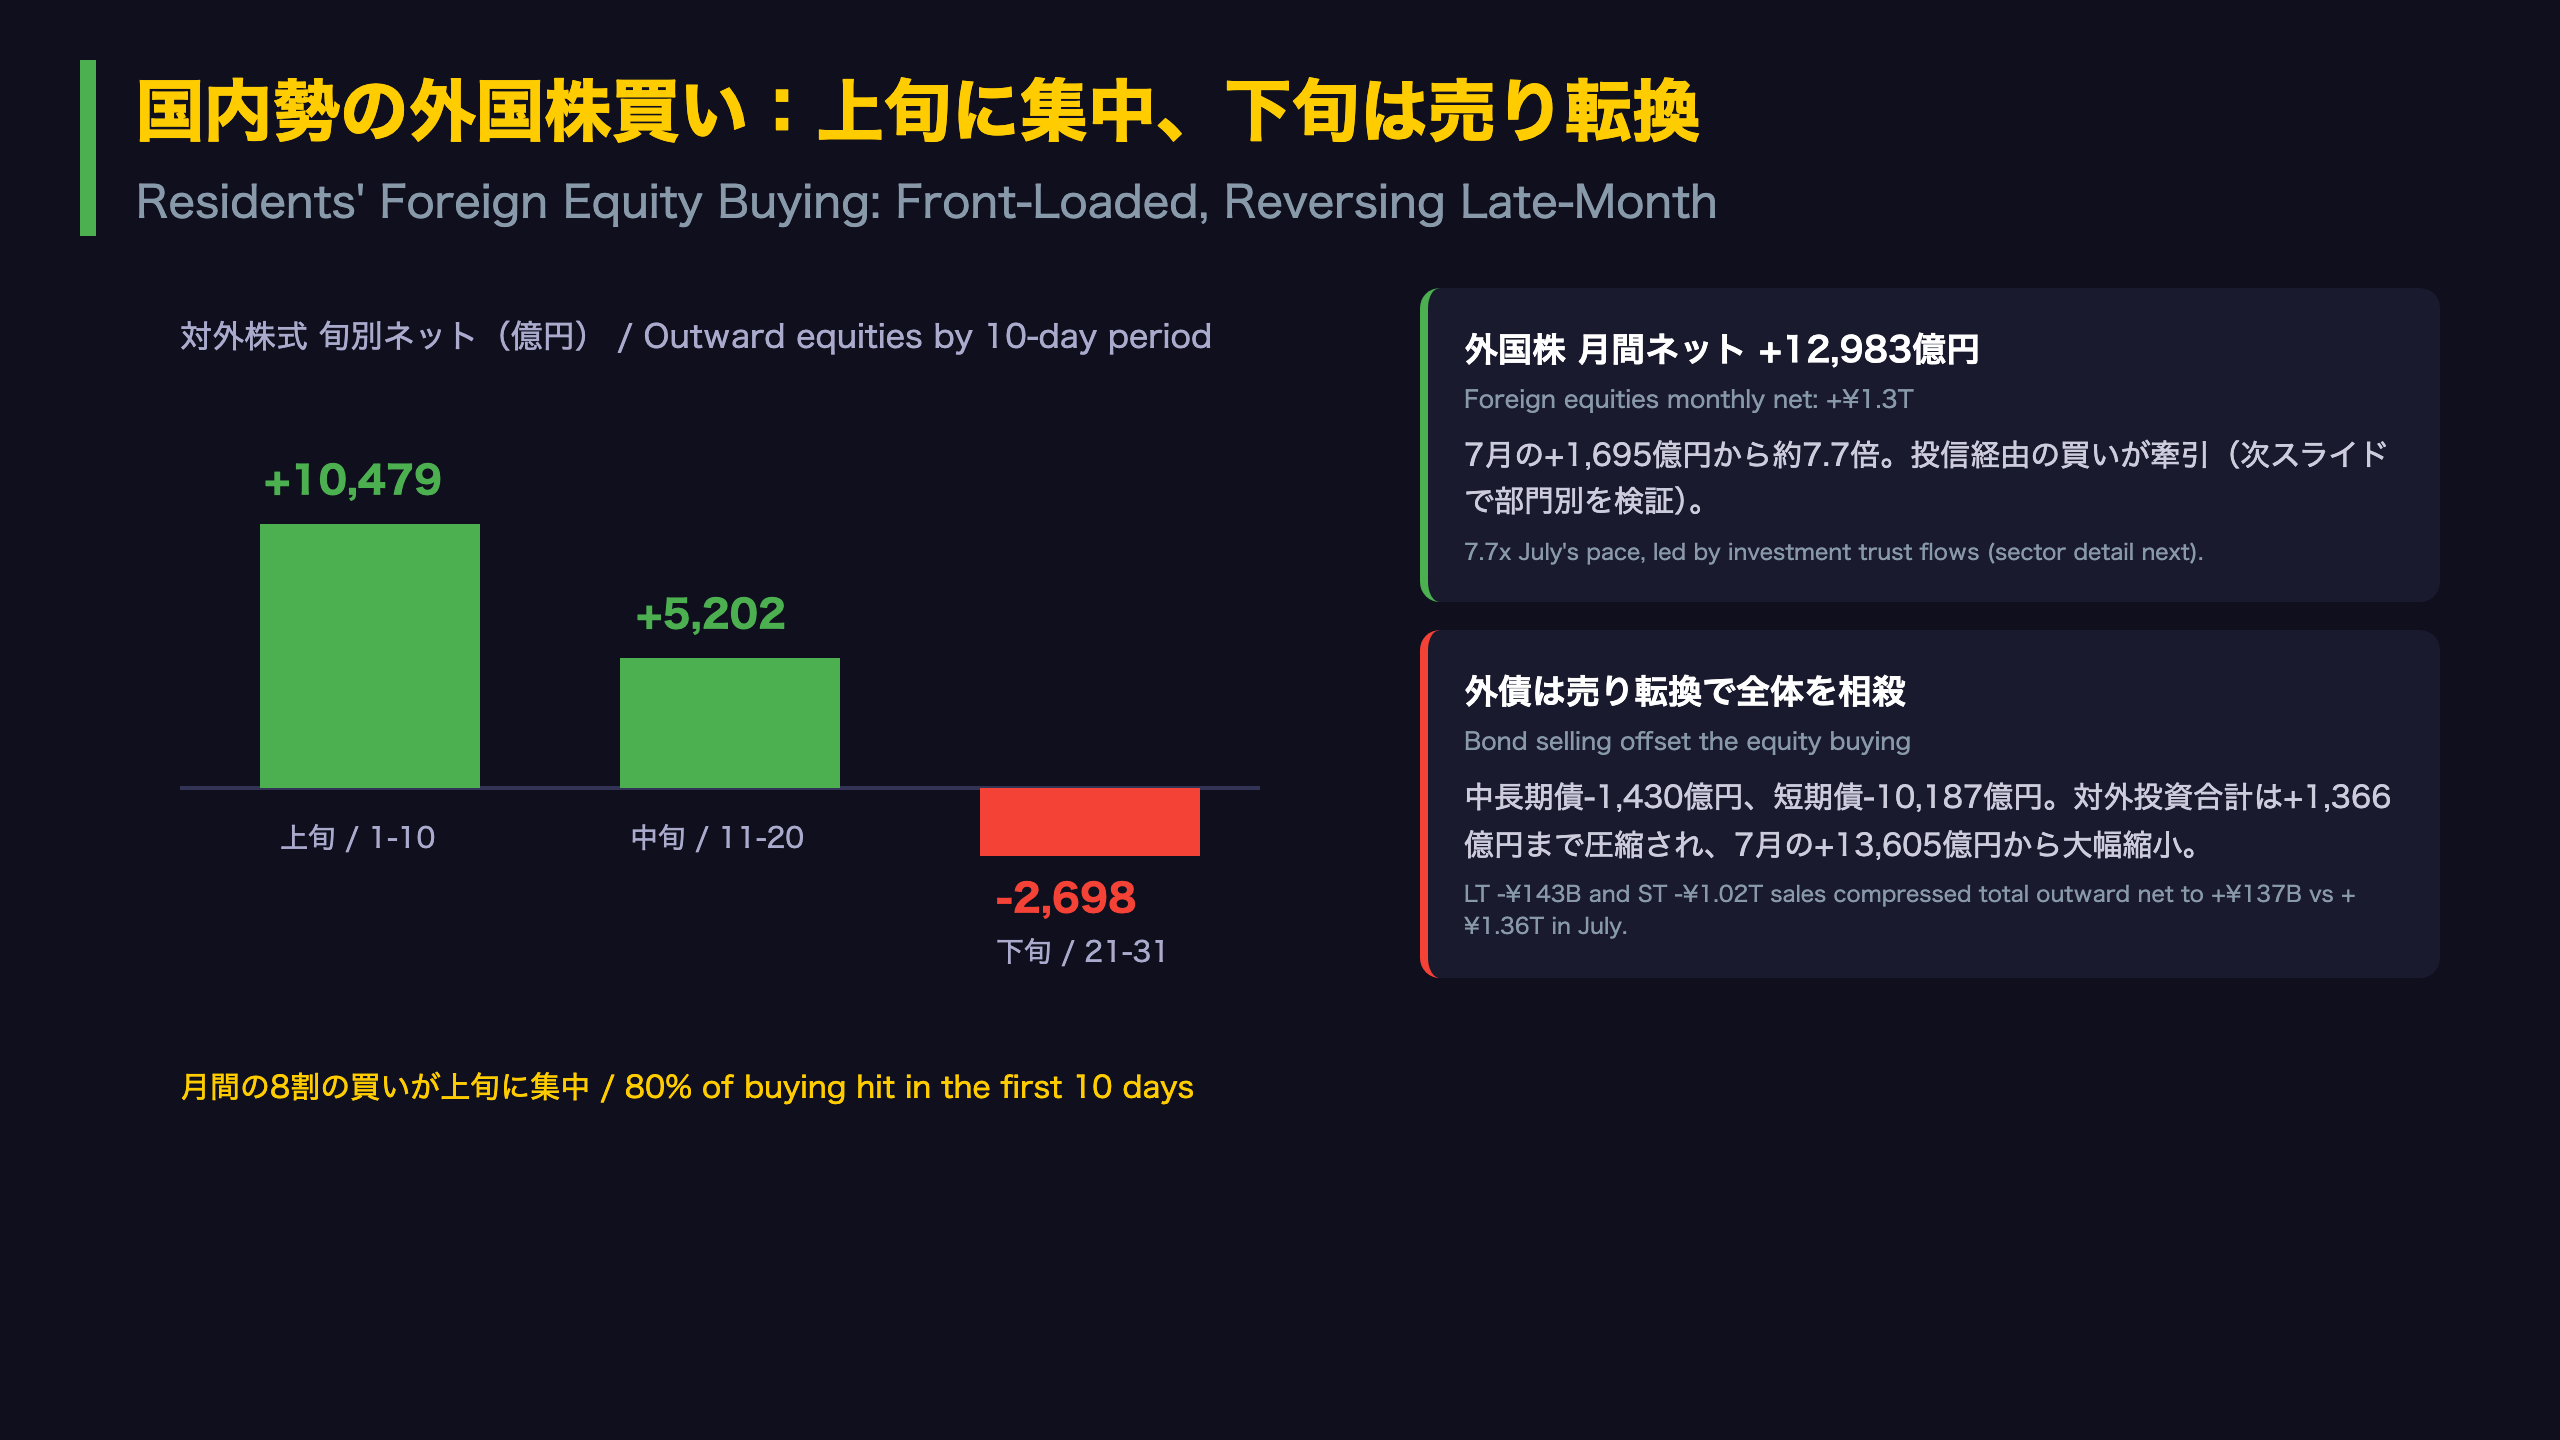
Japanese residents’ net purchases of foreign equities and investment fund shares hit ¥1.3 trillion in August — 7.7x July’s pace. For context, this data captures flows from Japan’s designated major investors (banks, insurers, brokers, and crucially, investment trust managers who channel household money into products like S&P 500 index funds).
The ten-day breakdown shows clear deceleration:
– Aug 1–10: +¥1.05T (80% of the month’s buying)
– Aug 11–20: +¥520B
– Aug 21–31: -¥270B (net selling)
A recurring feature of Japanese retail flows is month-start concentration, when monthly investment plans (tsumitate) execute. Whether the late-month selling represents genuine fatigue or just calendar effects needs September’s data to resolve.
Foreign bonds: both categories flipped to net sales
- Long-term debt: -¥143B (July: +¥366B)
- Short-term debt: -¥1.02T (July: +¥825B)
Both foreign bond categories reversed from purchases to sales, compressing total outward investment to just +¥137B versus +¥1.36T in July.
Market angle
For USD/JPY watchers: sustained Japanese equity outflows are structurally yen-negative (unhedged retail flows), while institutional bond selling can be yen-neutral or positive depending on hedging. The mix shift in August — more retail equity, less institutional bond — is the detail worth tracking.
部門別分析:買いの投信・金商、売りの銀行・年金
Who Bought, Who Sold: The Sector Breakdown
The MOF report includes a valuable appendix breaking outward investment down by investor type — a level of granularity rarely available in other countries’ flow data.
The buyers: retail-linked vehicles and broker-dealers
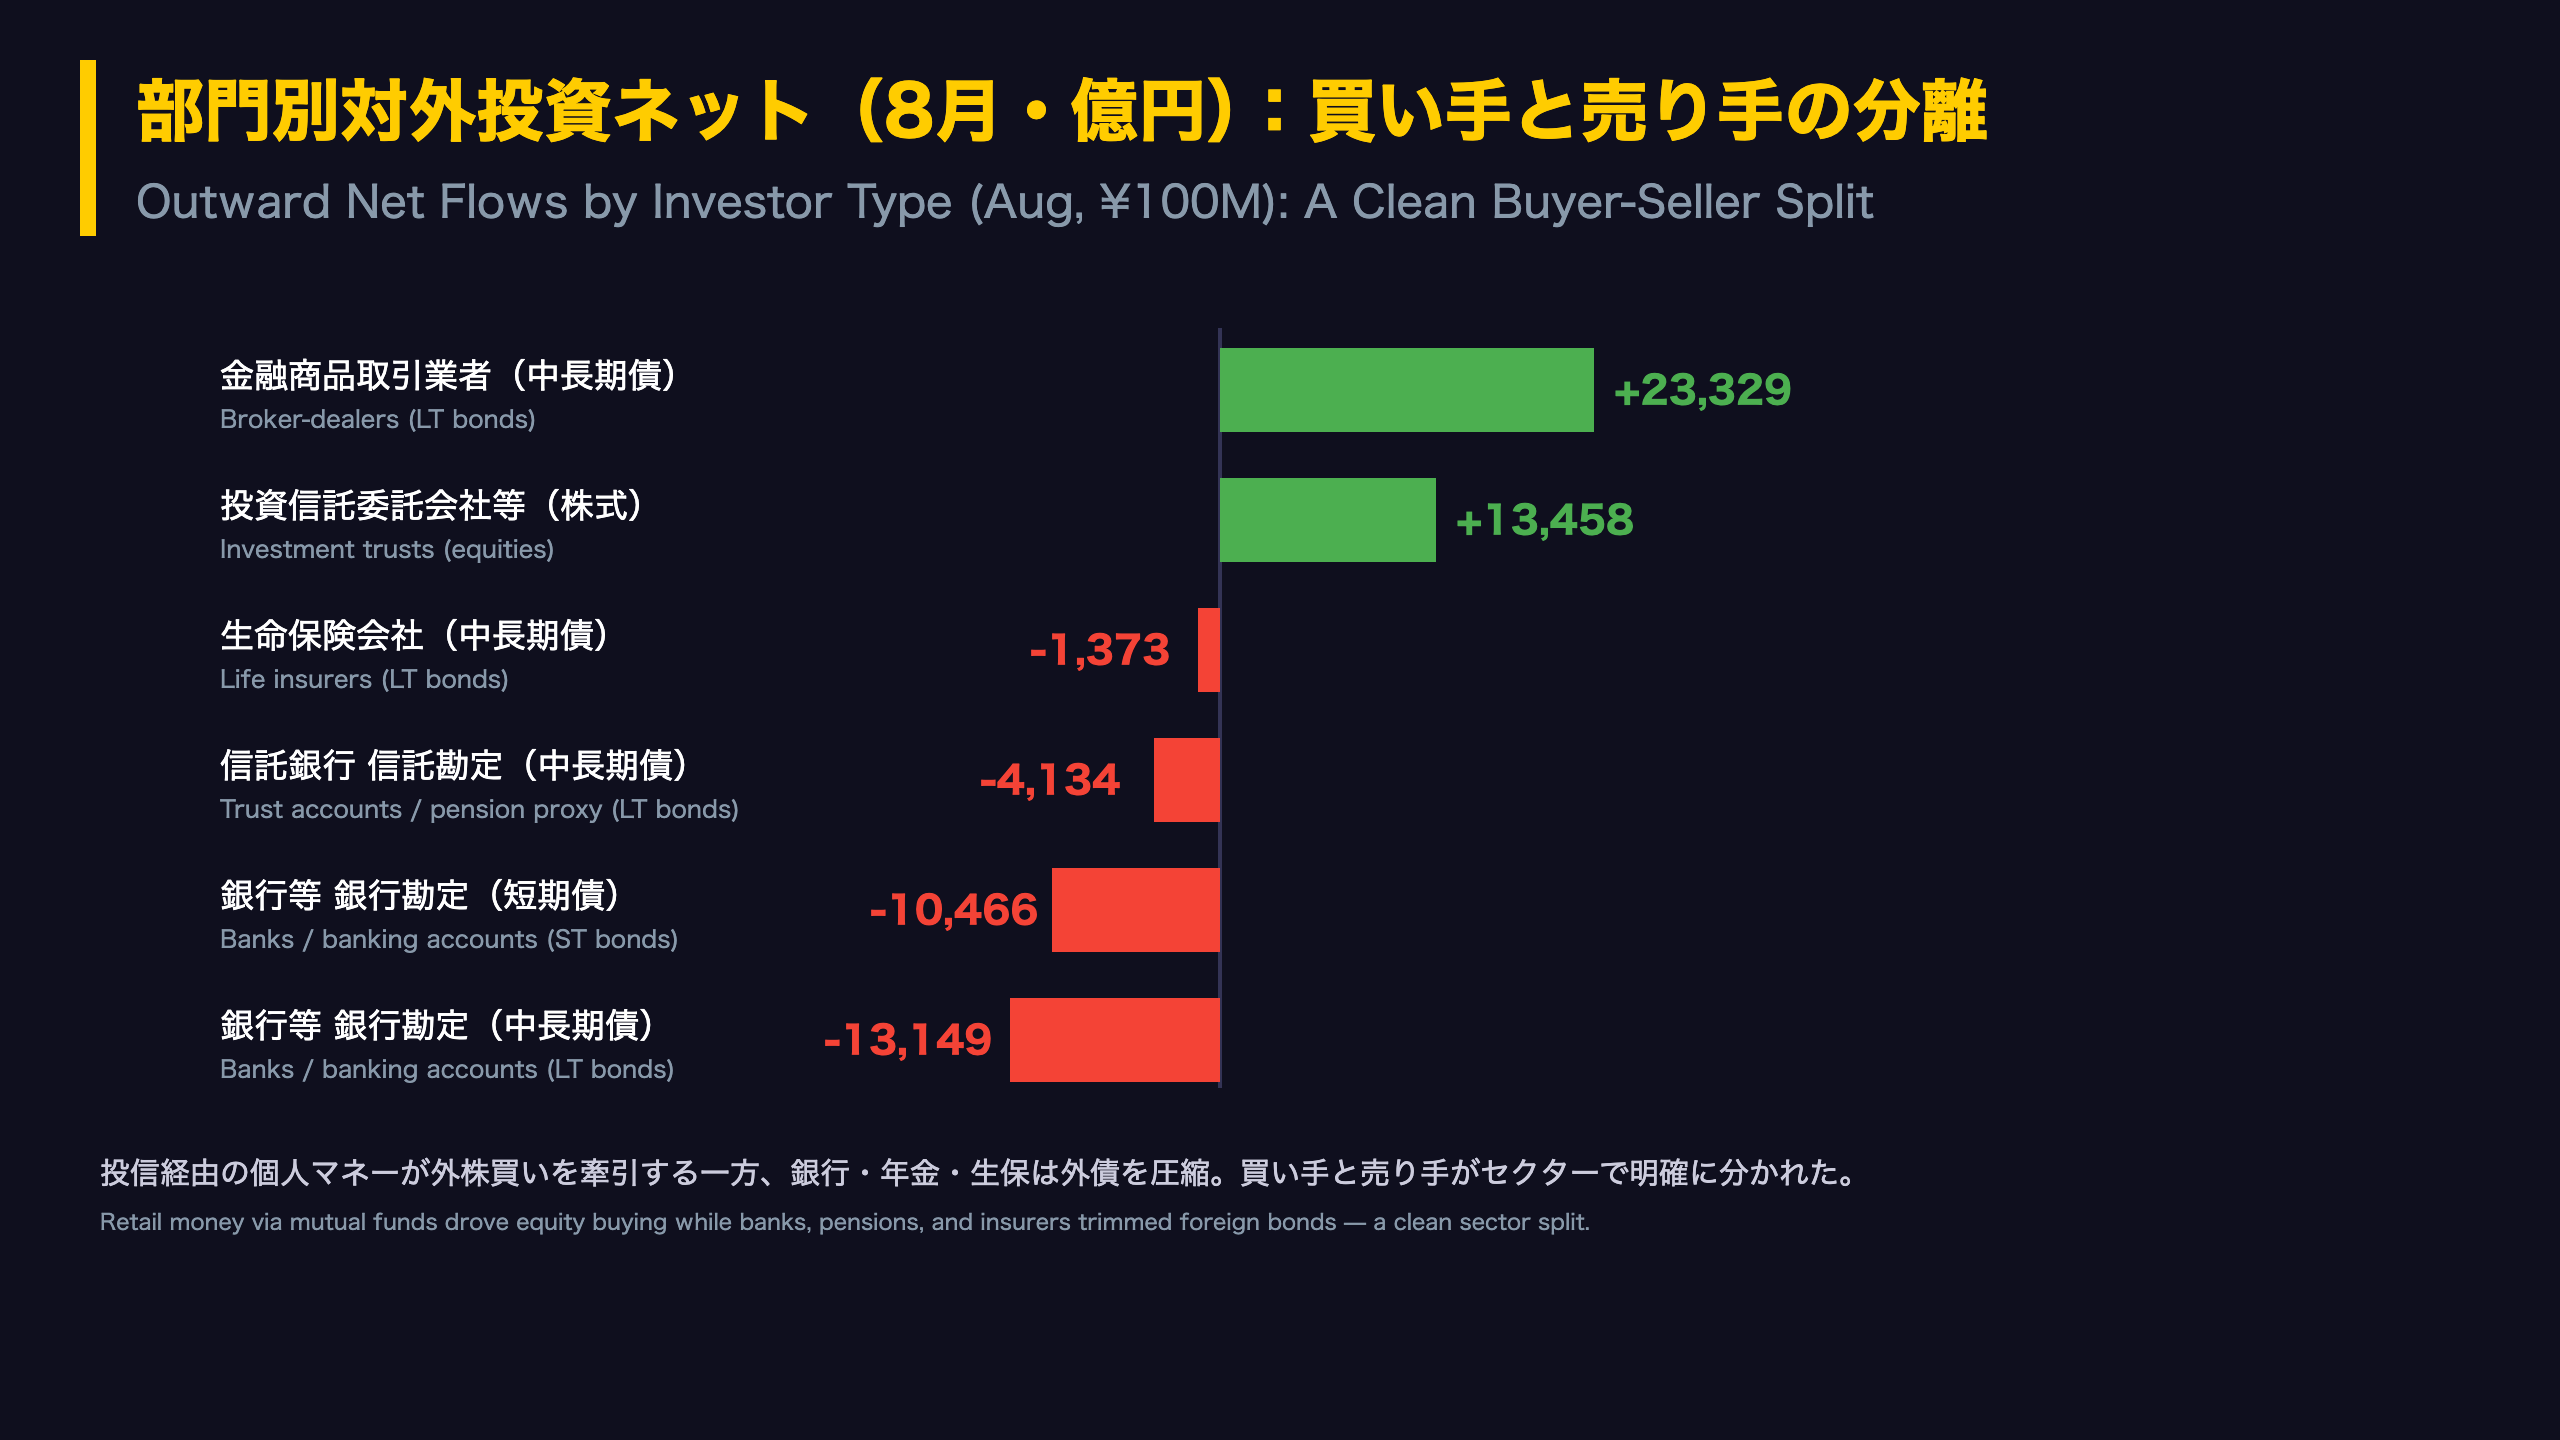
- Investment trust management companies: +¥1.35T in foreign equities — the second straight month above ¥1.2T. These firms manage Japan’s mutual funds, the primary vehicle through which households invest abroad (think monthly contributions into S&P 500 index funds under Japan’s NISA-style tax-advantaged accounts). Two consecutive months of trillion-yen buying suggests the structural retail shift into overseas equities remains intact.
- Financial instruments firms (broker-dealers): +¥2.33T in foreign long-term bonds, likely reflecting dealer inventory and client-driven positioning.
The sellers: banks, pensions, insurers
- Banks (banking accounts): -¥1.31T in foreign LT bonds and -¥1.05T in short-term paper
- Deposit-taking institutions overall: -¥3.43T net
- Trust banks (trust accounts) — the standard proxy for Japanese pension money: -¥413B in foreign LT bonds
- Life insurers: -¥137B in foreign LT bonds
Why this split matters
Bank selling of foreign bonds is often FX-hedged and thus yen-neutral, while retail equity buying via mutual funds is typically unhedged and yen-negative. The August mix — unhedged equity outflows expanding while hedged bond positions shrink — is a subtle but meaningful configuration for USD/JPY. Note also the whipsaw: banks were net buyers of ¥692B in July before swinging to heavy sales in August, a ¥3.6T swing whose motivation the source document does not explain.
総括:ネット流出6兆円の質と円需給への含意
Judging the Quality of a ¥6 Trillion Outflow
How to read the net flow metric
The MOF report’s \”Total Net\” figure (C minus D) subtracts non-residents’ net purchases of Japanese securities from residents’ net purchases of foreign securities. A positive number means net capital left Japan via portfolio channels — directionally yen-negative on supply-demand grounds.
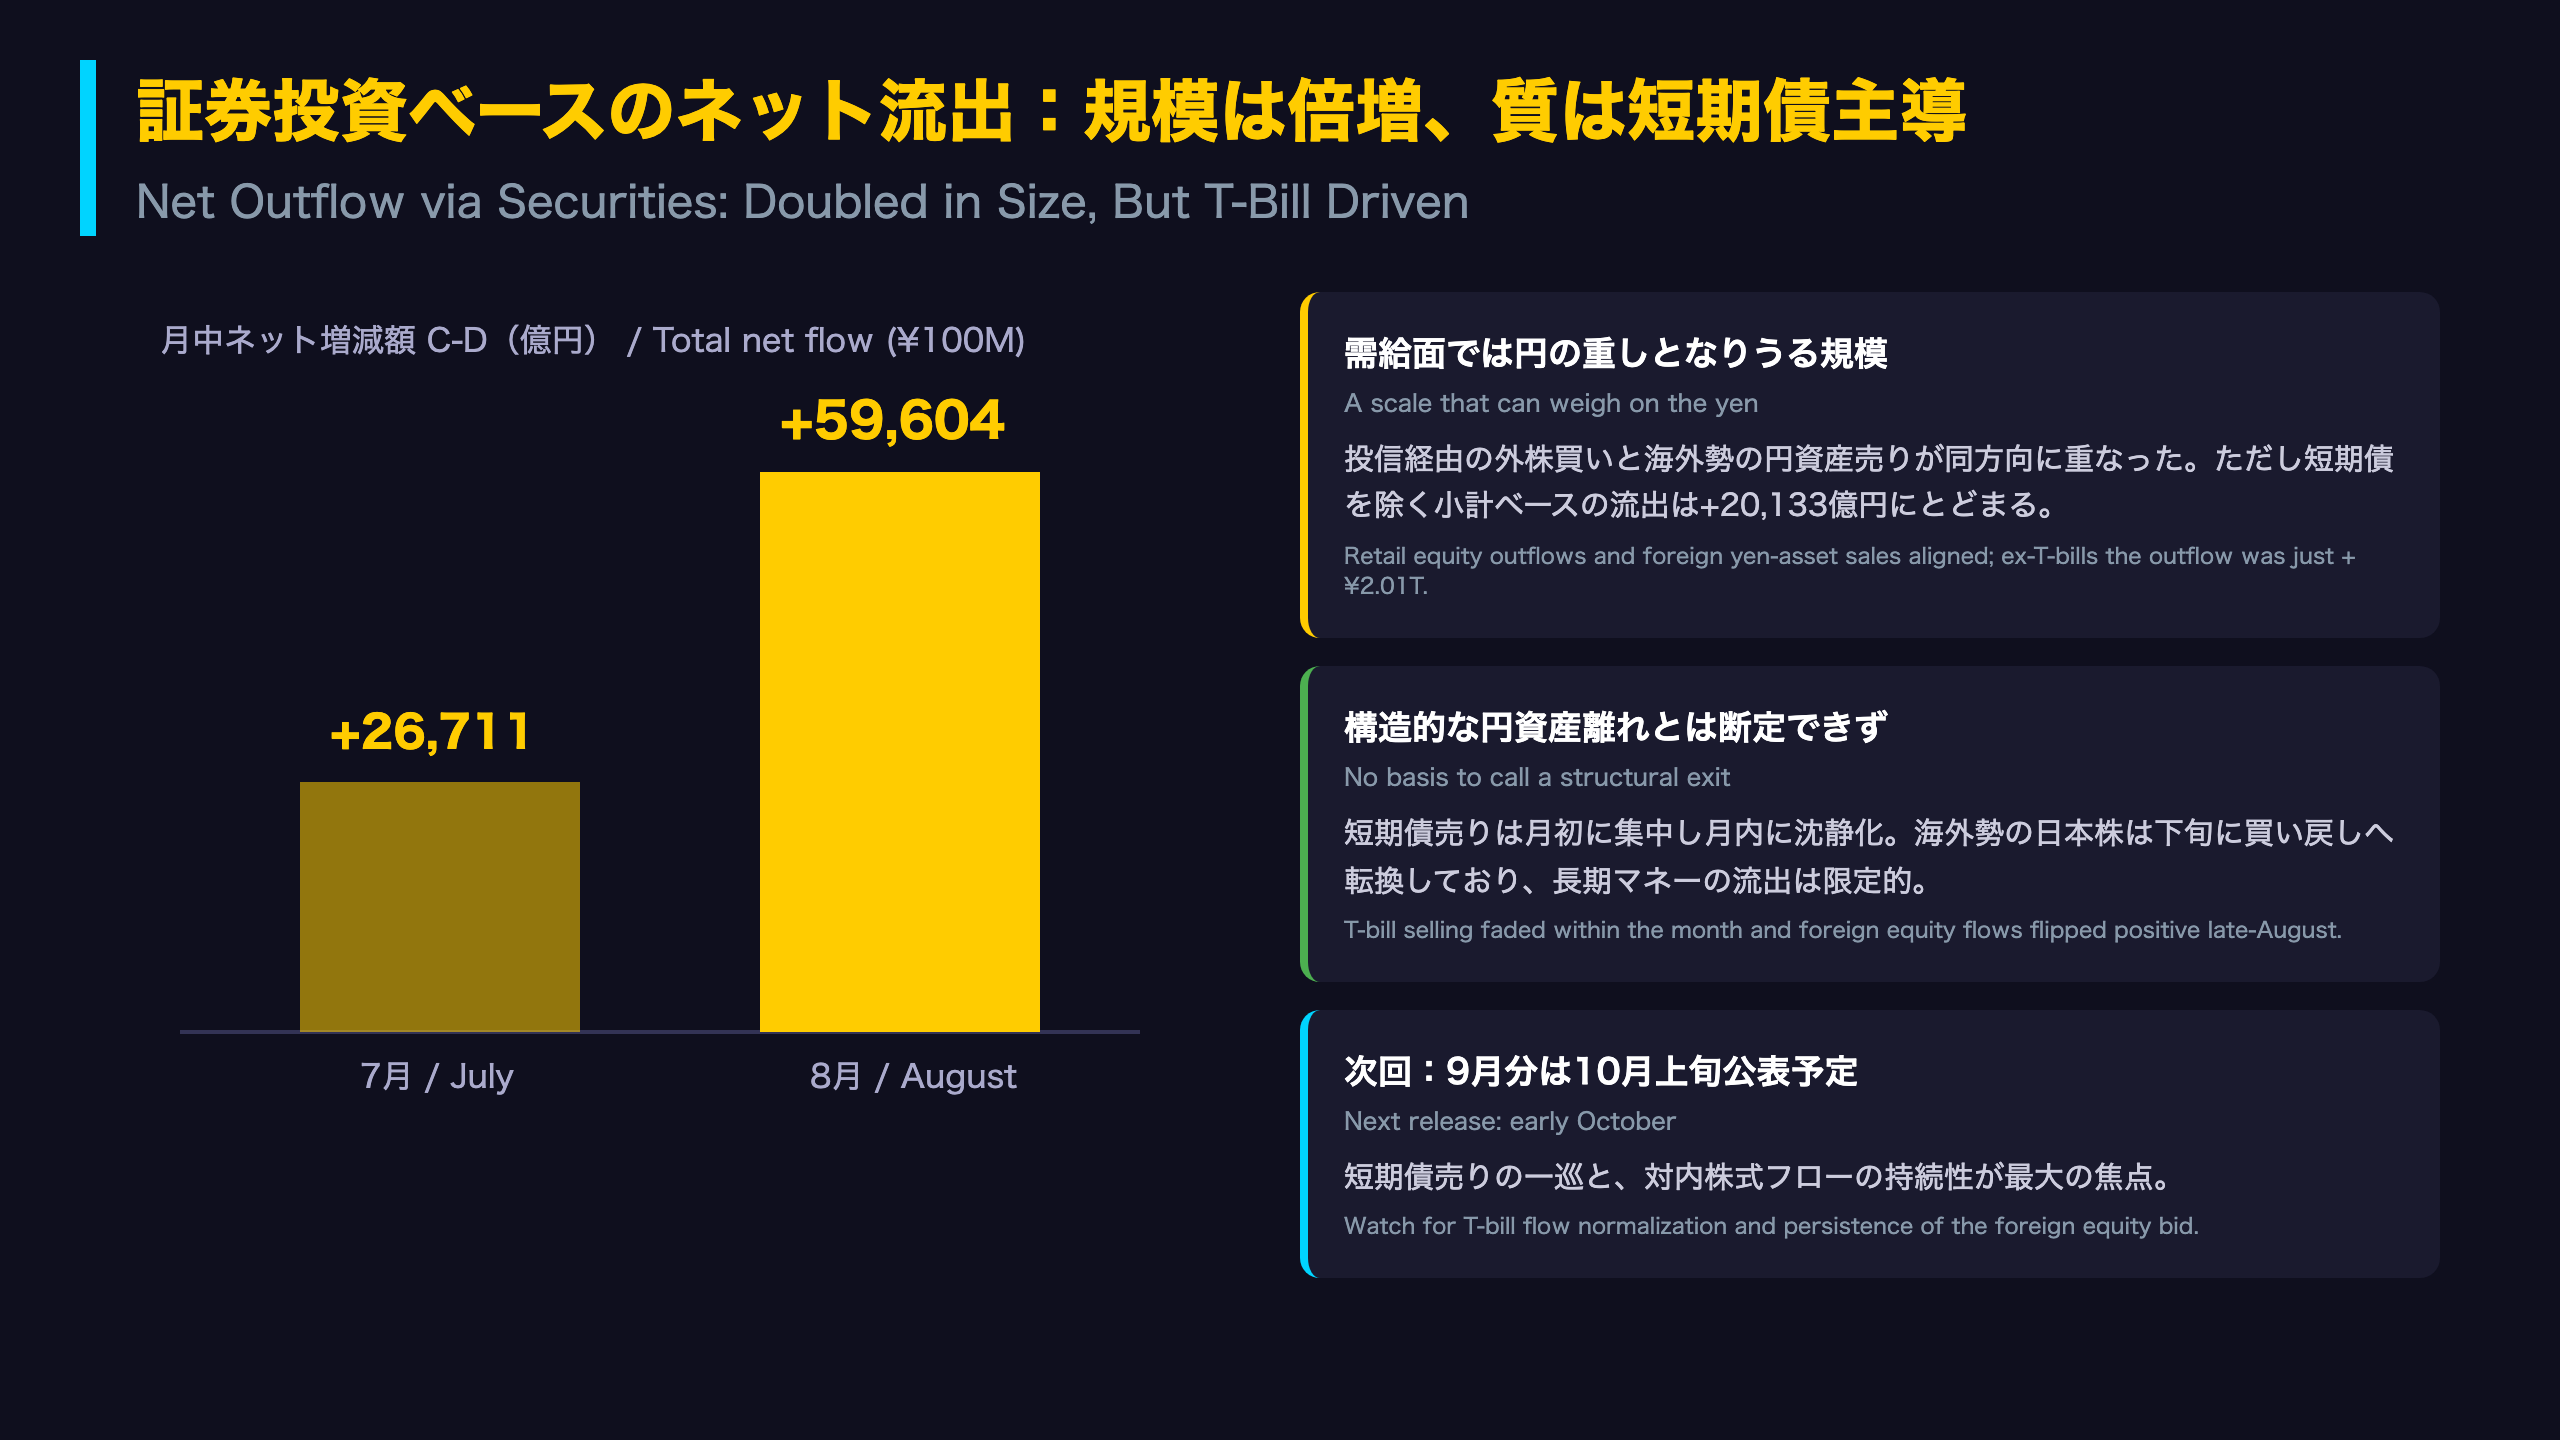
- July: +¥2.67T total (+¥554B excluding short-term debt)
- August: +¥5.96T total (+¥2.01T excluding short-term debt)
Decomposing the outflow
Foreign T-bill selling (-¥4.97T) accounts for the overwhelming majority. Strip out short-term debt and the outflow shrinks to ¥2 trillion — larger than July but far less alarming.
Implications for USD/JPY — both sides
Yen-negative factors: Japanese retail equity outflows via mutual funds are typically unhedged, generating real yen selling. Foreign disposal of yen assets adds to the same direction.
Mitigating factors: Foreign T-bill positions are frequently paired with FX swaps, so their unwind may have limited spot-FX impact. The selling was front-loaded and faded within the month. And foreigners returned as net buyers of Japanese equities in late August.
A single month of flow data cannot determine currency direction. But the combination — household capital exports plus foreign trimming of short-dated yen paper — is the configuration to monitor for structural yen pressure.
What’s next
September data is due in early October (August data was released September 8). Watch: (1) whether foreign T-bill selling has run its course, (2) whether the late-August foreign equity bid persists, and (3) whether trust account (pension) selling of foreign bonds continues.
Disclaimer: This article is for informational purposes only. All investment decisions are made solely at your own risk.