
📺 Watch the Full Video Analysis
This article was automatically generated by the NFC Market Live AI analysis system. (Updated: 2026-10-29 20:42 JST)
📄 Primary Source
内閣府経済社会総合研究所
https://www.esri.cao.go.jp/jp/stat/shouhi/gaiyou.pdf, https://www.esri.cao.go.jp/jp/stat/shouhi/honbun.pdf
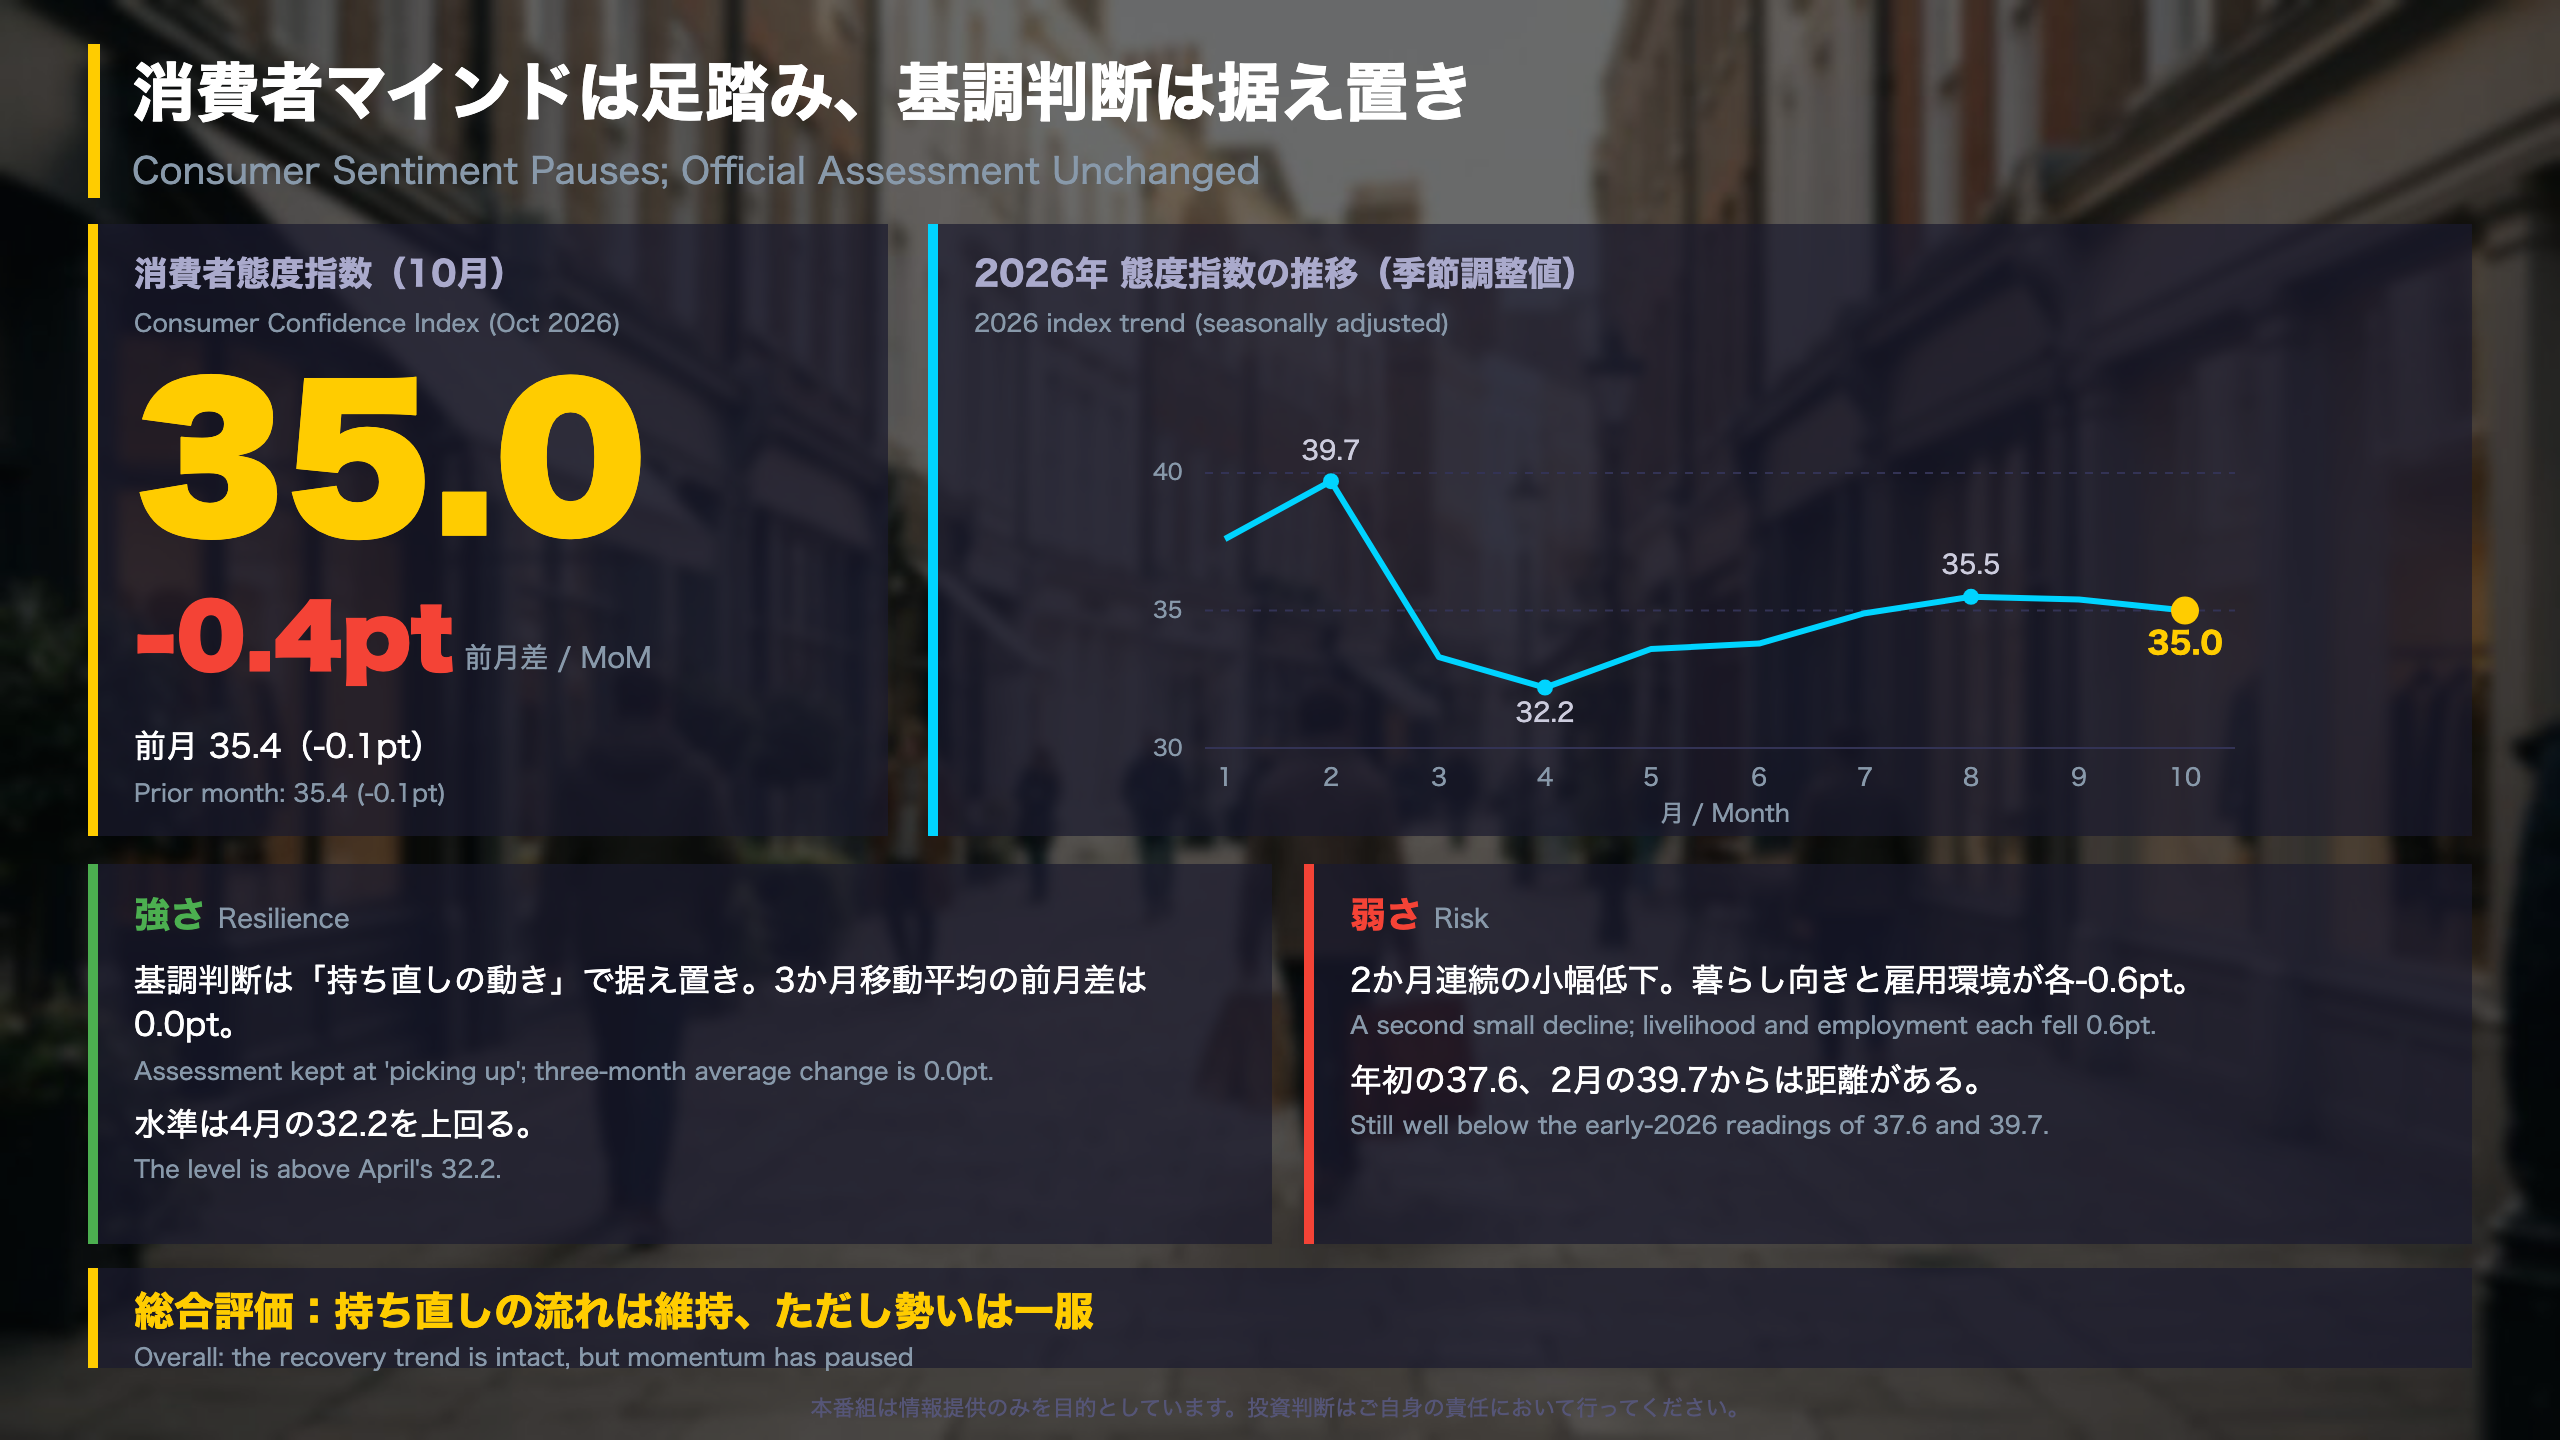
📊 Japan’s Cabinet Office Consumer Confidence Survey (Oct 29, 2026): the index slipped 0.4 points to 35.0, a second small decline.
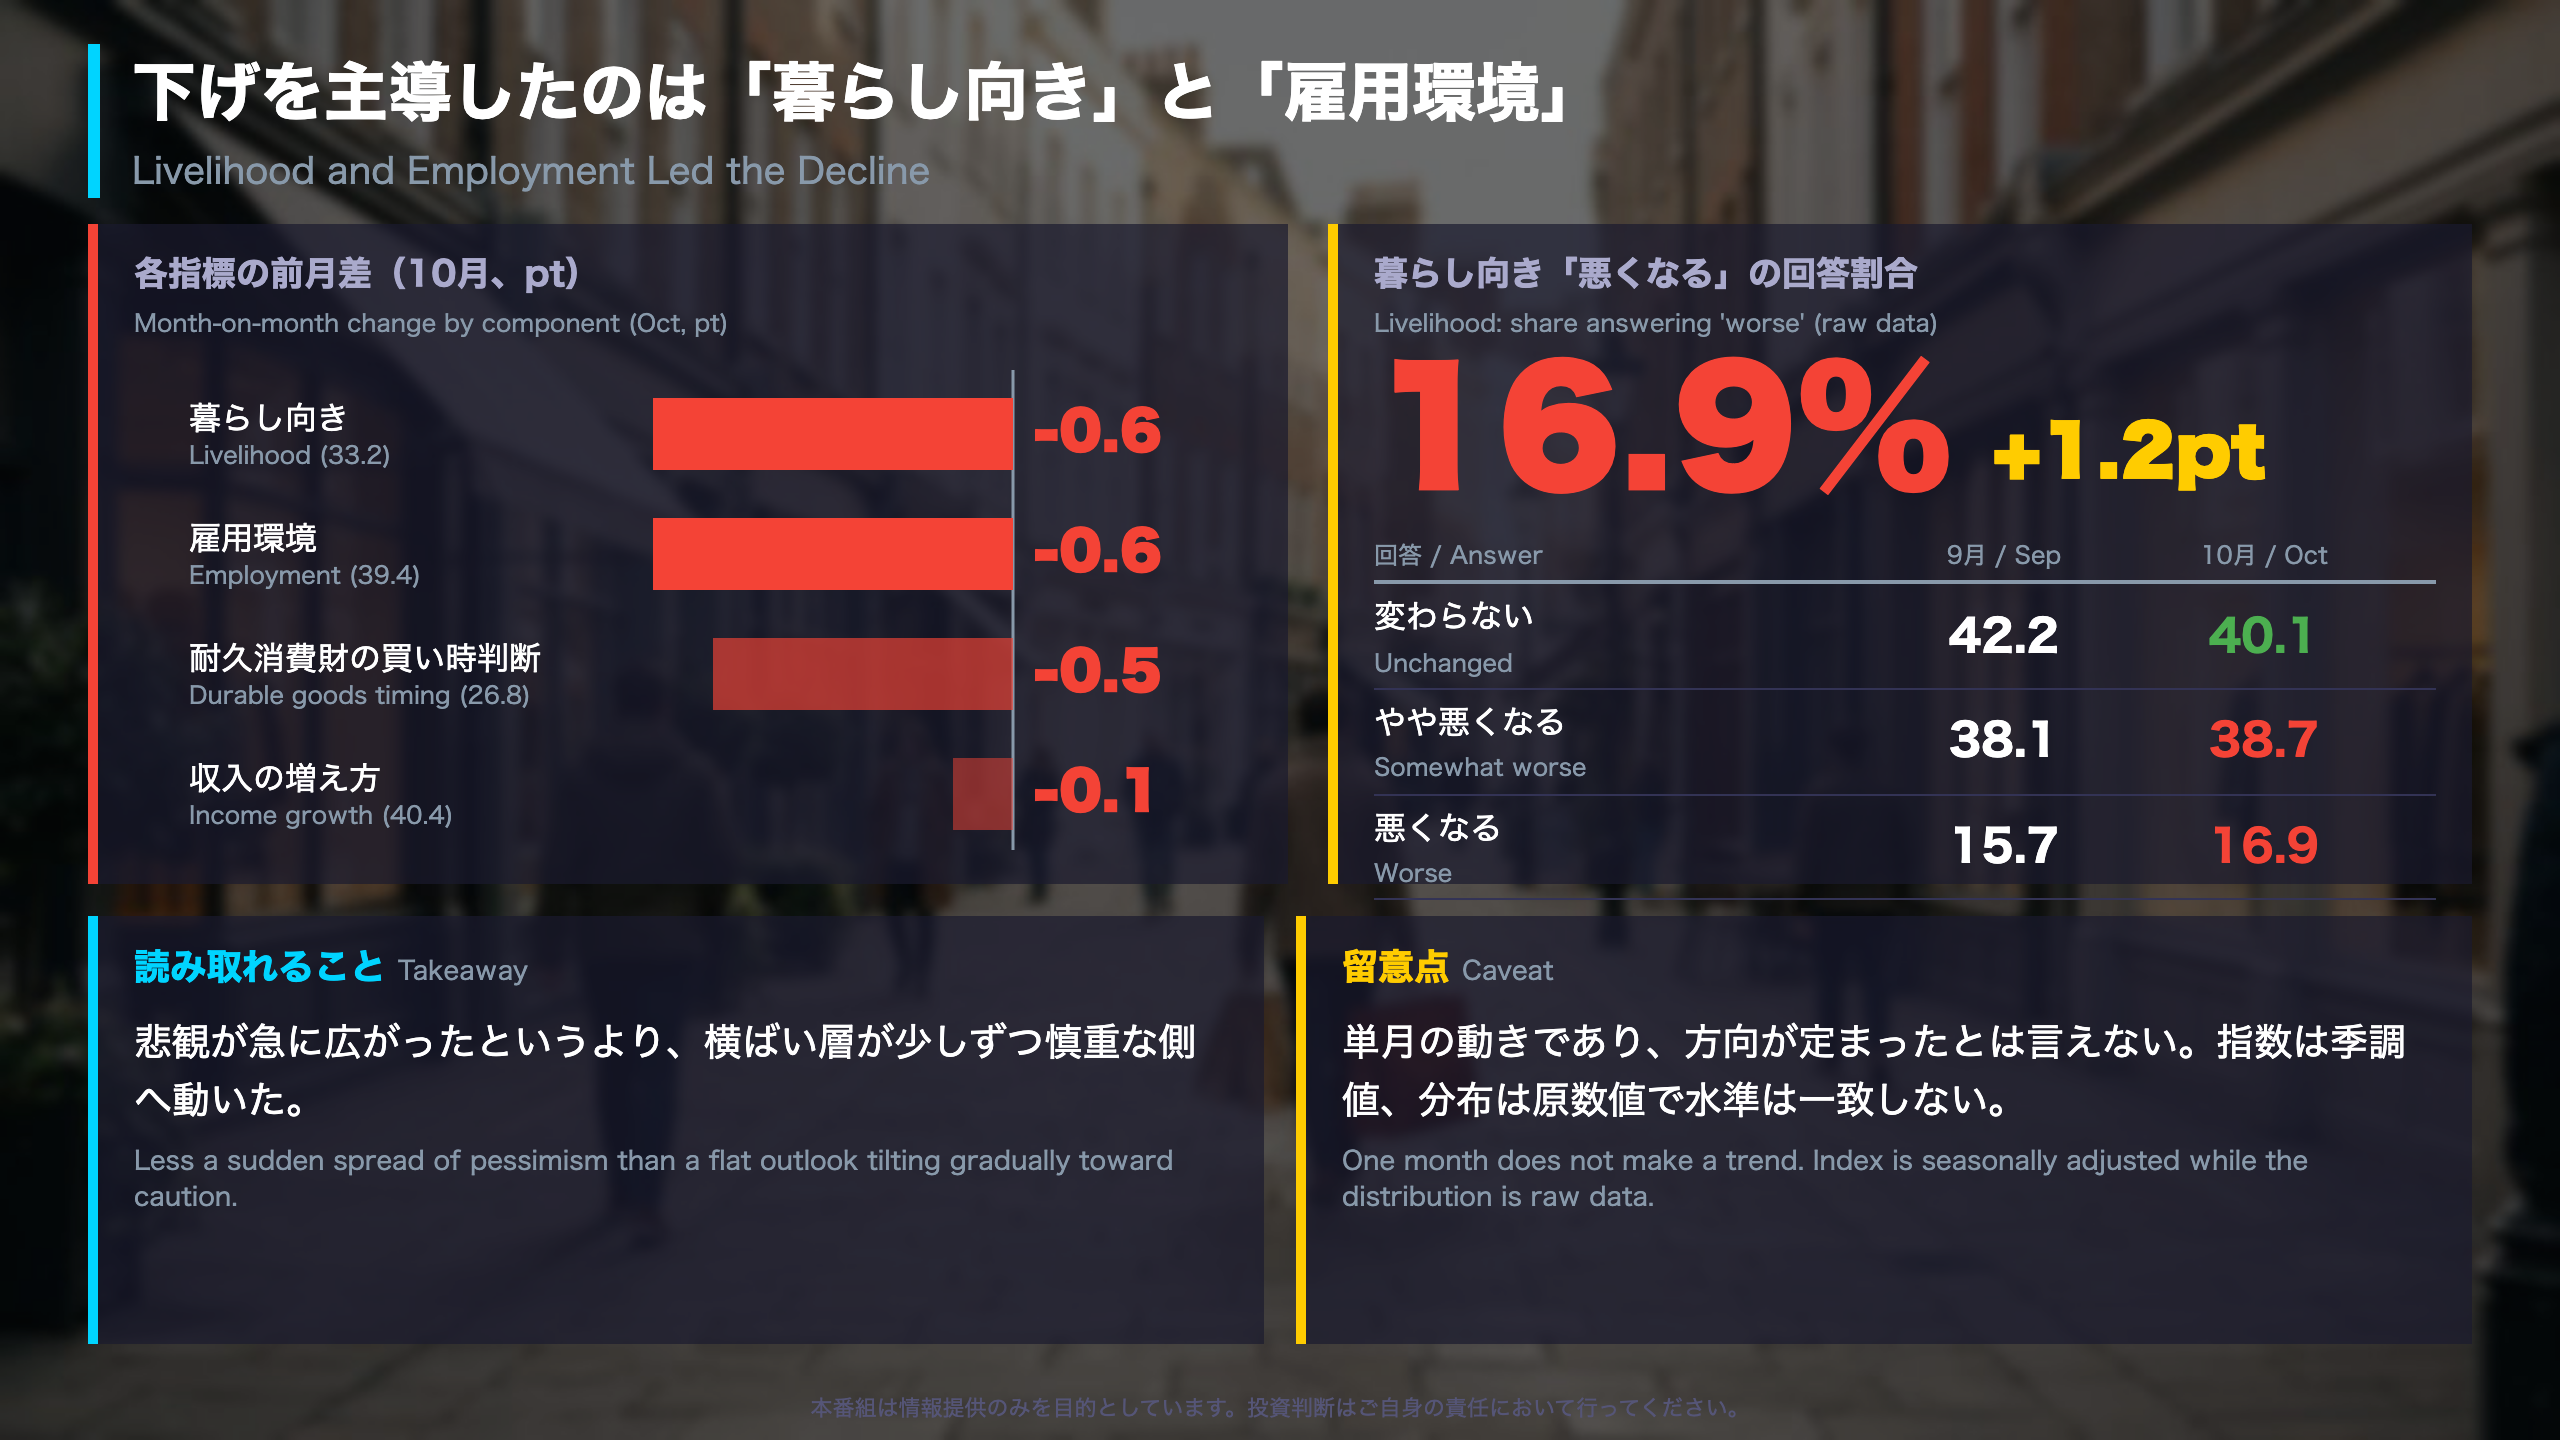
📉 Livelihood and employment led the drop (-0.6 each).
📈 Yet the 3-month average was flat (0.0) and the official call stays ‘picking up’.
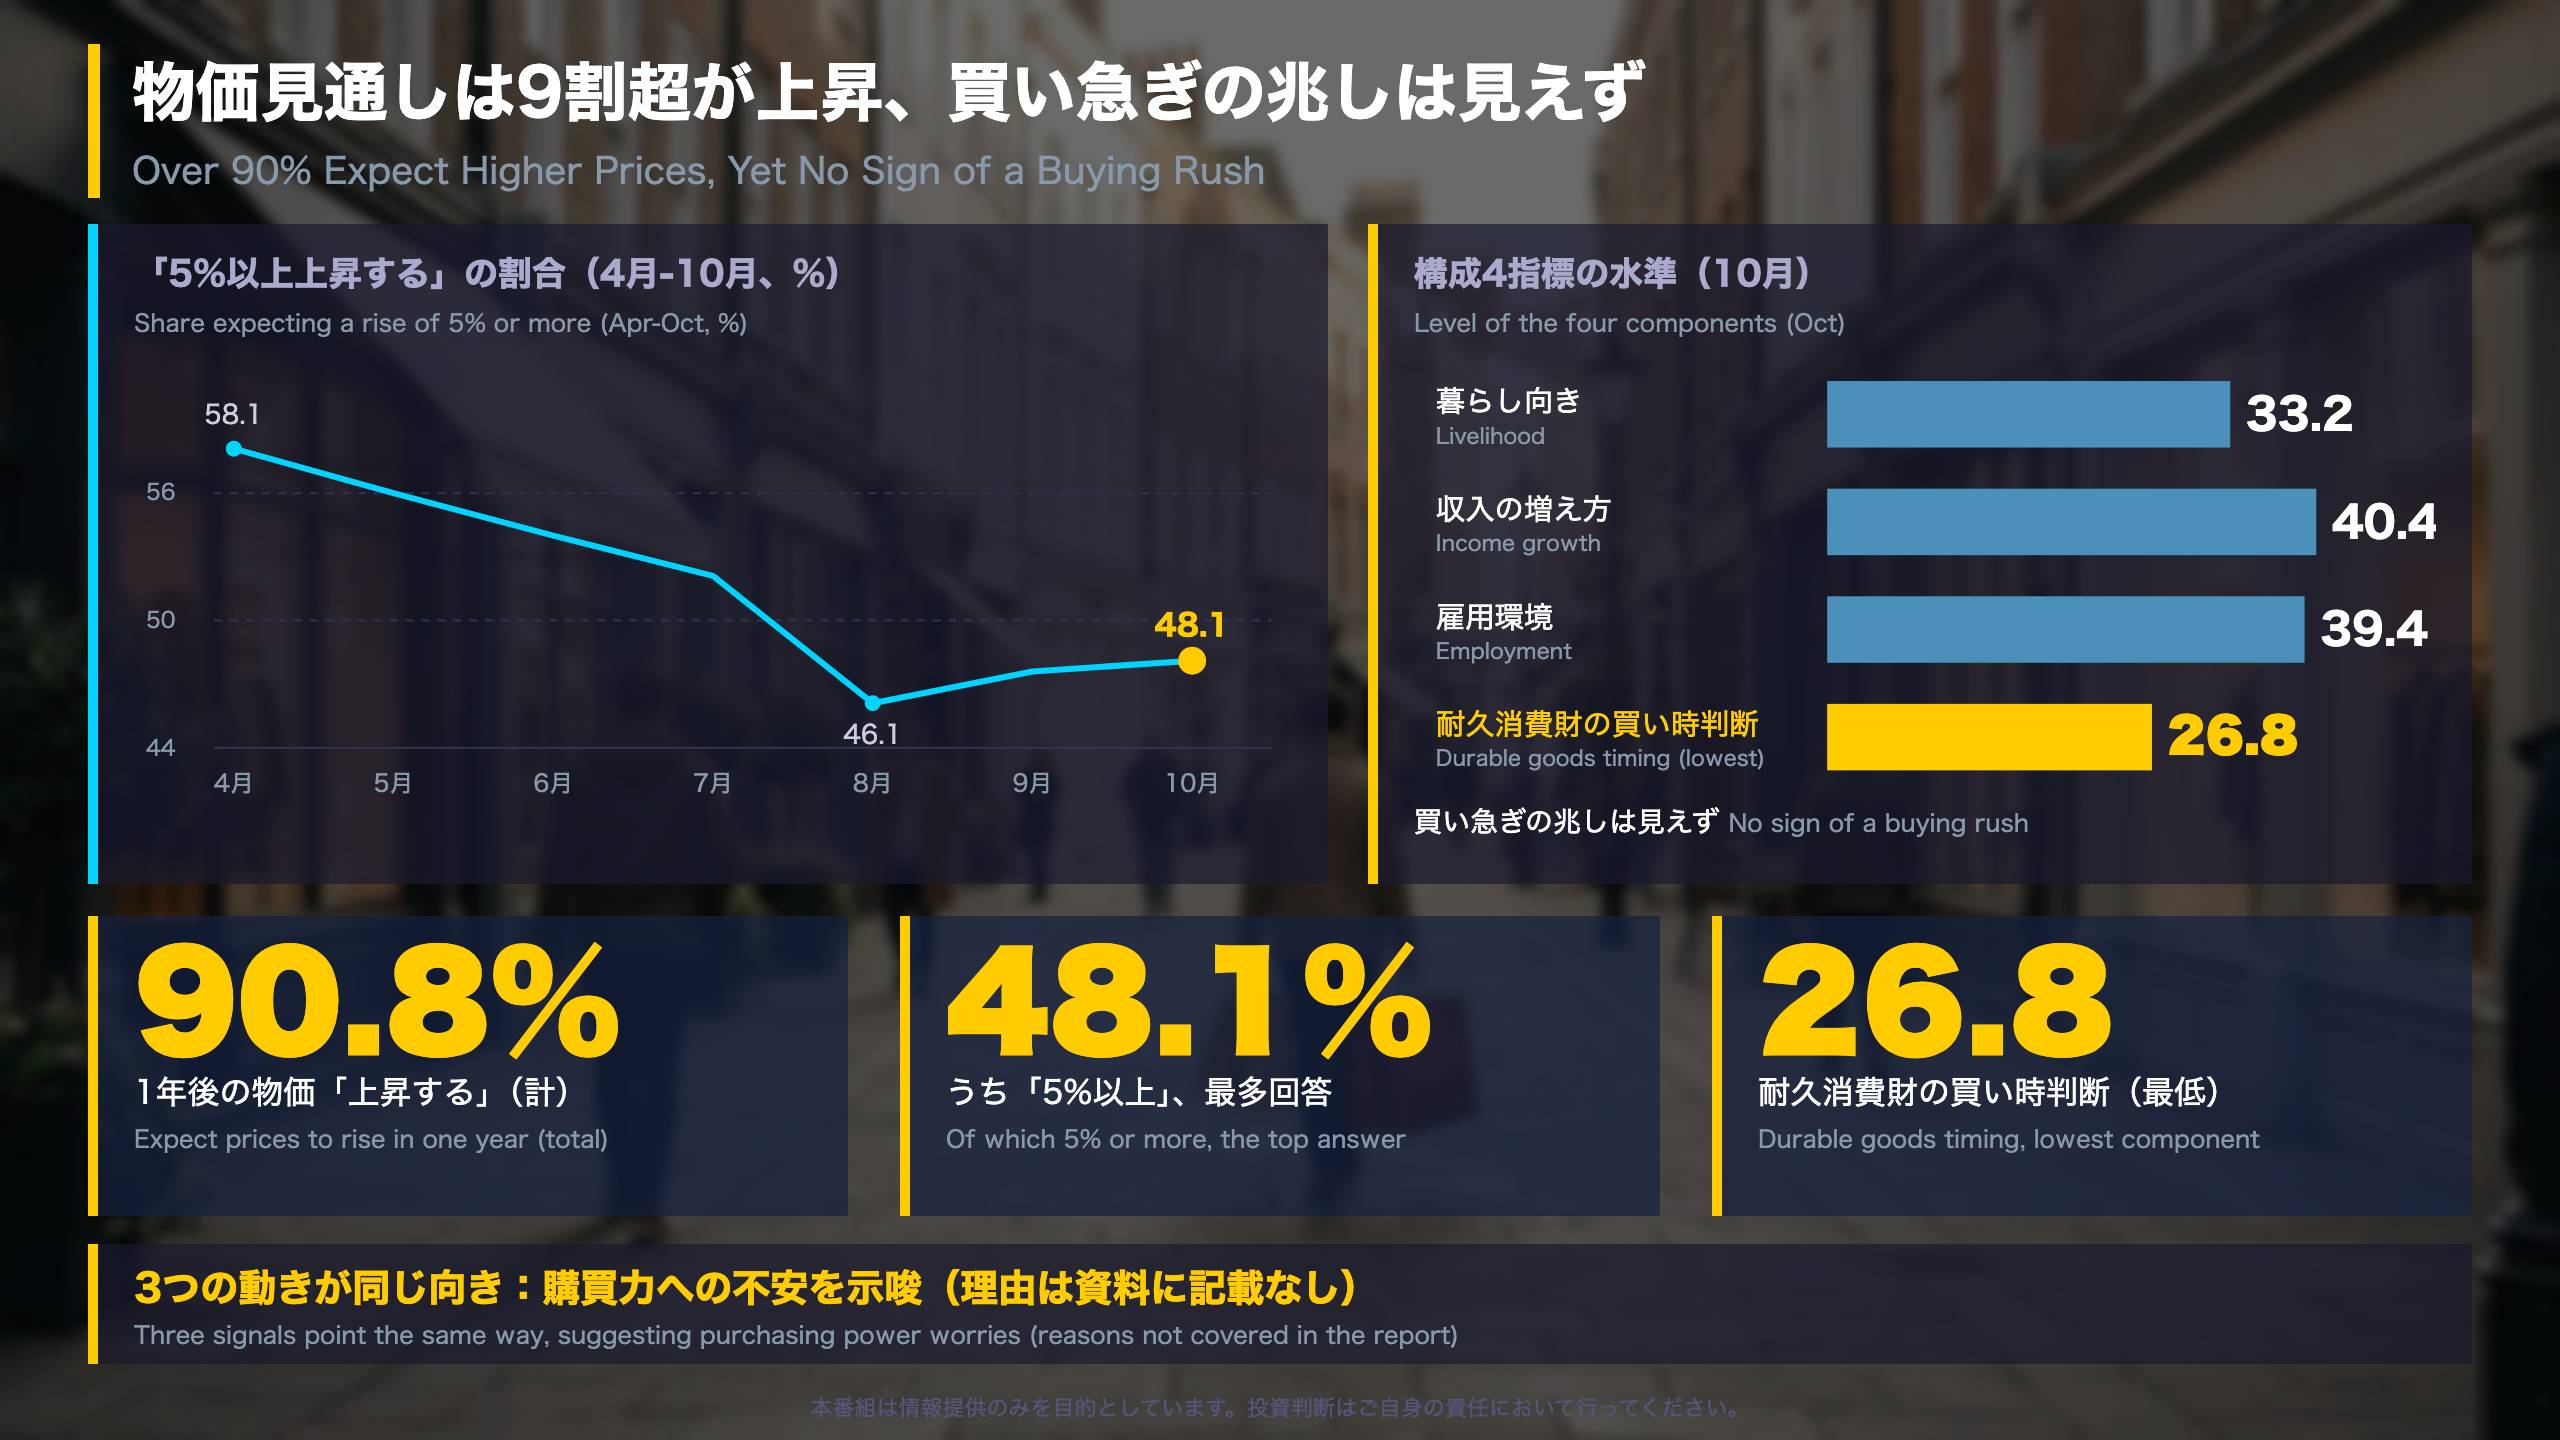
💡 90.8% expect higher prices in a year; durable-goods timing, 26.8, is the weakest component.
⚠️ Next: the November survey.
The Ultimate Summary:消費者マインドは足踏み
What this survey is
The Consumer Confidence Survey is compiled monthly by the Economic and Social Research Institute (ESRI) of Japan’s Cabinet Office, drawing on about 8,400 sampled households. Four questions about the next six months, covering livelihood, income growth, employment and the timing for buying durable goods, are scored and averaged into the Consumer Confidence Index. Each answer maps to a score from 0 (worse) to 1 (better), with ‘unchanged’ at 0.5, so a reading of 50 would mean every household expects no change. At 35.0, the index sits well below that neutral mark, as it has throughout 2026.
October in context
- Index: 35.0, down 0.4 points (September: 35.4, down 0.1).
- 2026 range: 32.2 (April) to 39.7 (February).
- Year-ago level (October 2025): 35.9.
- Three-month average: unchanged (0.0 points). The Cabinet Office kept its assessment that sentiment is ‘picking up’.
How it compares
The closest US analogues are the University of Michigan sentiment survey and the Conference Board index, but scales and questions differ, so levels should not be compared directly. Japan’s index is built purely from forward-looking questions.
Balanced reading
Resilience: the index is above its April low and the official trend call is intact. Risk: all four components slipped, and the level remains below both early-2026 readings and last October. The release draws no policy conclusion; the Bank of Japan draws on many other data sources.
Deep Dive 1:下げを主導したのは暮らし向きと雇用環境
Reading the breakdown
The headline index is a simple average of four components, so the key question is which one moved it. In October, livelihood (33.2) and employment (39.4) each fell 0.6 points, durable-goods timing (26.8) fell 0.5 and income growth (40.4) fell 0.1.
Response distribution (raw data, October, change from September)
| Component | Better (sum) | Unchanged | Somewhat worse | Worse |
|---|---|---|---|---|
| Livelihood | 4.3 (+0.3) | 40.1 (-2.1) | 38.7 (+0.6) | 16.9 (+1.2) |
| Employment | 5.7 (-0.7) | 55.4 (-0.3) | 29.1 (+1.1) | 9.8 (0.0) |
| Durable goods | 2.3 (-0.1) | 23.9 (-1.5) | 52.2 (+0.8) | 21.6 (+0.8) |
| Income growth | 5.8 (-0.2) | 62.0 (-1.0) | 19.8 (+0.5) | 12.4 (+0.7) |
Interpretation
- Livelihood: optimism did not vanish, as the ‘better’ share edged up 0.3 points, but households shifted from ‘unchanged’ toward the pessimistic side.
- Employment: the ‘worse’ share was flat; the move came from ‘somewhat worse’ (+1.1), a mild softening rather than alarm.
- Durable goods: more than half answer ‘somewhat worse’, the most cautious of the four components.
Balanced view
On the bright side, the pessimistic camp is dominated by ‘somewhat worse’ rather than ‘worse’. On the weak side, the ‘unchanged’ share fell in all four components.
Caveat
Index values are seasonally adjusted while the distribution is raw data, so they will not reconcile exactly. One month of change does not establish a trend.
Deep Dive 2:物価見通しと消費意欲
Price expectations
The survey asks households how much the prices of goods they regularly buy will change over the next year. It is a household survey, so it is not directly comparable to market-based inflation measures.
| Month | Rise (total) | Rise 5%+ | Unchanged | Fall (total) |
|---|---|---|---|---|
| Apr | 93.6 | 58.1 | 2.3 | 2.3 |
| May | 93.5 | 56.0 | 2.6 | 1.9 |
| Jun | 93.3 | 54.0 | 2.5 | 2.2 |
| Jul | 92.8 | 52.1 | 2.9 | 2.5 |
| Aug | 89.0 | 46.1 | 4.6 | 4.6 |
| Sep | 90.6 | 47.6 | 3.8 | 3.3 |
| Oct | 90.8 | 48.1 | 3.8 | 3.5 |
The Cabinet Office noted that the most common answer was a rise of 5% or more (48.1%).
Strength versus weakness
- Calmer: the 5%+ share is about 10 points below April, and total rise expectations are 1.8 points lower than a year earlier. The monthly change was only +0.2 points.
- Still elevated: more than nine in ten expect higher prices, and the 5%+ share has risen for two months since its August low of 46.1.
- Spending link: durable-goods timing is 26.8 versus 29.7 a year earlier. Expected price rises are not producing a visible buy-now impulse in this data. That is more consistent with squeezed purchasing power, though the survey does not ask why.
What to watch
Whether the 5%+ share keeps climbing from the August low while livelihood sentiment keeps slipping.
Q&A:資産価値との差と次の焦点
The asset value gap
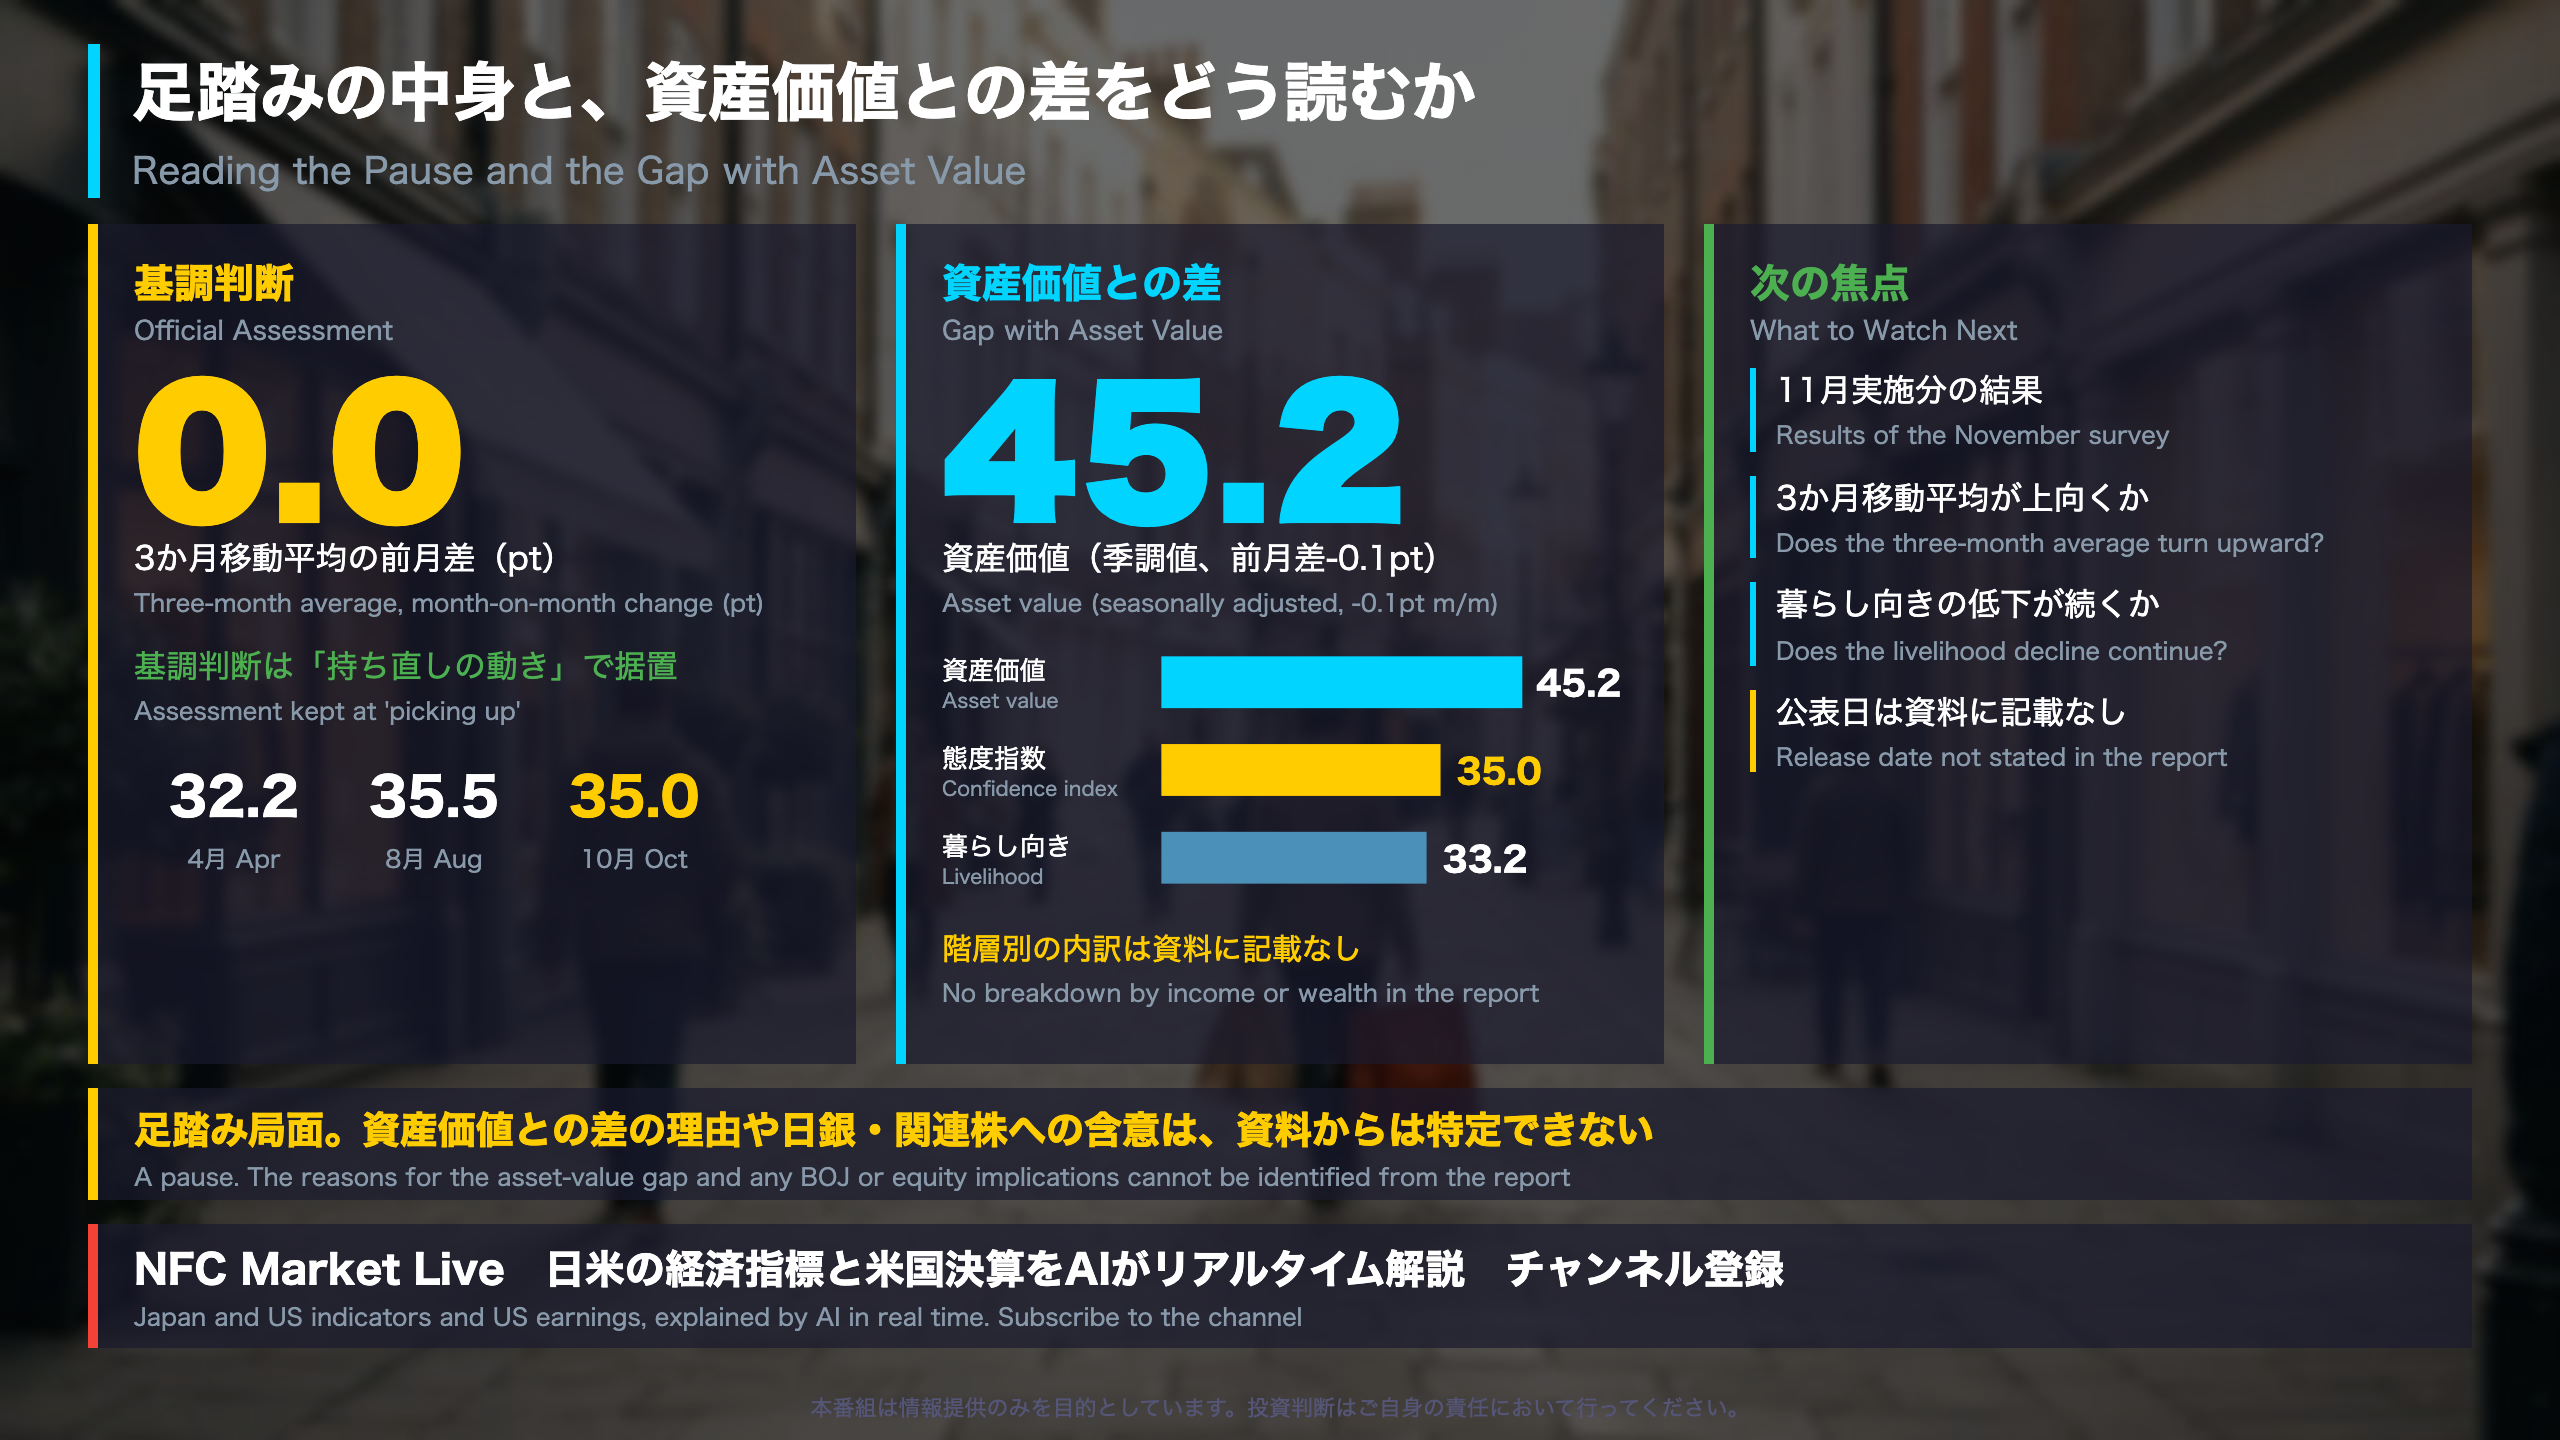
The survey also asks about the value of households’ stocks, land and other assets. It is excluded from the headline index. In October this measure was 45.2 (seasonally adjusted), down only 0.1, versus 35.0 for the headline index, a gap of about 10 points.
| Month (2026) | Asset value | Index |
|---|---|---|
| Feb | 48.5 | 39.7 |
| Mar | 41.9 | 33.3 |
| Jul | 46.4 | 34.9 |
| Sep | 45.3 | 35.4 |
| Oct | 45.2 | 35.0 |
Raw October responses: 58.2% expect no change, 19.2% ‘somewhat less’, 8.2% ‘less’, and 14.4% ‘more’ or ‘somewhat more’ (1.0% plus 13.4%).
Limits of the reading
The release gives no breakdown by income or wealth, so it cannot confirm a split between affluent and middle-income households. Figures cover two-or-more-person households only (4,331 valid responses; 6,685 including single-person households, a 79.6% overall response rate).
Policy and markets
The report contains no reference to monetary policy or equity sectors; any link to Bank of Japan decisions or consumer-related stocks would be inference beyond the source. The survey is best used as one input on household outlook alongside actual spending data.
Next
The November survey. The Cabinet Office release date is not stated in the report.
Disclaimer: This article is for informational purposes only. All investment decisions are made solely at your own risk.