📺 Watch the Full Video Analysis
This article was automatically generated by the NFC Market Live AI analysis system. (Updated: 2026-10-30 12:17 JST)
📄 Primary Source
日本銀行
https://www.boj.or.jp/mopo/outlook/gor2610a.pdf
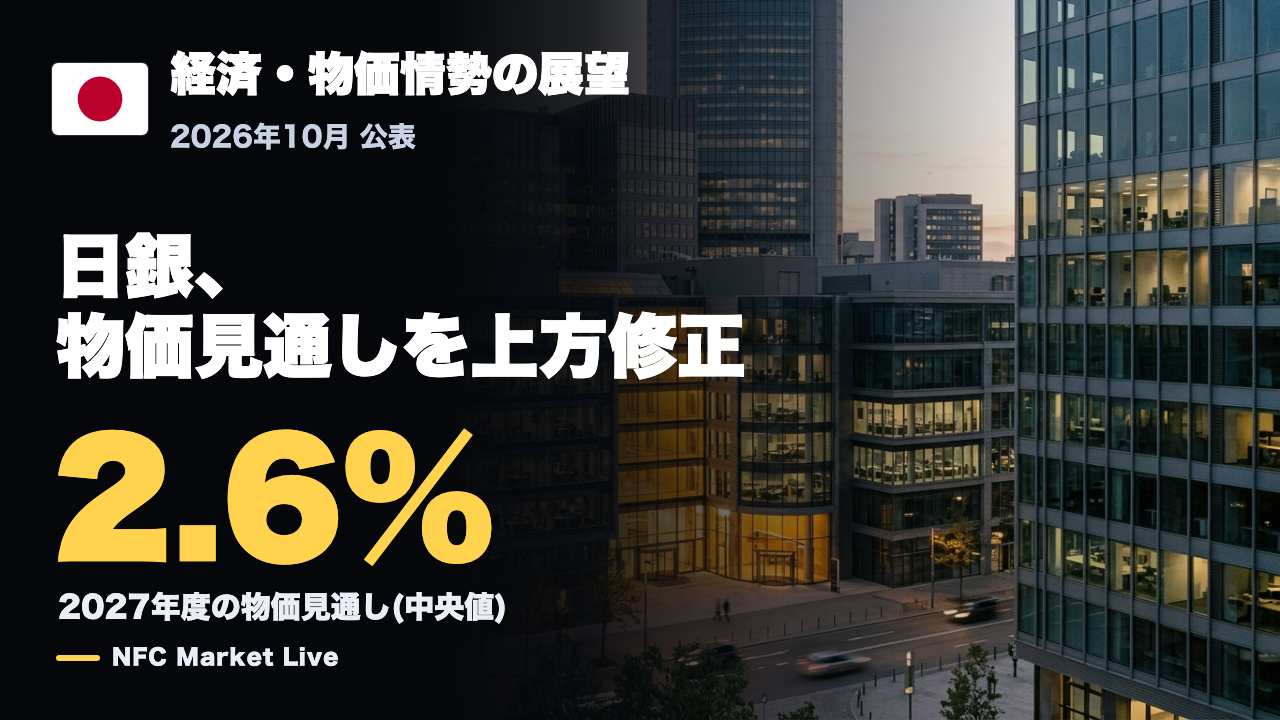
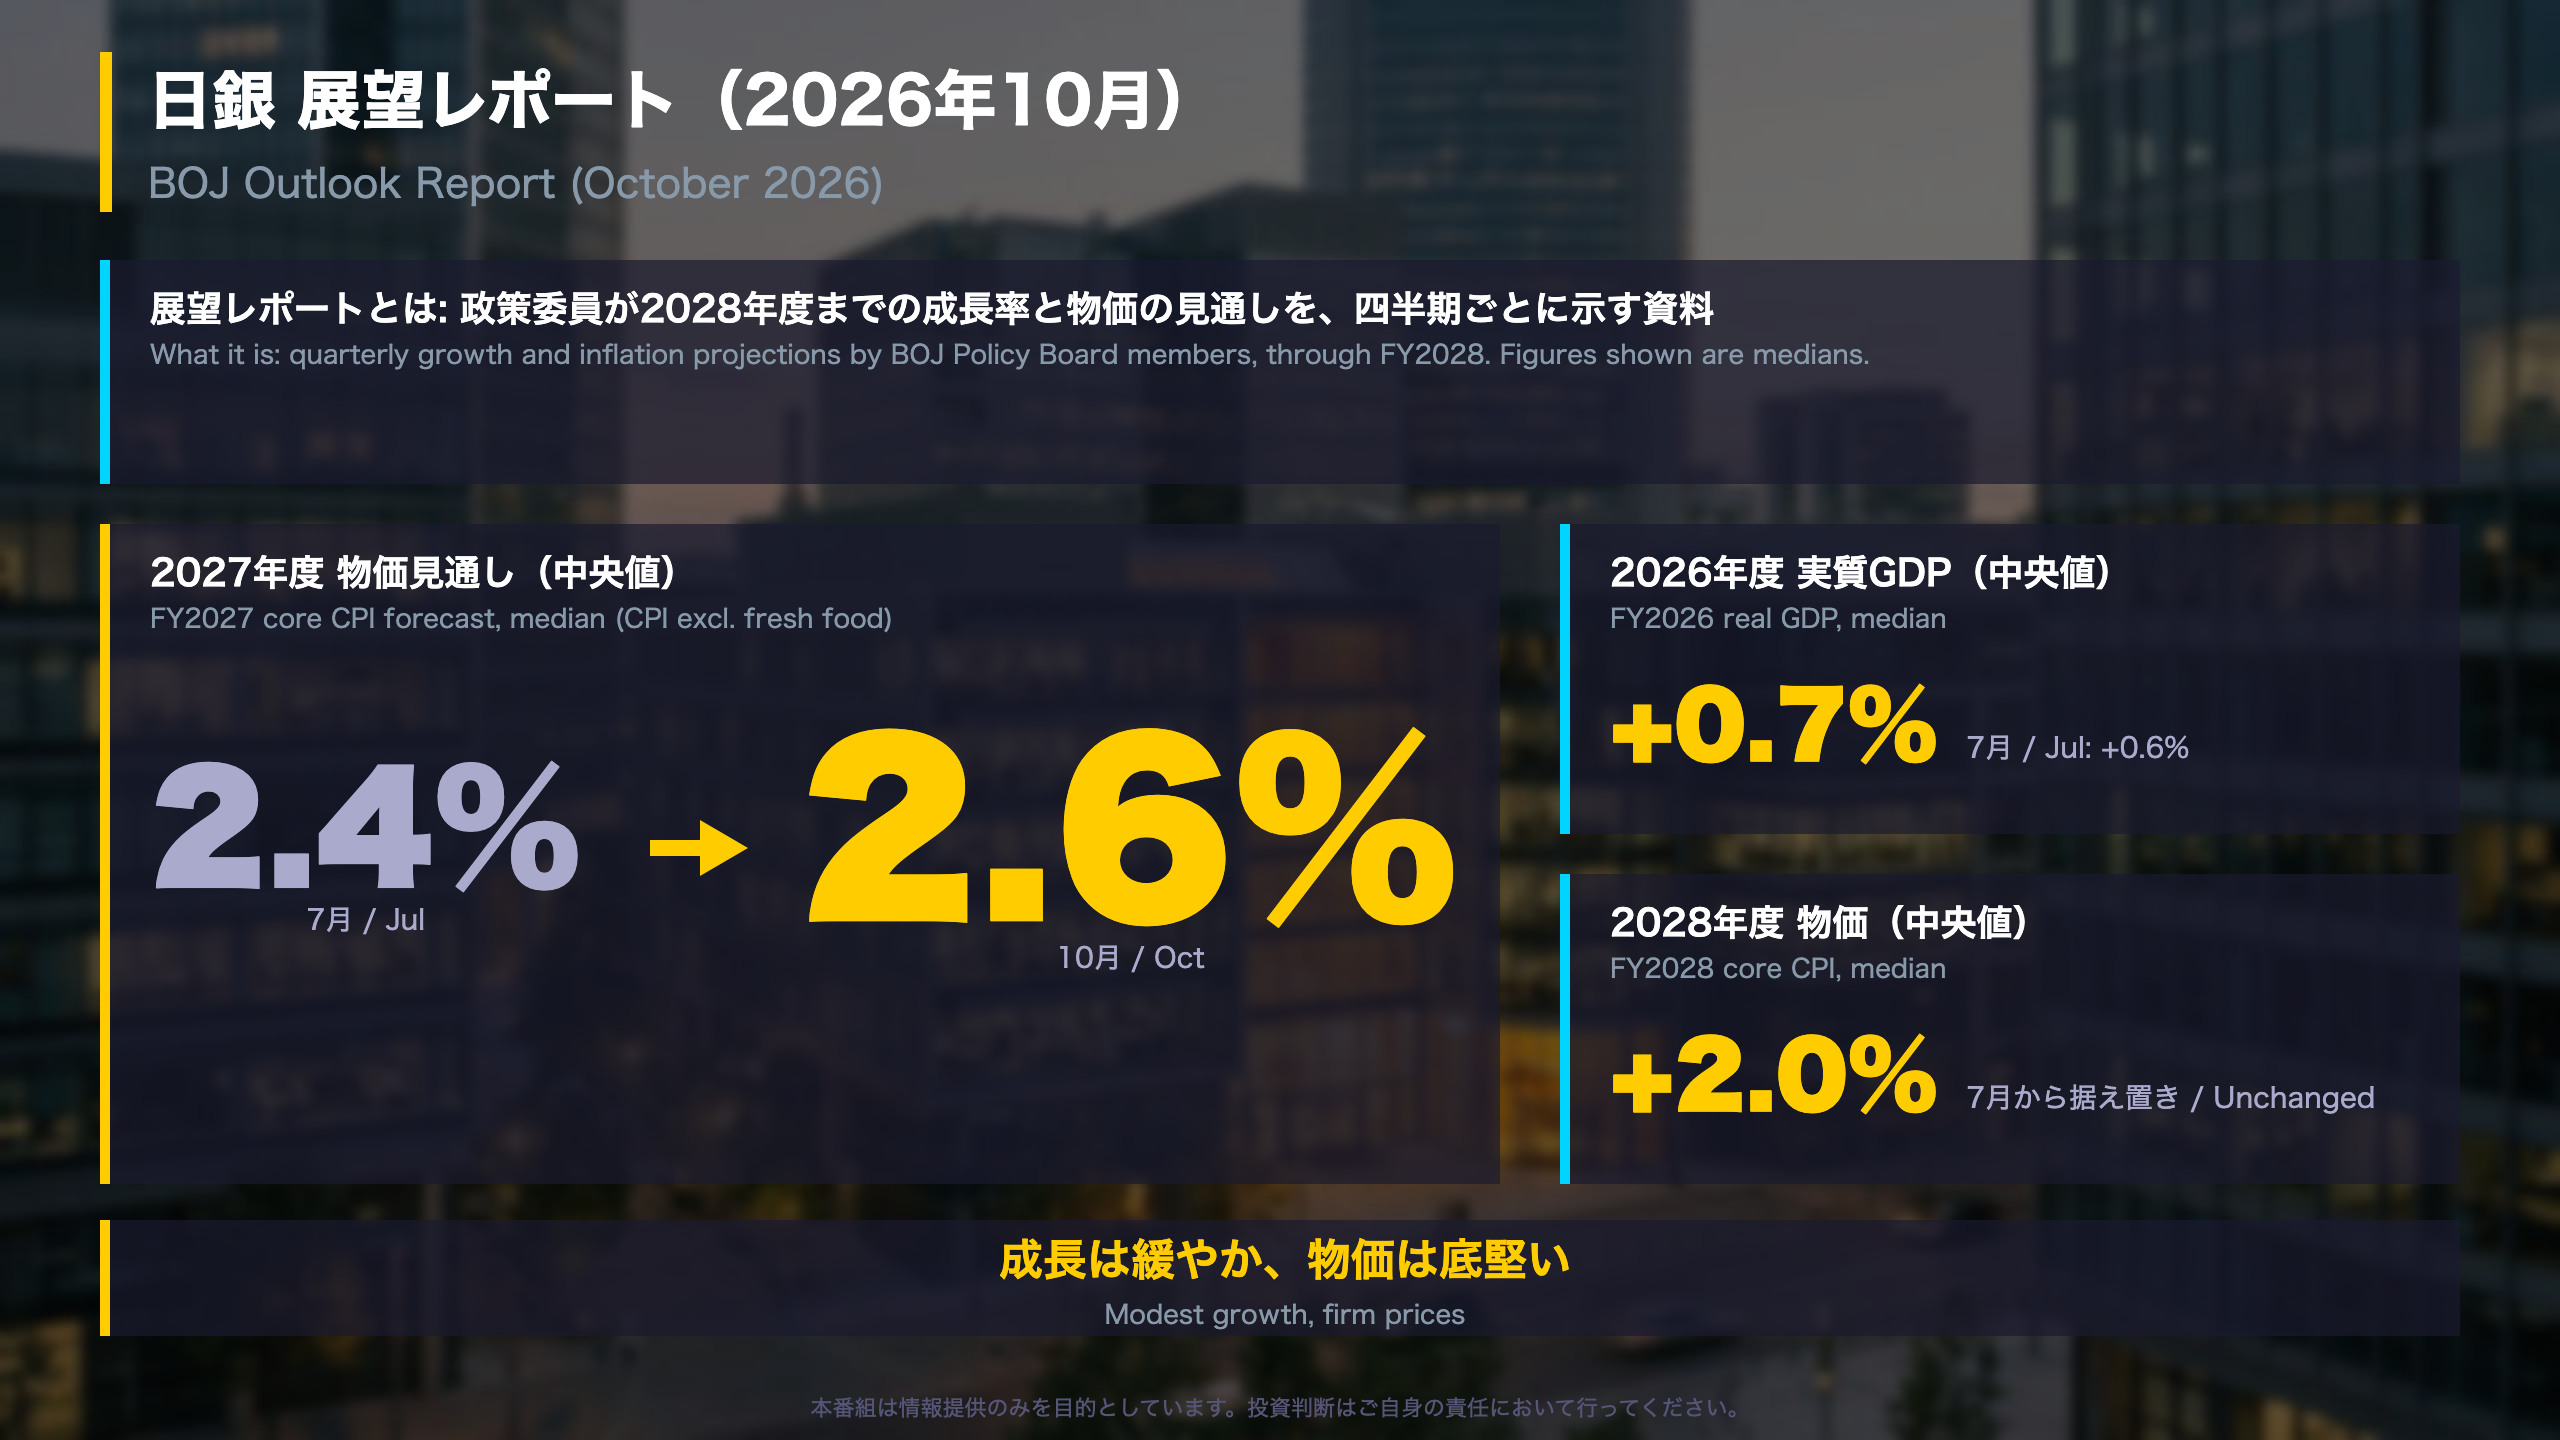
📊 The Bank of Japan released its Outlook Report on Oct 30. The median forecast for FY2027 core CPI (excluding fresh food) rose from 2.4% in July to 2.6%.
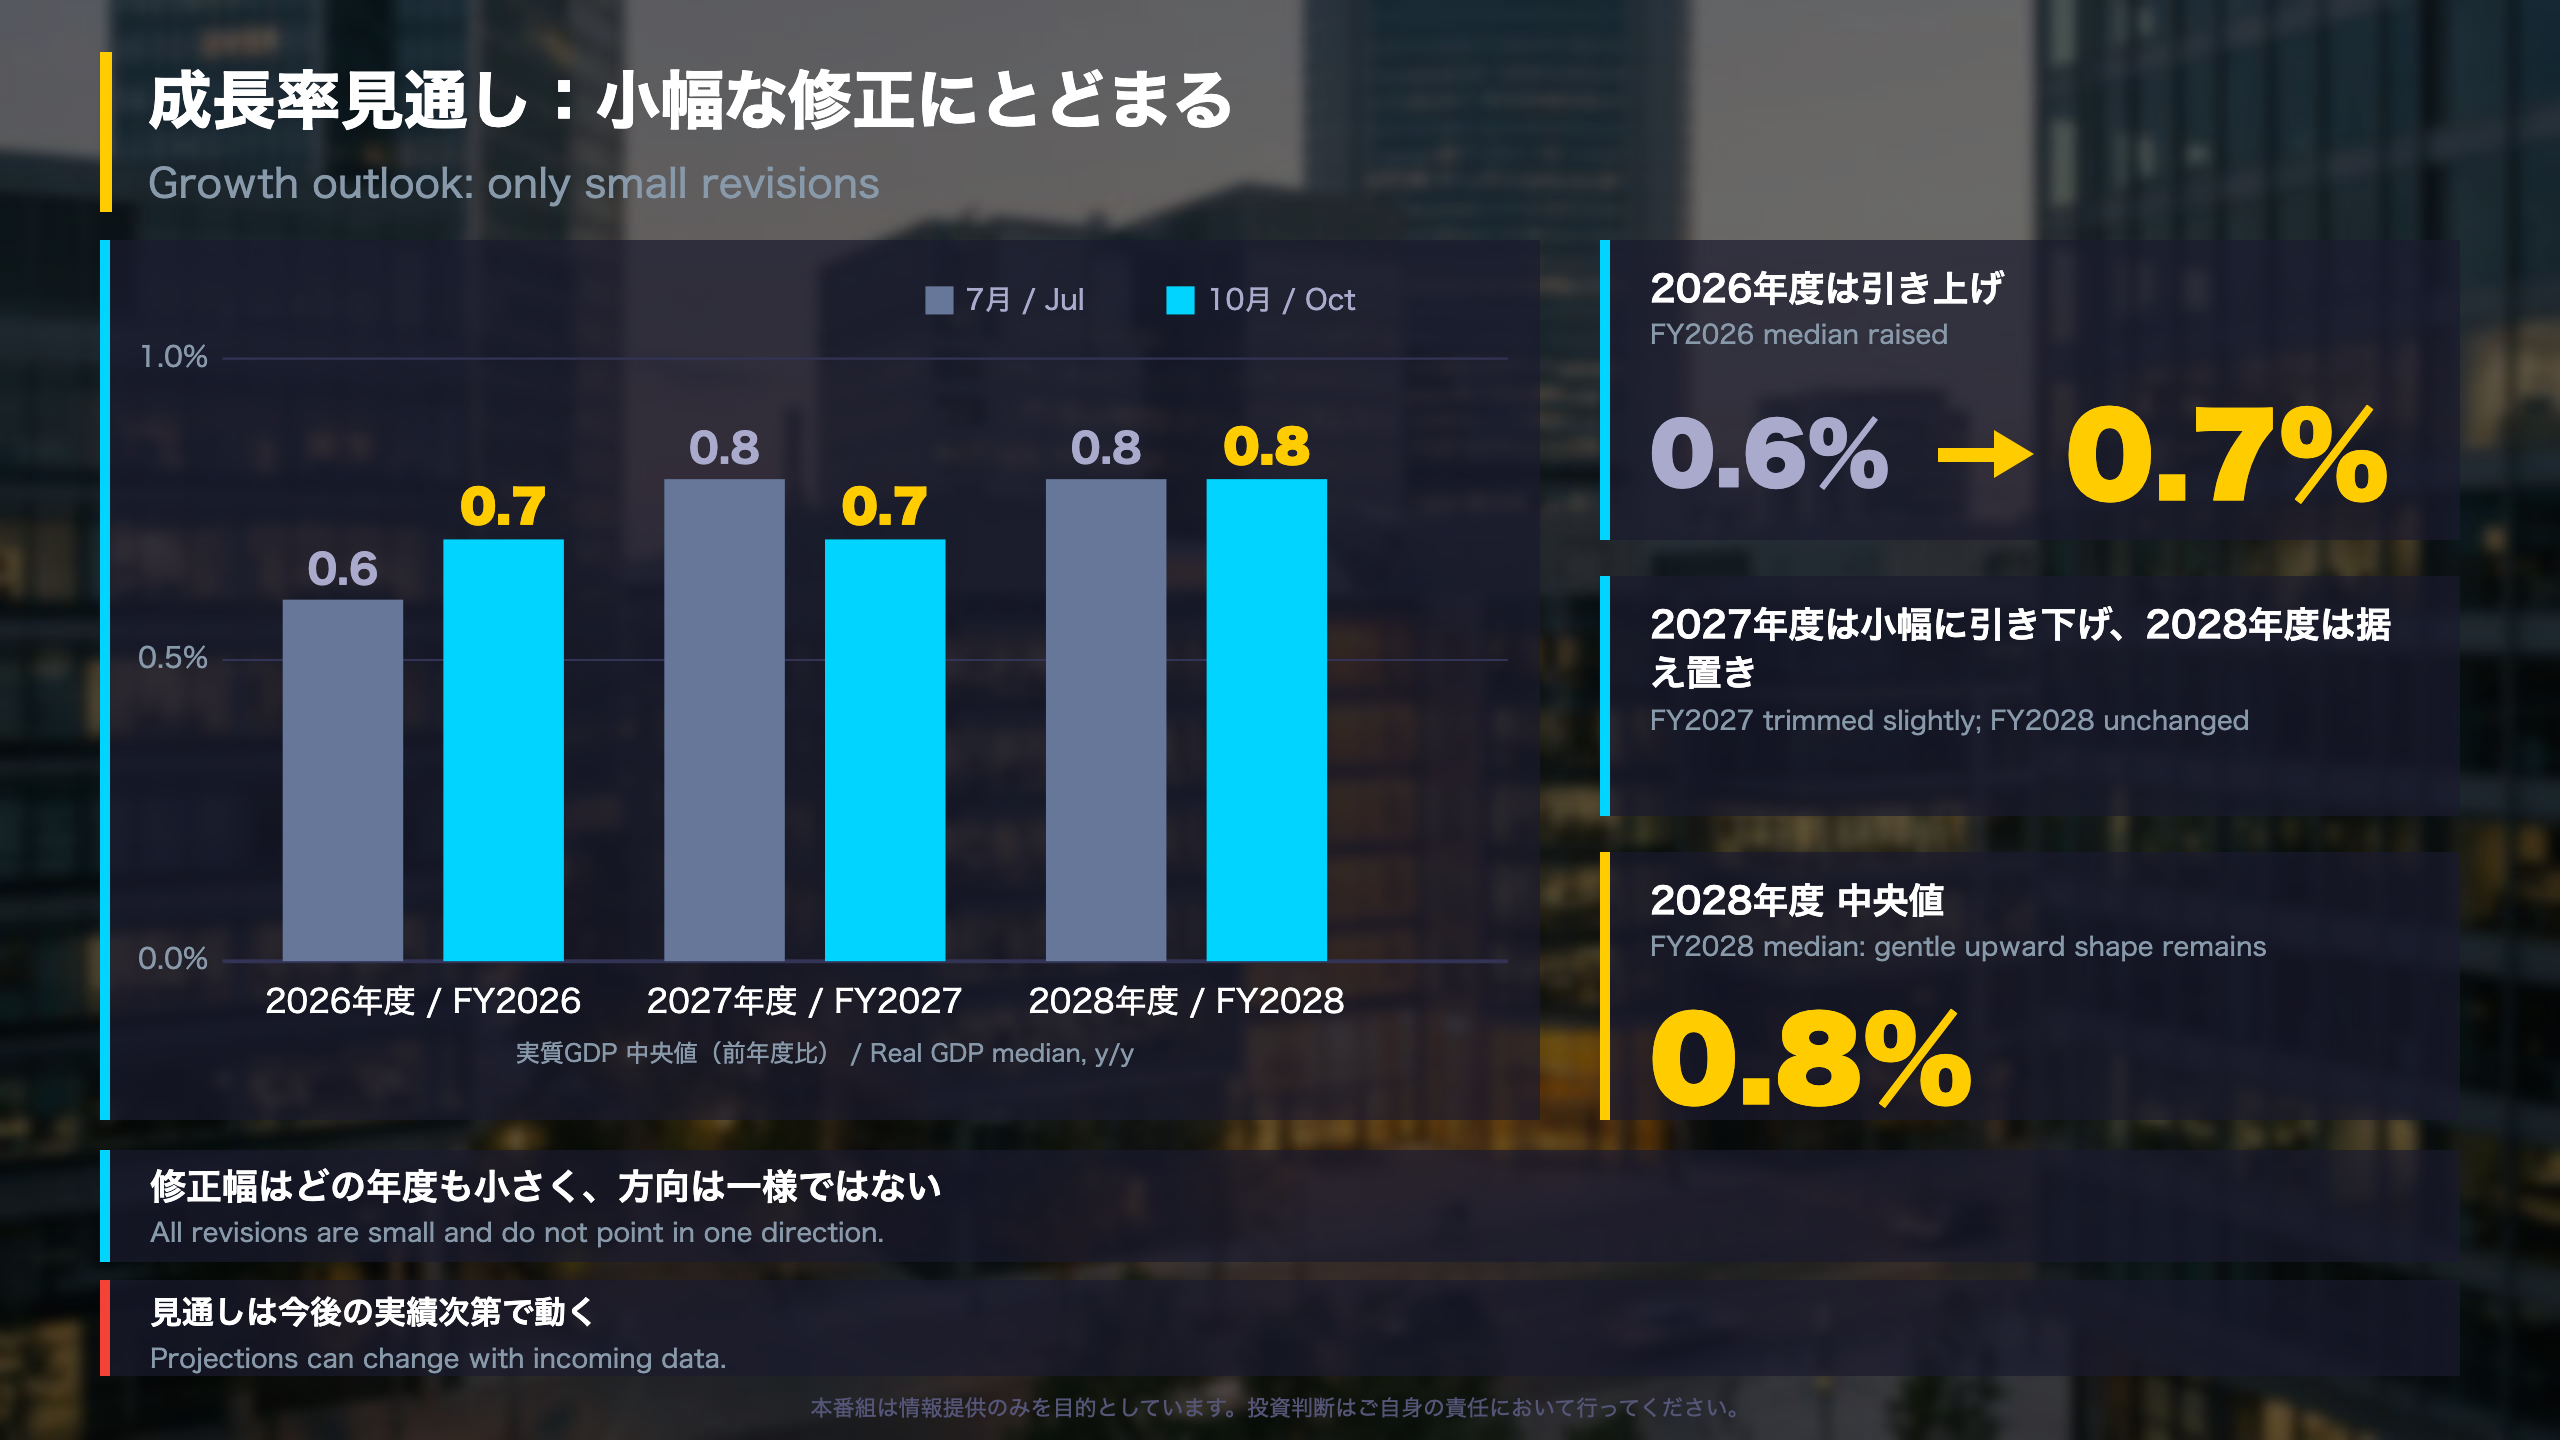
📈 FY2026 real GDP was nudged up from 0.6% to 0.7%, FY2027 was trimmed from 0.8% to 0.7%, and FY2028 stayed at 0.8%. Growth revisions are all small.
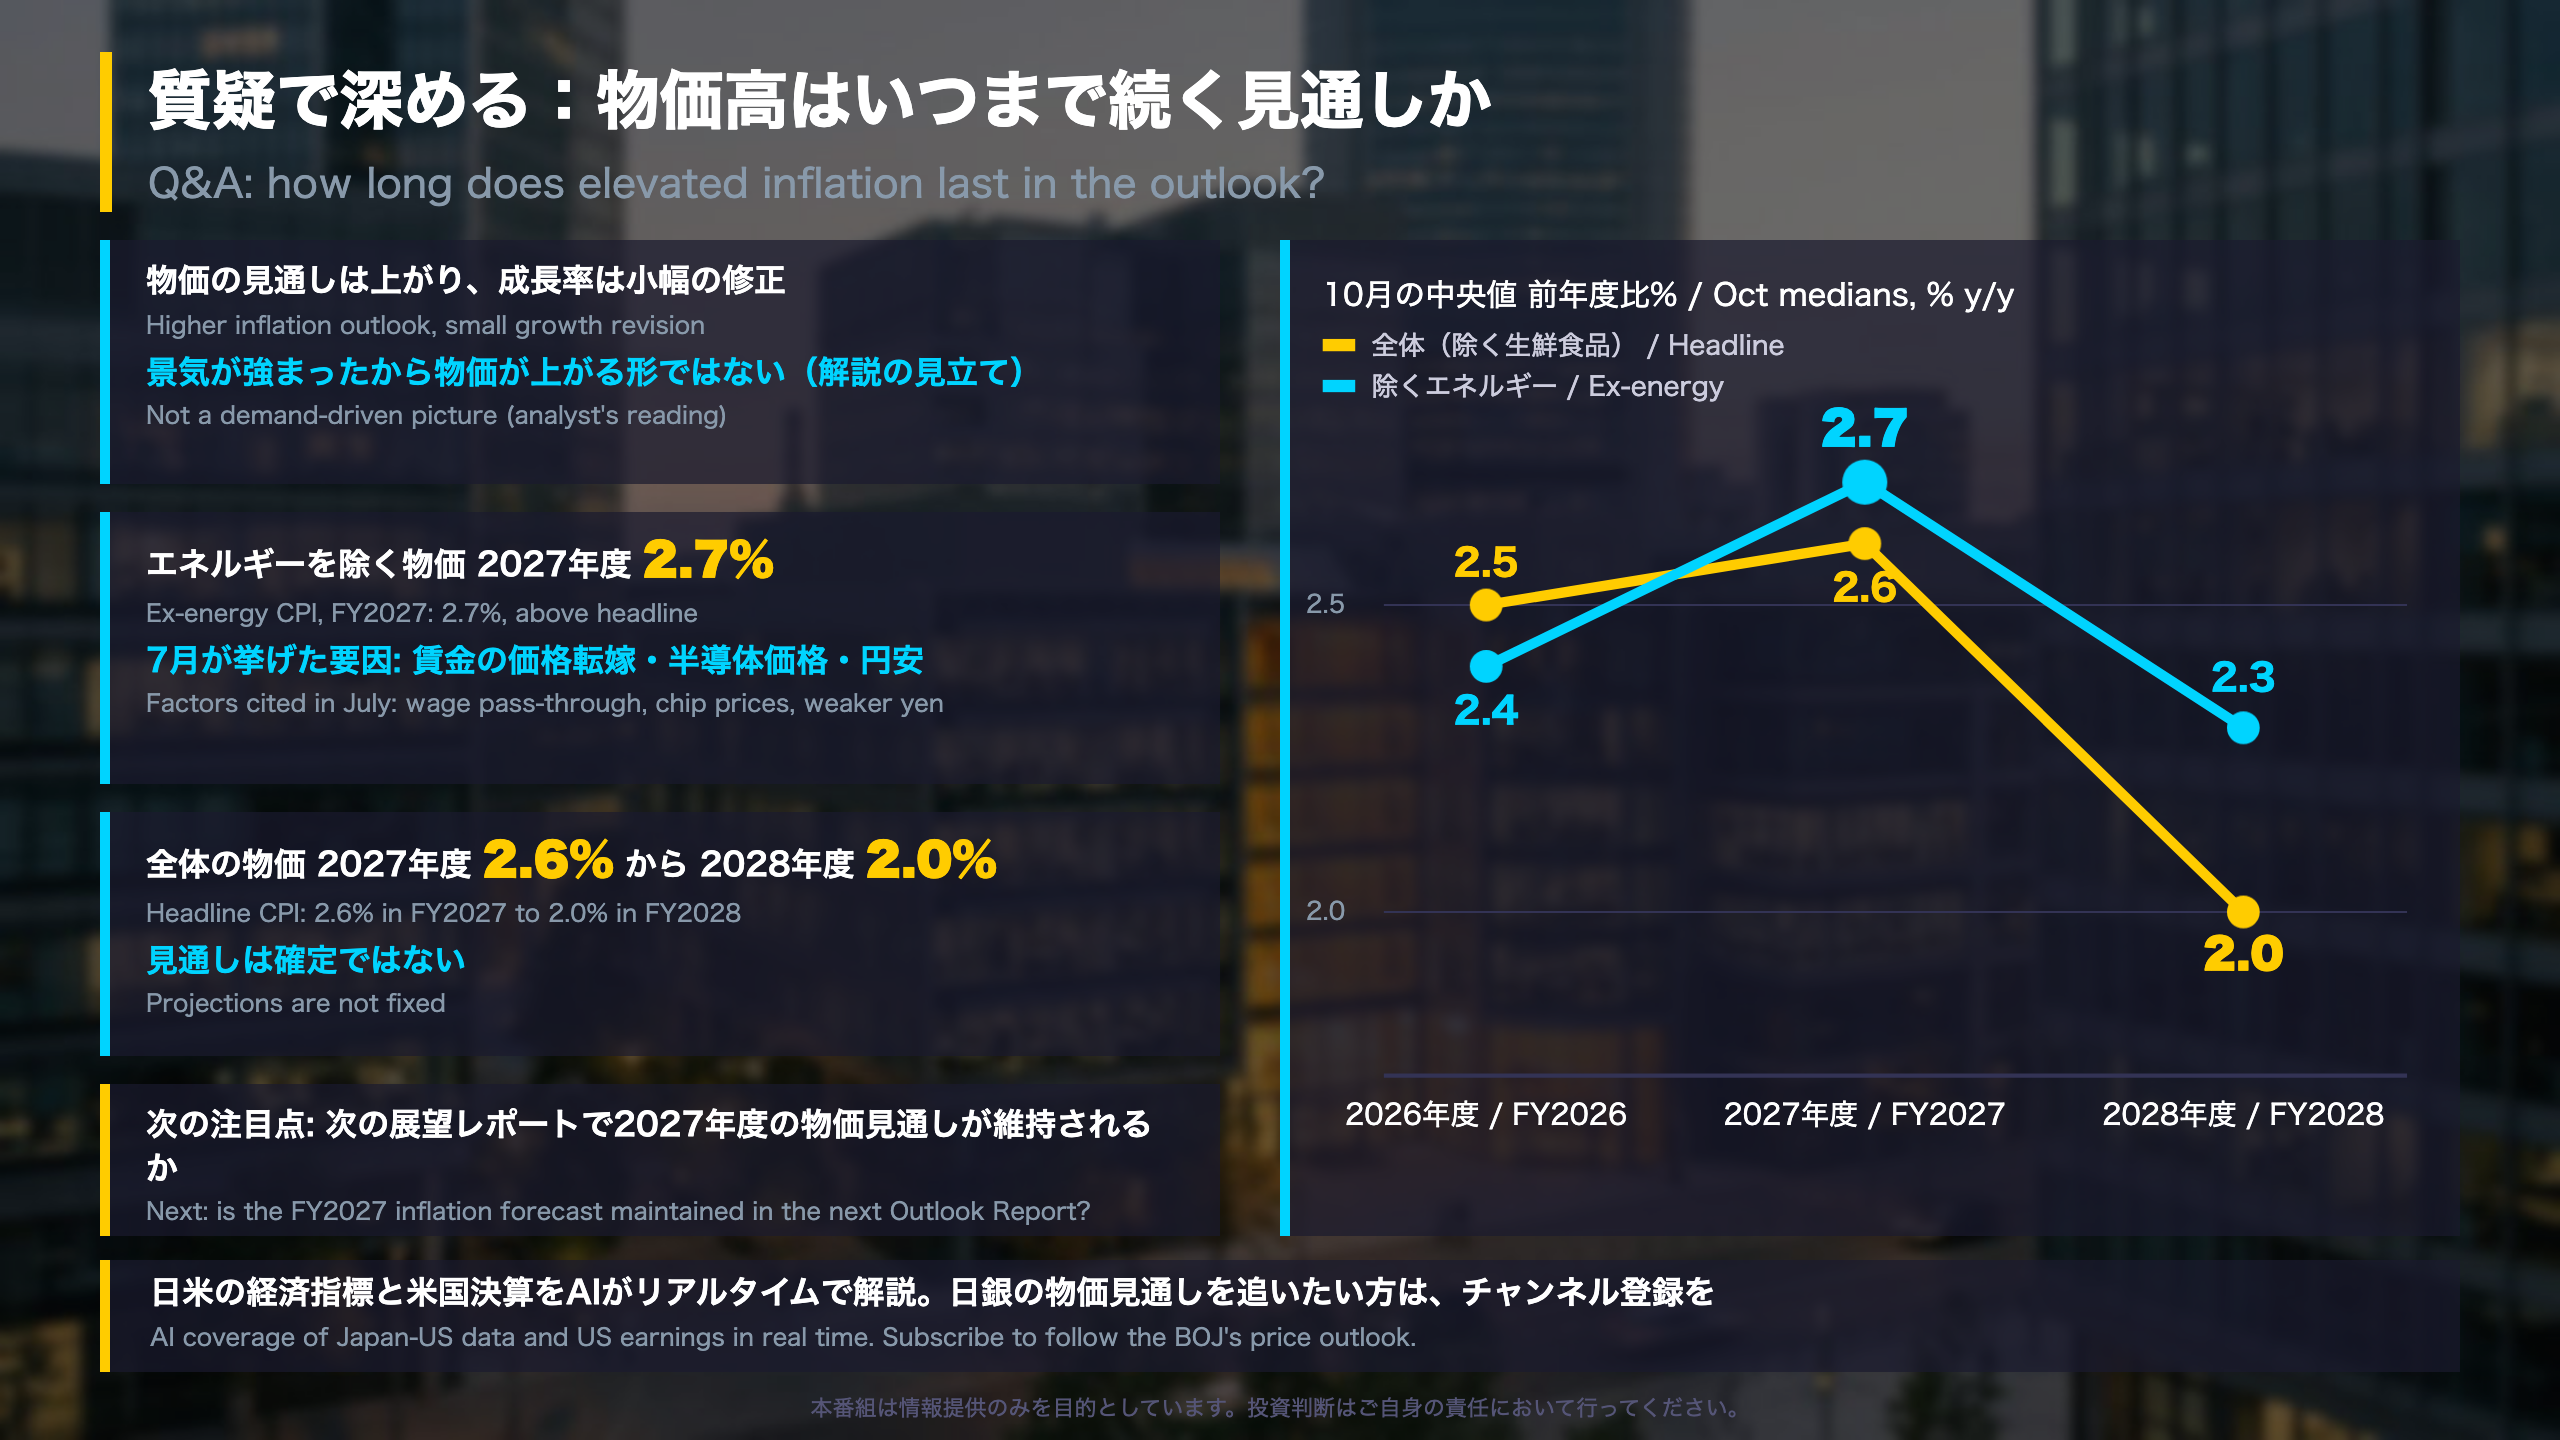
💡 Ex-energy inflation is 2.7% in FY2027, above the 2.6% headline, while FY2028 headline returns to 2.0%, in line with the target.
⚠️ The reasons for the revisions were not directly confirmed in the material; this is an inference from the numbers.
Key check: whether the next report keeps the FY2027 forecast in place.
サマリー:2027年度の物価見通しが上方修正
What the BOJ Outlook Report is
The Outlook Report for Economic Activity and Prices is published by the Bank of Japan (BOJ) after its Monetary Policy Meeting four times a year. Unlike the US Federal Reserve’s Summary of Economic Projections, the BOJ table covers real GDP and CPI only; it contains no policy-rate path. Figures are the median of Policy Board members’ forecasts, shown alongside the majority range after the highest and lowest forecasts are dropped.
The numbers (median, % y/y)
| FY2026 | FY2027 | FY2028 | |
|---|---|---|---|
| Real GDP (Jul to Oct) | 0.6 to 0.7 | 0.8 to 0.7 | 0.8 to 0.8 |
| Core CPI* (Jul to Oct) | 2.5 to 2.5 | 2.4 to 2.6 | 2.0 to 2.0 |
*CPI excluding fresh food. Japan’s fiscal year runs April to March.
Why it matters
BOJ core CPI excludes only fresh food, so it still contains energy, unlike the US core CPI that strips out food and energy. The FY2027 shift of 0.2 point is the largest revision in the table, and the whole majority range moved up, from 2.2-2.5% to 2.4-2.7%.
What to monitor
Growth revisions are all within 0.1 point, so the picture is modest growth alongside firm prices. Investors who follow Japanese rates and the yen will likely watch whether the FY2027 inflation median holds in the next report; this release does not state a date for it.
深掘り1:物価見通しの上方修正
Headline versus ex-energy inflation
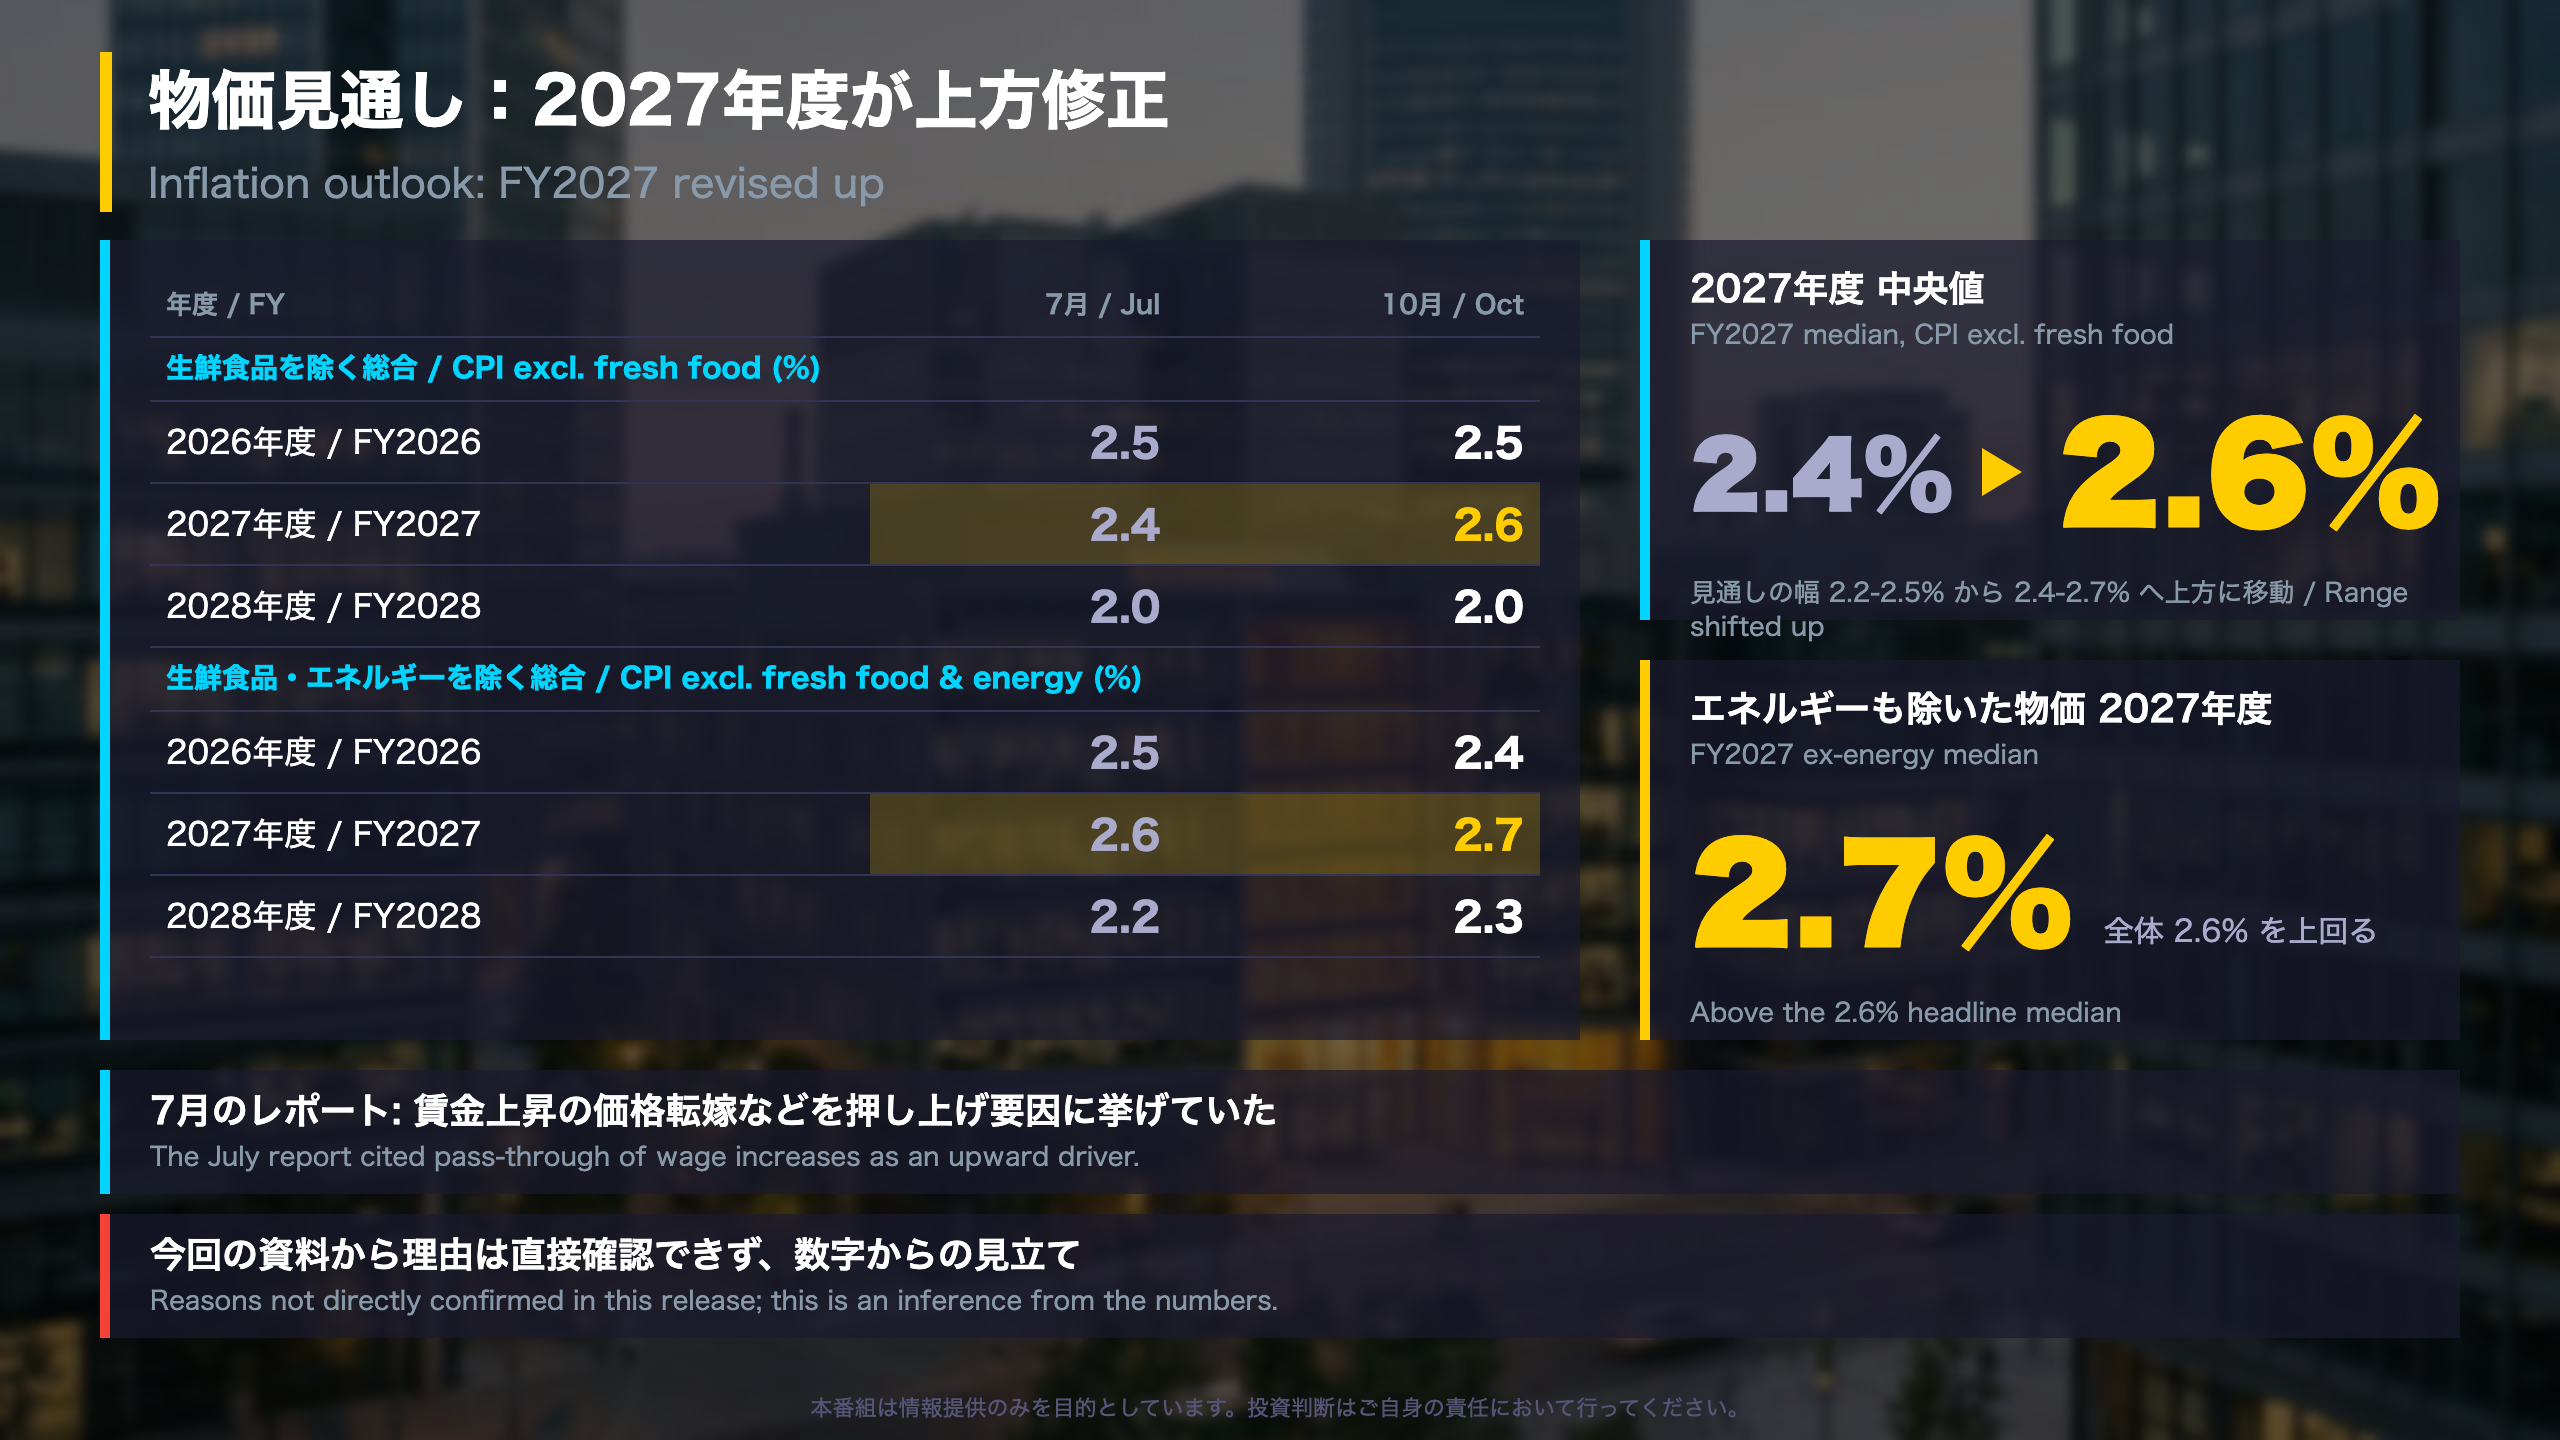
The BOJ table shows two core measures. The headline measure excludes fresh food only; the second, shown as a reference, also excludes energy.
| FY | Ex-fresh food (Jul to Oct) | Ex-fresh food & energy (Jul to Oct) |
|---|---|---|
| 2026 | 2.5 to 2.5 | 2.5 to 2.4 |
| 2027 | 2.4 to 2.6 | 2.6 to 2.7 |
| 2028 | 2.0 to 2.0 | 2.2 to 2.3 |
Reading the gap
Subtracting the ex-energy median from the headline median gives +0.1, -0.1 and -0.3 points for FY2026-28 (our calculation). That suggests energy lifts headline inflation in FY2026 and fades afterward, while underlying prices stay firm.
Two readings
- Persistence view: the ex-energy series was revised up in FY2027 and FY2028, pointing to sticky domestic price pressure.
- Cautious view: FY2026 was flat to slightly lower, and the table alone cannot separate the effect of government energy subsidies that the July report flagged.
Context and next steps
The July report said risks to the price outlook were “skewed to the upside”; we could not confirm equivalent wording in the October text. The BOJ’s 2% price stability target is defined on CPI, whereas the Fed’s 2% target refers to PCE inflation. Watch whether the ex-energy median stays above 2% in the next release.
深掘り2:成長率見通しは小幅な修正
Growth outlook: small shifts, same shape
| FY | July range (median) | October range (median) |
|---|---|---|
| 2026 | 0.6-0.7 (0.6) | 0.7-0.8 (0.7) |
| 2027 | 0.7-0.8 (0.8) | 0.6-0.8 (0.7) |
| 2028 | 0.7-0.8 (0.8) | 0.7-0.9 (0.8) |
What changed
FY2026 moved up at both ends of the range; FY2027’s lower end fell by 0.1 point; FY2028’s upper end rose by 0.1 point. Dispersion that changes differently by year suggests Policy Board members do not share a single view of the recovery pace.
Comparison with July
The July report expected growth to continue at a slower pace in FY2026 and to “gradually increase” thereafter as the drag from higher oil prices fades. The new medians (0.7, 0.7, 0.8) fit that shape. For context, the July report put Japan’s potential growth rate in the mid-to-upper 0% range, so these forecasts sit close to potential.
Balanced view
- Positive: the FY2026 upgrade and the higher FY2028 ceiling suggest less downside concern.
- Cautious: the lower FY2027 floor hints at differing views on the speed of recovery.
Monitoring
All revisions are 0.1 point, small enough that incoming hard data will matter more than the forecasts themselves.
質疑で深める:物価高はいつまで続く見通しか
How long does elevated inflation last in the outlook?
The path
Median core CPI (excluding fresh food) is 2.5% in FY2026, 2.6% in FY2027 and 2.0% in FY2028. The ex-energy series runs 2.4%, 2.7% and 2.3%. The gap between the two is widest in FY2028, when the headline measure returns to the BOJ’s 2% price stability target while the ex-energy series stays above it.
Versus July
July medians were 2.5%, 2.4% and 2.0% (ex-energy: 2.5%, 2.6% and 2.2%). FY2028 headline is unchanged; only the ex-energy line moved up, by 0.1 point.
Bull and bear readings
- Toward the target: a FY2028 headline median of exactly 2.0% matches the target.
- Stickiness: the ex-energy line at 2.3% suggests underlying price increases could persist.
The July report stressed the need to confirm whether inflation settles “at around 2%”; the October numbers imply that confirmation process continues.
Institutional note
The Outlook Report is a forecast, not a policy decision, and unlike the Fed’s dot plot it gives no rate path. We could not read the October narrative text, so the reasons behind the revisions are inferred from the table.
Next
The next report will show whether the FY2027 median of 2.6% holds; this release does not state its date.
Disclaimer: This article is for informational purposes only. All investment decisions are made solely at your own risk.