📺 Watch the Full Video Analysis
This article was automatically generated by the NFC Market Live AI analysis system. (Updated: 2026-11-15 10:40 JST)
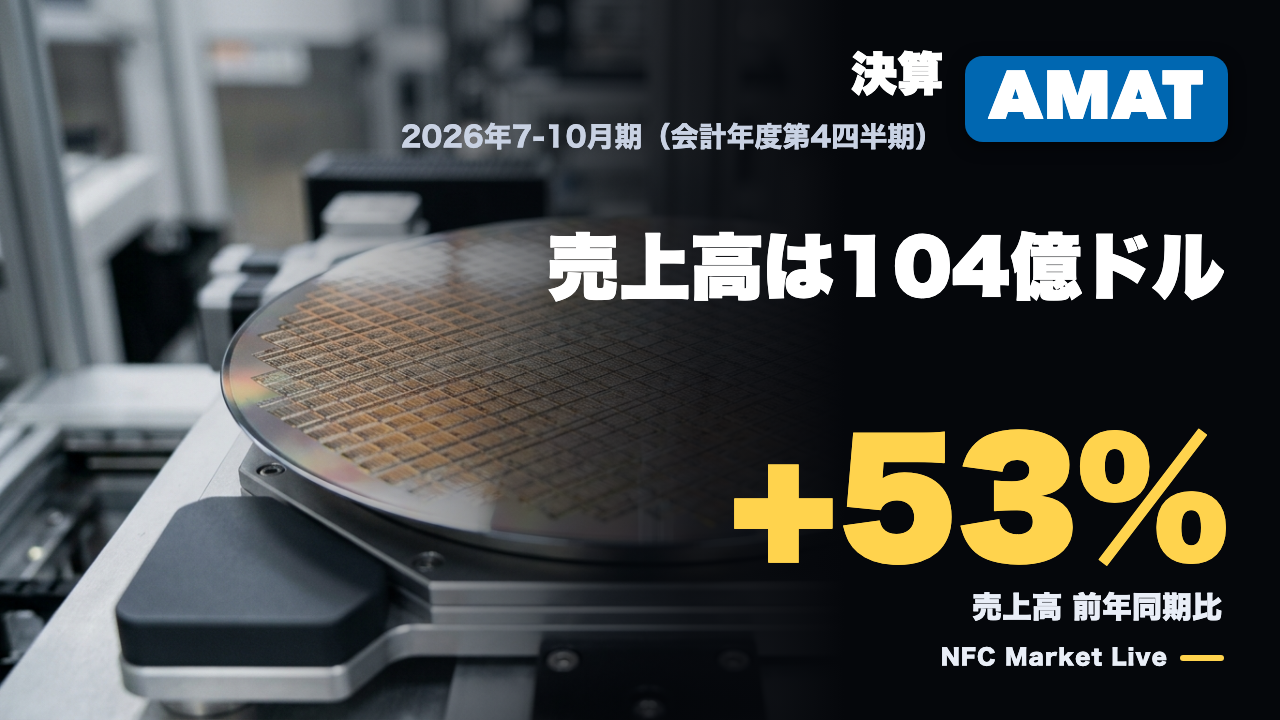
📊 Weekly US Earnings Roundup (Nov 10-13). Applied Materials (AMAT) reported fiscal Q4 (Jul-Oct) revenue of $10.4B, up 53% year over year.
📈 This week’s nine reports
・Applied Materials (AMAT): revenue +53%
・Cisco (CSCO): revenue +24%, full-year outlook raised
・CoreWeave (CRWV): revenue about 2.7x, net loss $709M
・Nebius (NBIS): revenue +571%
・Cerebras (CBRS): cloud revenue +265%, outlook raised
・Rocket Lab (RKLB): record revenue +73%, wider loss
・AST SpaceMobile (ASTS): revenue up, loss and debt rose
・Firefly Aerospace (FLY): revenue +259%, record backlog
・Intuitive Machines (LUNR): revenue about 5x, record backlog
💡 We compare growth with profit and funding, company by company.
今週の米国企業決算まとめ:9項目の目次
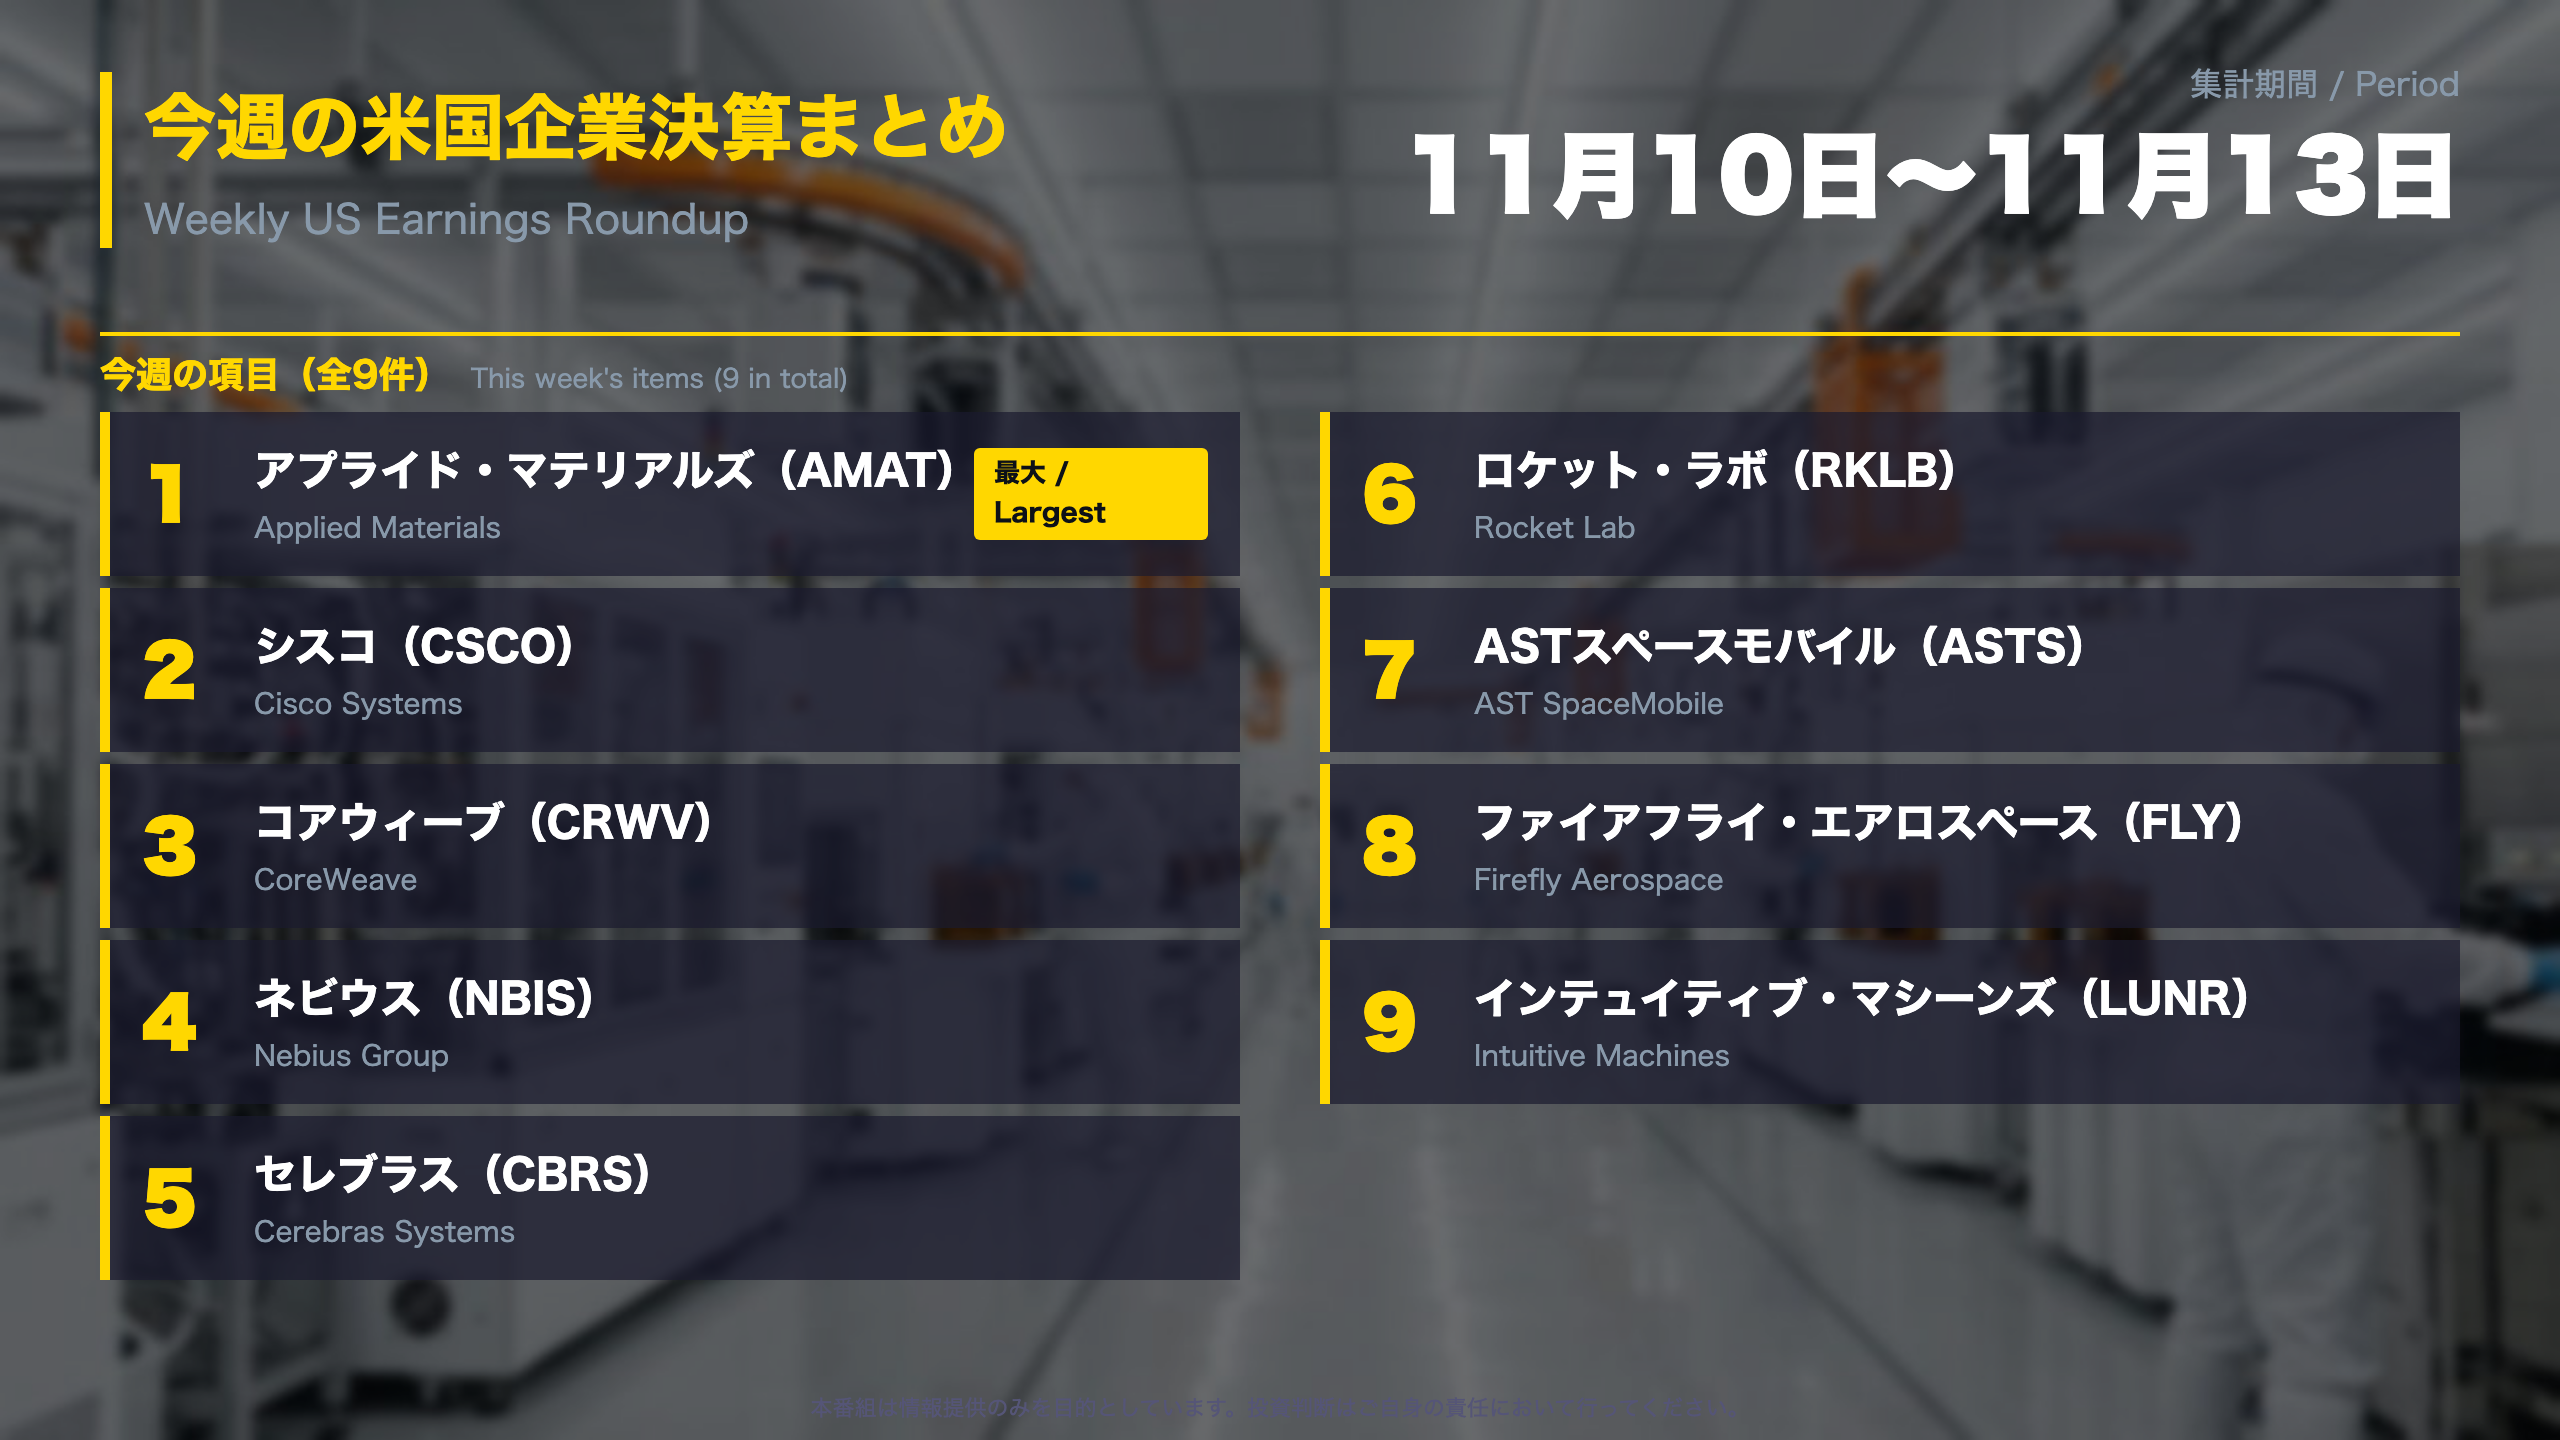
This week’s nine earnings reports (Nov 10-13, 2026)
NFC Market Live covered nine US earnings reports this week. Growth rates are year over year, and dates are as stated in each company’s release.
| Company | Release date | Period | Revenue | YoY |
|---|---|---|---|---|
| Applied Materials | Nov 12 | FQ4 (Jul-Oct) | $10.41B | +53% |
| Cisco | Nov 12 | FY2027 Q1 (Jul-Oct) | $18.52B | +24% |
| CoreWeave | Nov 10 | Jul-Sep | $3.66B | about 2.7x |
| Nebius | Nov 12 | Jul-Sep | $0.98B | +571% |
| Cerebras | Nov 12 | Jul-Sep | $210.8M | +55% |
| Rocket Lab | Nov 9 | Jul-Sep | $267.8M | +72.7% |
| AST SpaceMobile | Nov 9 | Jul-Sep | $42.3M | about 2.9x |
| Firefly Aerospace | Nov 10 | Jul-Sep | $110.7M | +259% |
| Intuitive Machines | Nov 12 | Jul-Sep | $269.4M | about 5x |
How to read the numbers
- Fiscal calendars differ. Applied Materials’ fiscal Q4 and Cisco’s fiscal 2027 Q1 both cover July-October. The other seven companies report July-September.
- GAAP vs. adjusted. GAAP follows accounting standards, while adjusted (non-GAAP) figures exclude items the company treats as one-off. Applied Materials reported adjusted EPS of $4.16 versus GAAP EPS of $3.40, and the gap is mostly unrealized losses on strategic investments.
- Base effects. Very high growth rates partly reflect small revenue bases at several of these companies.
“AI continues to fuel strong incremental demand for semiconductors” – Gary Dickerson, CEO, Applied Materials
Two ways to read the week
- Constructive: Applied Materials and Cisco grew revenue and widened adjusted operating margins (35.3% vs 28.6%, and 37.8% vs 34.4%).
- Cautious: The AI cloud and space names grew revenue sharply but still report losses on a GAAP basis.
None of the companies’ next earnings dates appear in the source materials.
AMAT 決算:売上高は前年同期比53%増、装置部門が牽引
Semiconductor Systems: Where the Growth Came From
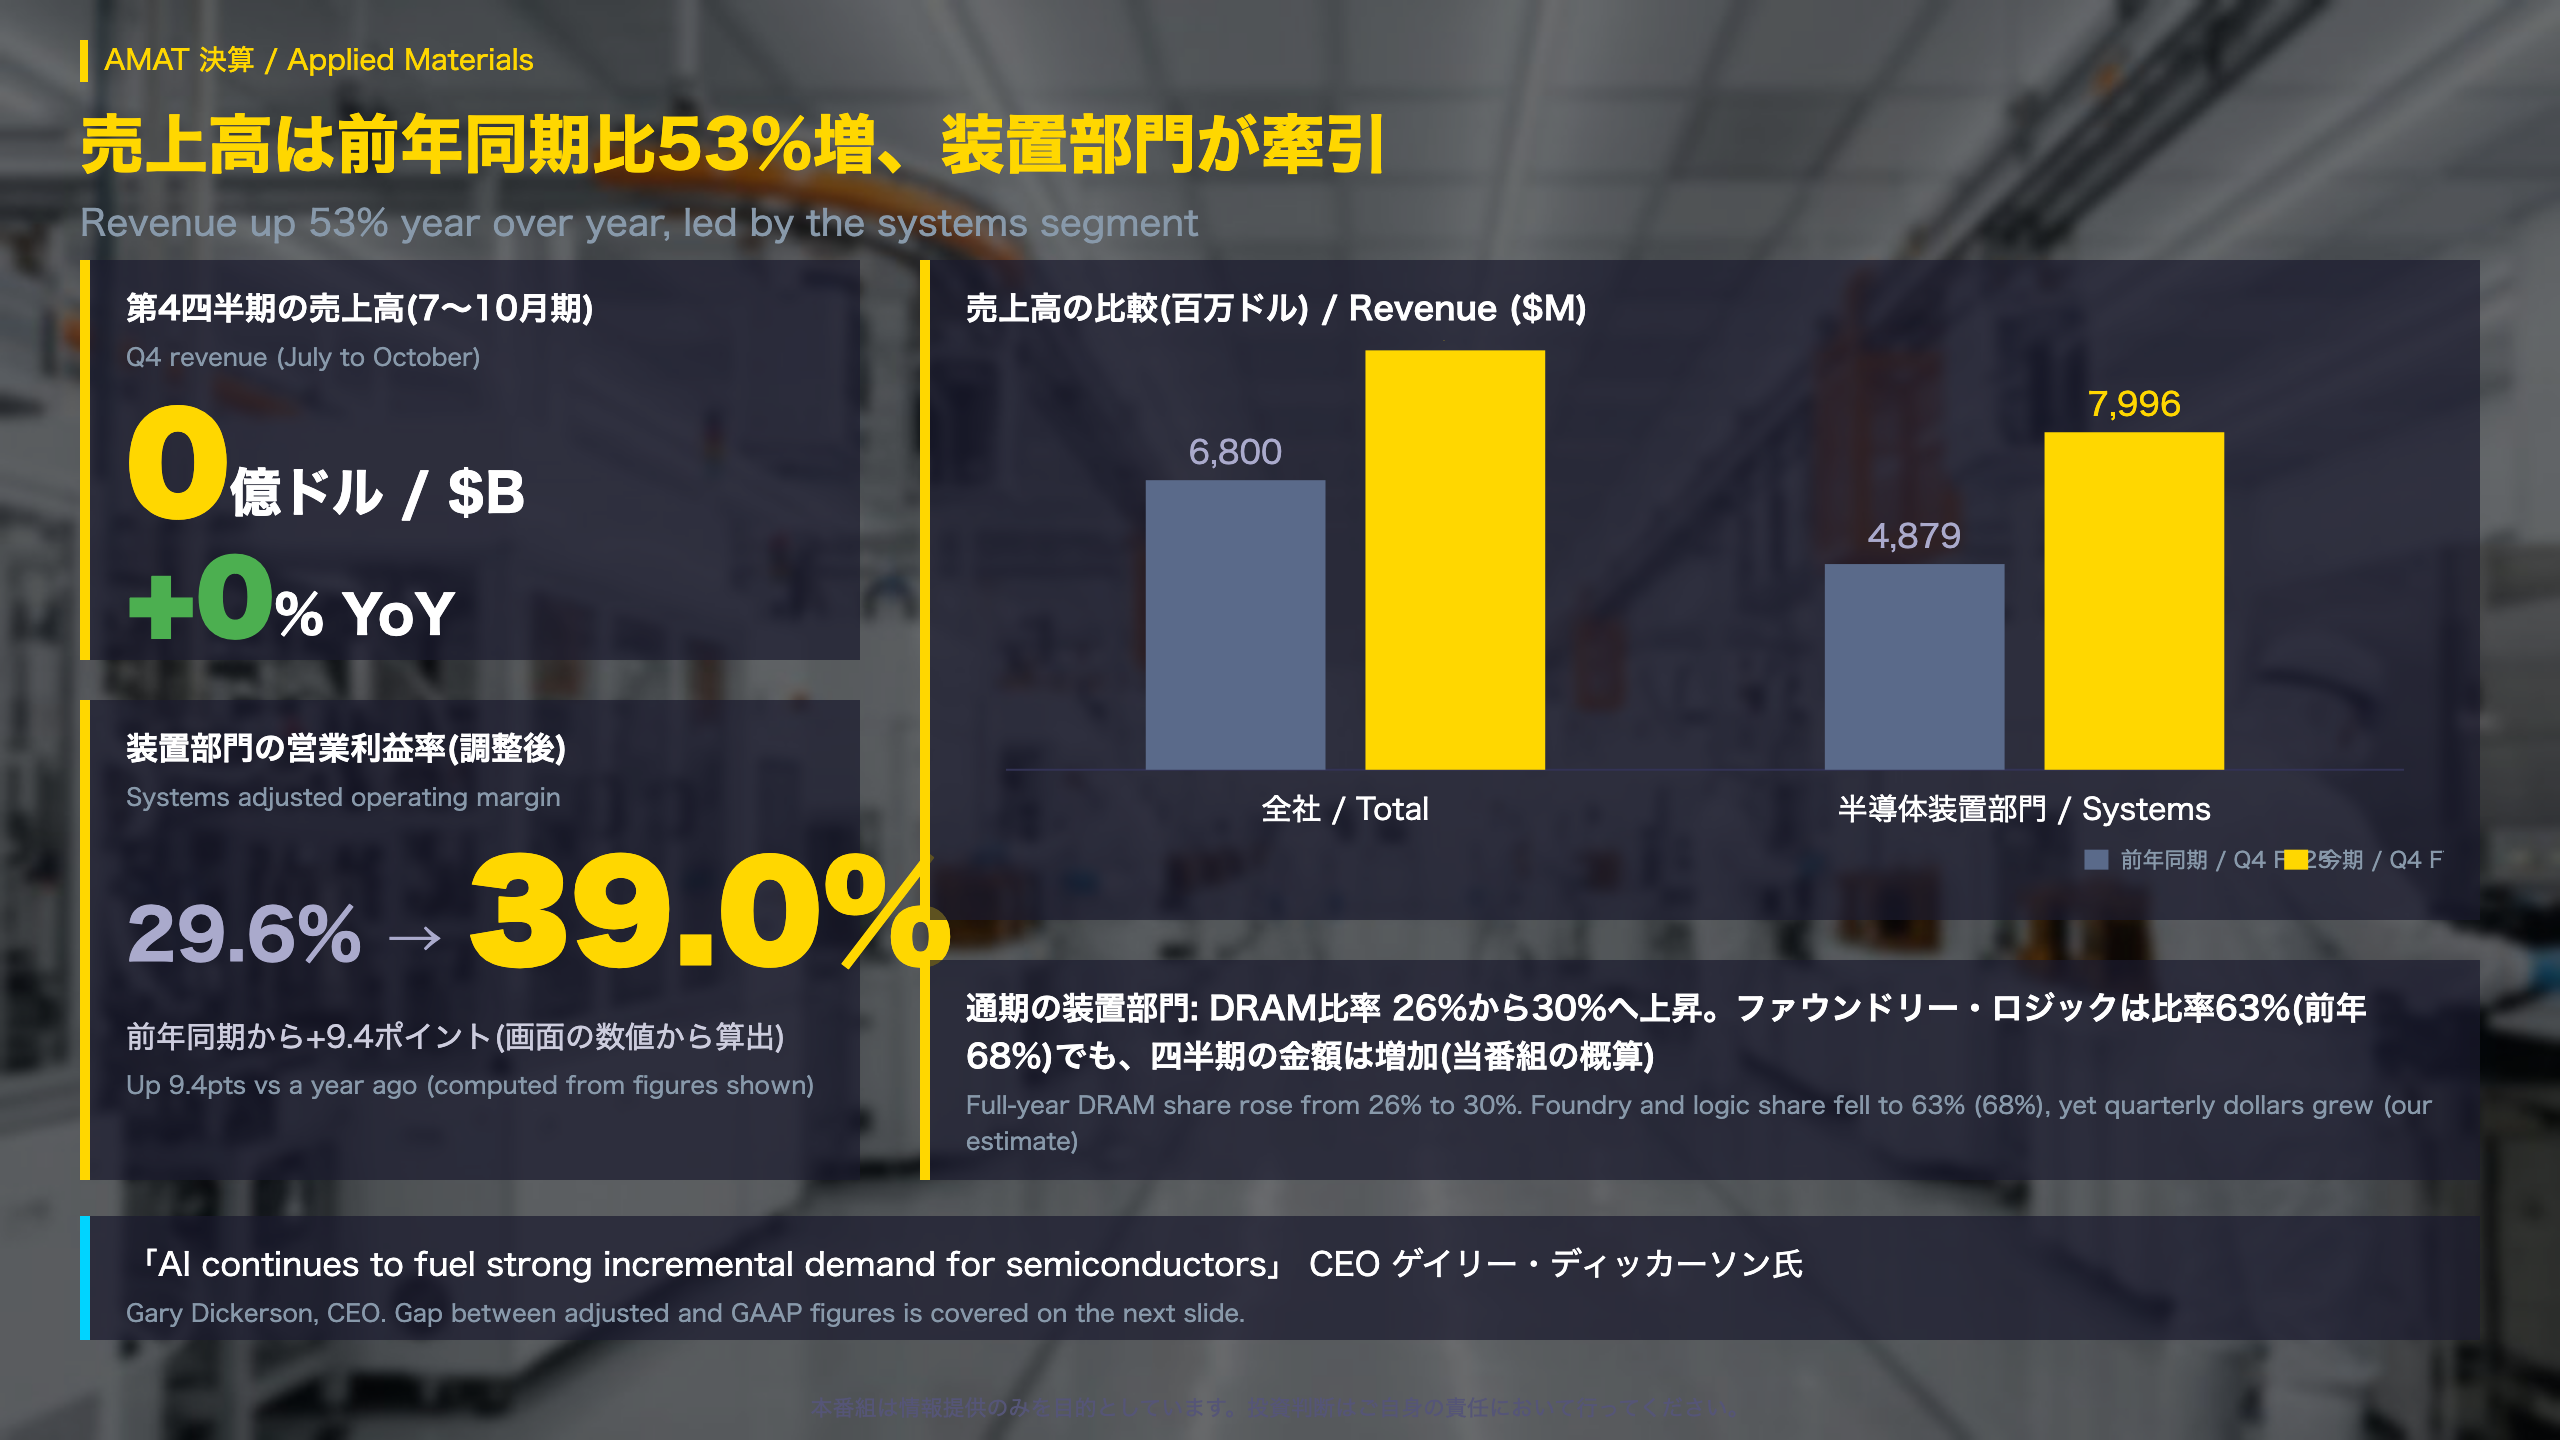
Applied Materials (AMAT) supplies the equipment that chipmakers use to build wafers. Its fiscal year does not follow the calendar: the fourth quarter of fiscal 2026 ran roughly July to October 2026. Revenue was $10,409 million, up 53% from $6,800 million a year earlier.
The segment table
| Semiconductor Systems | Q4 FY26 | Q4 FY25 |
|---|---|---|
| Revenue | $7,996M | $4,879M |
| Adjusted gross margin | 55.2% | 52.8% |
| Adjusted operating margin | 39.0% | 29.6% |
Full-year segment revenue reached $26,142 million versus $21,441 million. By end market, foundry and logic made up 63% of full-year segment sales (68% a year earlier), DRAM 30% (26%) and flash 7% (6%).
Our own arithmetic
Applying the quarterly mix to segment revenue, foundry and logic rose from about $3,220 million to about $4,640 million. The share fell, yet the dollar amount grew. This calculation is ours, not the company’s.
Other items in the release
- The services business (AGS) posted revenue of $1,896 million and a 30.5% operating margin.
- Intel joined the EPIC Center in Silicon Valley as a founding partner.
- The company raised its stake in Besi to about 20% through an accelerated share repurchase arrangement.
Reading the numbers
The adjusted figures are non-GAAP measures, meaning the company excludes certain items. They are useful for comparing operating performance, but they are not the statutory profit. On the positive side, both margins improved from a year ago. On the cautious side, the filing flags the concentrated nature of the customer base, and the CEO’s outlook for margins above 40% is a company projection, not a result.
利益の中身とキャッシュ:調整後と会計基準の差、売掛金
Reconciling Adjusted and GAAP Earnings
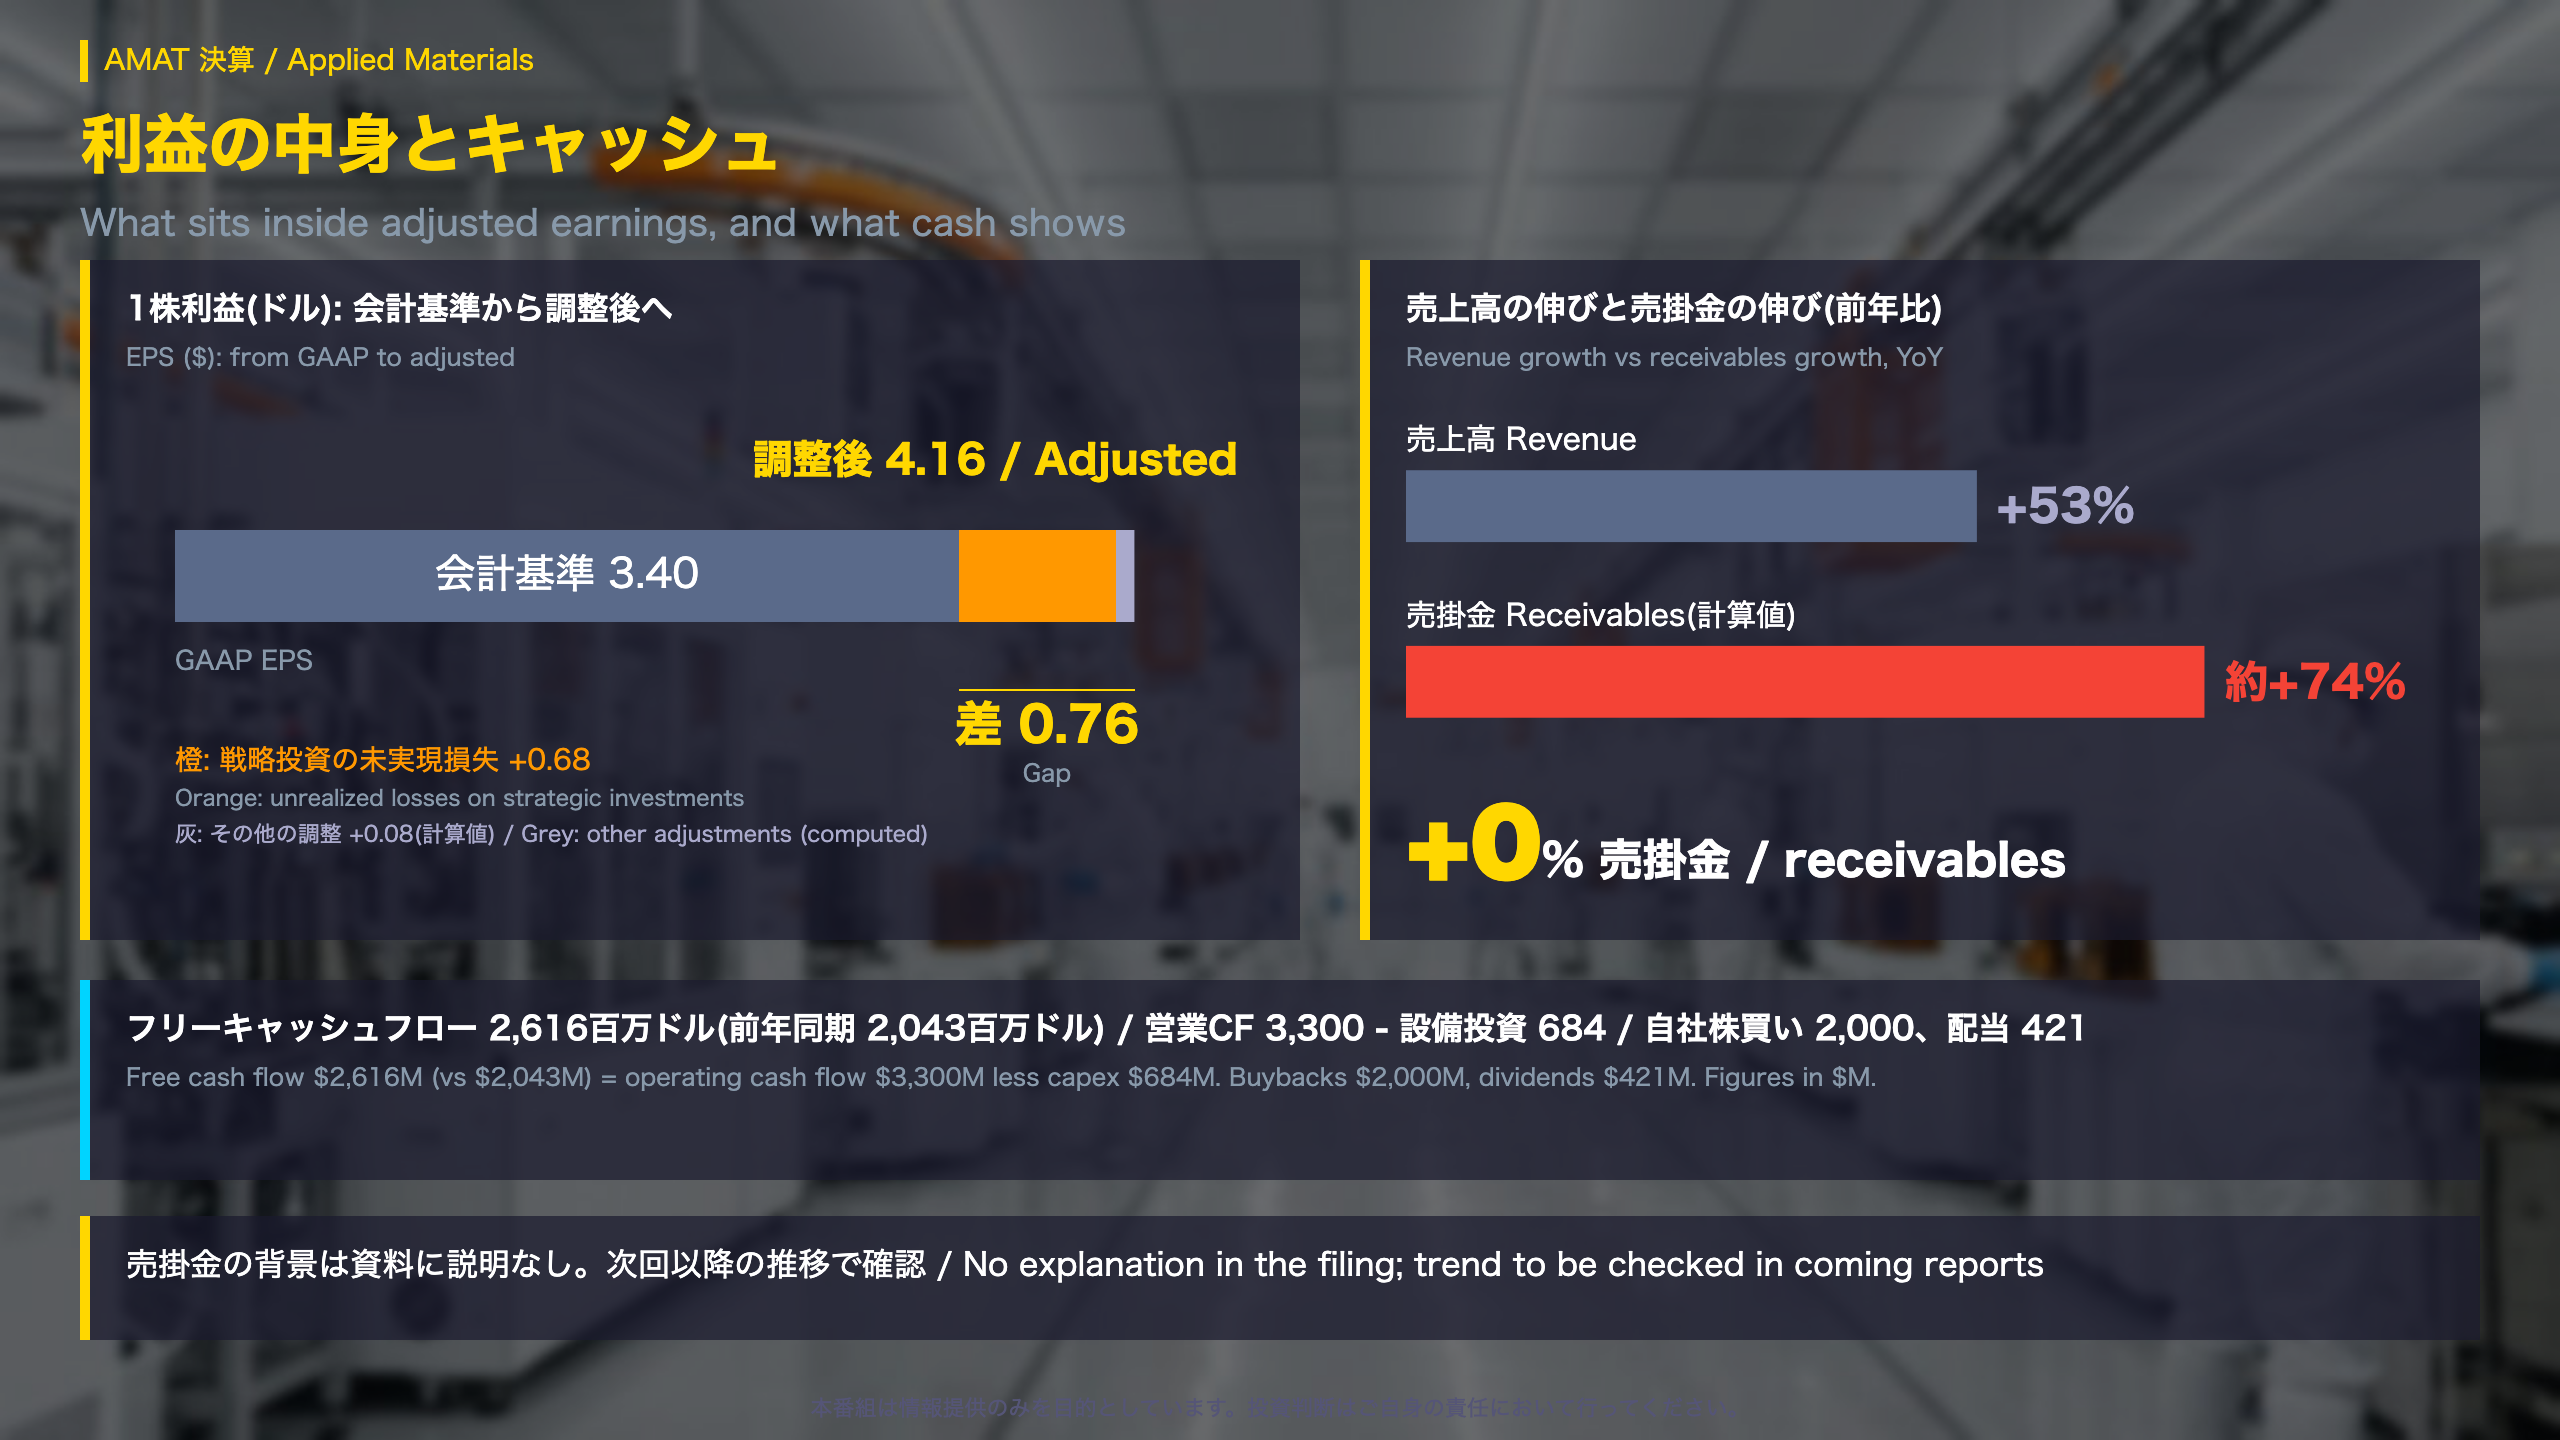
US companies report earnings under GAAP, the accounting standard that regulators require. Many also publish an adjusted (non-GAAP) figure that excludes items management considers non-recurring. Applied Materials reported adjusted EPS of $4.16 against GAAP EPS of $3.40, a gap of $0.76.
What the reconciliation shows
| Item | Per share |
|---|---|
| GAAP EPS | $3.40 |
| Unrealized losses on strategic investments | +$0.68 |
| Realized losses, dividends and similar | +$0.02 |
| Acquisition-related costs | +$0.02 |
| Integration and transaction costs | +$0.01 |
| Tax effect of intangible asset transfer | +$0.06 |
| Resolution of prior-year tax items | -$0.03 |
| Adjusted EPS | $4.16 |
The unrealized investment loss accounts for most of the gap. Quarterly interest and other income was an expense of $513 million, compared with income of $626 million a year earlier. That swing drives the GAAP result.
Cash generation
Operating cash flow was $3,300 million (vs $2,828 million) and capital spending $684 million, leaving free cash flow of $2,616 million (vs $2,043 million). The company repurchased $2,000 million of shares and paid $421 million in dividends. The CFO said it distributed over $2.4 billion to shareholders, including “the largest quarterly share buyback in more than eight years.”
A balance sheet item to watch
Accounts receivable stood at $8,998 million versus $5,185 million a year earlier, roughly 74% higher by our calculation, while quarterly revenue rose 53%. Short-term debt rose to $1,299 million from $100 million. The release offers no explanation for the receivables move, so it is a data point to track in the next report rather than a conclusion.
次の四半期の見通しと、資料が挙げるリスク
Guidance and the Risks the Company Lists
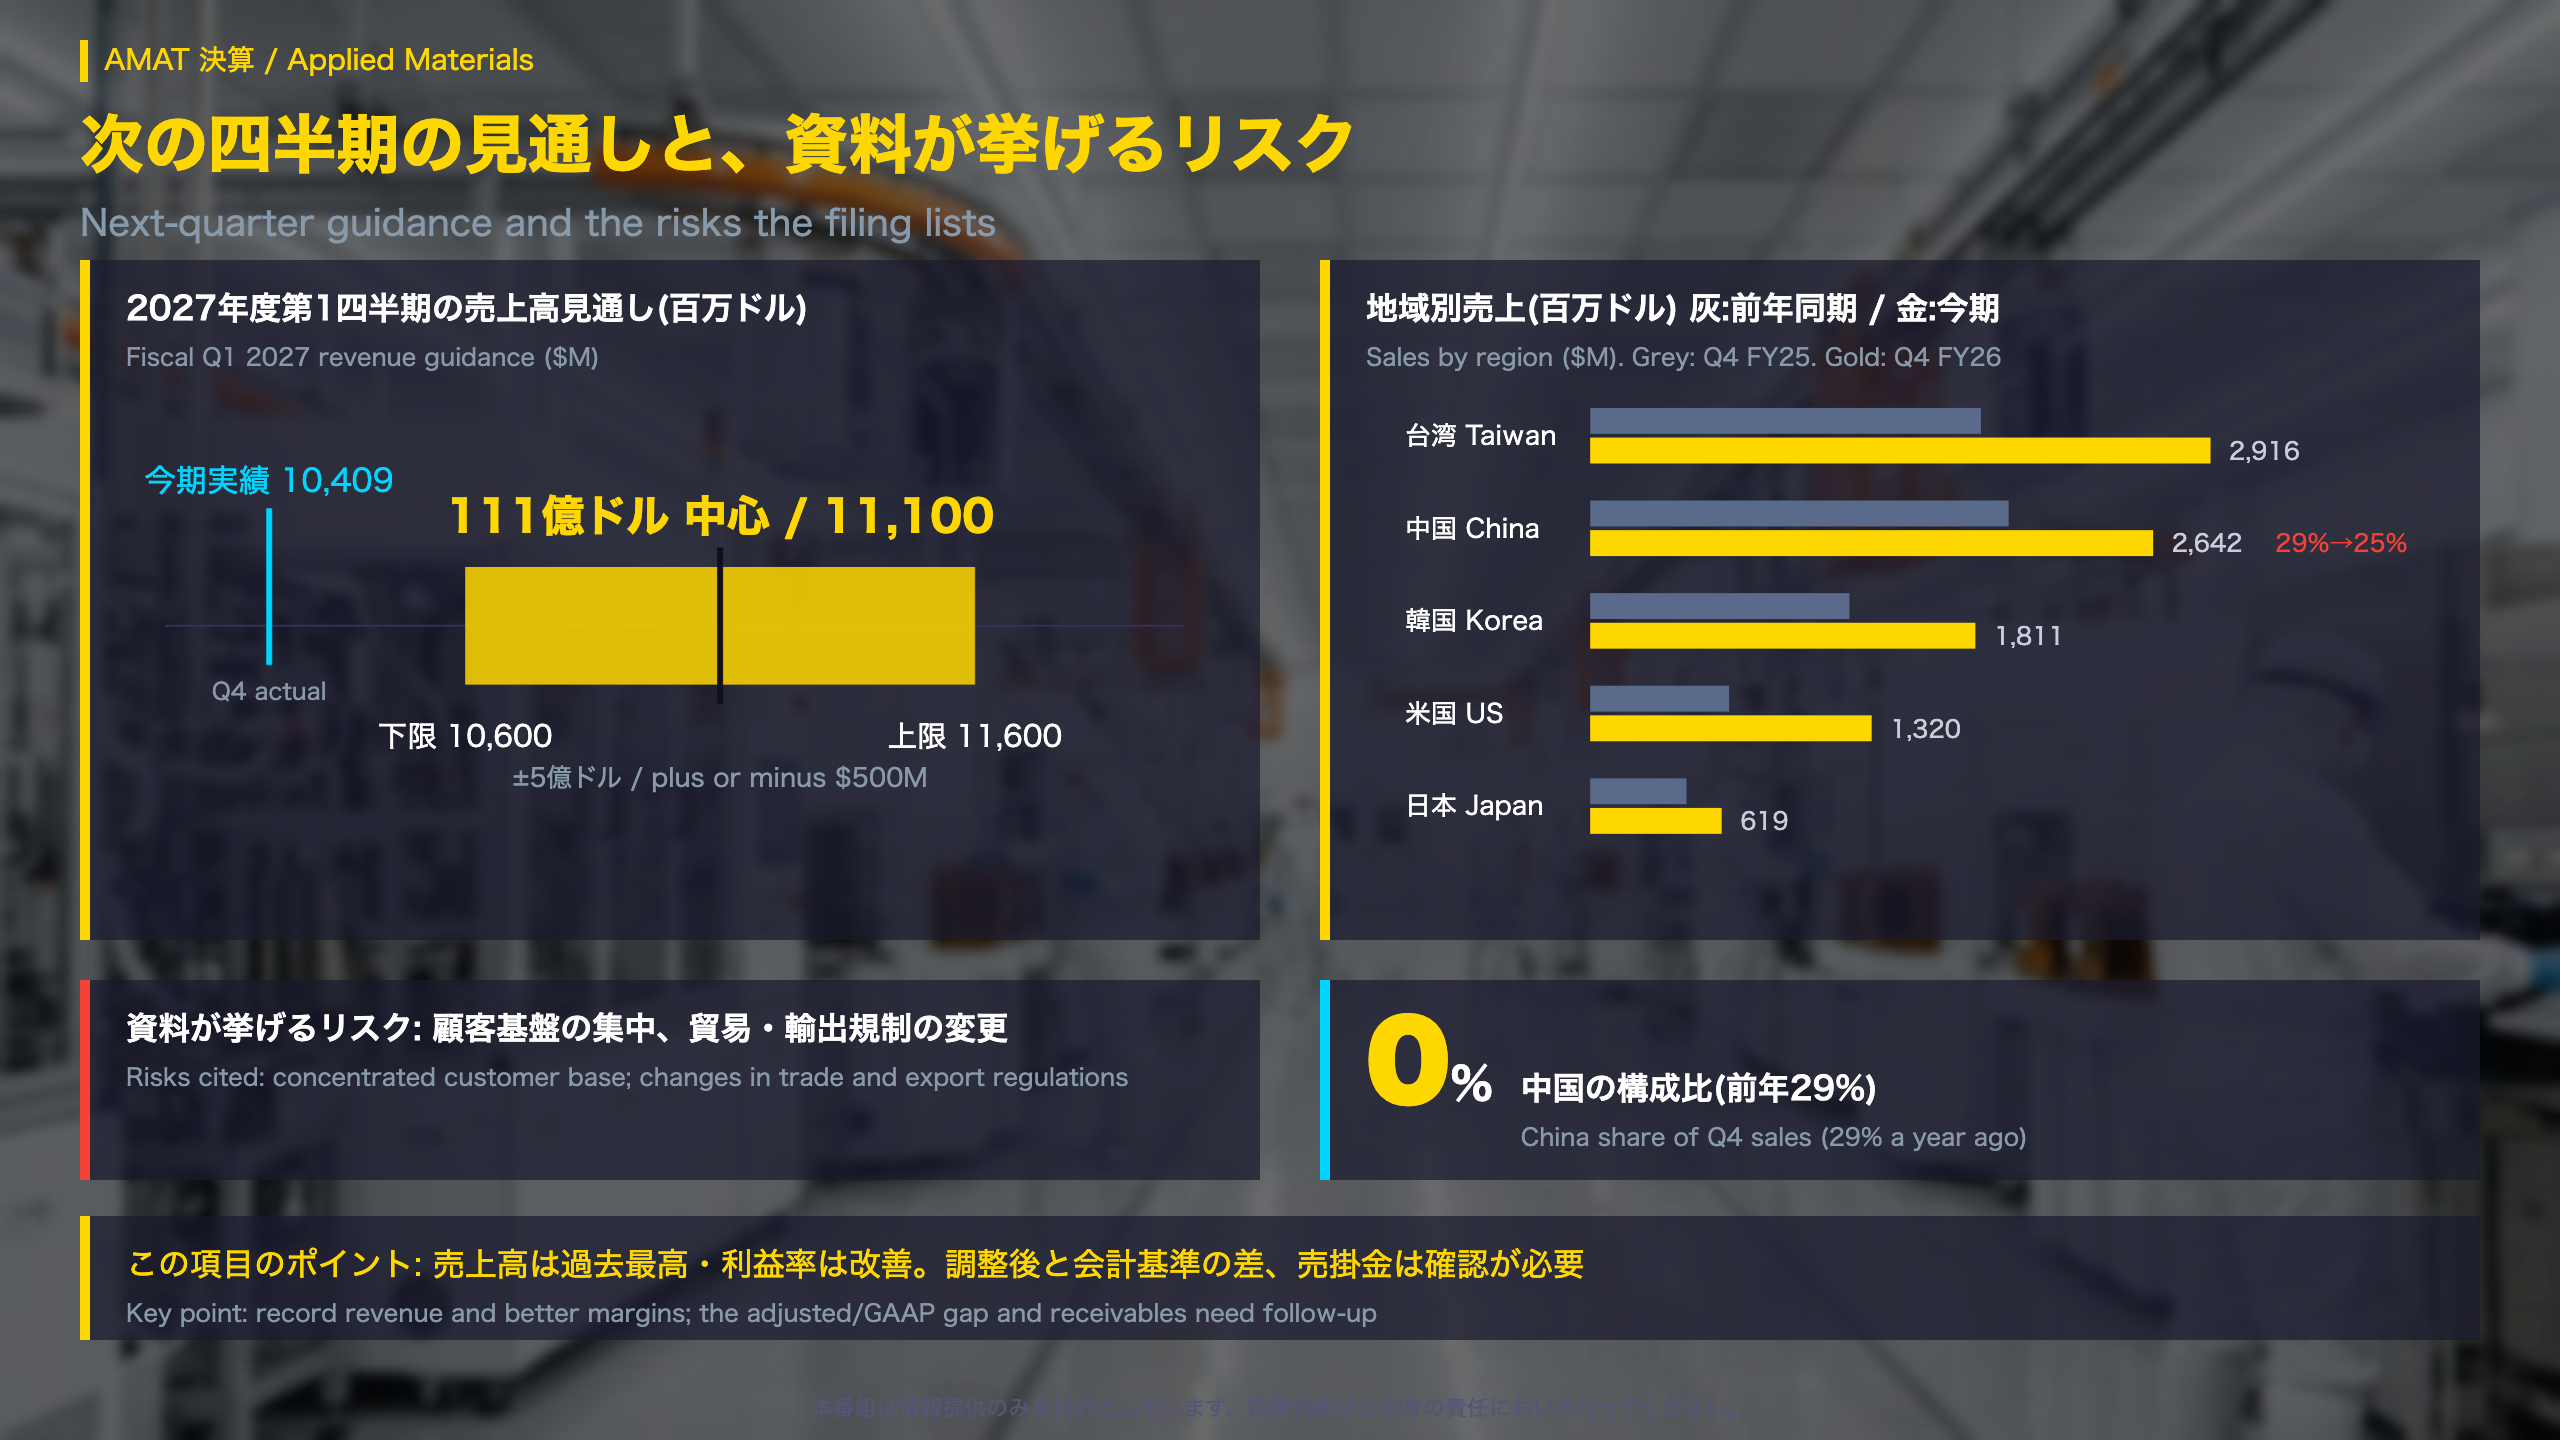
Applied Materials guided the first quarter of fiscal 2027 (its own fiscal calendar, not the calendar year) as follows:
| Item | Guidance | Implied range |
|---|---|---|
| Revenue | $11,100M ± $500M | $10,600M to $11,600M |
| Adjusted EPS | $4.35 ± $0.20 | $4.15 to $4.55 |
The low end of the revenue range is above the latest quarter’s $10,409 million. The low end of EPS guidance, $4.15, is roughly level with the latest $4.16. The EPS guide includes a $0.04 benefit from a tax effect related to an intangible asset transfer and excludes $0.01 of acquisition-related costs.
Sales by region (Q4, $M)
| Region | Q4 FY26 | Q4 FY25 |
|---|---|---|
| Taiwan | 2,916 | 1,834 |
| China | 2,642 | 1,964 |
| Korea | 1,811 | 1,219 |
| United States | 1,320 | 655 |
| Japan | 619 | 448 |
China’s share of sales fell from 29% to 25%, though its dollar sales grew.
Risks in the company’s own words
The filing lists “the concentrated nature of our customer base” and “changes in trade and export regulations, license requirements” among its risk factors. It also notes a $253 million settlement with the US Commerce Department’s Bureau of Industry and Security over suspected export-control violations, recorded in the full year and affecting full-year GAAP profit.
Two ways to read it
The constructive reading is that dollar sales grew in every region and even the low end of guidance implies growth. The cautious reading is that guidance is a company forecast, and the impact of customer concentration and export rules only becomes visible in reported results. The next earnings date is not given in the source, so the first checkpoint is whether revenue lands inside $10.6 billion to $11.6 billion.
売上24%増、成長の中心はネットワーキング
Reading Cisco’s fiscal Q1 2027 product mix
Who and what: Cisco Systems is a US networking and security hardware, software and services company. Its fiscal year does not follow the calendar year, so the quarter covered here is labeled fiscal Q1 2027 and was reported on November 12, 2026. Cisco reports both GAAP results, which follow accounting standards, and adjusted (non-GAAP) results, which strip out items such as one-off charges.
The headline numbers
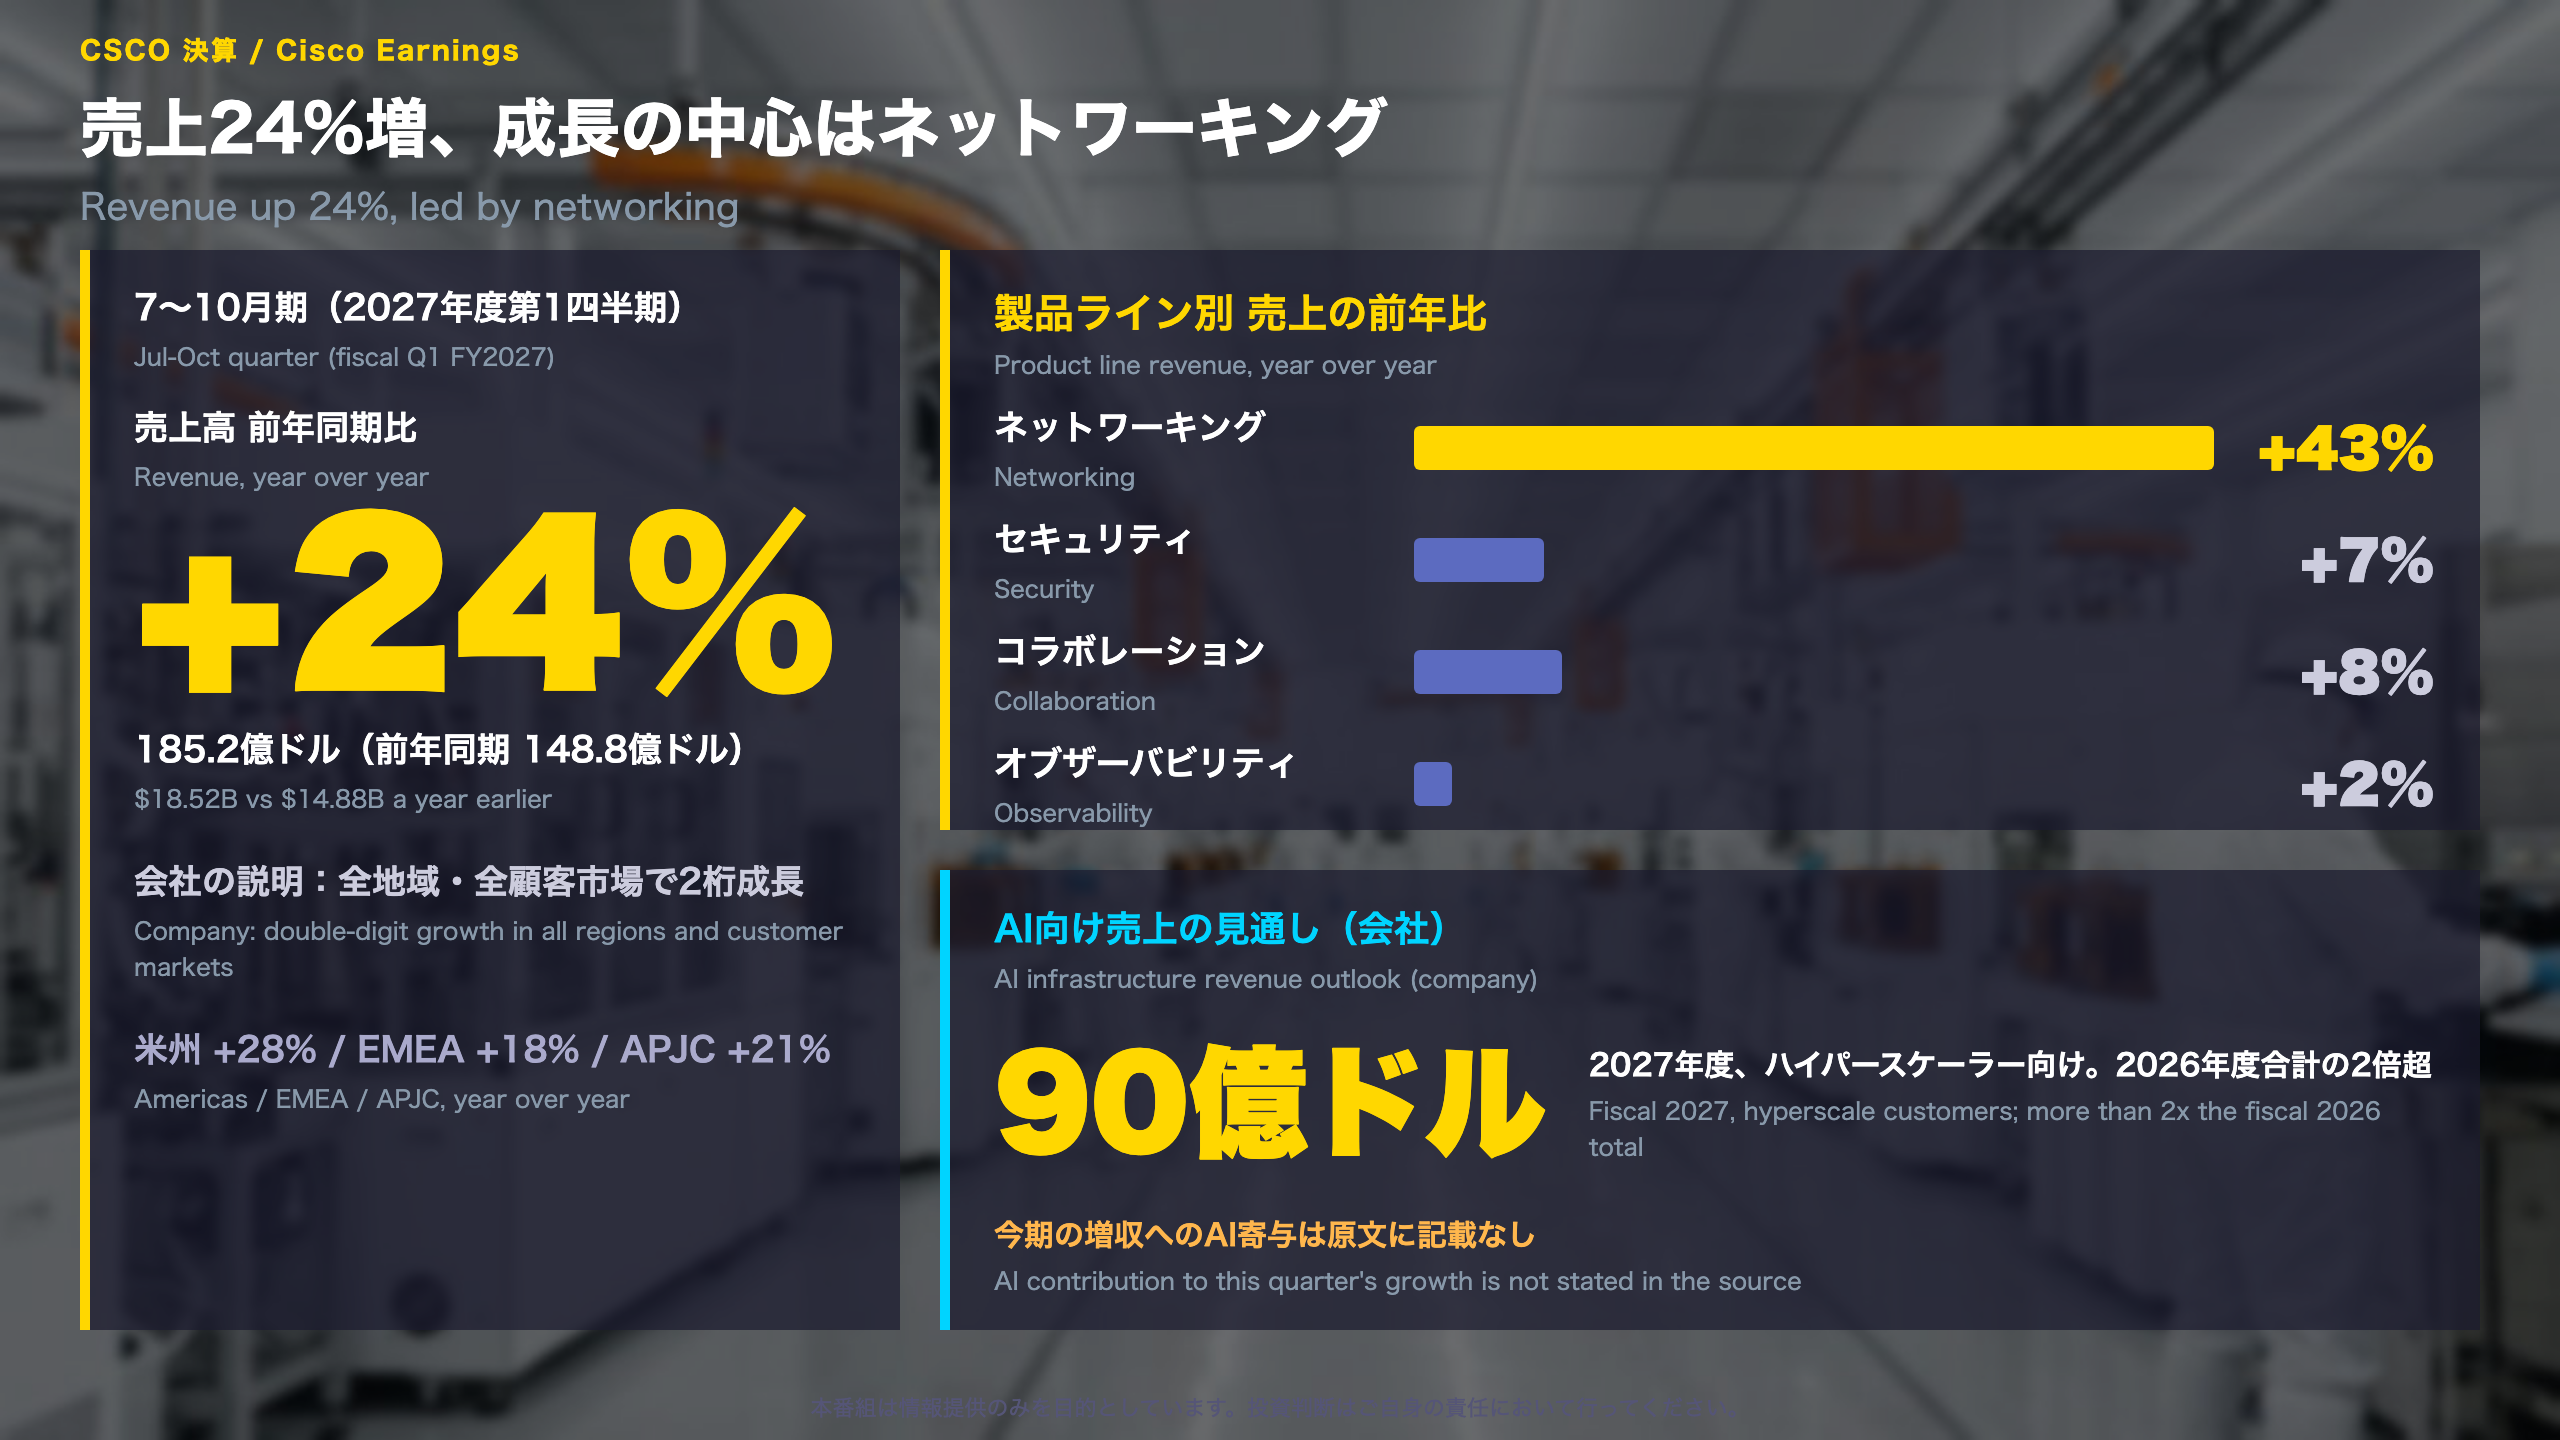
- Revenue: $18.52 billion, up 24% from $14.88 billion
- Adjusted EPS: $1.40 (+40%); GAAP EPS: $1.14 (+58%)
- Regions: Americas +28%, EMEA +18%, APJC +21%
Where the growth sits
Networking revenue was $11.13 billion, up 43%. Security (+7%), collaboration (+8%) and observability (+2%) all grew in single digits, and services were nearly flat ($3.81 billion to $3.85 billion). Product revenue overall rose from $11.08 billion to $14.67 billion.
What the source does and does not say
The company states that it grew at a double-digit pace in every region and customer market, and it raised its fiscal 2027 outlook for AI infrastructure revenue from hyperscale customers to $9 billion, more than double the fiscal 2026 total. The filing does not break out how much of this quarter’s networking growth came from AI orders, so linking the two would be an inference, not a reported fact.
‘We are in the very early stages of a multi-year networking supercycle.’ – CEO Robbins
That is management’s own framing and cannot be verified from the release itself.
Two ways to read it
- Constructive: broad regional strength suggests the gain is not tied to a single market.
- Cautious: with three of four product lines in single digits, overall growth leans heavily on one line.
Cisco also completed the acquisition of WideField Security during the quarter; the price was not disclosed in the material.
営業利益率は改善、粗利益率は低下
How Cisco’s margins fit together
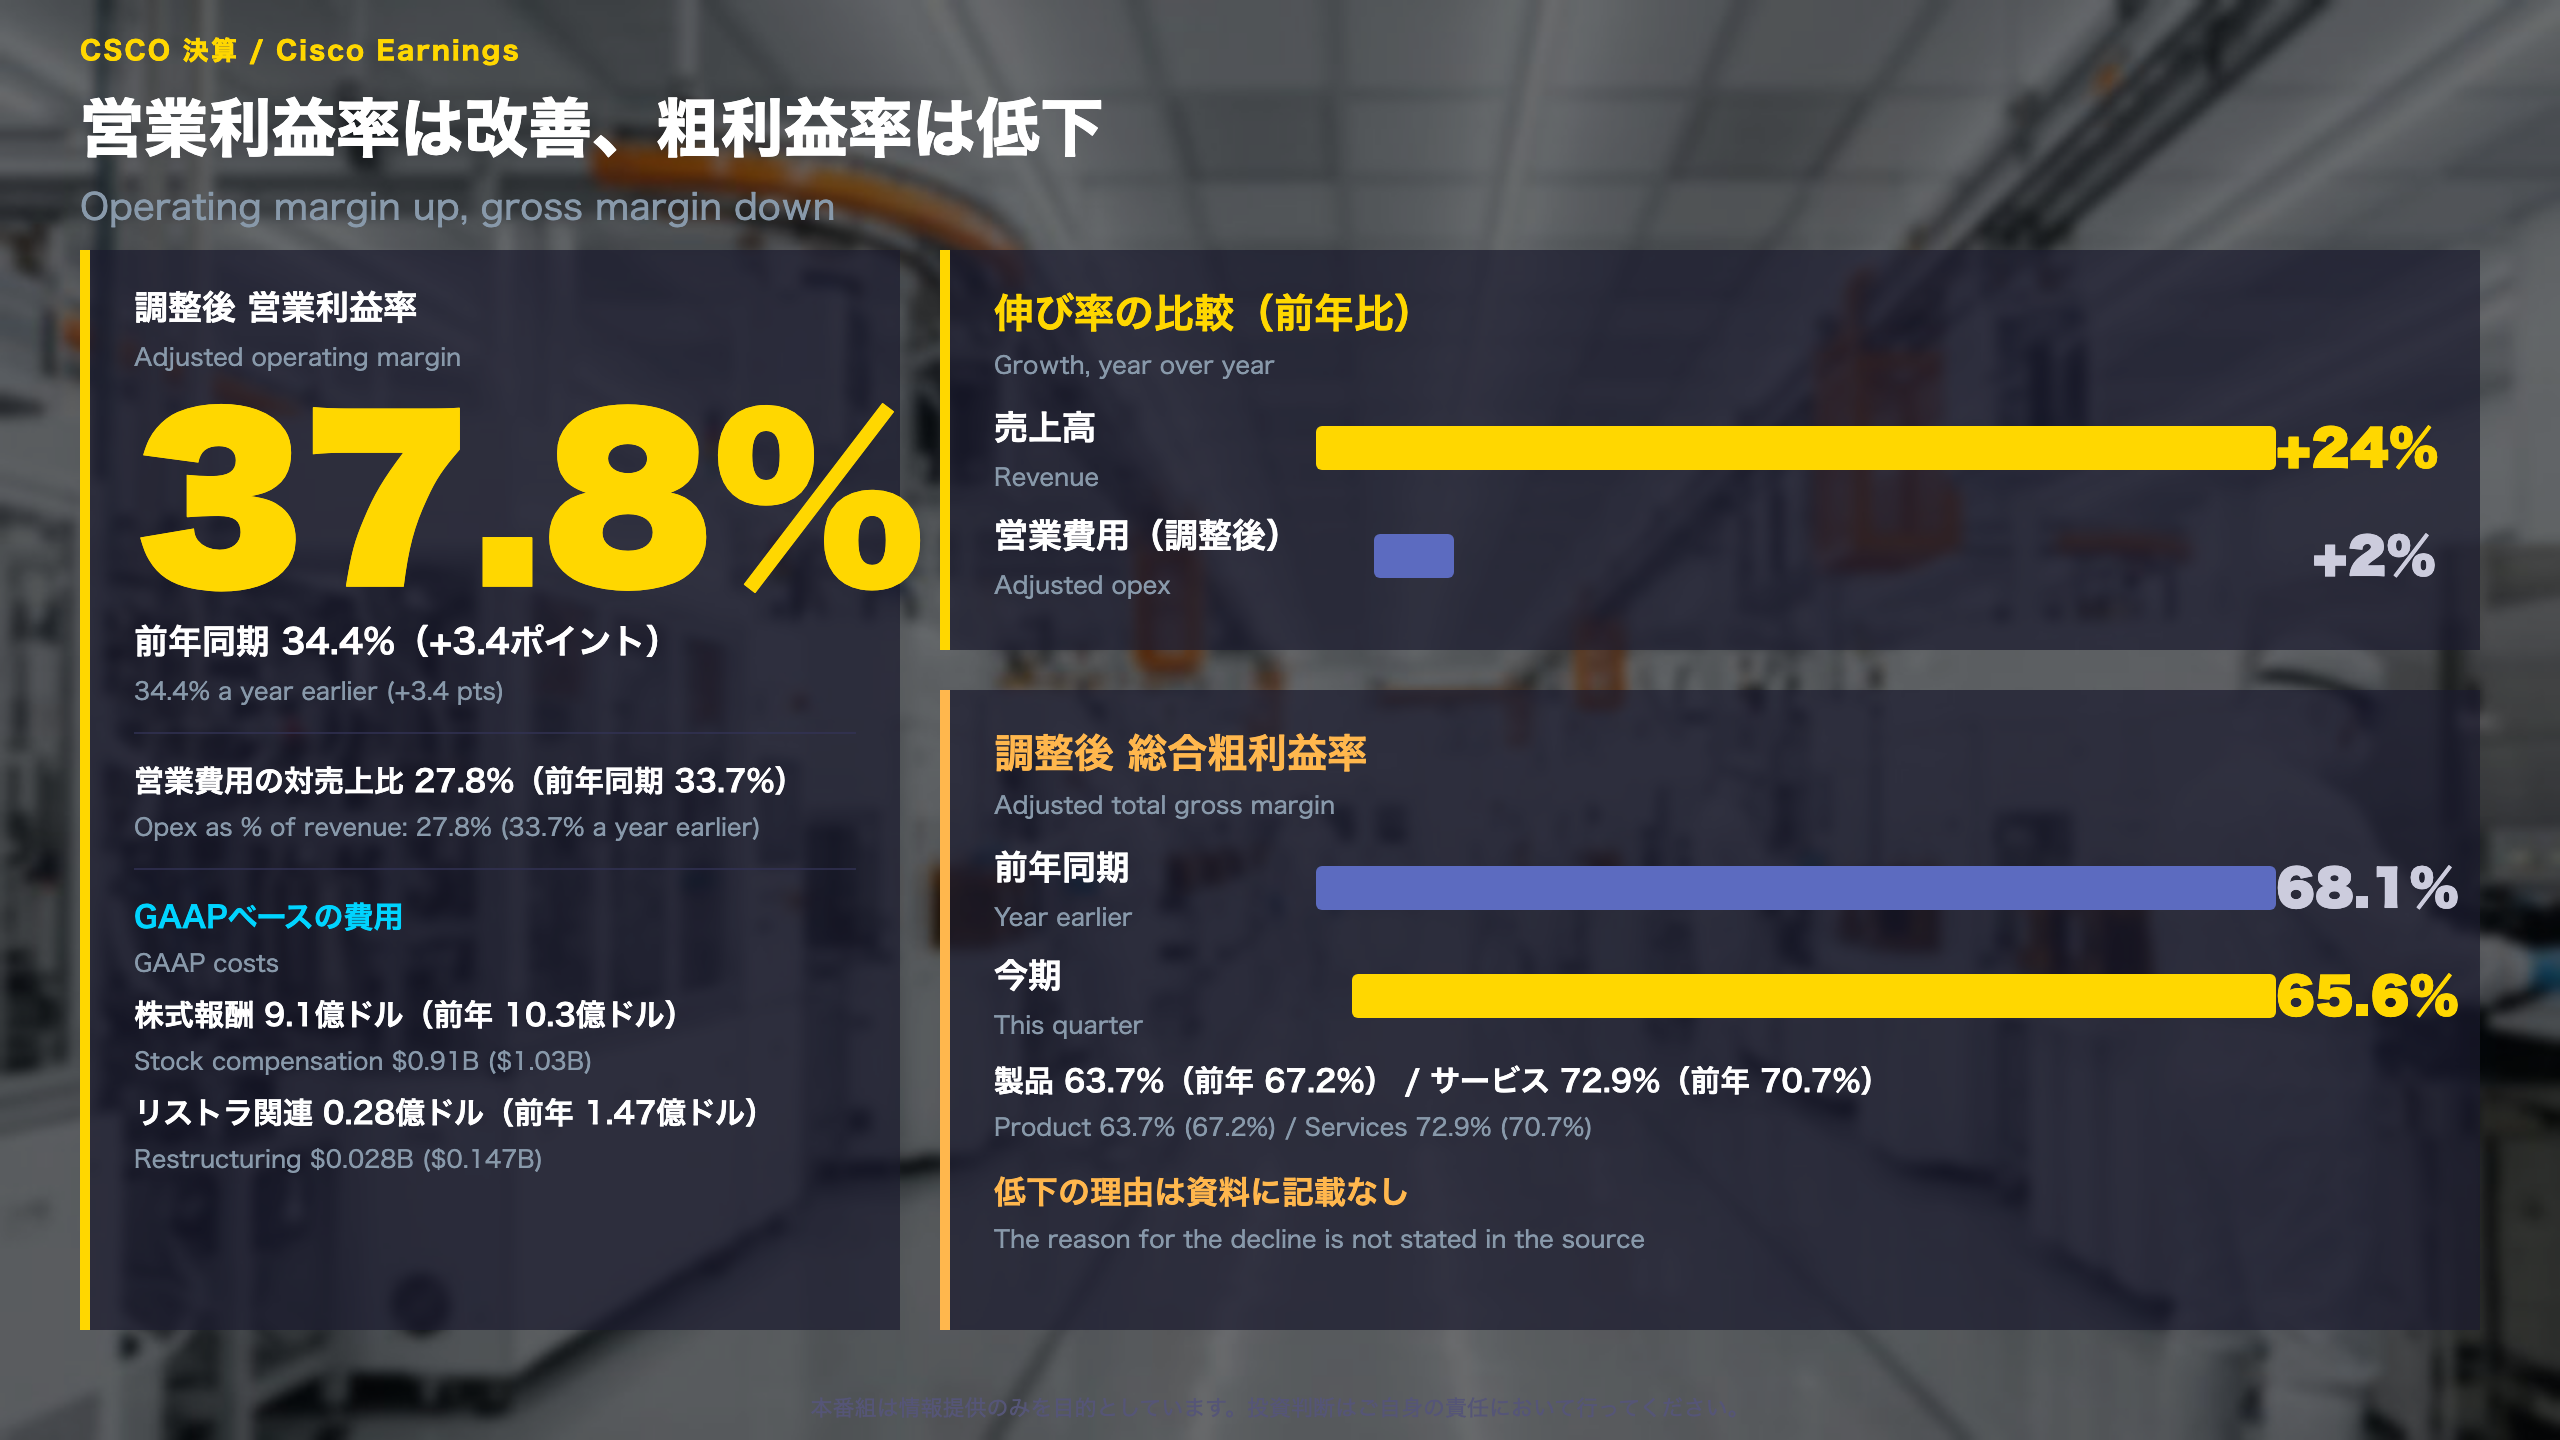
A quick primer: Cisco’s gross margin is the share of revenue left after the direct cost of products and services. The operating margin is what remains after operating expenses as well. The figures below are adjusted (non-GAAP) unless noted, meaning they exclude items such as restructuring charges.
| Adjusted metric | This quarter | Year earlier |
|---|---|---|
| Total gross margin | 65.6% | 68.1% |
| Product gross margin | 63.7% | 67.2% |
| Services gross margin | 72.9% | 70.7% |
| Opex as % of revenue | 27.8% | 33.7% |
| Operating margin | 37.8% | 34.4% |
The arithmetic
Operating margin rose 3.4 points even though gross margin fell 2.5 points, because operating expenses fell 5.9 points as a share of revenue. Adjusted opex was $5.14 billion, up only 2% against 24% revenue growth. This is what the CFO calls operating leverage: costs grow much more slowly than sales.
‘We are unlocking significant operating leverage.’ – CFO Patterson
GAAP cost lines
Stock-based compensation fell to $0.91 billion from $1.03 billion, and restructuring-related charges fell to $0.028 billion from $0.147 billion. The company expects the restructuring plan announced on May 13, 2026 to be substantially complete by the end of fiscal 2027.
Company guidance for the second quarter
Revenue of $18.0-18.2 billion, adjusted gross margin of 65-66%, adjusted operating margin of 36-37% and adjusted EPS of $1.34-1.36. These sit below this quarter’s levels, and the material gives no explanation such as seasonality. The full-year outlook was raised to revenue of $74.8-75.8 billion and adjusted EPS of $5.47-5.53.
Two readings
- Constructive: profit is growing faster than sales while costs are held down.
- Cautious: the gross margin drop is concentrated in products and unexplained in the source; a mix-shift explanation is interpretation, not reported fact.
先行指標とキャッシュの確認
Backlog and cash: what supports the outlook
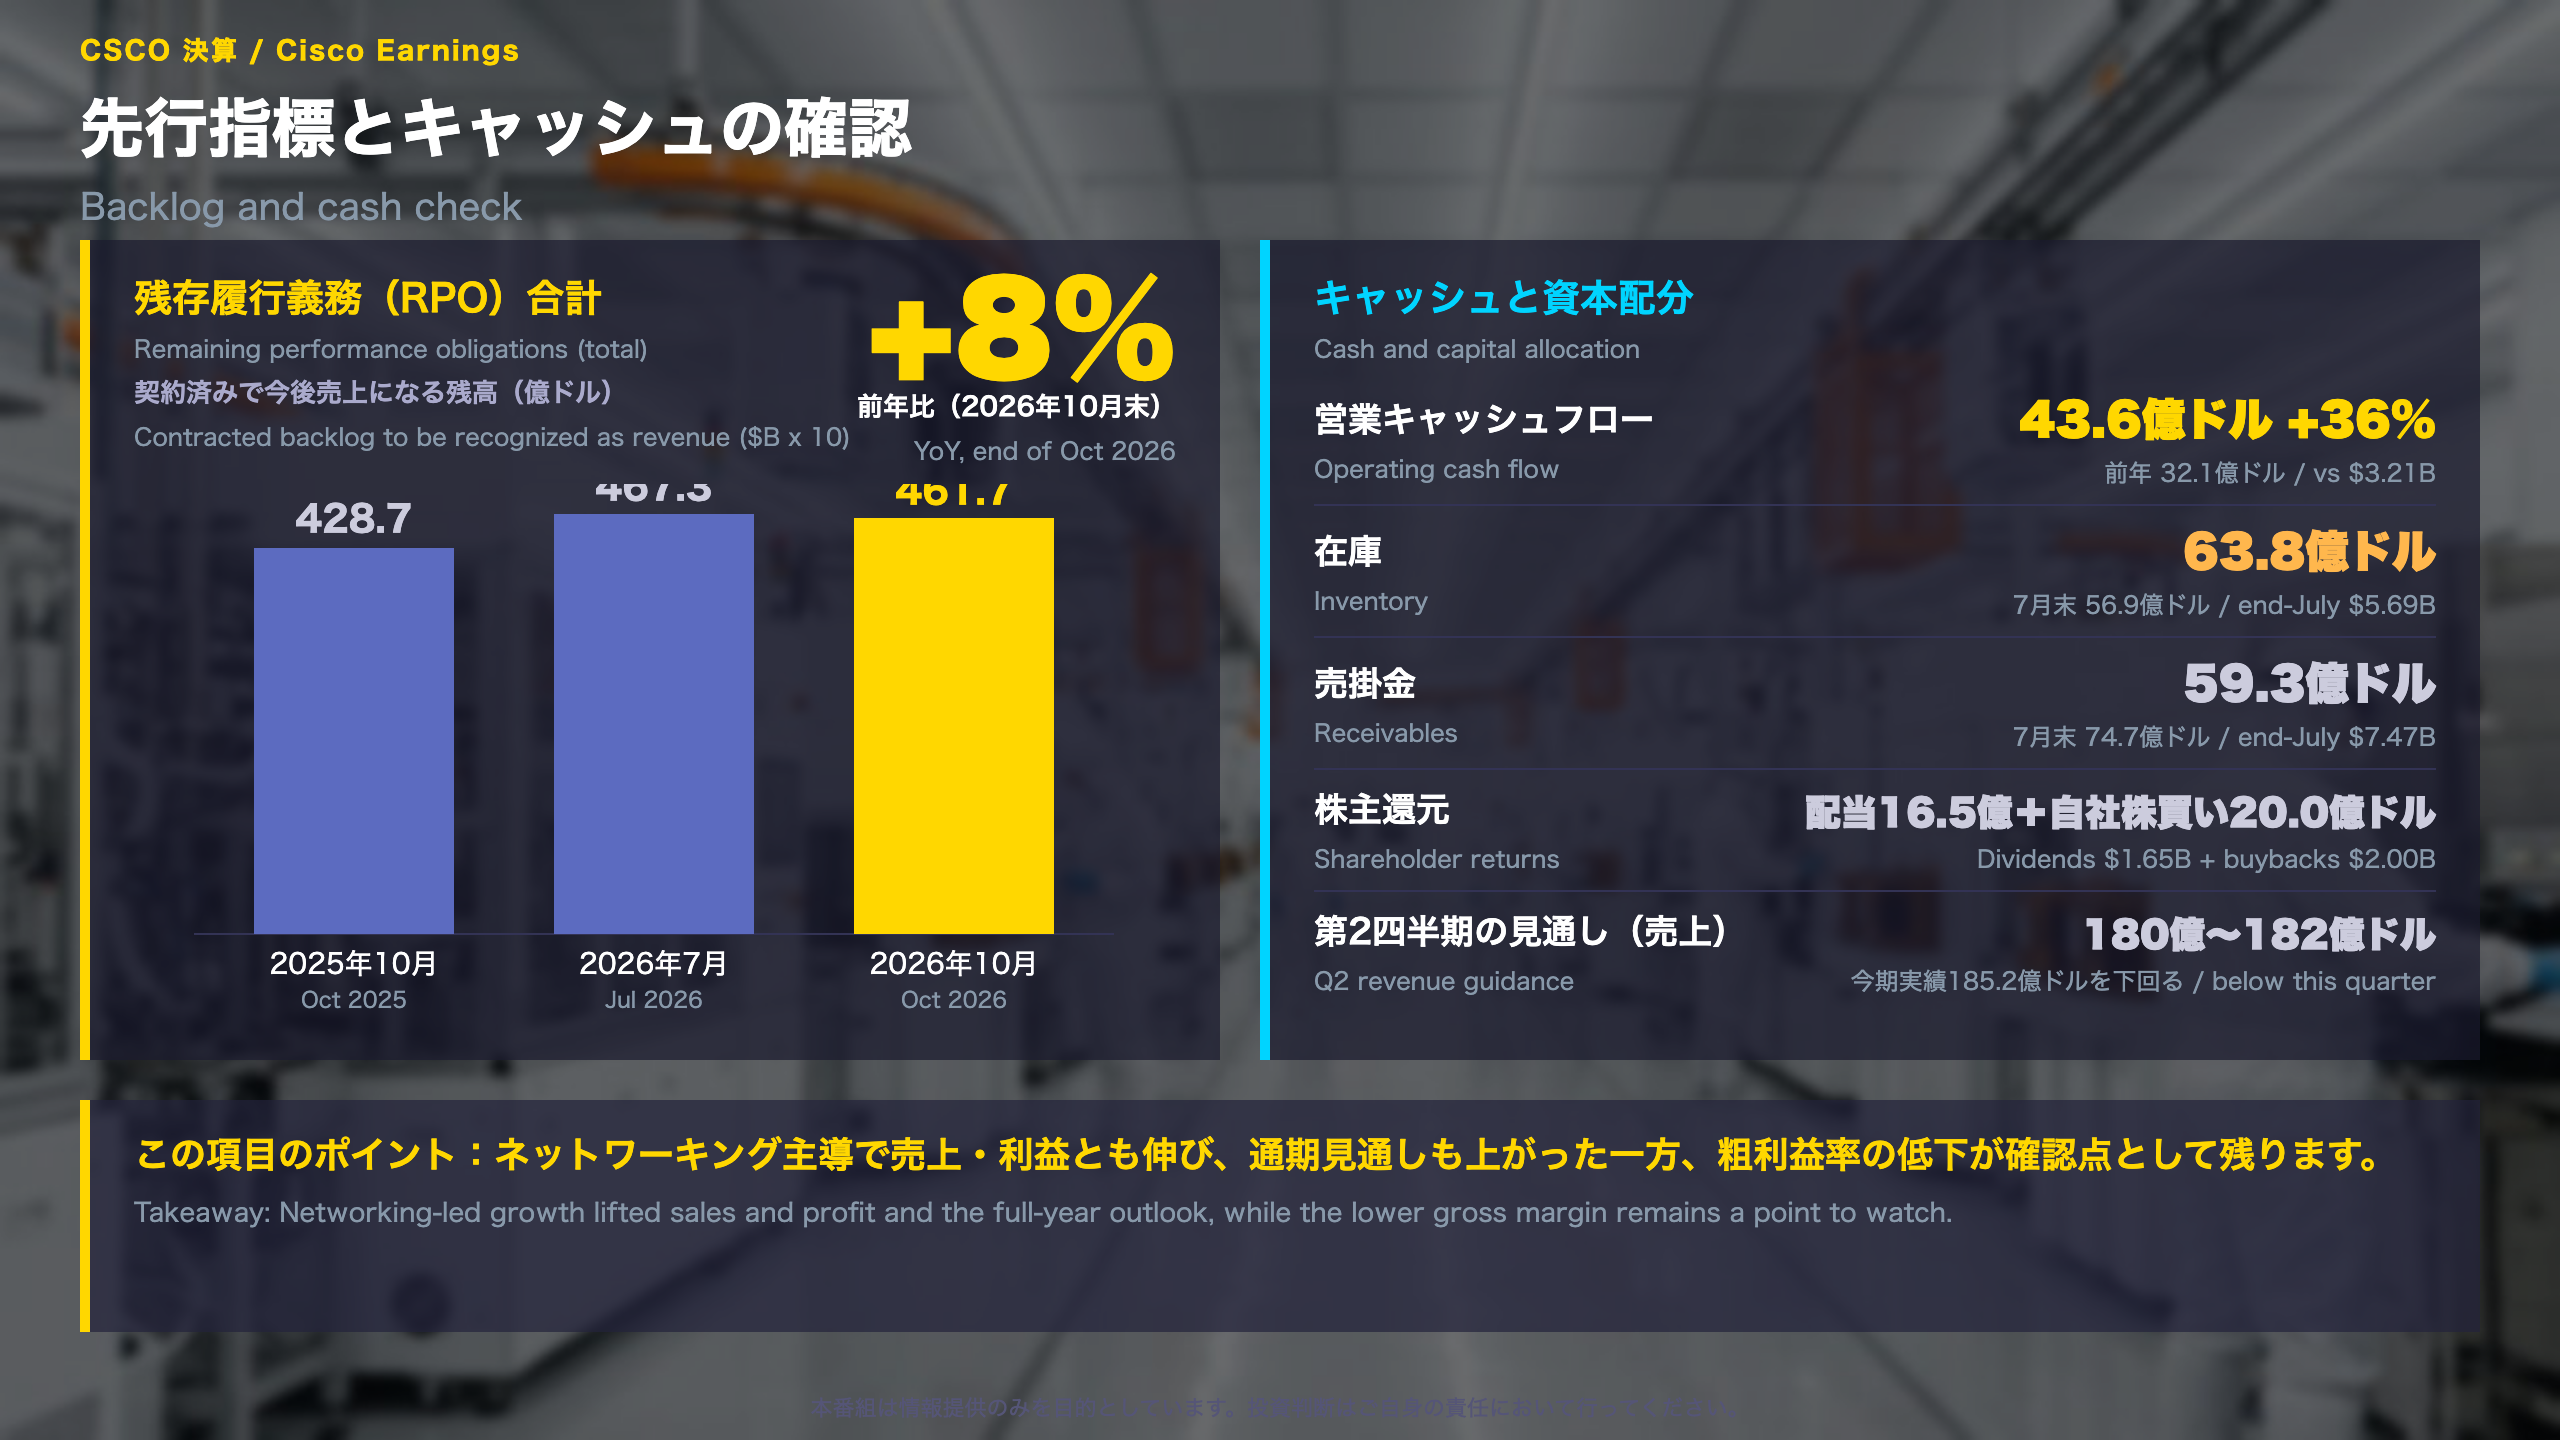
What RPO means: Remaining performance obligations (RPO) are the value of contracts already signed whose revenue has not yet been recognized. Investors use them as a gauge of revenue visibility, though a single quarter’s change can be noisy.
| RPO | Oct 2025 | Jul 2026 | Oct 2026 |
|---|---|---|---|
| Total ($B) | 42.87 | 46.73 | 46.17 |
| YoY | +7% | +7% | +8% |
| Product ($B) | 21.90 | 23.44 | 23.40 |
| Services ($B) | 20.97 | 23.30 | 22.77 |
Total RPO is up 8% year over year but about $0.57 billion below the end of July. Product RPO growth slowed from +9% to +7% over the quarter, while services RPO growth rose from +6% to +9%. Deferred revenue was $30.06 billion (+7%).
Cash and capital returns
- Operating cash flow $4.36 billion vs $3.21 billion a year earlier; capex $0.50 billion vs $0.32 billion
- Inventory $6.38 billion (end-July $5.69 billion); receivables $5.93 billion (end-July $7.47 billion)
- Dividends $1.65 billion plus buybacks $2.00 billion; about 18 million shares repurchased at an average $112.38, versus 29 million at $68.28 a year earlier, with $6.1 billion of authorization remaining
- Debt issued $5.19 billion, repaid $6.01 billion
‘We remain focused on delivering durable growth and driving continued capital returns.’ – CFO Patterson
Reading it with balance
The positives are cash flow growing faster than sales and a backlog still above last year’s level. The cautions are the small sequential dip in RPO and higher inventory; one quarter does not establish whether momentum will hold.
What to watch next
Second-quarter guidance of $18.0-18.2 billion in revenue, 65-66% adjusted gross margin and 36-37% adjusted operating margin will be checked against reported results. A $0.42 dividend is payable on January 20, 2027 to holders of record on January 4. The next earnings date is not given in the material.
CoreWeave 7-9月期:売上は約2.7倍に、純損失も拡大
What was reported
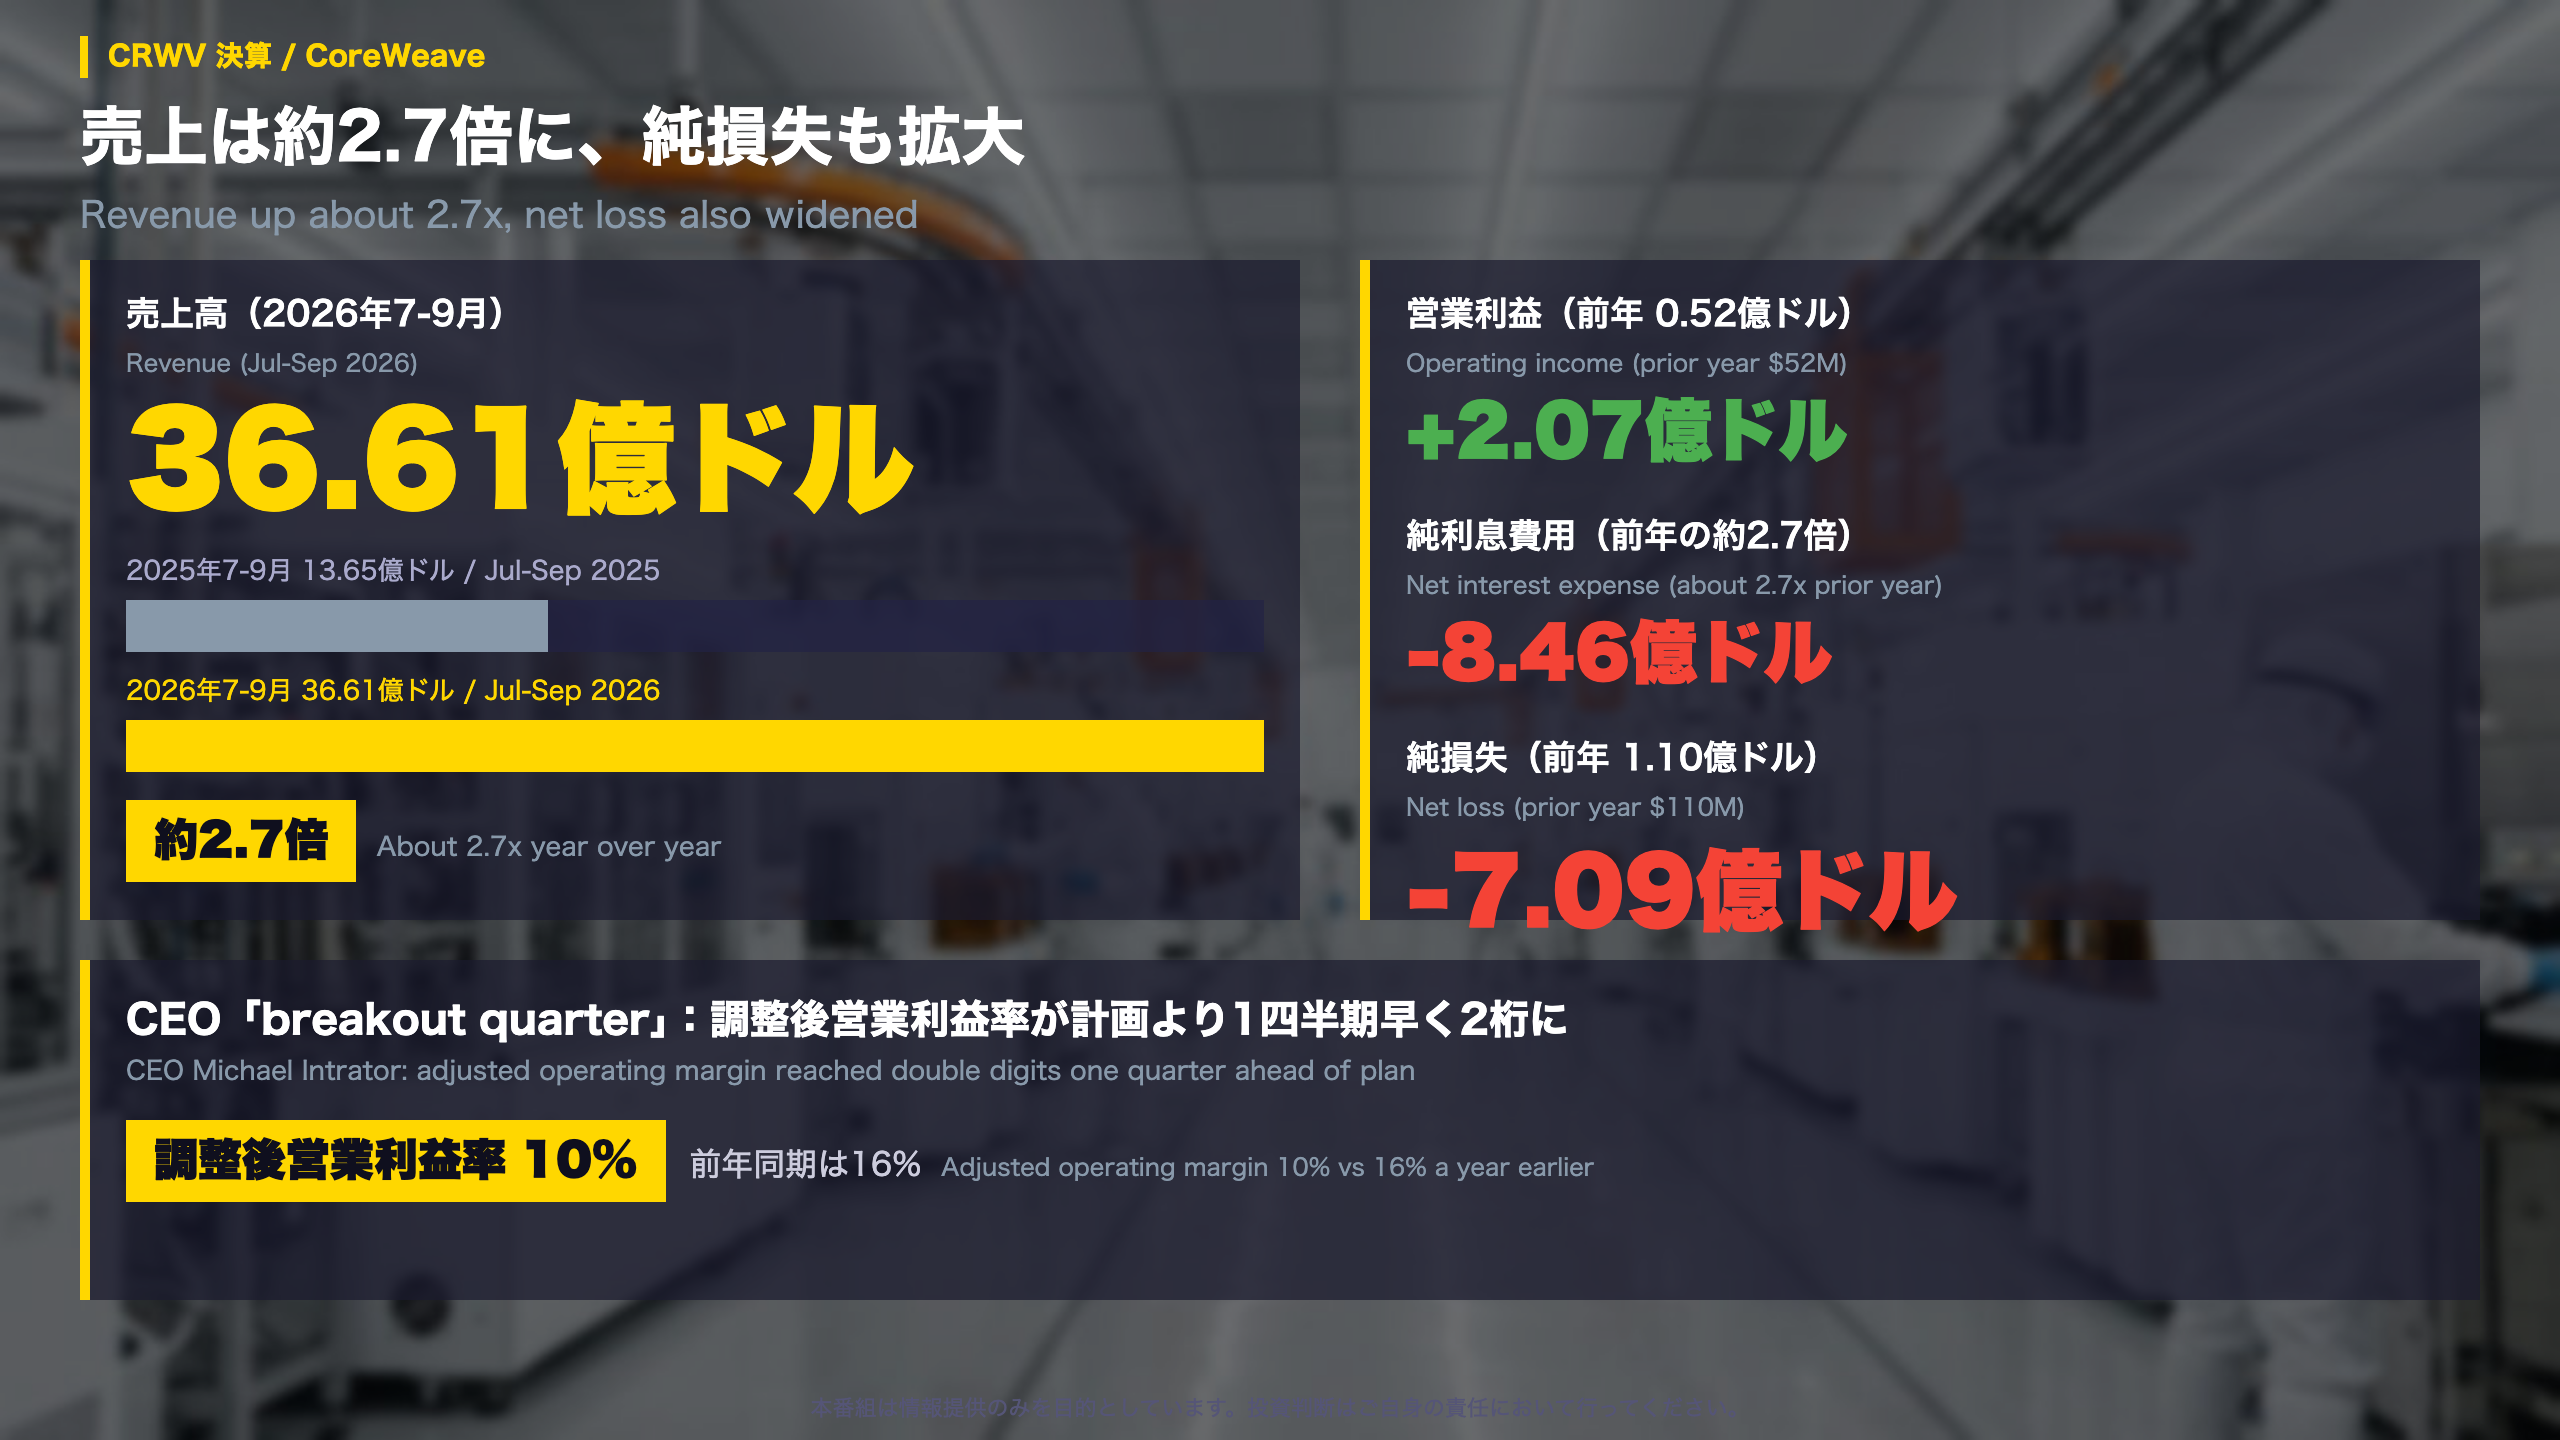
CoreWeave is a U.S. company that rents out GPU computing capacity for AI workloads. For the July-September 2026 quarter (a calendar quarter) it reported revenue of $3.661 billion, up from $1.365 billion a year earlier, or about 2.7 times.
| Item | Jul-Sep 2026 | Jul-Sep 2025 |
|---|---|---|
| Revenue | $3.661B | $1.365B |
| Operating income | $207M | $52M |
| Net loss | $709M | $110M |
| GAAP net loss per share | $1.27 | $0.22 |
| Adjusted EBITDA | $2.256B | $838M |
Why a profitable operation still posts a loss
Operating income more than quadrupled, yet the net loss widened. The gap is mostly financing cost: net interest expense was $846 million, about 2.7 times the year-earlier figure. Pre-tax loss was $626 million versus $237 million a year earlier.
Reading the margin claim
CEO Michael Intrator called the quarter a ‘breakout quarter’ and said adjusted operating margin reached double digits one quarter ahead of plan. The adjusted margin was 10%, still below the 16% of a year earlier. Adjusted figures exclude certain items, so they are best read next to the GAAP lines above.
Trend context
Quarterly revenue was roughly $190M in Q1 2024, $1.36B in Q3 2025 and $2.58B in Q2 2026. Net loss ran $740M in Q1 2026 and $626M in Q2 2026 before this quarter’s $709M.
Two readings
- Constructive: sales scale, positive operating income and positive operating cash flow
- Cautious: interest costs are growing about as fast as revenue, keeping the bottom line negative
What to watch
Progress against the full-year outlook and fourth-quarter interest expense. The source material does not give the next earnings date.
売上の中身:稼働電力の拡大と受注残
How capacity turns into revenue
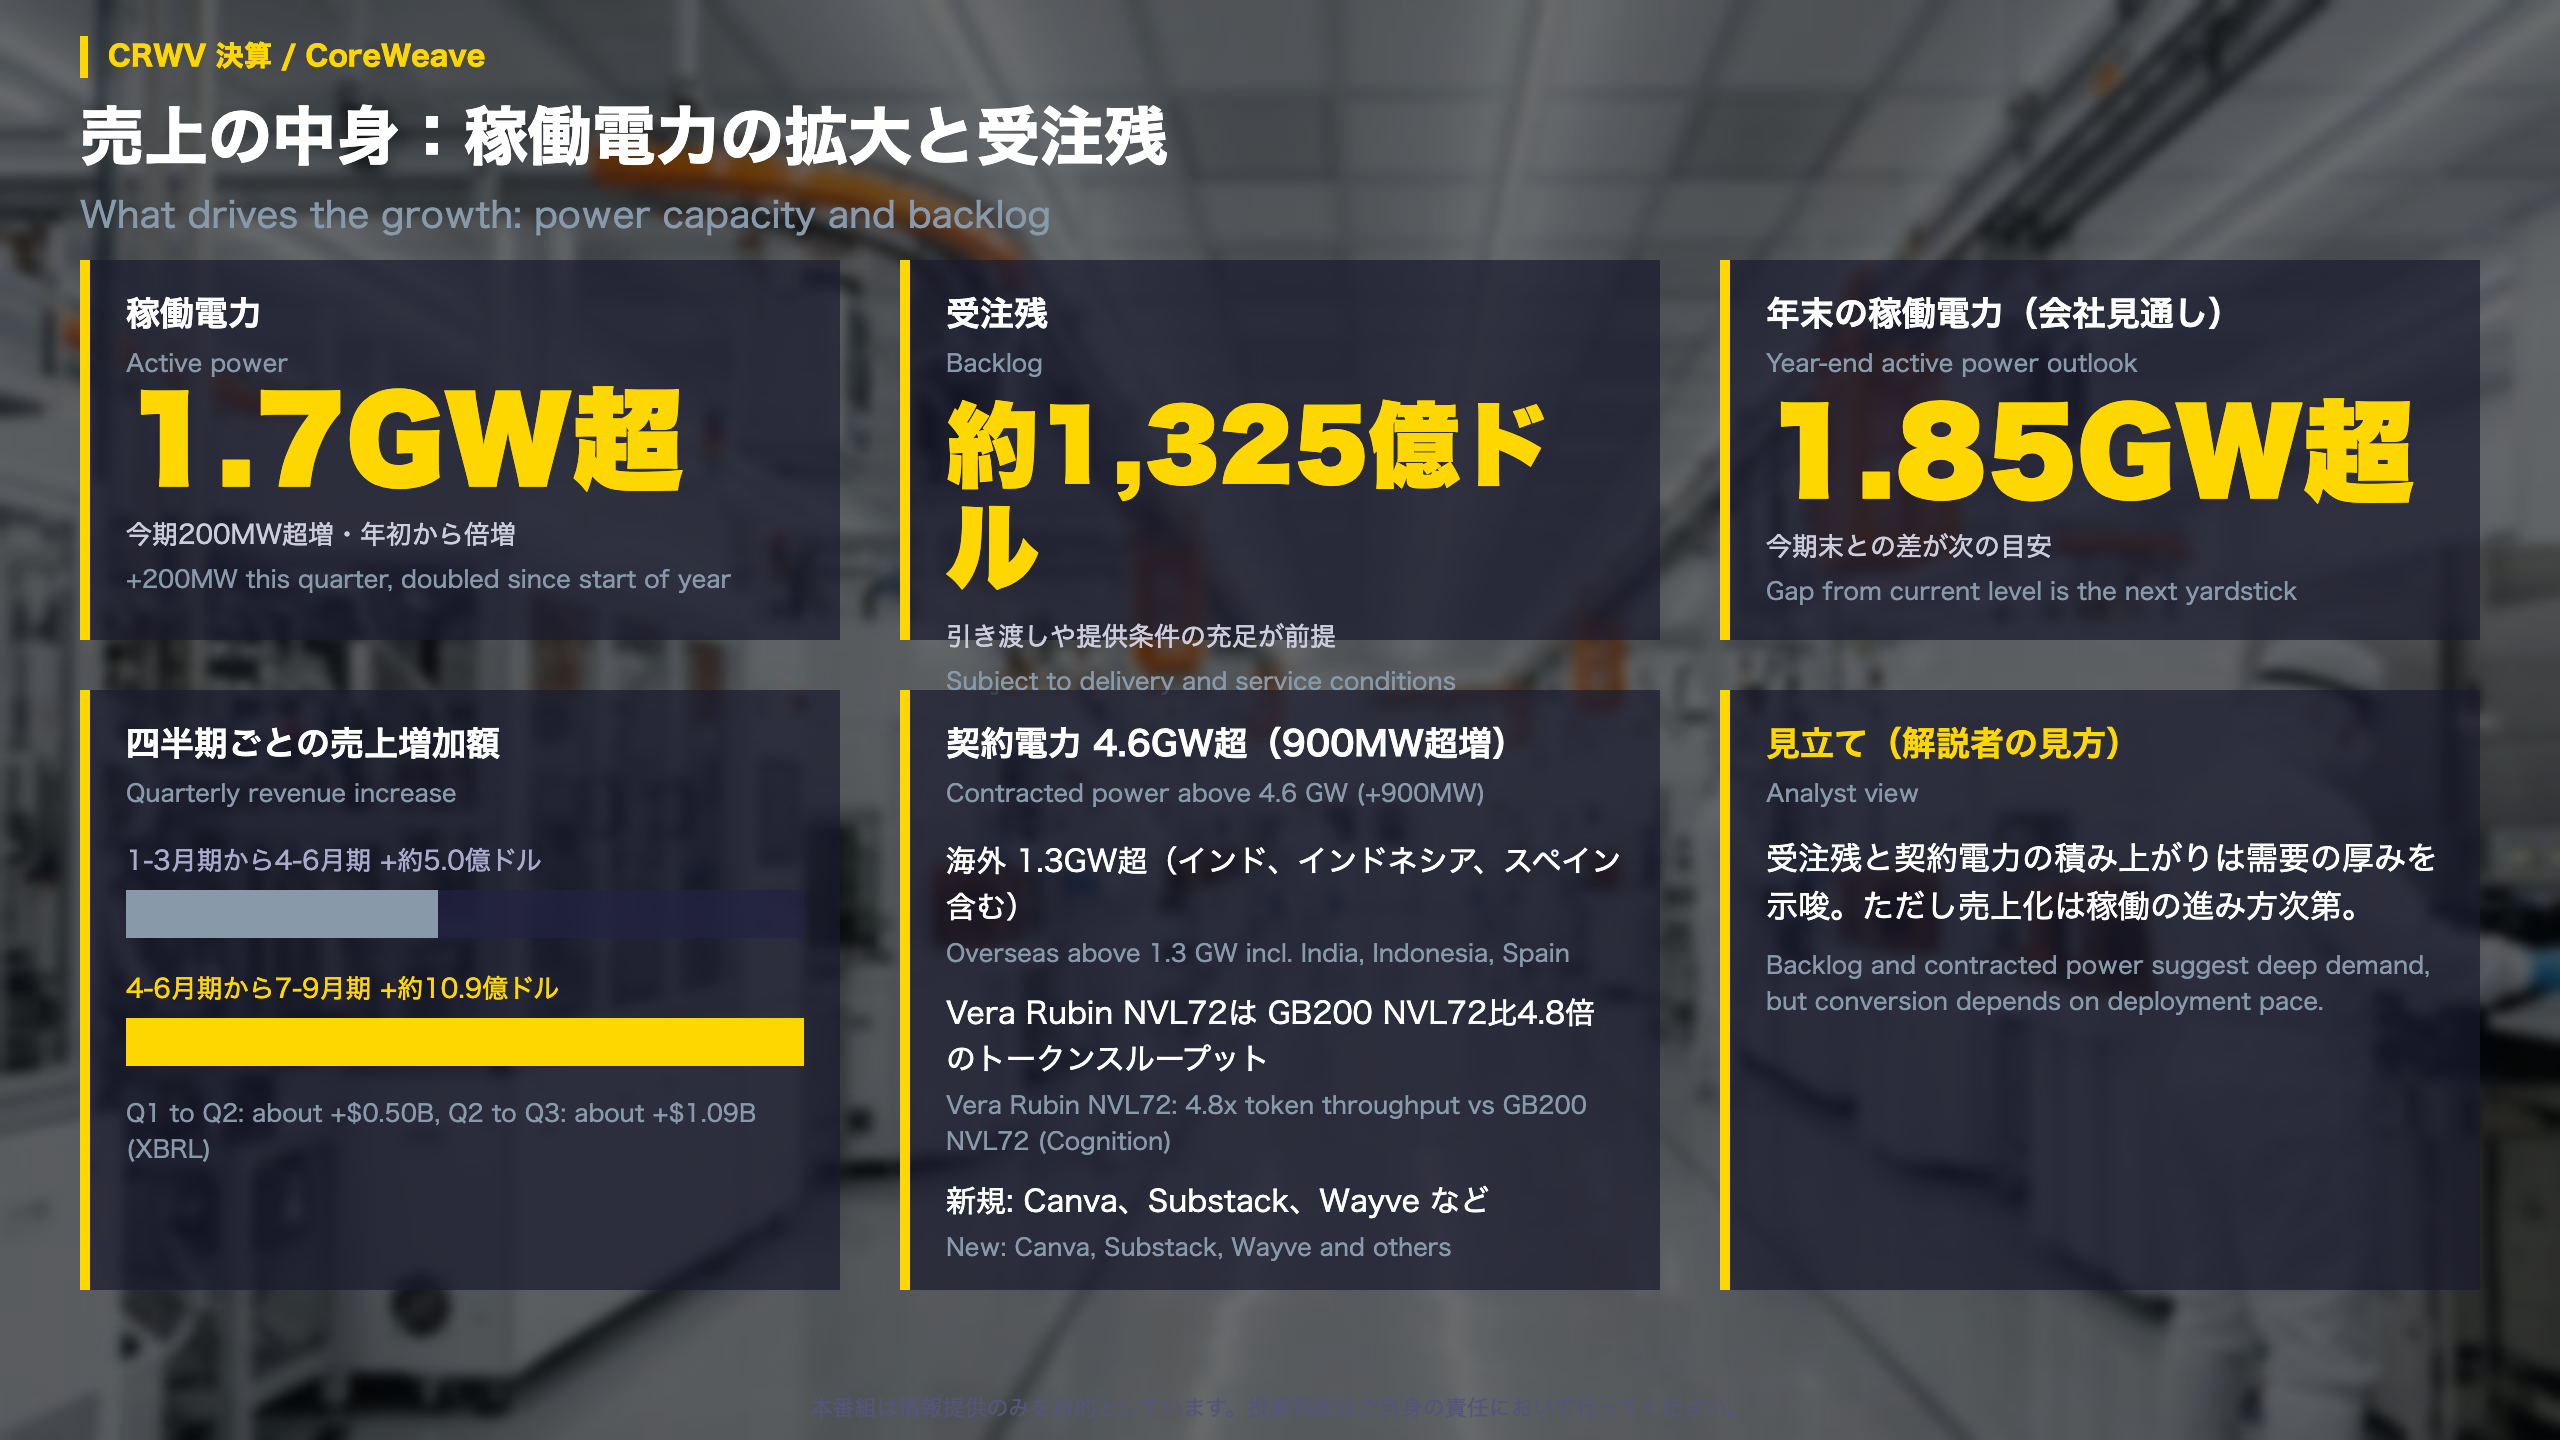
CoreWeave sells access to GPU-based computing. In this business, ‘active power’ is the electrical capacity of data centers that are live and serving customers, and ‘contracted power’ is capacity customers have committed to but that may not yet be running. Comparing the two shows how much growth is still waiting to be delivered.
The numbers
- Active power rose by more than 200 MW this quarter to above 1.7 GW, which the company describes as a doubling since the start of the year
- Contracted power rose by more than 900 MW to above 4.6 GW, including above 1.3 GW overseas (India, Indonesia and Spain among them)
- Revenue added about $0.50B quarter over quarter in Apr-Jun and about $1.09B in Jul-Sep
Technology and customers
The company cited early production workloads on NVIDIA Vera Rubin NVL72 systems delivering 4.8 times the token throughput of GB200 NVL72, based on usage by Cognition. New customers included Canva, Substack and Wayve; expansions included OpenAI, Jane Street and Perplexity.
Backlog, with a caveat
Backlog is about $132.5 billion. The company notes it depends on equipment being delivered and service conditions being met, so conversion to revenue follows the pace of deployment rather than the signing date.
Two readings
- Constructive: backlog and contracted power point to a deep demand base
- Cautious: backlog is not yet revenue, and delivery timing is the variable
What to watch
The year-end active-power outlook of above 1.85 GW versus the current 1.7 GW-plus gives a concrete yardstick for next quarter’s deployment.
利益と資金:設備投資と借り入れの負担
Bridging operating profit to net loss
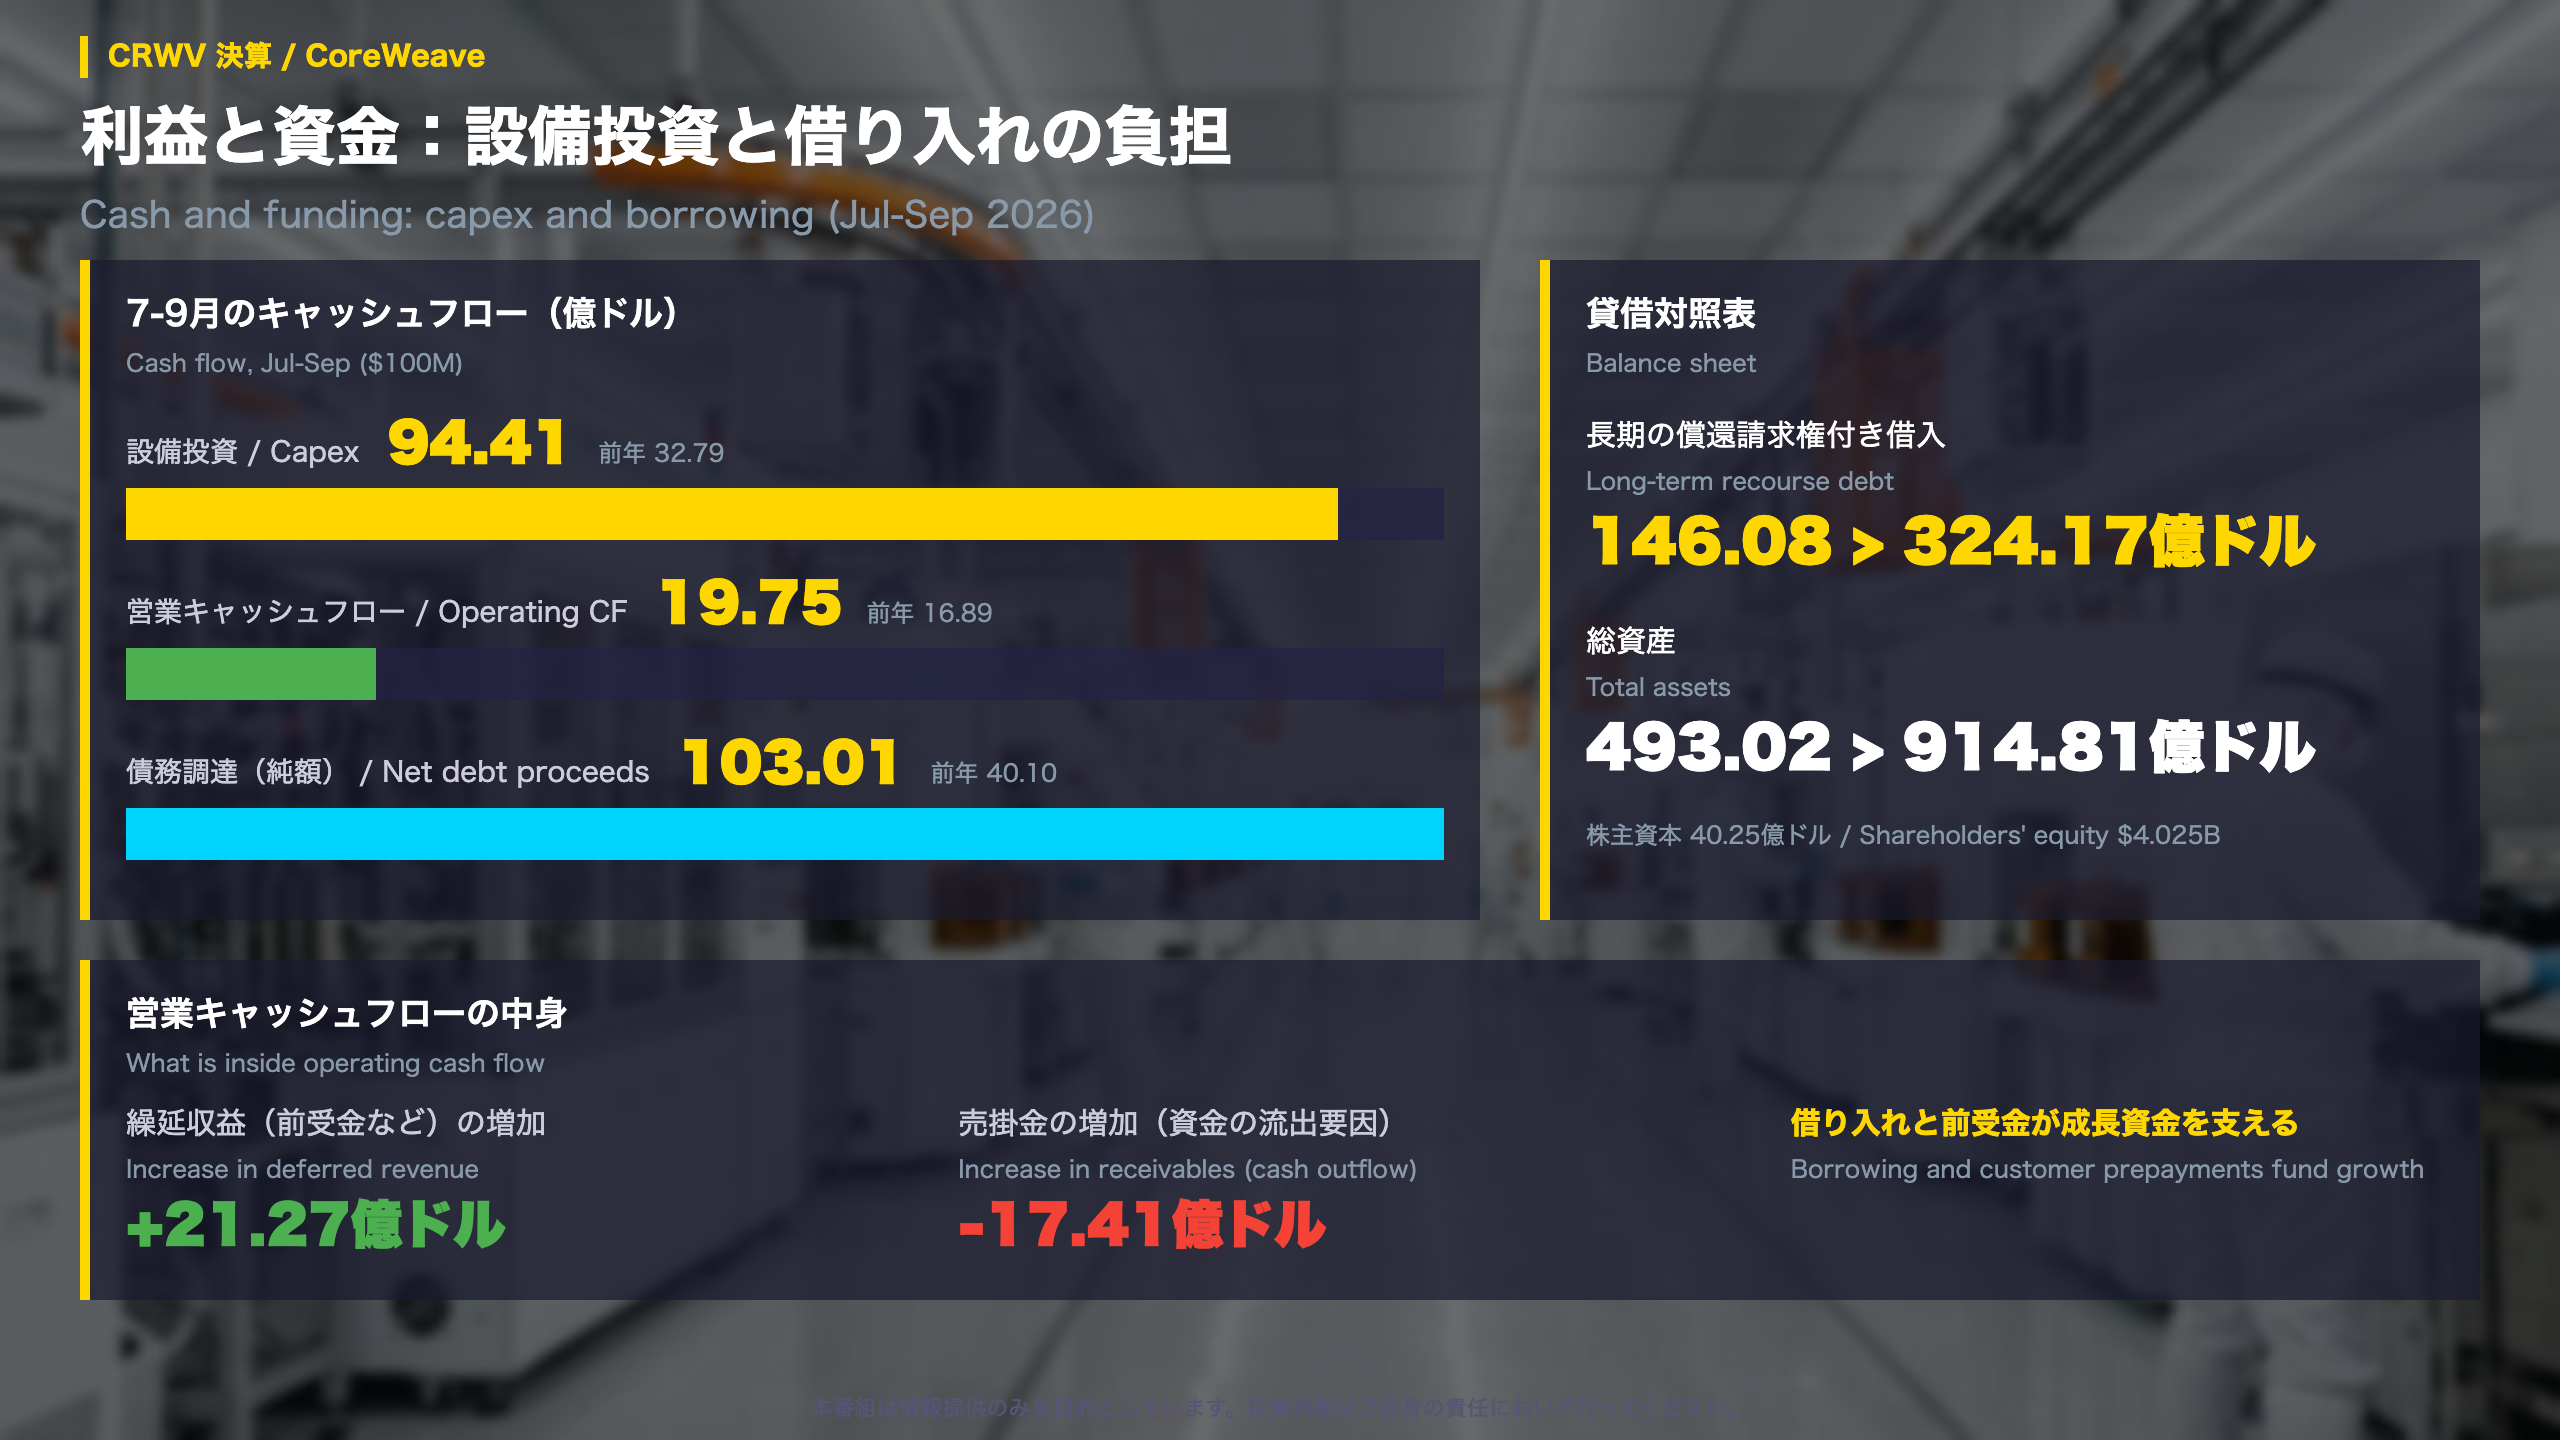
Operating income of $207 million turned into a $709 million net loss after net interest expense of $846 million, other income of $13 million and tax expense of $83 million. Pre-tax loss was $626 million versus $237 million a year earlier. Last year’s quarter also included a $127 million tax benefit, which explains about $210 million of the swing.
Cash flow, Jul-Sep
| Item | 2026 | 2025 |
|---|---|---|
| Operating cash flow | $1.975B | $1.689B |
| Capital expenditure | $9.441B | $3.279B |
| Net debt proceeds | $10.301B | $4.010B |
| Debt repayment | $2.344B | $1.404B |
Operating cash flow was helped by a $2.127 billion rise in deferred revenue, which is cash collected from customers ahead of service delivery, and reduced by a $1.741 billion increase in receivables.
Balance sheet
Long-term recourse debt rose from $14.608B to $32.417B and total assets from $49.302B to $91.481B. Shareholders’ equity stands at $4.025B.
Why the distinction between adjusted and GAAP matters
Adjusted EBITDA excludes interest, tax and depreciation-type costs. The adjusted EBITDA margin was 62% (61% a year earlier), showing the underlying operation held its profitability, but interest sits below that line. Over nine months, net loss ($2.075B) and interest ($2.022B) are almost the same size.
What to watch
The company guides fourth-quarter interest expense of $1.05B-$1.15B.
通期見通しと設備投資、利息の負担
The full-year guidance
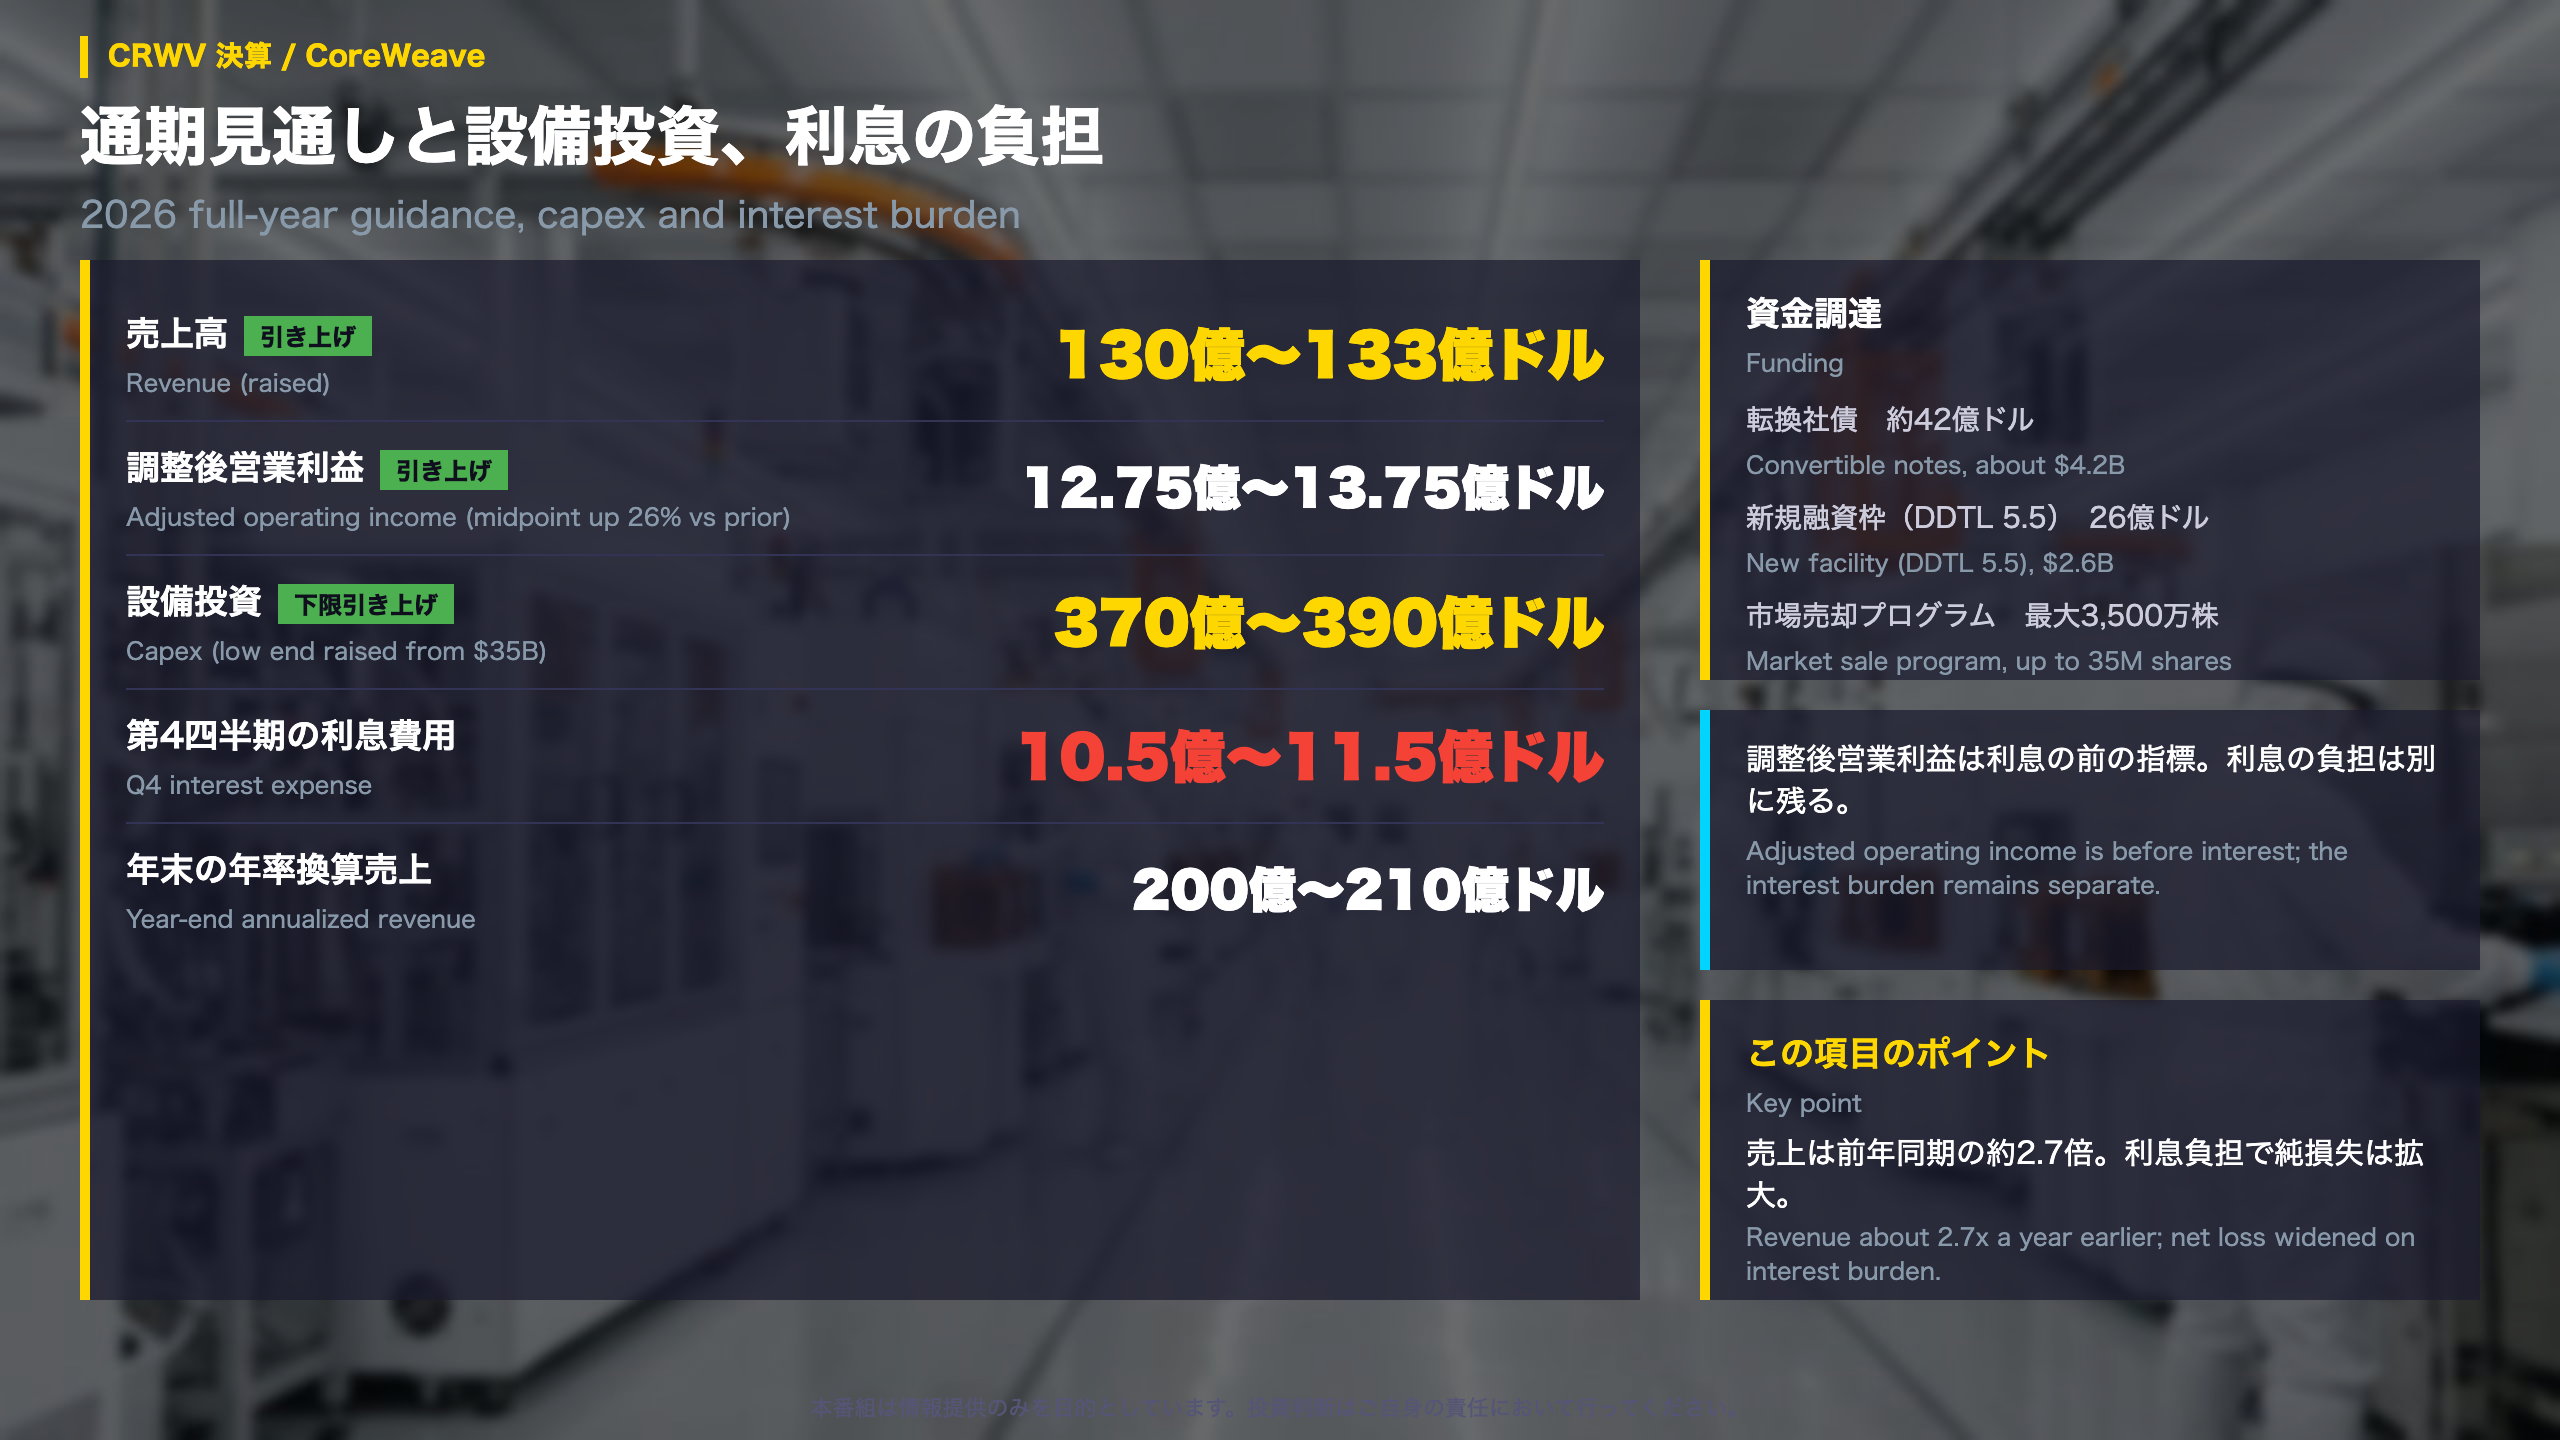
| Item | Guidance |
|---|---|
| Revenue | $13.0B-$13.3B (raised) |
| Adjusted operating income | $1.275B-$1.375B (midpoint up 26% from prior guidance) |
| Capital expenditure | $37B-$39B (low end raised from $35B) |
| Q4 interest expense | $1.05B-$1.15B |
| Year-end annualized revenue | $20B-$21B |
| Year-end active power | above 1.85 GW |
The company says the higher capex floor is to deliver capacity to customers earlier than expected.
Cost structure
Cost of revenue rose from $369M to $1.183B and technology and infrastructure expense from $747M to $2.025B, while selling, general and administrative expense went from $197M to $246M. Nine-month adjusted operating margin is 6%, below 16% a year earlier.
How the spending is financed
The company raised about $4.2B through convertible notes, $2.6B through a new delayed draw term loan facility (DDTL 5.5), and set up a program allowing sales of up to 35 million shares in the market.
Two readings
- Constructive: funding anchored on customer prepayments and contracts diversifies the sources of growth capital
- Cautious: adjusted operating income is measured before interest, so the interest burden stays outside that metric
What to watch
A simple subtraction (ours, not the company’s): nine-month revenue of $8.314B against the guidance range leaves about $4.69B-$4.99B for the fourth quarter. The 10-Q is expected to be filed around the release date.
GAAPと調整後 ― 収益の見え方の差
Reading Nebius’s ‘profit’ in the third quarter
Two sets of numbers
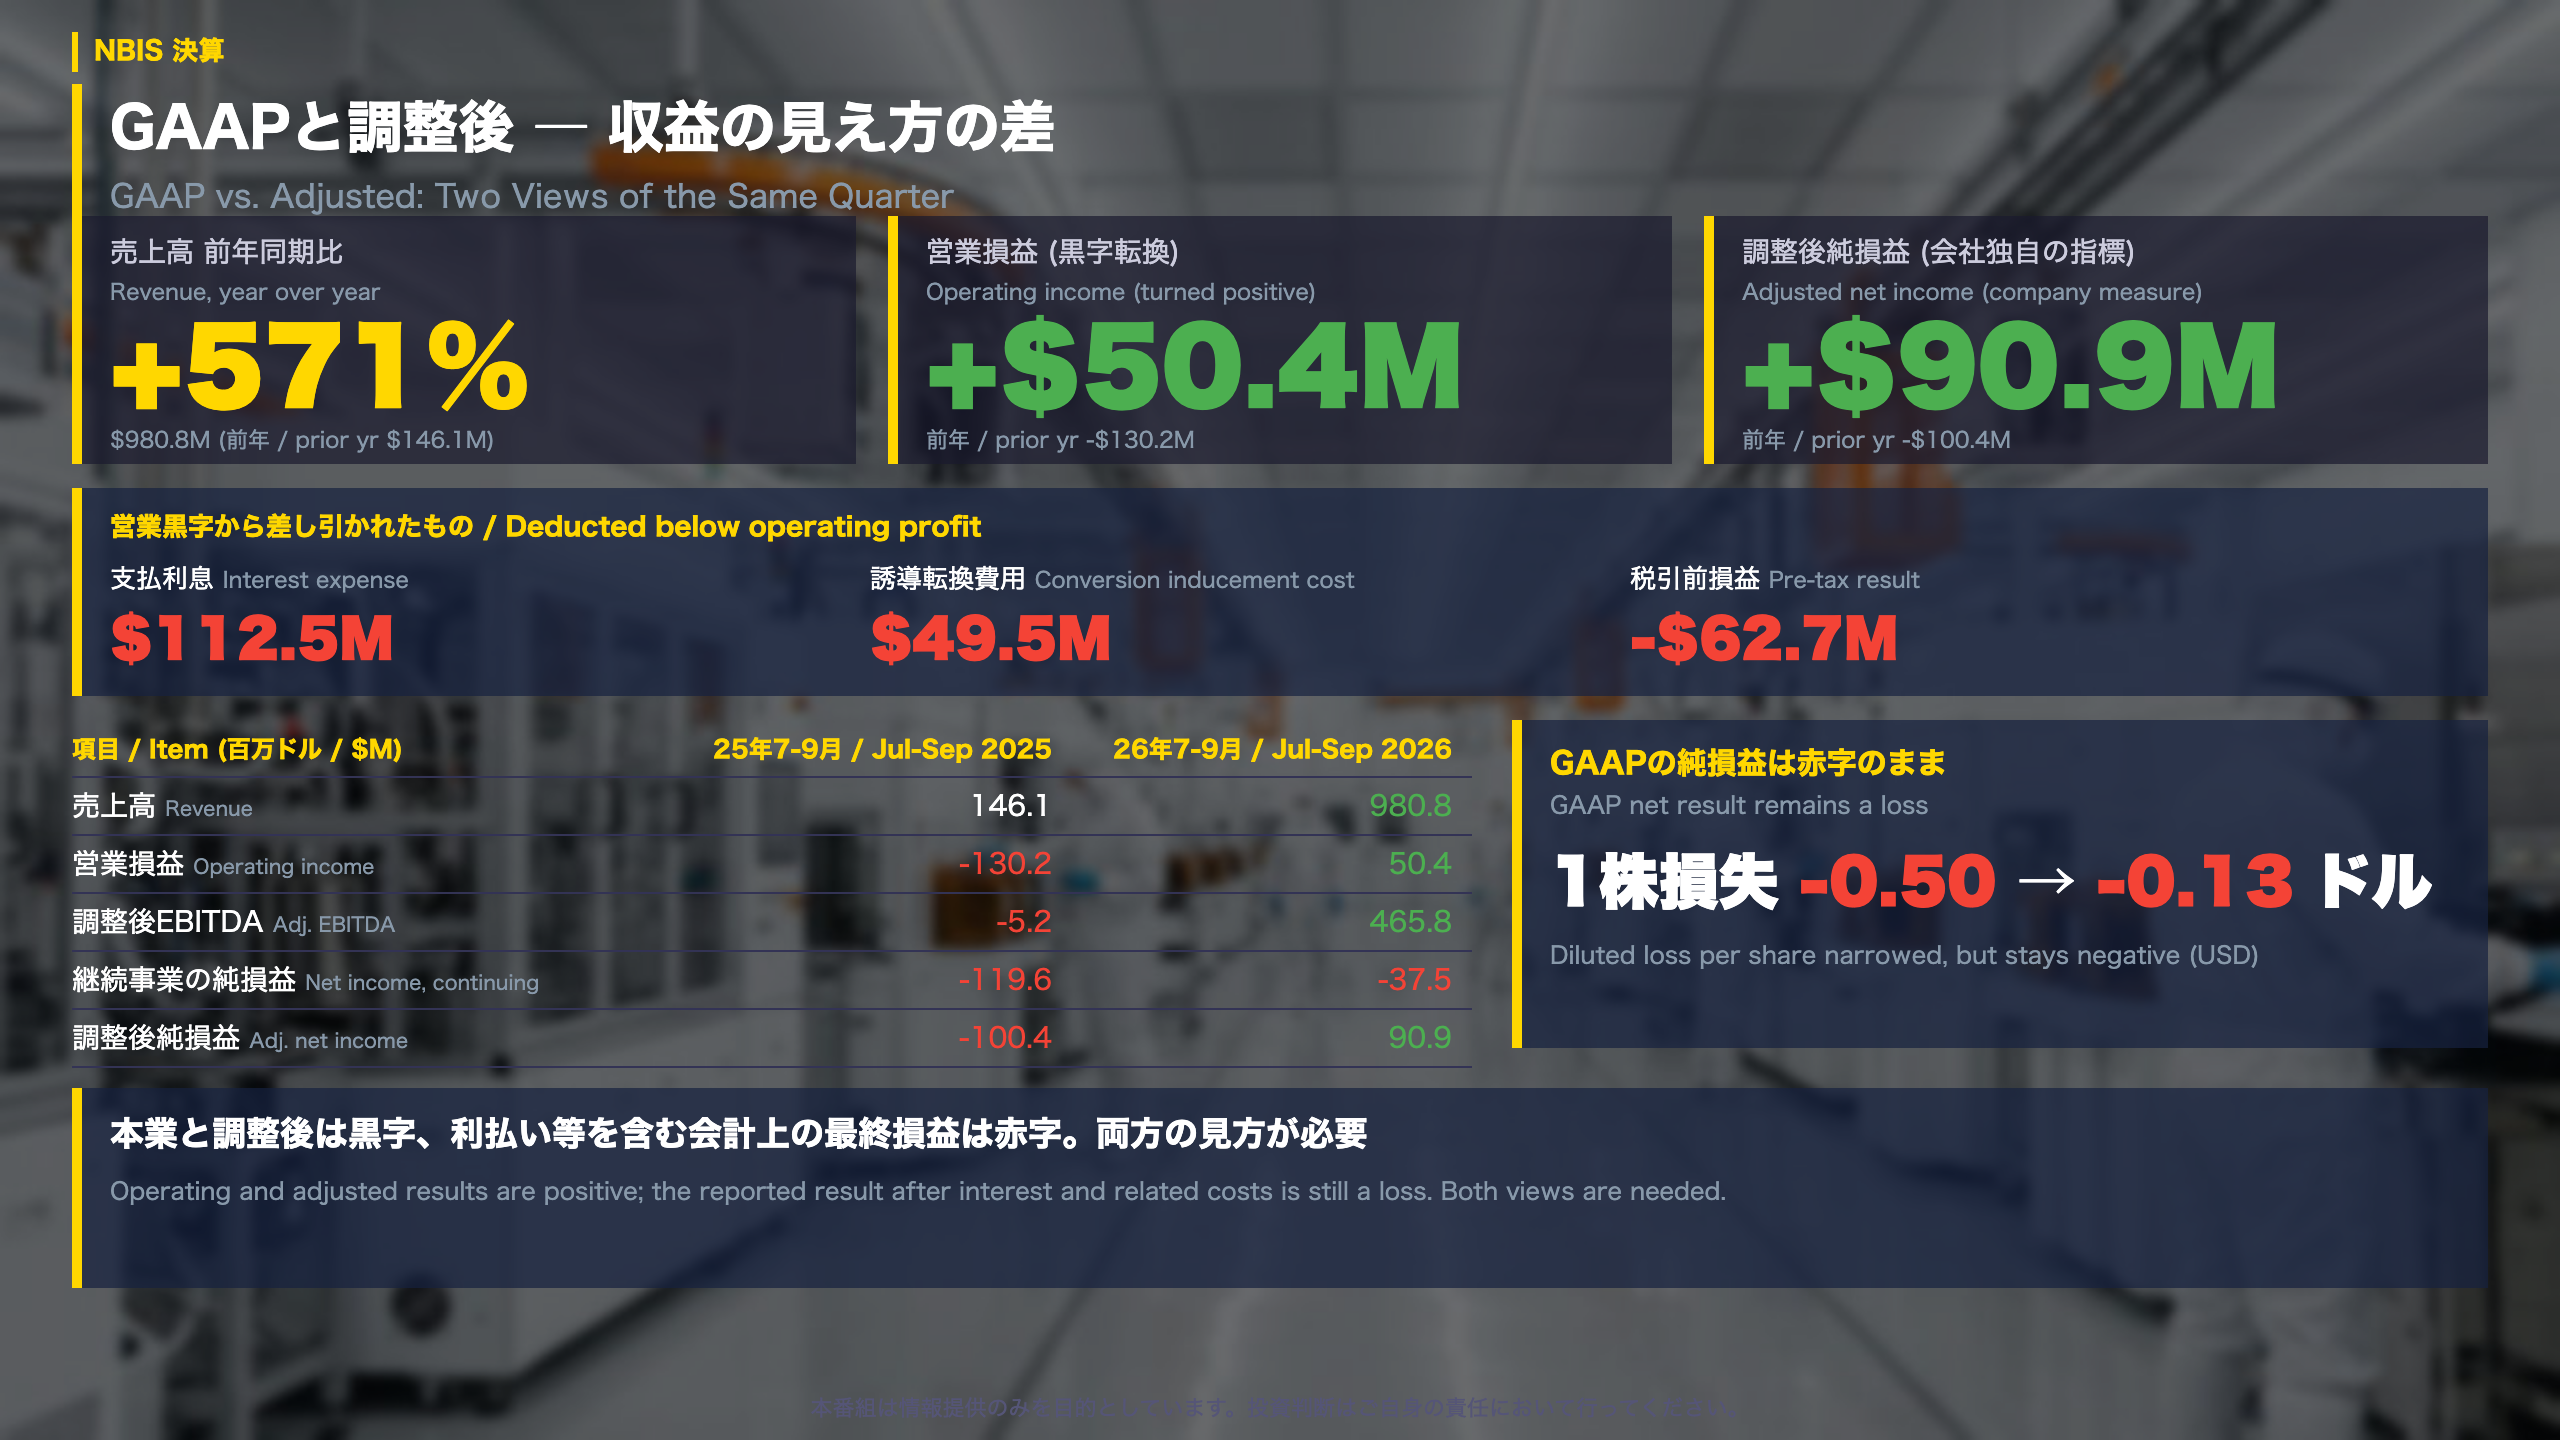
Nebius Group N.V. reports under US GAAP and also publishes adjusted measures. GAAP follows accounting standards; adjusted figures strip out items the company regards as unusual, and different companies draw that line differently. For July-September 2026 the two views point in different directions: operating income was +$50.4M and adjusted net income +$90.9M, while GAAP income from continuing operations was -$37.5M and the pre-tax result was -$62.7M.
Why GAAP stays negative
Interest expense rose to $112.5M (from $14.7M a year earlier) and the company booked $49.5M of ‘inducement’ costs tied to convertible notes. Diluted GAAP loss per share narrowed from -$0.50 to -$0.13.
Nine-month context
- Nine-month revenue: $1,962.1M, up 549% year over year
- Nine-month net income of $393.3M includes $780.6M of gains on equity holdings; adjusted net loss is -$42.6M
- Group adjusted EBITDA (earnings before interest, tax, depreciation and amortization, as adjusted): $465.8M, up from $236.2M the previous quarter
Management’s words
‘Demand remains exceptionally strong, and we have the right mechanisms in place to capture it.’ (CEO Arkady Volozh, shareholder letter)
Balanced reading
- Constructive: operating and adjusted profit turned positive in the same quarter.
- Cautious: financing costs are heavy, and full-year 2026 revenue is guided to the low end of the earlier range.
What to watch
The next report date is not stated in the source. From 2027 the company plans to guide on revenue and pre-tax profit, so the pre-tax line becomes the key yardstick.
収益の質 ― 費用比率の改善と2つの前提
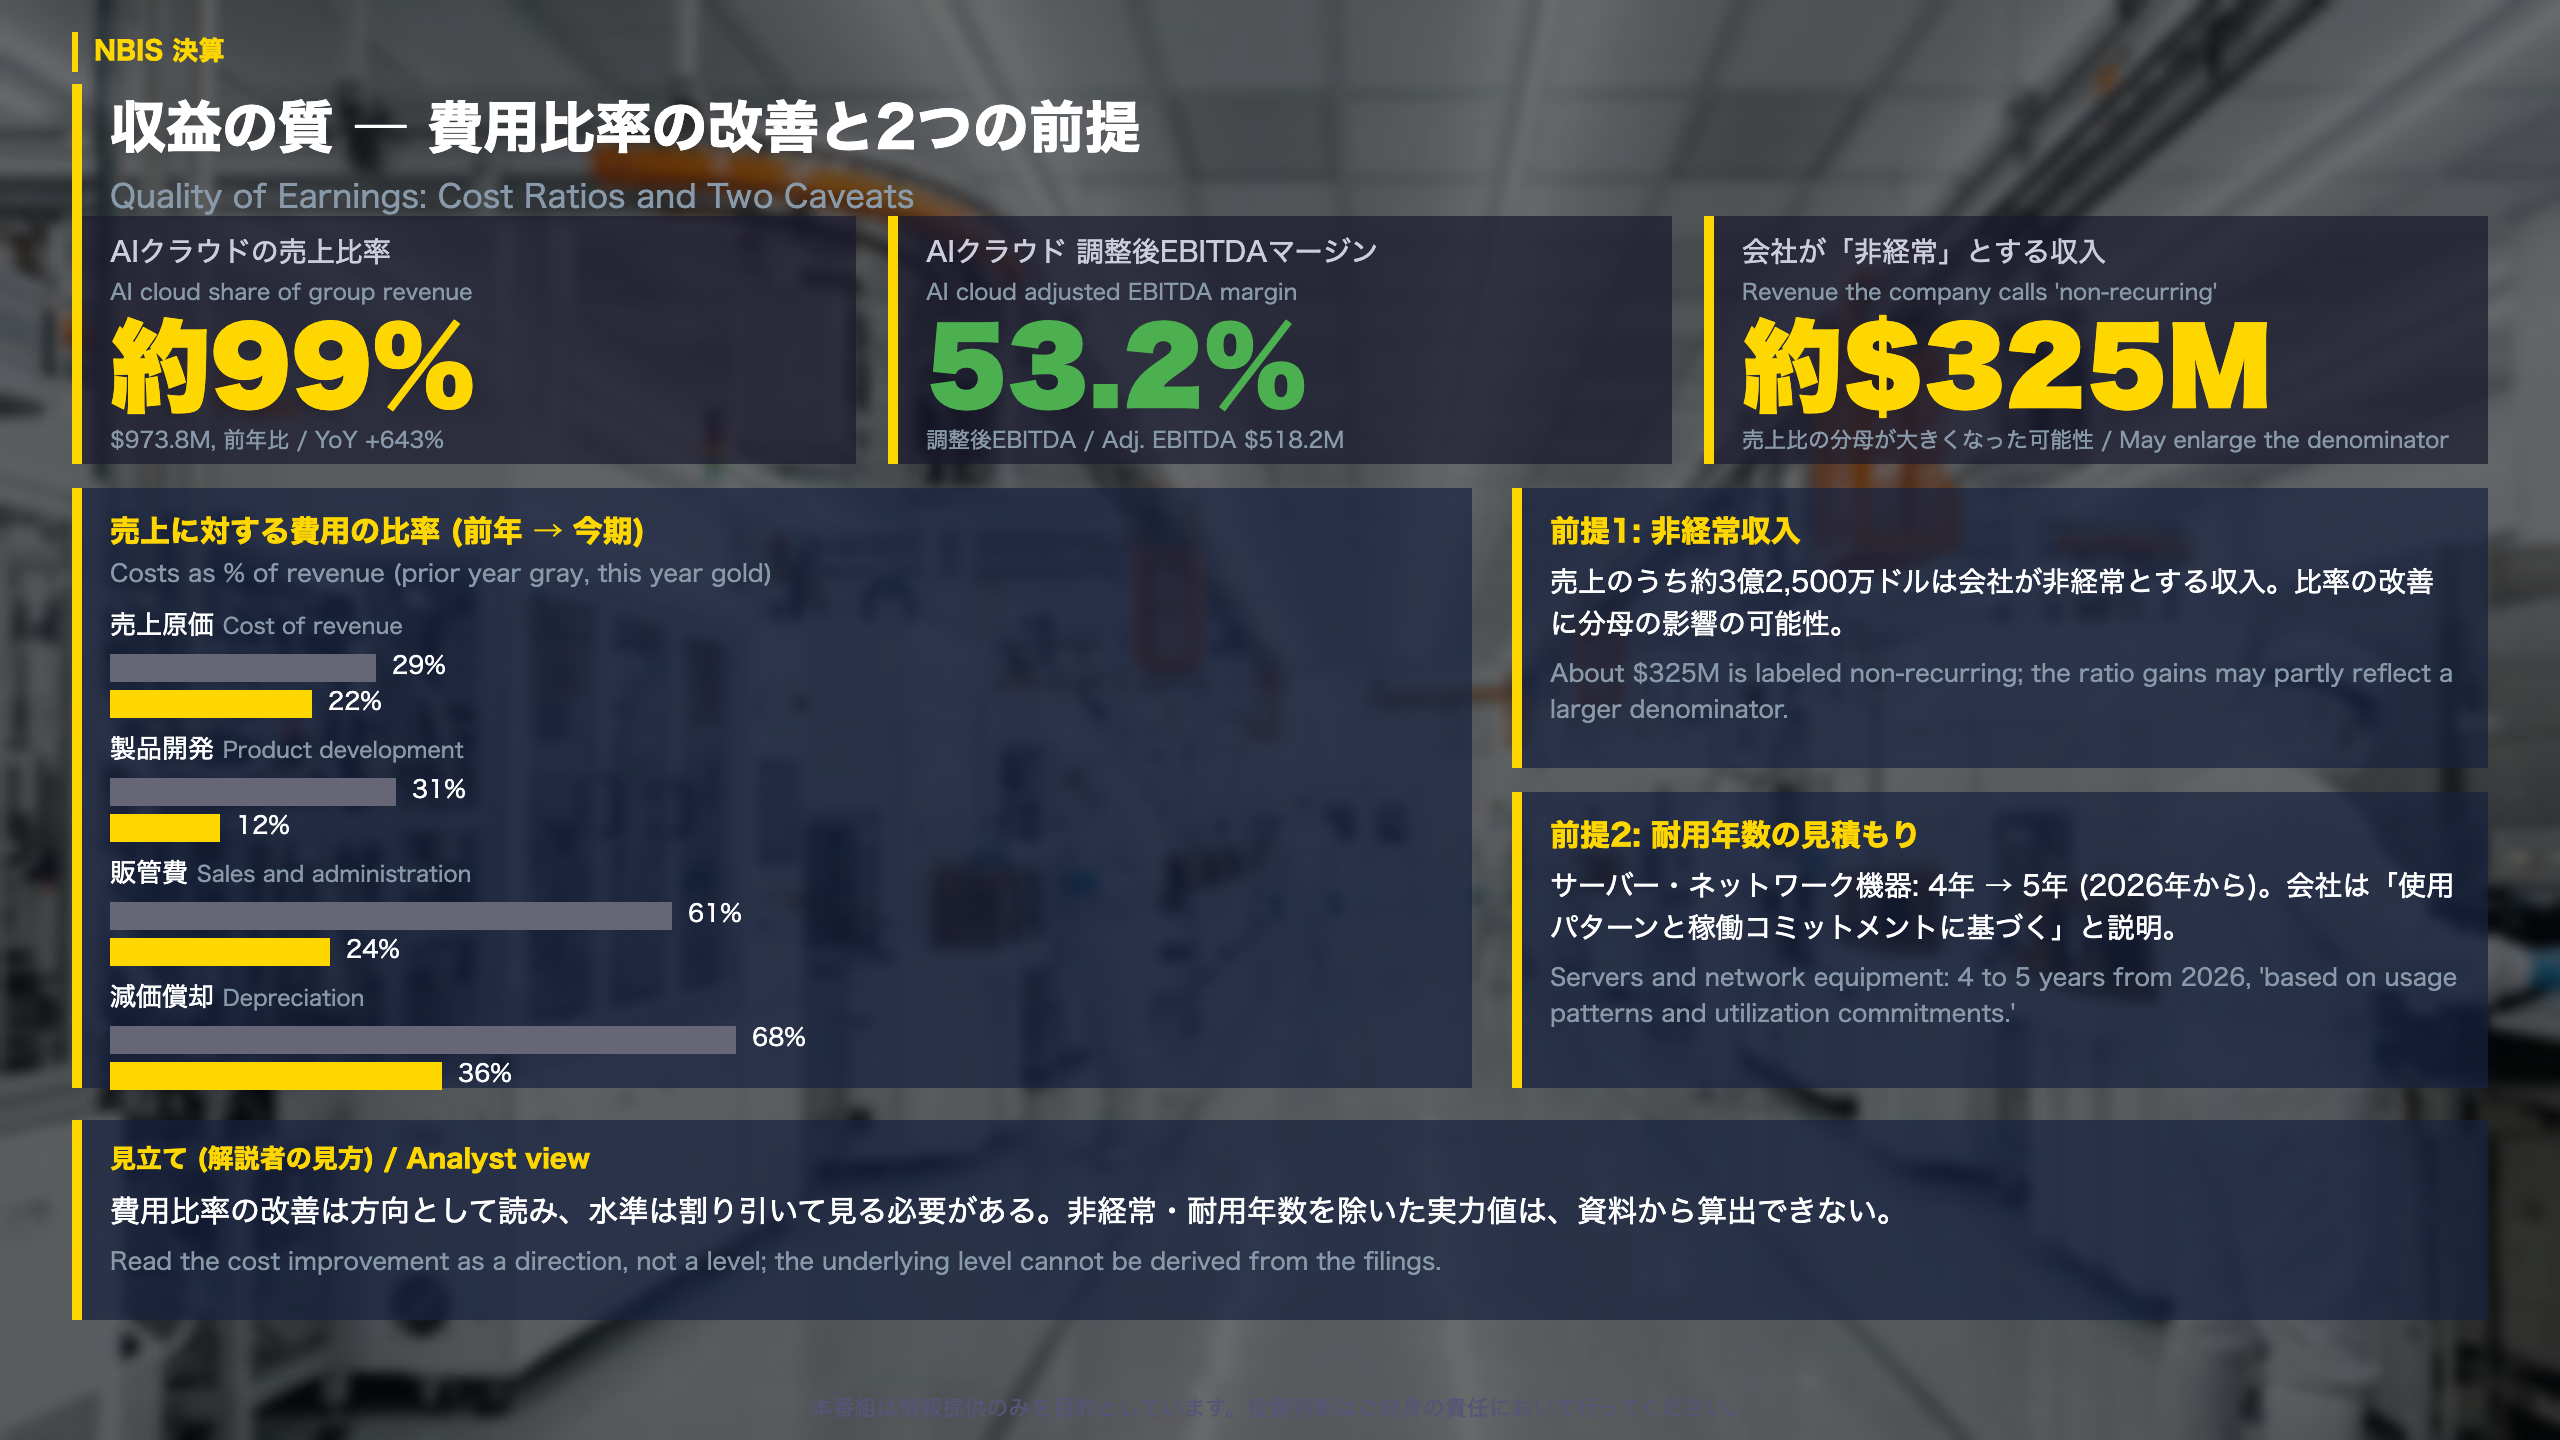
How good is the revenue? Reading the cost structure
Segment detail
Nebius’s AI cloud segment generated $973.8M in revenue (+643% year over year), roughly 99% of the group, with adjusted EBITDA of $518.2M. Annualized run-rate revenue (ARR, the latest month’s revenue multiplied by twelve) reached $6.4B at the end of September, from $3.0B at the end of June.
Cost ratios, prior year to this year
| Cost line | Jul-Sep 2025 | Jul-Sep 2026 |
|---|---|---|
| Cost of revenue | 29% | 22% |
| Product development | 31% | 12% |
| Sales and administration | 61% | 24% |
| Depreciation | 68% | 36% |
Two assumptions that matter
- About $325M of revenue is income the company calls non-recurring. A bigger denominator can flatter every ratio above.
- From 2026, servers and network equipment are depreciated over five years instead of four. The company says this is ‘based on usage patterns and utilization commitments.’ Part of the drop in the depreciation ratio is likely due to this accounting estimate.
Why the company drops ARR
The company says ARR is based on a single month of the quarter and can swing with partnership income, so from 2027 it will guide on revenue and pre-tax profit instead.
Balanced reading
- Constructive: every cost ratio improved and the AI cloud margin is 53.2%.
- Cautious: the filings do not allow an outside reader to strip out non-recurring income and the depreciation change, so the underlying level of margin cannot be calculated.
Remaining performance obligations (contracted backlog) were $38.7B, up only 3% from $37.5B last quarter; the link to new bookings is not stated in the source.
お金の流れ ― 前払いと借入が投資を支える
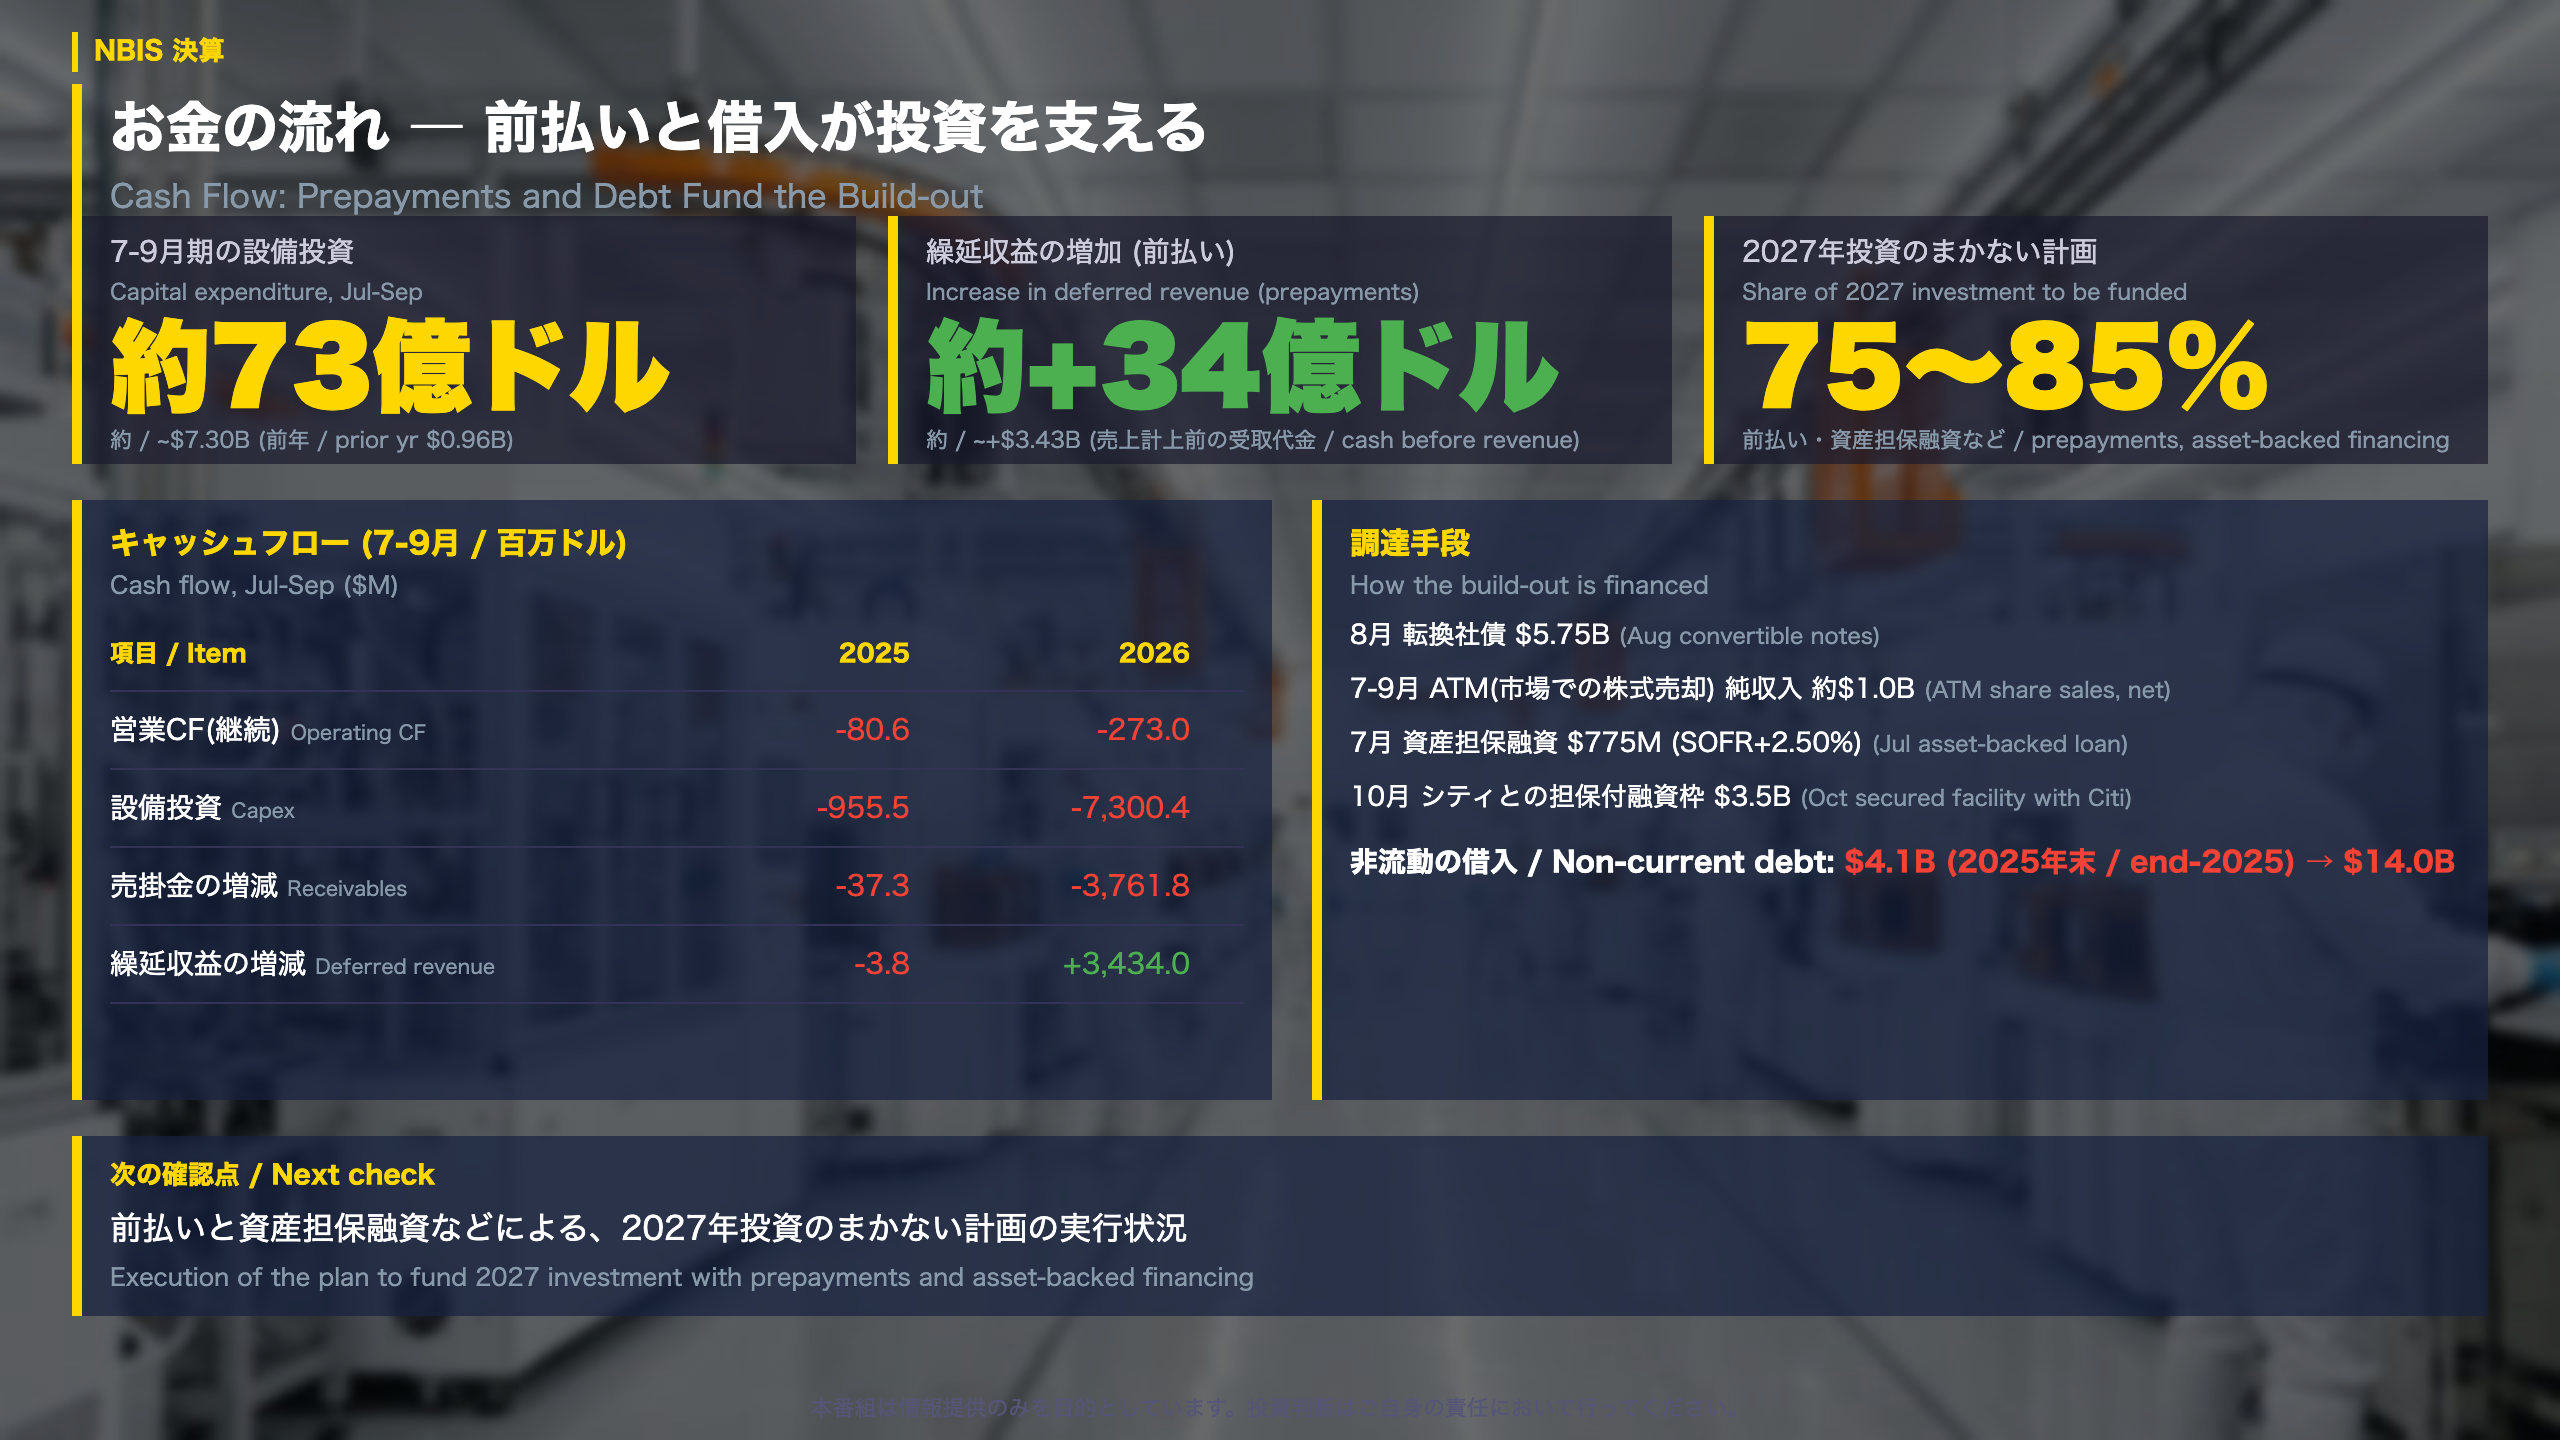
Following the cash: prepayments, debt and payback
Cash flow statement, July-September
| Item ($M) | 2025 | 2026 |
|---|---|---|
| Operating cash flow (continuing) | -80.6 | -273.0 |
| Capital expenditure | -955.5 | -7,300.4 |
| Change in receivables | -37.3 | -3,761.8 |
| Change in deferred revenue | -3.8 | +3,434.0 |
Deferred revenue is cash a customer pays before the company recognizes it as revenue. For nine months, operating cash flow was +$4,231.1M, driven by a +$7,829.0M rise in deferred revenue, which suggests a large timing gap between cash received and revenue booked.
Contract terms, per the company
- Payback on comparable one-to-three-year deals (revenue basis): from 1 year 10 months to 1 year 7 months
- Annual contract value per megawatt: from over $20M to over $25M
- Average GPU-hour price up more than 20% from the prior quarter
- Over 90% of July-September contract value carried prepayments
How the build-out is financed
$5.75B of convertible notes in August; about $1B net from an at-the-market (ATM) share program, where a company sells shares gradually at market prices; a $775M asset-backed loan in July priced at SOFR (a US dollar benchmark rate) plus 2.50%; and a $3.5B secured facility with Citi in October.
Balanced reading
- Constructive: the company projects about $10B of prepaid contracts in 2026 and $17-20B in 2027.
- Cautious: non-current debt rose from $4.1B at end-2025 to $14.0B, and interest expense reached $112.5M.
The company aims to cover 75-85% of 2027 investment with prepayments and asset-backed financing; progress against that plan is the item to monitor.
見通しと次の確認点 ― 引き渡しの遅れ
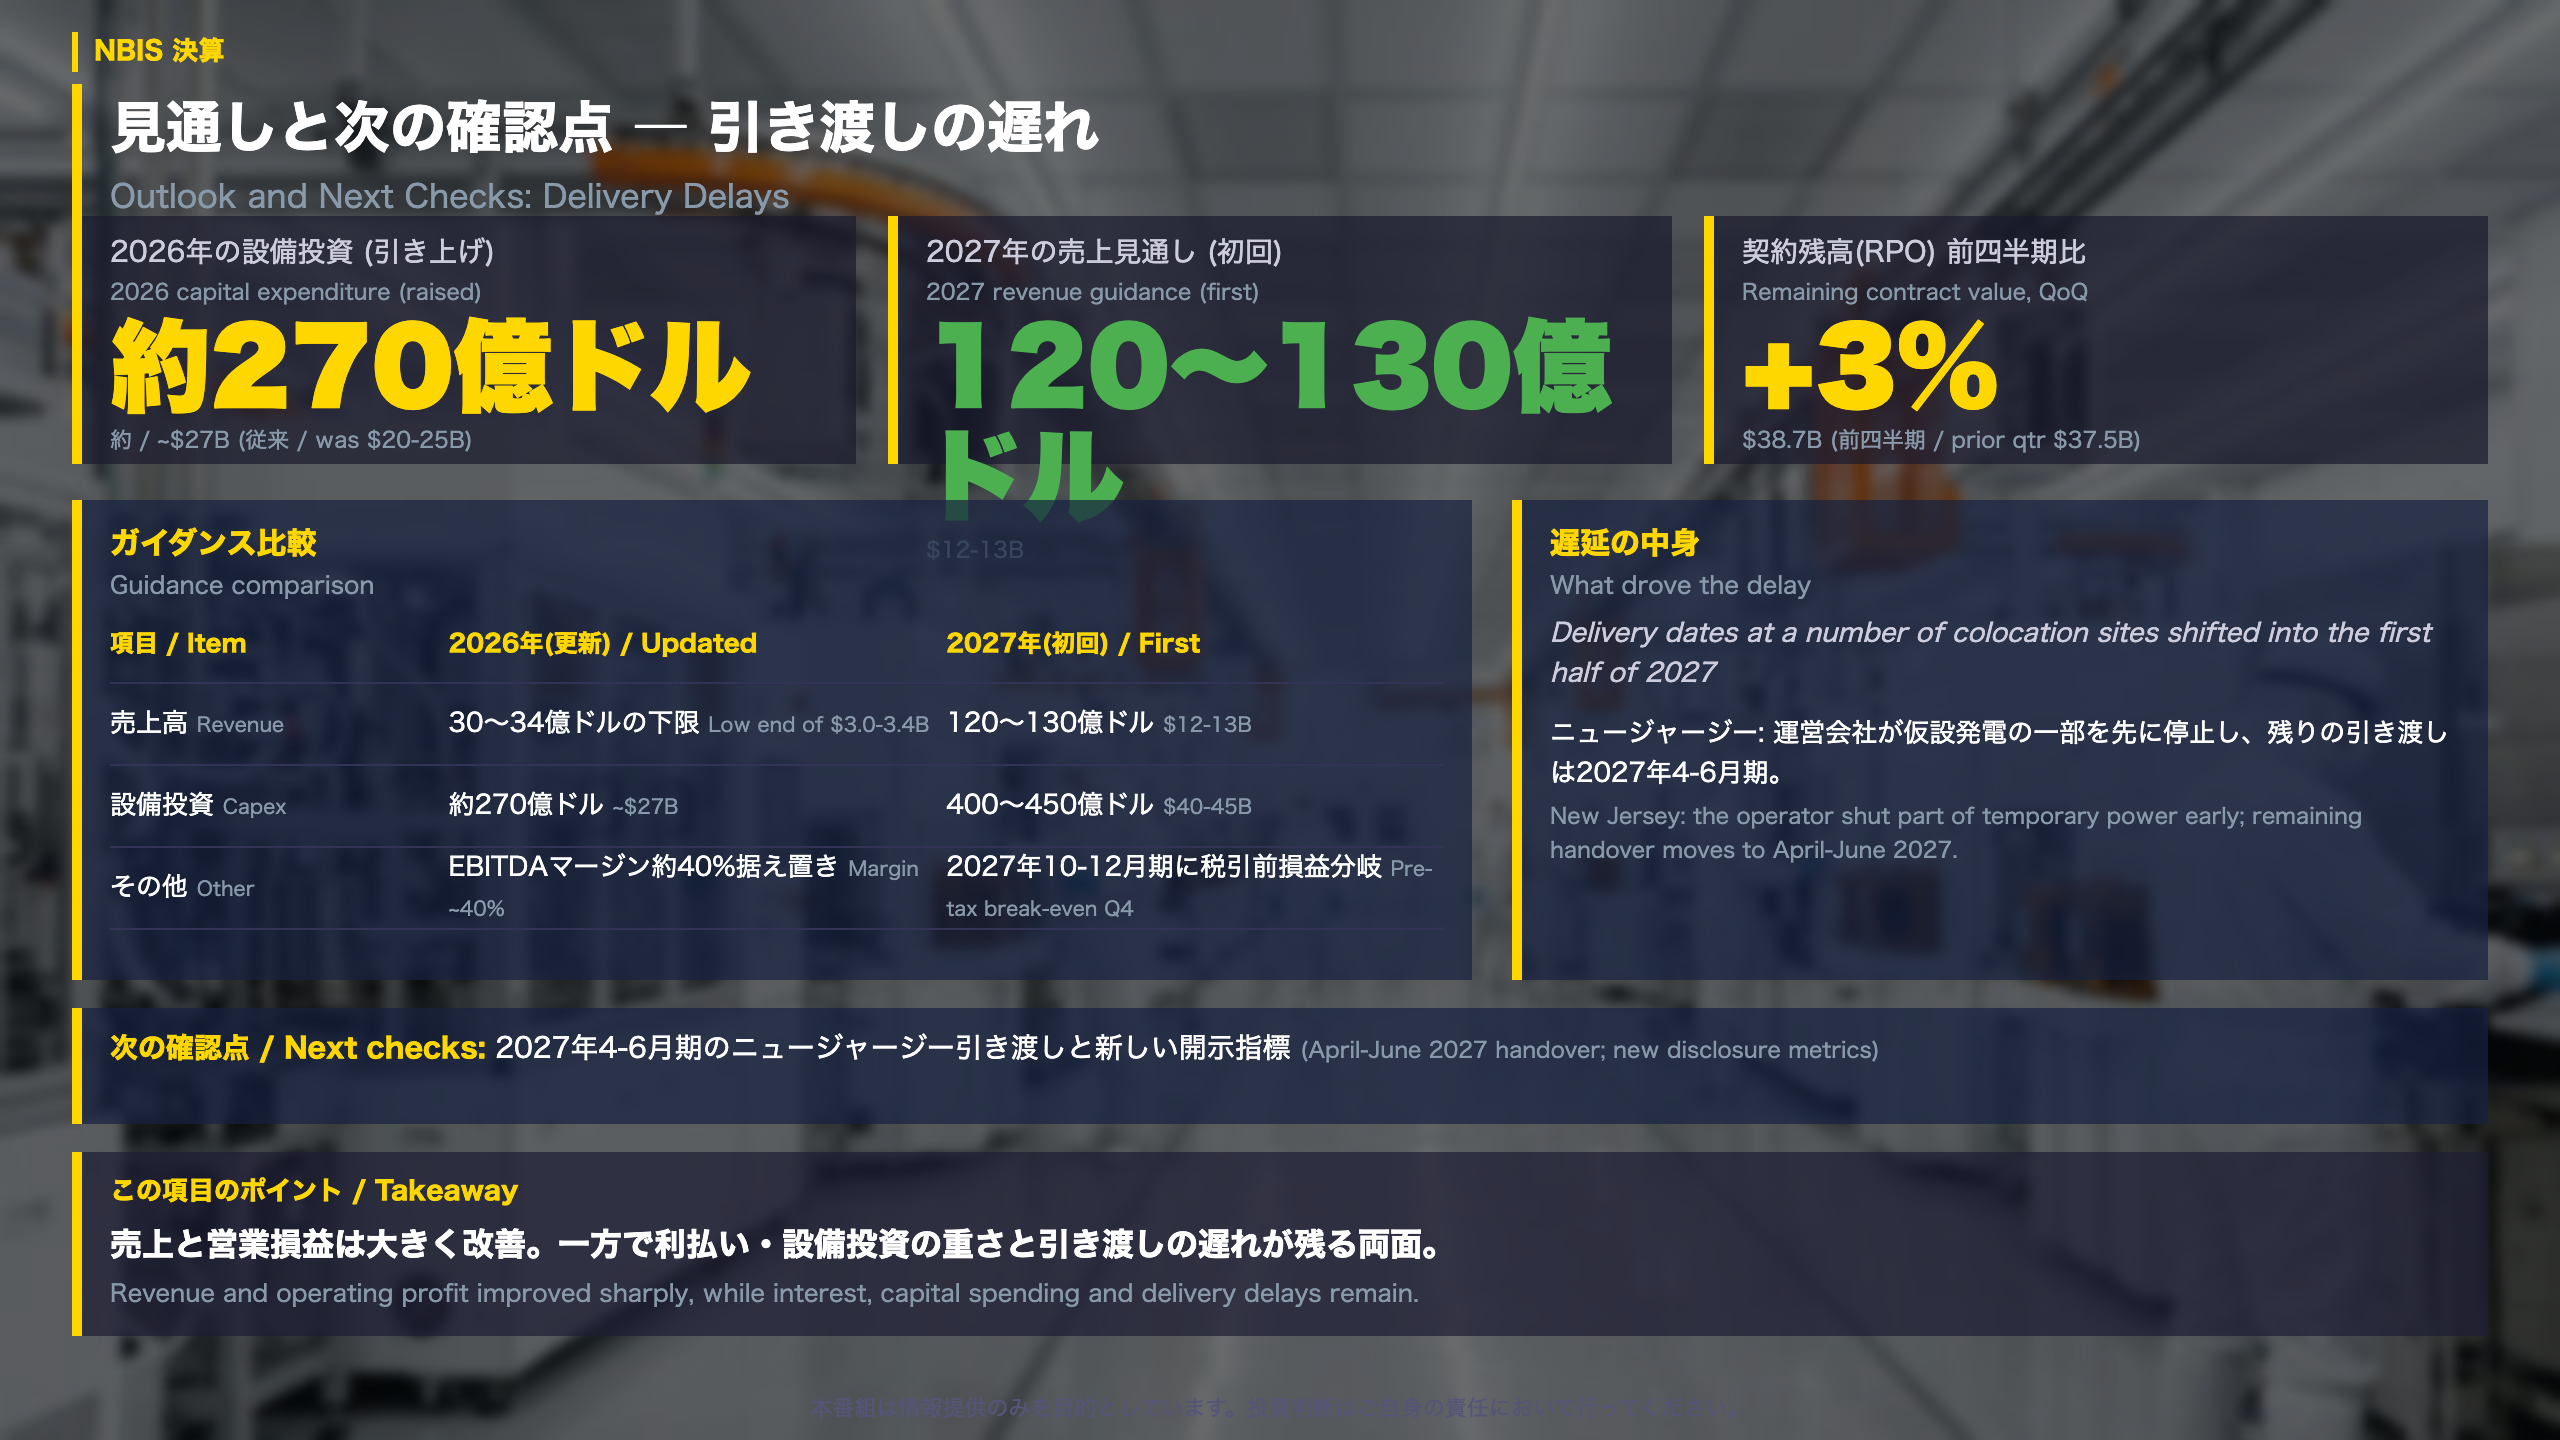
What changed in the outlook, and where the risks sit
Guidance at a glance
| Item | 2026 (updated) | 2027 (first guidance) |
|---|---|---|
| Revenue | Low end of $3.0-3.4B | $12-13B |
| Adjusted EBITDA margin | About 40% (unchanged) | Replaced by revenue and pre-tax profit guidance |
| Capital expenditure | About $27B (was $20-25B) | $40-45B |
| Pre-tax result | – | Break-even in Oct-Dec 2027 |
The timing of the ARR (annualized run-rate revenue) target moved back by about two months: in December the company had pointed to $7-9B, and now it says over $7B by February. Contracted power for year-end is still 5GW, against more than 4GW today.
What caused the delays
The company says: ‘Delivery dates at a number of colocation sites shifted into the first half of 2027.’ Colocation means placing equipment in a third party’s data center. In New Jersey, the operator DataOne shut down part of its temporary power before the move to permanent supply, so the remaining handovers slip to April-June 2027. More than half of the capacity contracted for Microsoft is expected to be delivered by year-end.
Shift toward owned sites
From 2027 capacity comes first from owned sites (Missouri, Lappeenranta, a second site in Mantsala, and Alabama), with more than 3GW planned over three to three-and-a-half years.
Other businesses
Avride’s autonomous vehicle fleet stands at 250 units (year-end target 350); TripleTen’s consumer business cash burn fell 44% from the prior quarter.
Balanced reading
- Constructive: contracts are maintained, 2027 revenue guidance is about four times the 2026 level, and prepayments underpin the spending.
- Cautious: delays center on third-party sites, remaining contract value rose just 3%, and the break-even date relies on the five-year useful-life assumption.
Next checkpoints
The New Jersey handover in April-June 2027 and the new disclosure metrics from 2027. The next report date is not stated in the source.
売上は過去最高、赤字は拡大
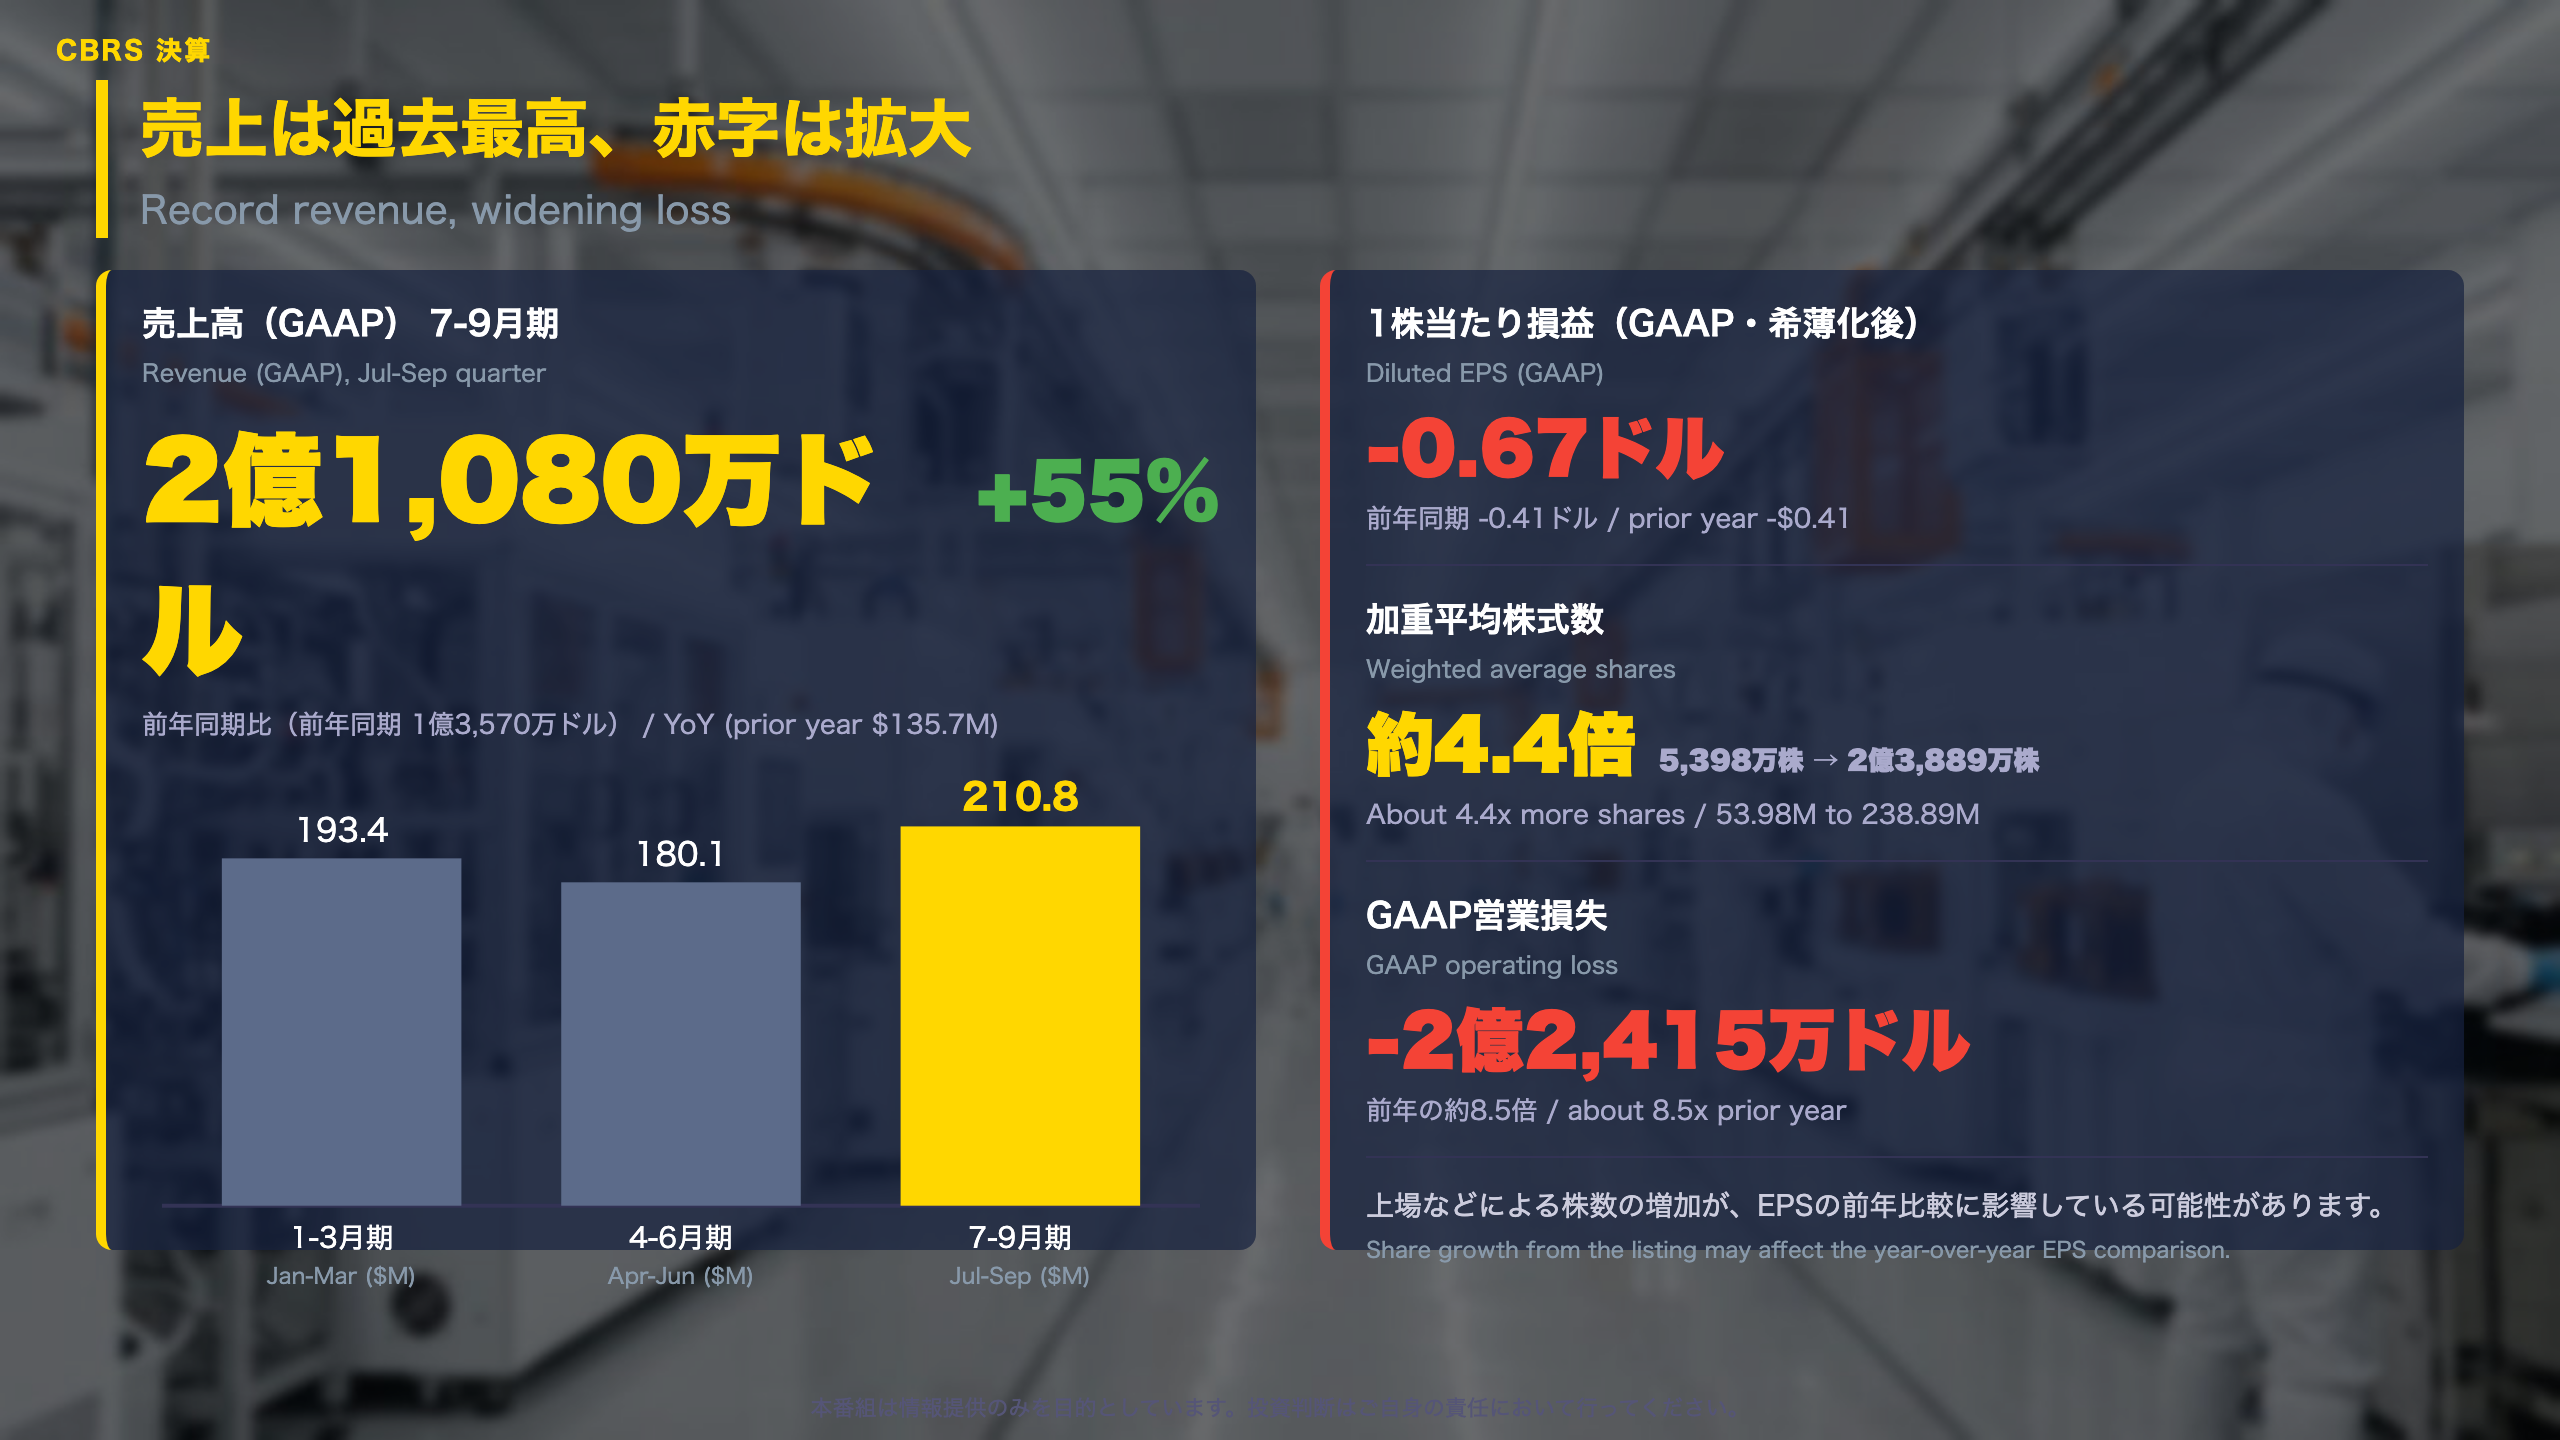
Cerebras Systems: July-September 2026 quarter at a glance
Cerebras Systems reported GAAP revenue of $210.8 million for the July-September quarter, up 55% from $135.7 million a year earlier and above the two earlier quarters of the year ($193.4 million and $180.1 million). Revenue for the first nine months totaled $584.3 million, about 1.7 times the year-earlier figure.
GAAP versus ‘core’
GAAP figures follow standard accounting rules. Cerebras also publishes its own adjusted ‘core’ measures, which are not GAAP and should be read separately.
| Metric | This quarter | Year earlier |
|---|---|---|
| Core revenue | $230.9M | $135.7M |
| Core gross margin | 41.0% | 40.7% |
| Core operating margin | -14.3% | -11.1% |
| Core adjusted EBITDA | -$3.31M | -$6.5M |
| Core net income | $29.8M | -$10.9M |
The signals are mixed: core operating margin slipped, while core adjusted EBITDA and core net income improved.
Share count matters for EPS
Diluted GAAP EPS was -$0.67 versus -$0.41 a year earlier. The weighted average share count rose from 53.98 million to 238.89 million, so the listing may be distorting the year-over-year EPS comparison.
‘We exceeded our guidance across the board for the third quarter in a row’ – CFO Bob Komin
Two readings
The constructive reading points to record revenue and better core EBITDA. The cautious reading points to a GAAP operating loss of $224.15 million, about 8.5 times a year earlier. Both rest on figures in the filing.
Next check
October-December core revenue guidance is $310-330 million; whether results land inside that range is the next data point.
売上構成:ハードからクラウドへ
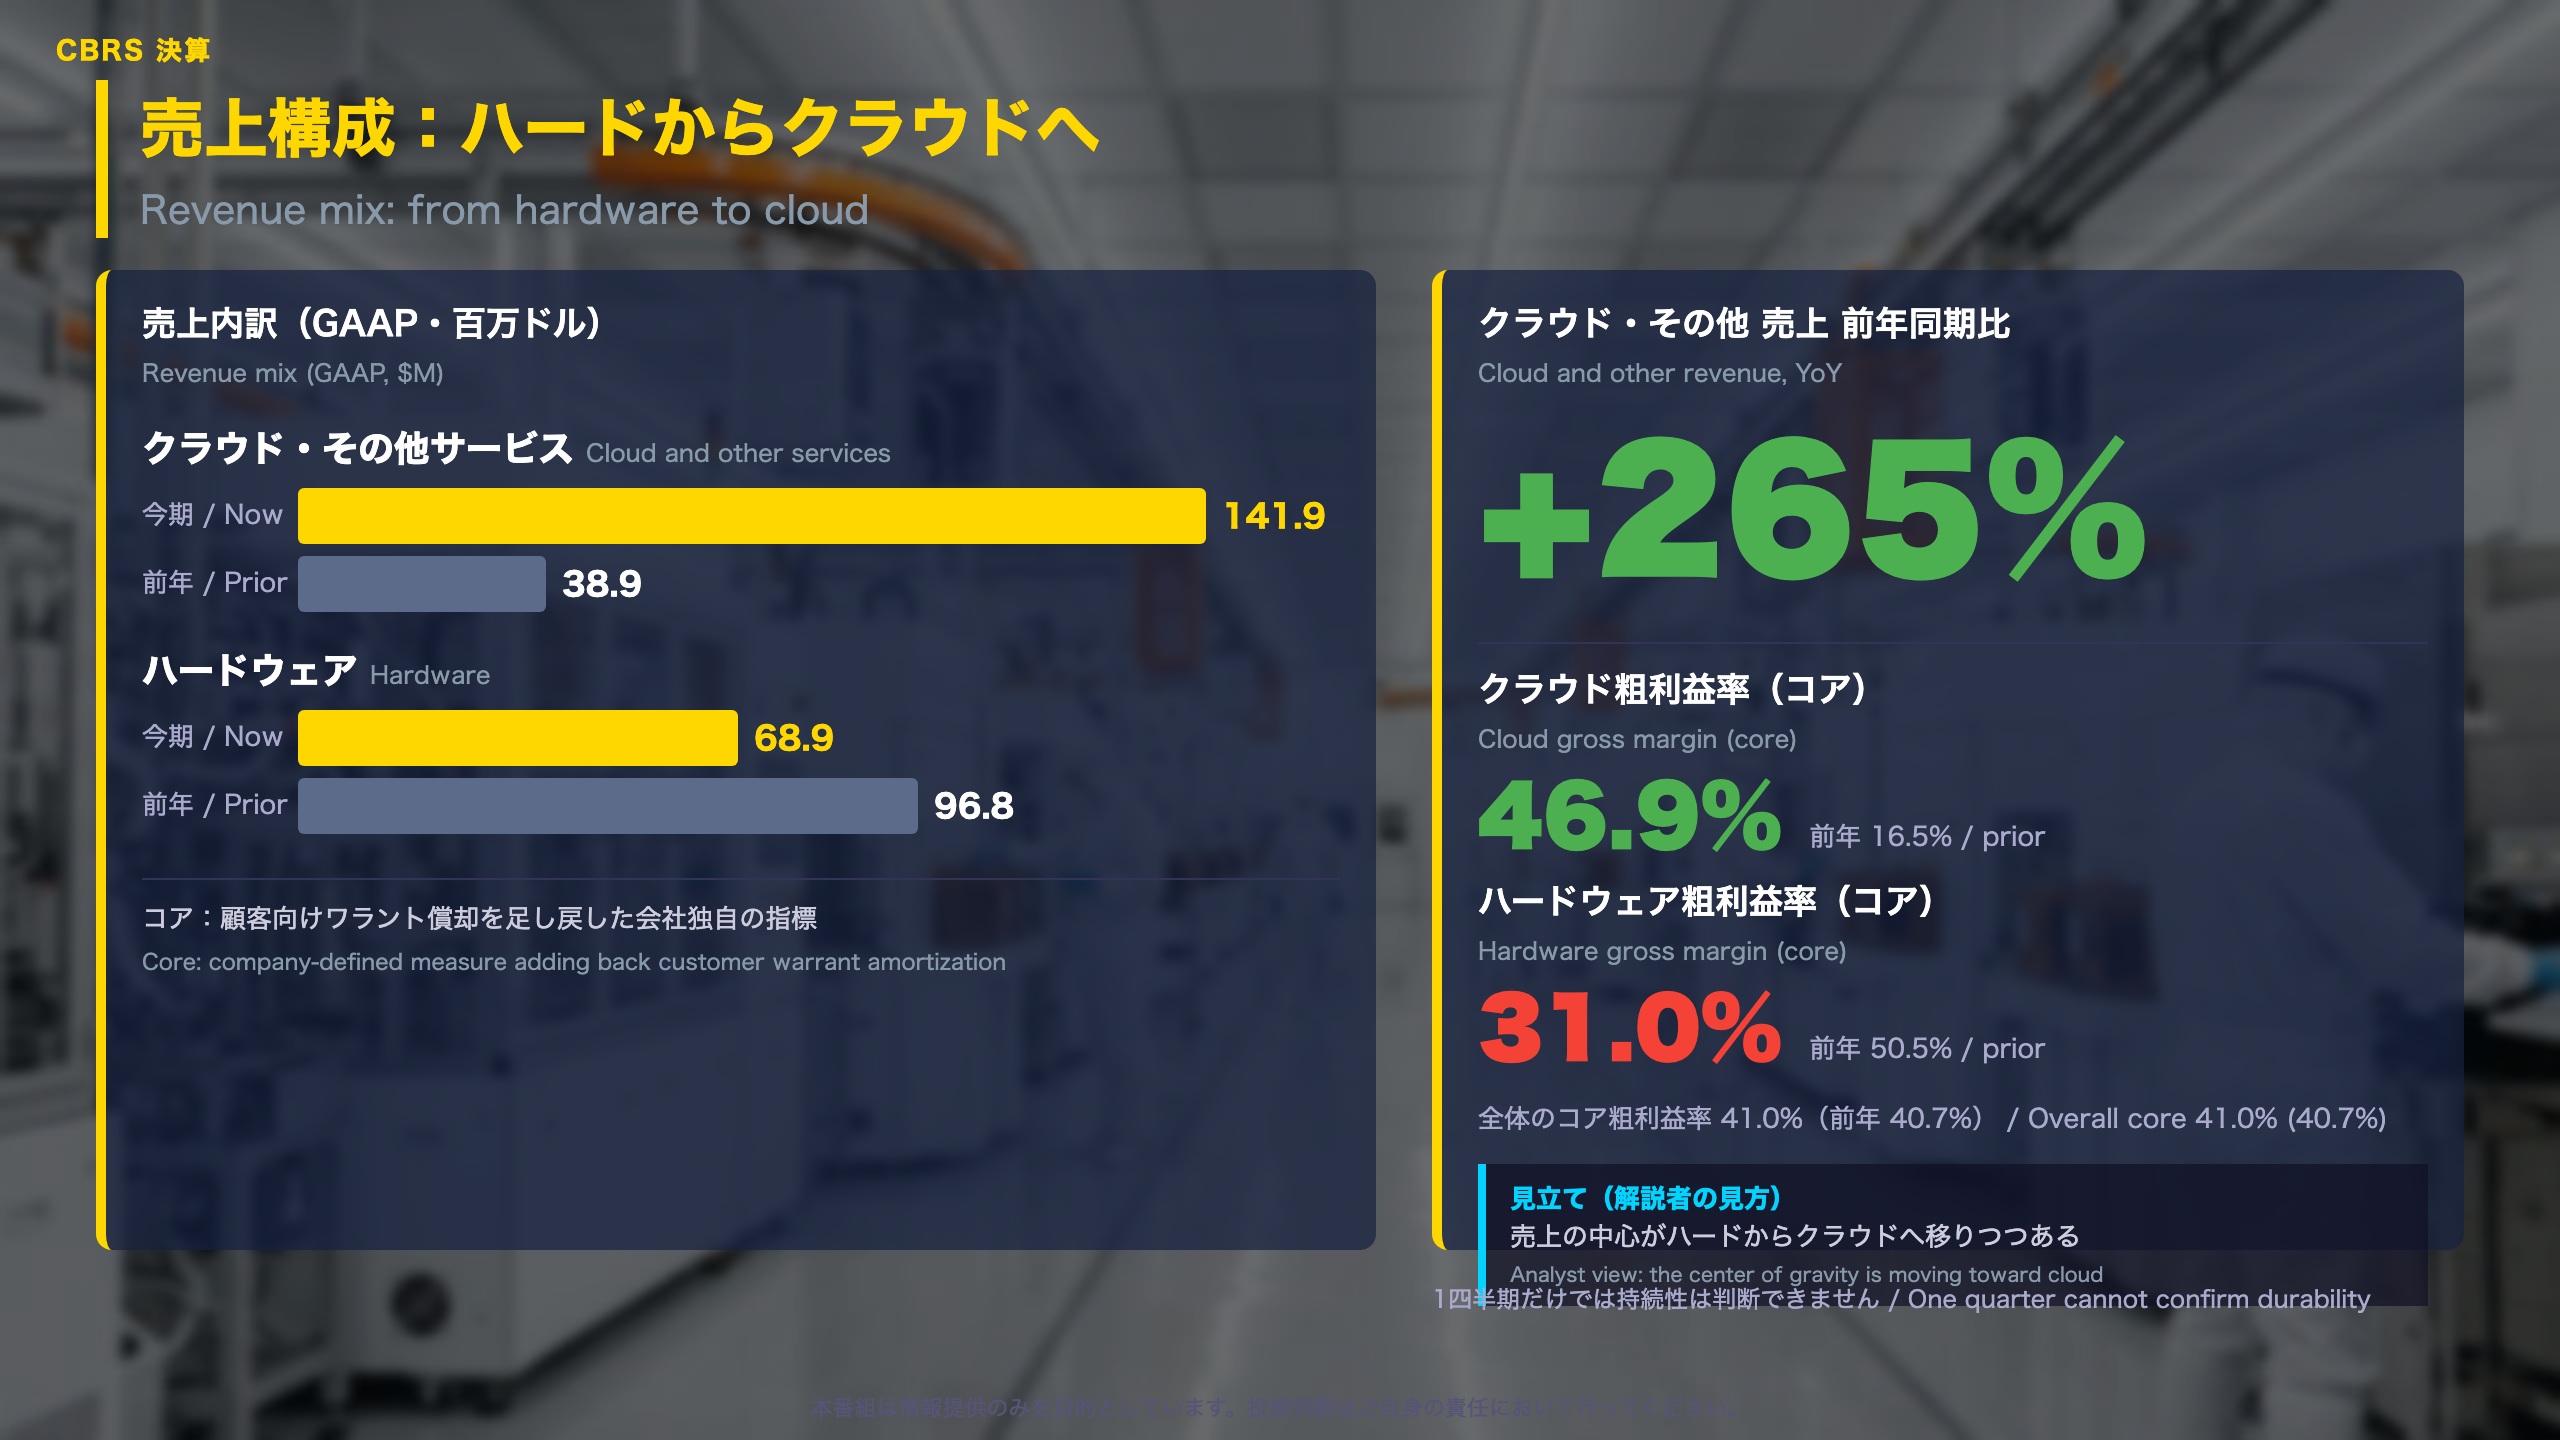
Revenue mix: the shift from hardware to cloud
GAAP revenue by segment
| Segment | This quarter | Year earlier |
|---|---|---|
| Hardware | $68.9M | $96.8M |
| Cloud and other services | $141.9M | $38.9M |
Over the first nine months, cloud revenue reached $350.7 million (versus $101.8 million a year earlier), while hardware was roughly flat at $233.6 million (versus $236.8 million). Cloud accounts for most of the growth on a cumulative basis too.
Why GAAP and core differ here
GAAP revenue is reduced by $36.4 million of amortization of customer warrants (hardware $17.1 million, cloud $19.4 million). Core revenue adds this back and excludes $16.4 million of pass-through revenue. On a core basis, hardware revenue was $86.0 million, about 11% below the $96.8 million of a year earlier.
Margins (core basis)
- Cloud gross margin: 46.9% (16.5% a year earlier)
- Hardware gross margin: 31.0% (50.5% a year earlier)
- Total: 41.0% (40.7% a year earlier)
The offsetting moves explain why the blended margin barely changed.
How to read it
A constructive reading sees a business mix moving toward cloud with better unit economics. A cautious reading notes that hardware profitability fell sharply and that a single quarter cannot establish that the cloud margin is durable. The company’s own materials say its disaggregated inference approach delivers substantially more high-speed tokens for the same power.
The next quarter’s cloud revenue growth and margin are the data points that will test this picture.
赤字の見え方:会計基準とコアの差
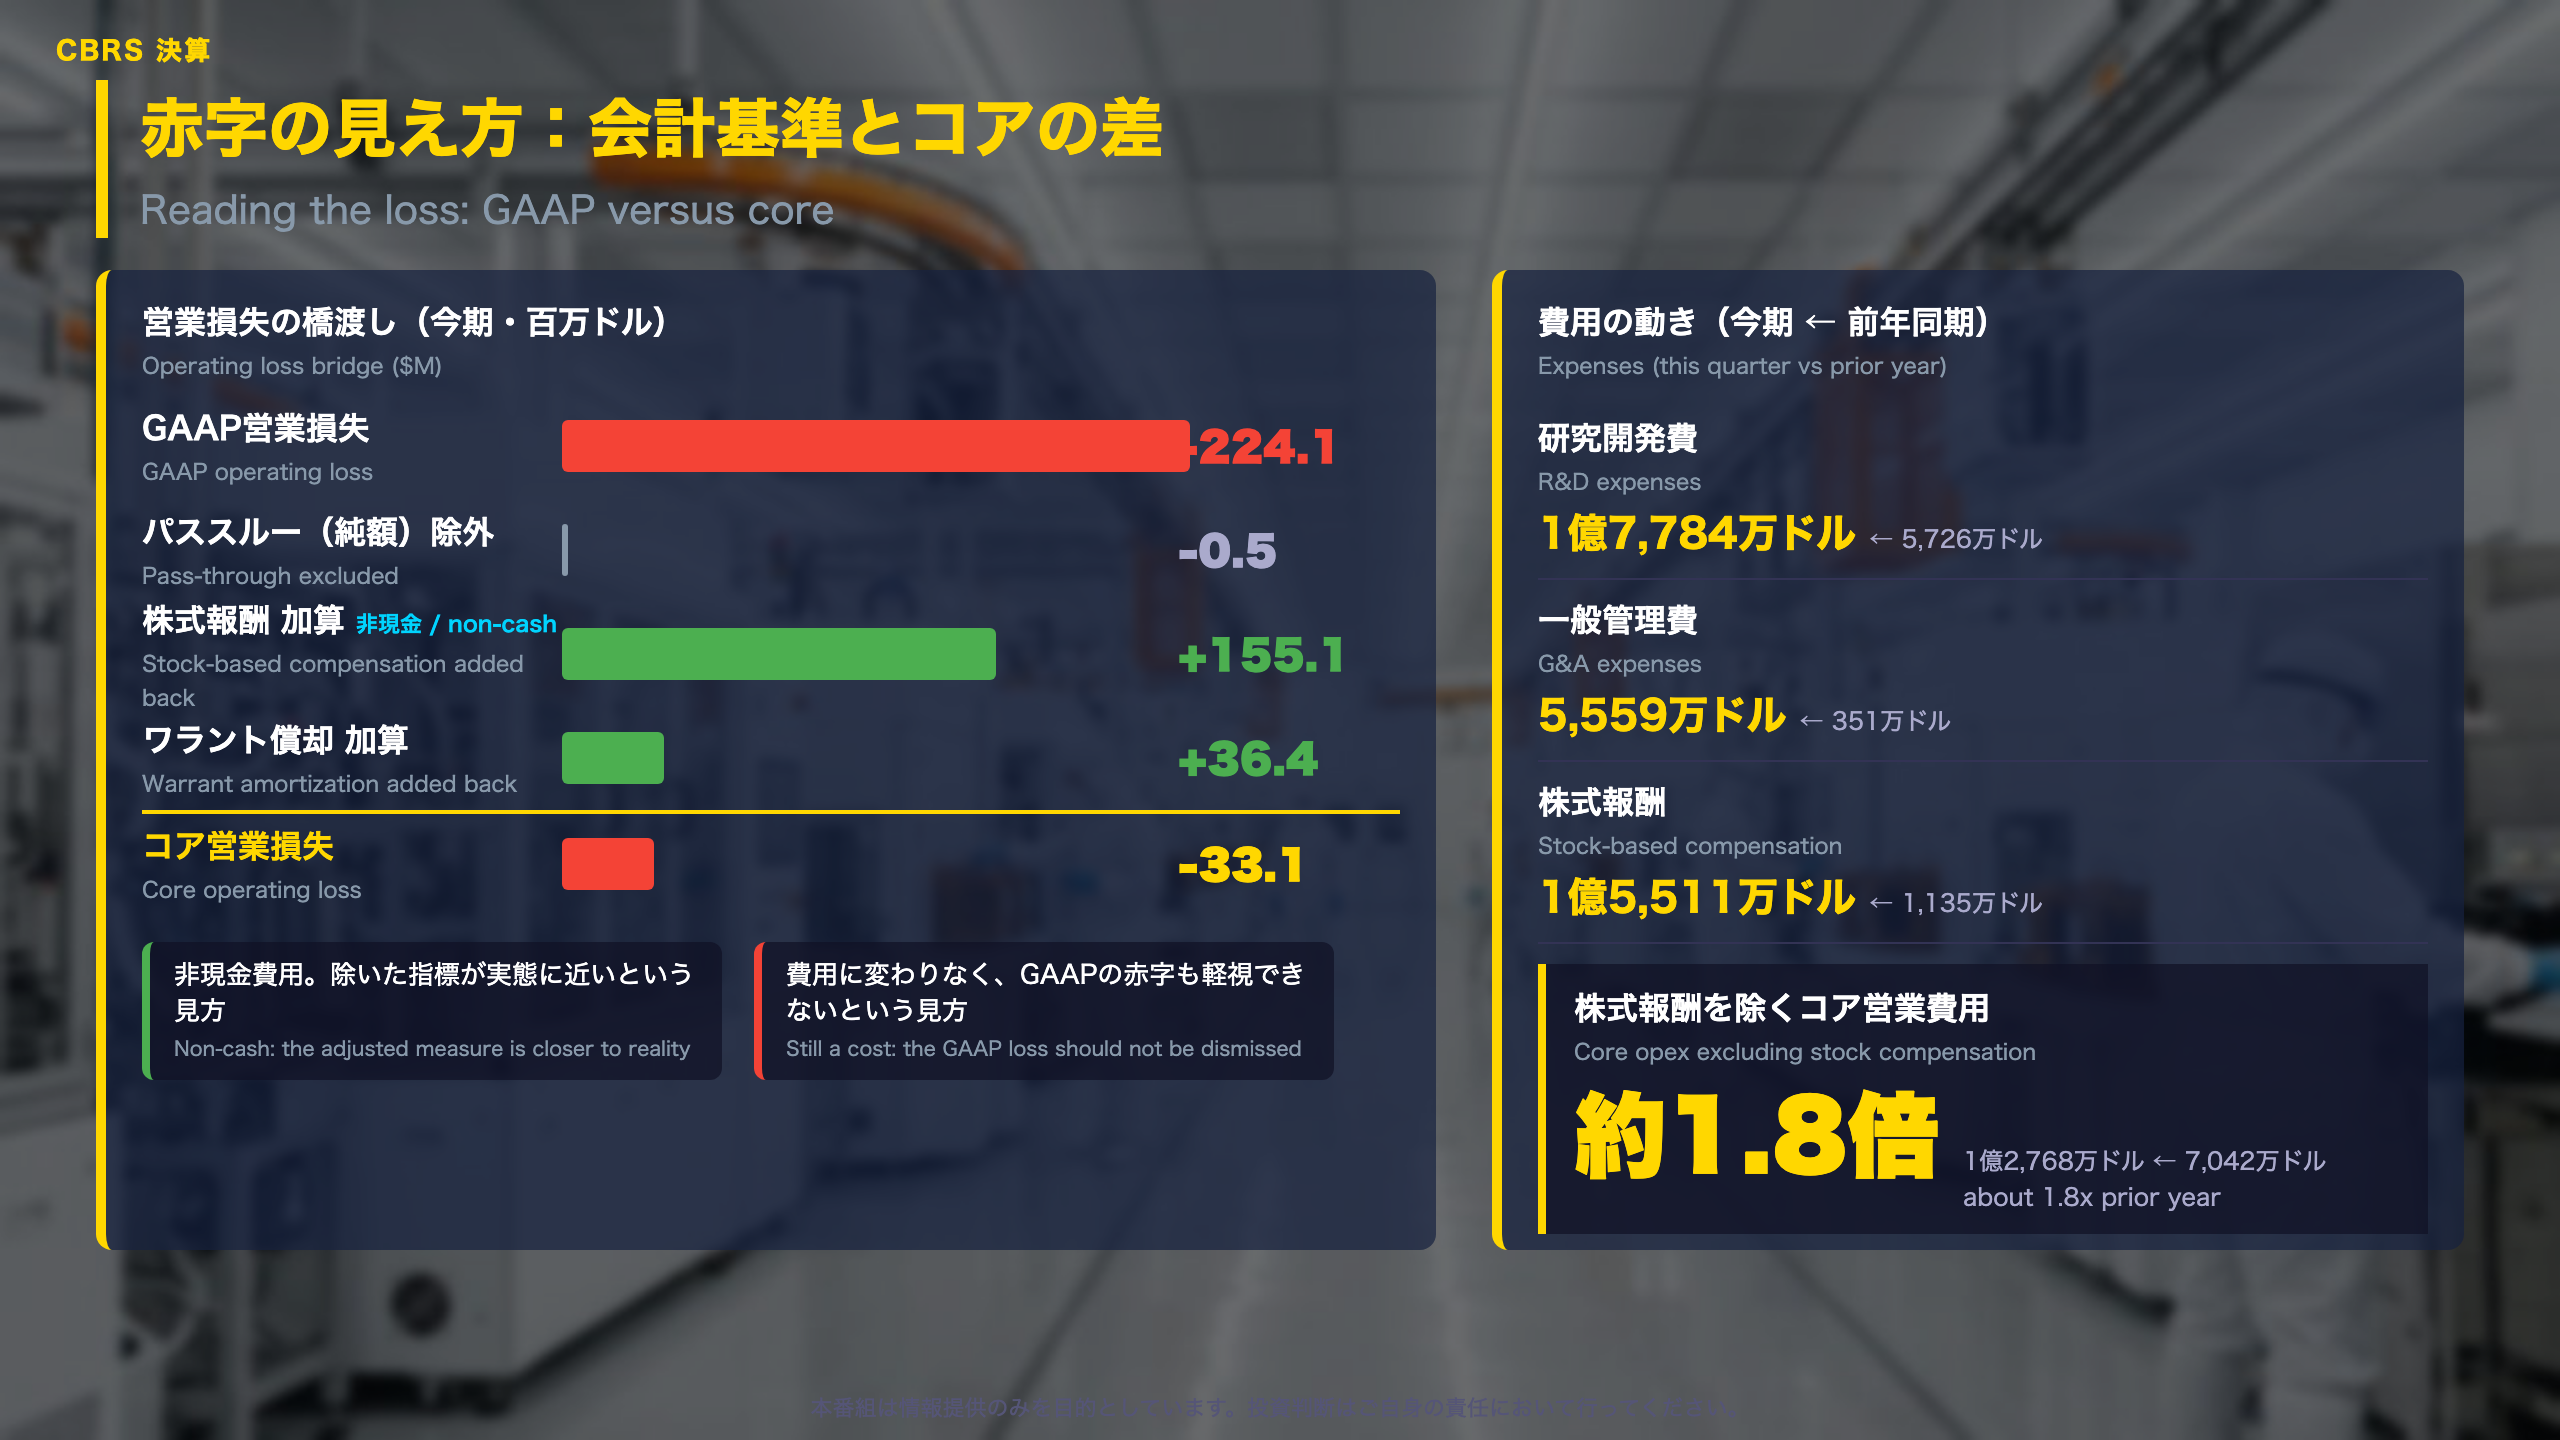
Bridging the GAAP loss and the core loss
Operating loss reconciliation (this quarter, $M)
| Item | Amount |
|---|---|
| GAAP operating loss | -224.1 |
| Pass-through (net) excluded | -0.5 |
| Stock-based compensation added back | +155.1 |
| Warrant amortization added back | +36.4 |
| Core operating loss | -33.1 |
Stock-based compensation is a non-cash expense: employees are paid partly in shares rather than cash. Adding it back is a common practice in adjusted measures, but it remains a real cost to shareholders through dilution, which is why the two readings below both have merit.
Expense trends
- R&D: $177.8M (vs $57.3M a year earlier)
- G&A: $55.6M (vs $3.5M)
- Stock compensation: $155.1M (vs $11.4M)
- Core operating expenses excluding stock compensation: $127.7M (vs $70.4M), about 1.8 times
Net result and cash
Other income was $63.9 million (vs $5.8 million), so the GAAP net loss of $161.2 million was smaller than the operating loss. Core net income was positive at $29.8 million because that other income exceeded the $33.1 million core operating loss; the filing does not break down the other income. For the first nine months, operating cash flow was -$388.9 million and capital expenditure $1.046 billion, funded by $6.23 billion raised in the IPO.
Two readings
One view holds that the adjusted figure is closer to operating reality; the other holds that the GAAP loss should not be dismissed. Both rest on filing data.
Guidance
The company guides to a core operating margin of -1% to +1% in October-December and -10% to -8% for the full year.
見通しと確認点:契約残高と顧客集中
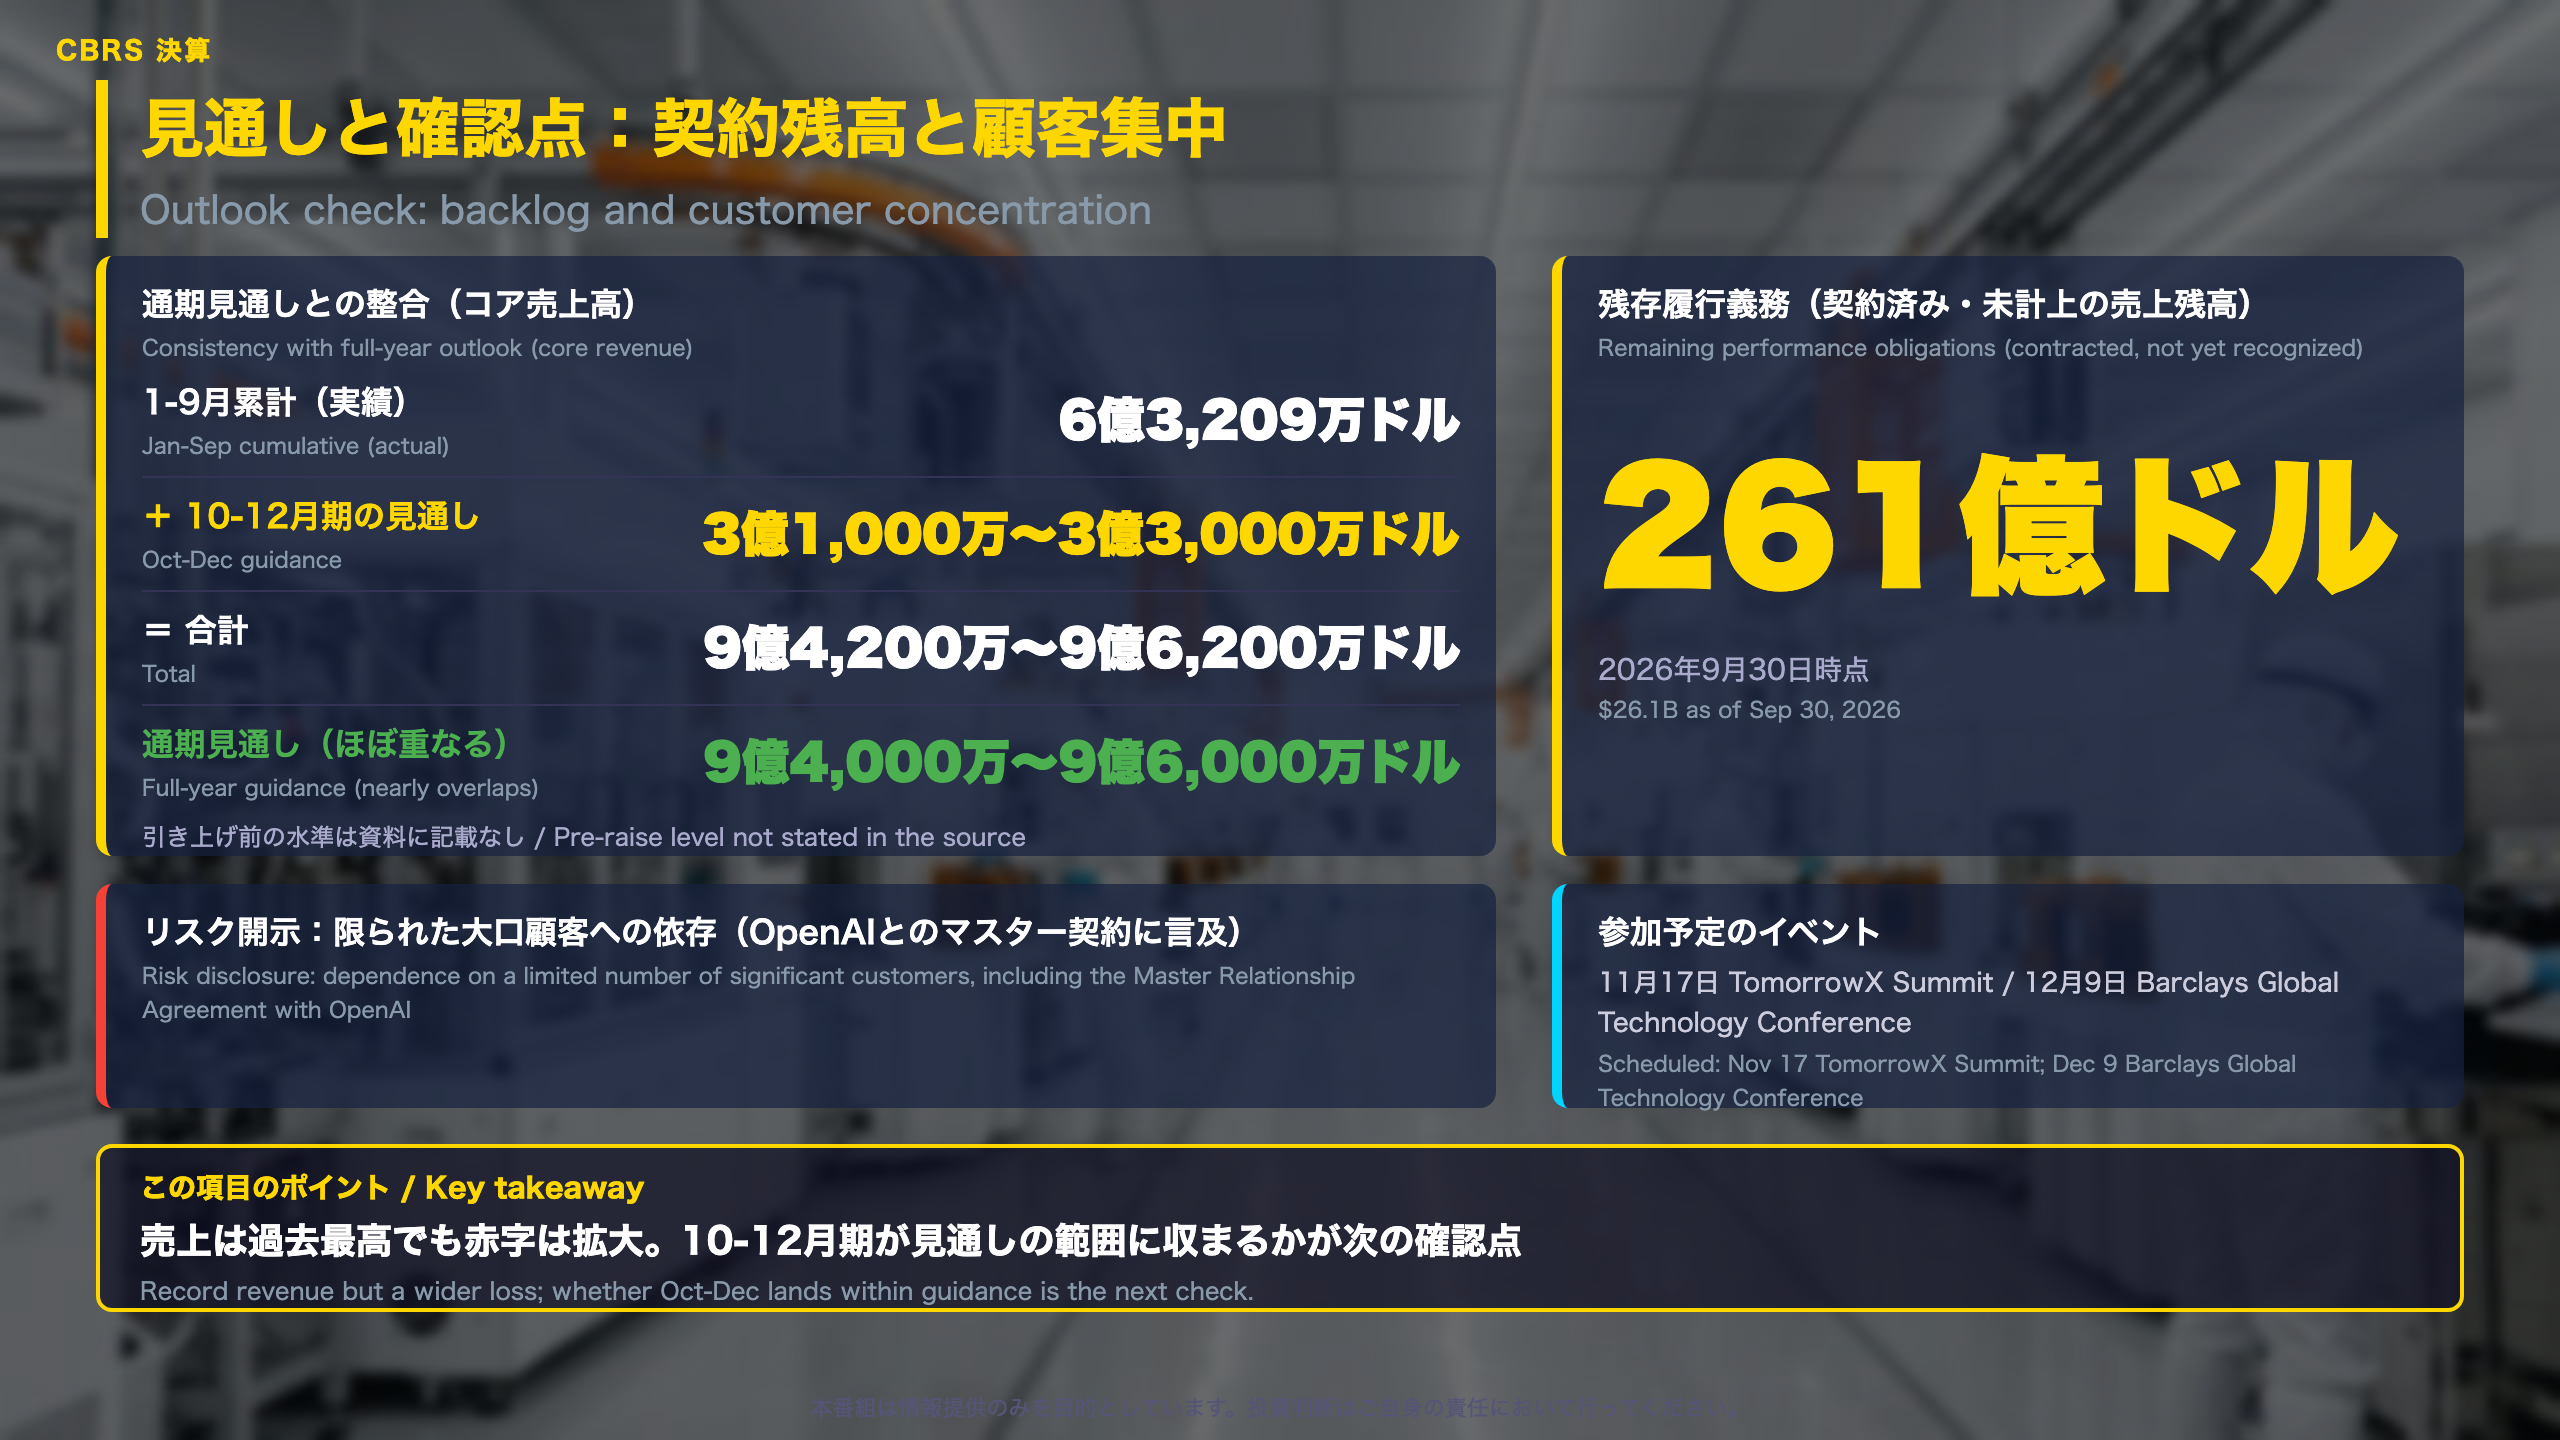
Guidance consistency, backlog and supply
How the outlook adds up
Cumulative January-September core revenue was $632.1 million. Adding October-December guidance of $310-330 million gives $942-962 million, almost the same as the full-year guidance of $940-960 million. Gross margin guidance is 47%-49% for the quarter and 42%-44% for the year. The filing does not state the pre-raise full-year guidance.
Backlog and funding
Remaining performance obligations (RPO) are revenue under signed contracts that has not yet been recognized; they stood at $26.1 billion as of September 30, 2026. Cash, restricted cash and short-term investments were $7.8 billion, with $850 million of borrowing capacity. Working capital loans total about $829 million. Customer deposits fell to $108.7 million (from $354.5 million at end-2025), while non-current deferred revenue rose to $453.3 million (from $35.9 million).
Supply and products
The company secured 700 megawatts of data center capacity for delivery through the end of 2027, plus additional agreements in Norway and Finland. Manufacturing is expanding at Flex and Sanmina, with capacity expected to be more than 10 times the start-of-year level by end-2026. CS-4 is described as up to 30 times faster for inference and entering volume production; CS-5 is targeted for early summer 2027.
Risk disclosure
‘dependence on a limited number of significant customers … including under its Master Relationship Agreement with OpenAI’
Two readings
The large backlog and new major cloud customers point to depth of demand; customer concentration and possible supply delays are the cautionary points.
Next
The company will attend the TomorrowX Summit on November 17 and the Barclays Global Technology Conference on December 9. The next earnings date is not stated in the source.
売上は過去最高、赤字は拡大
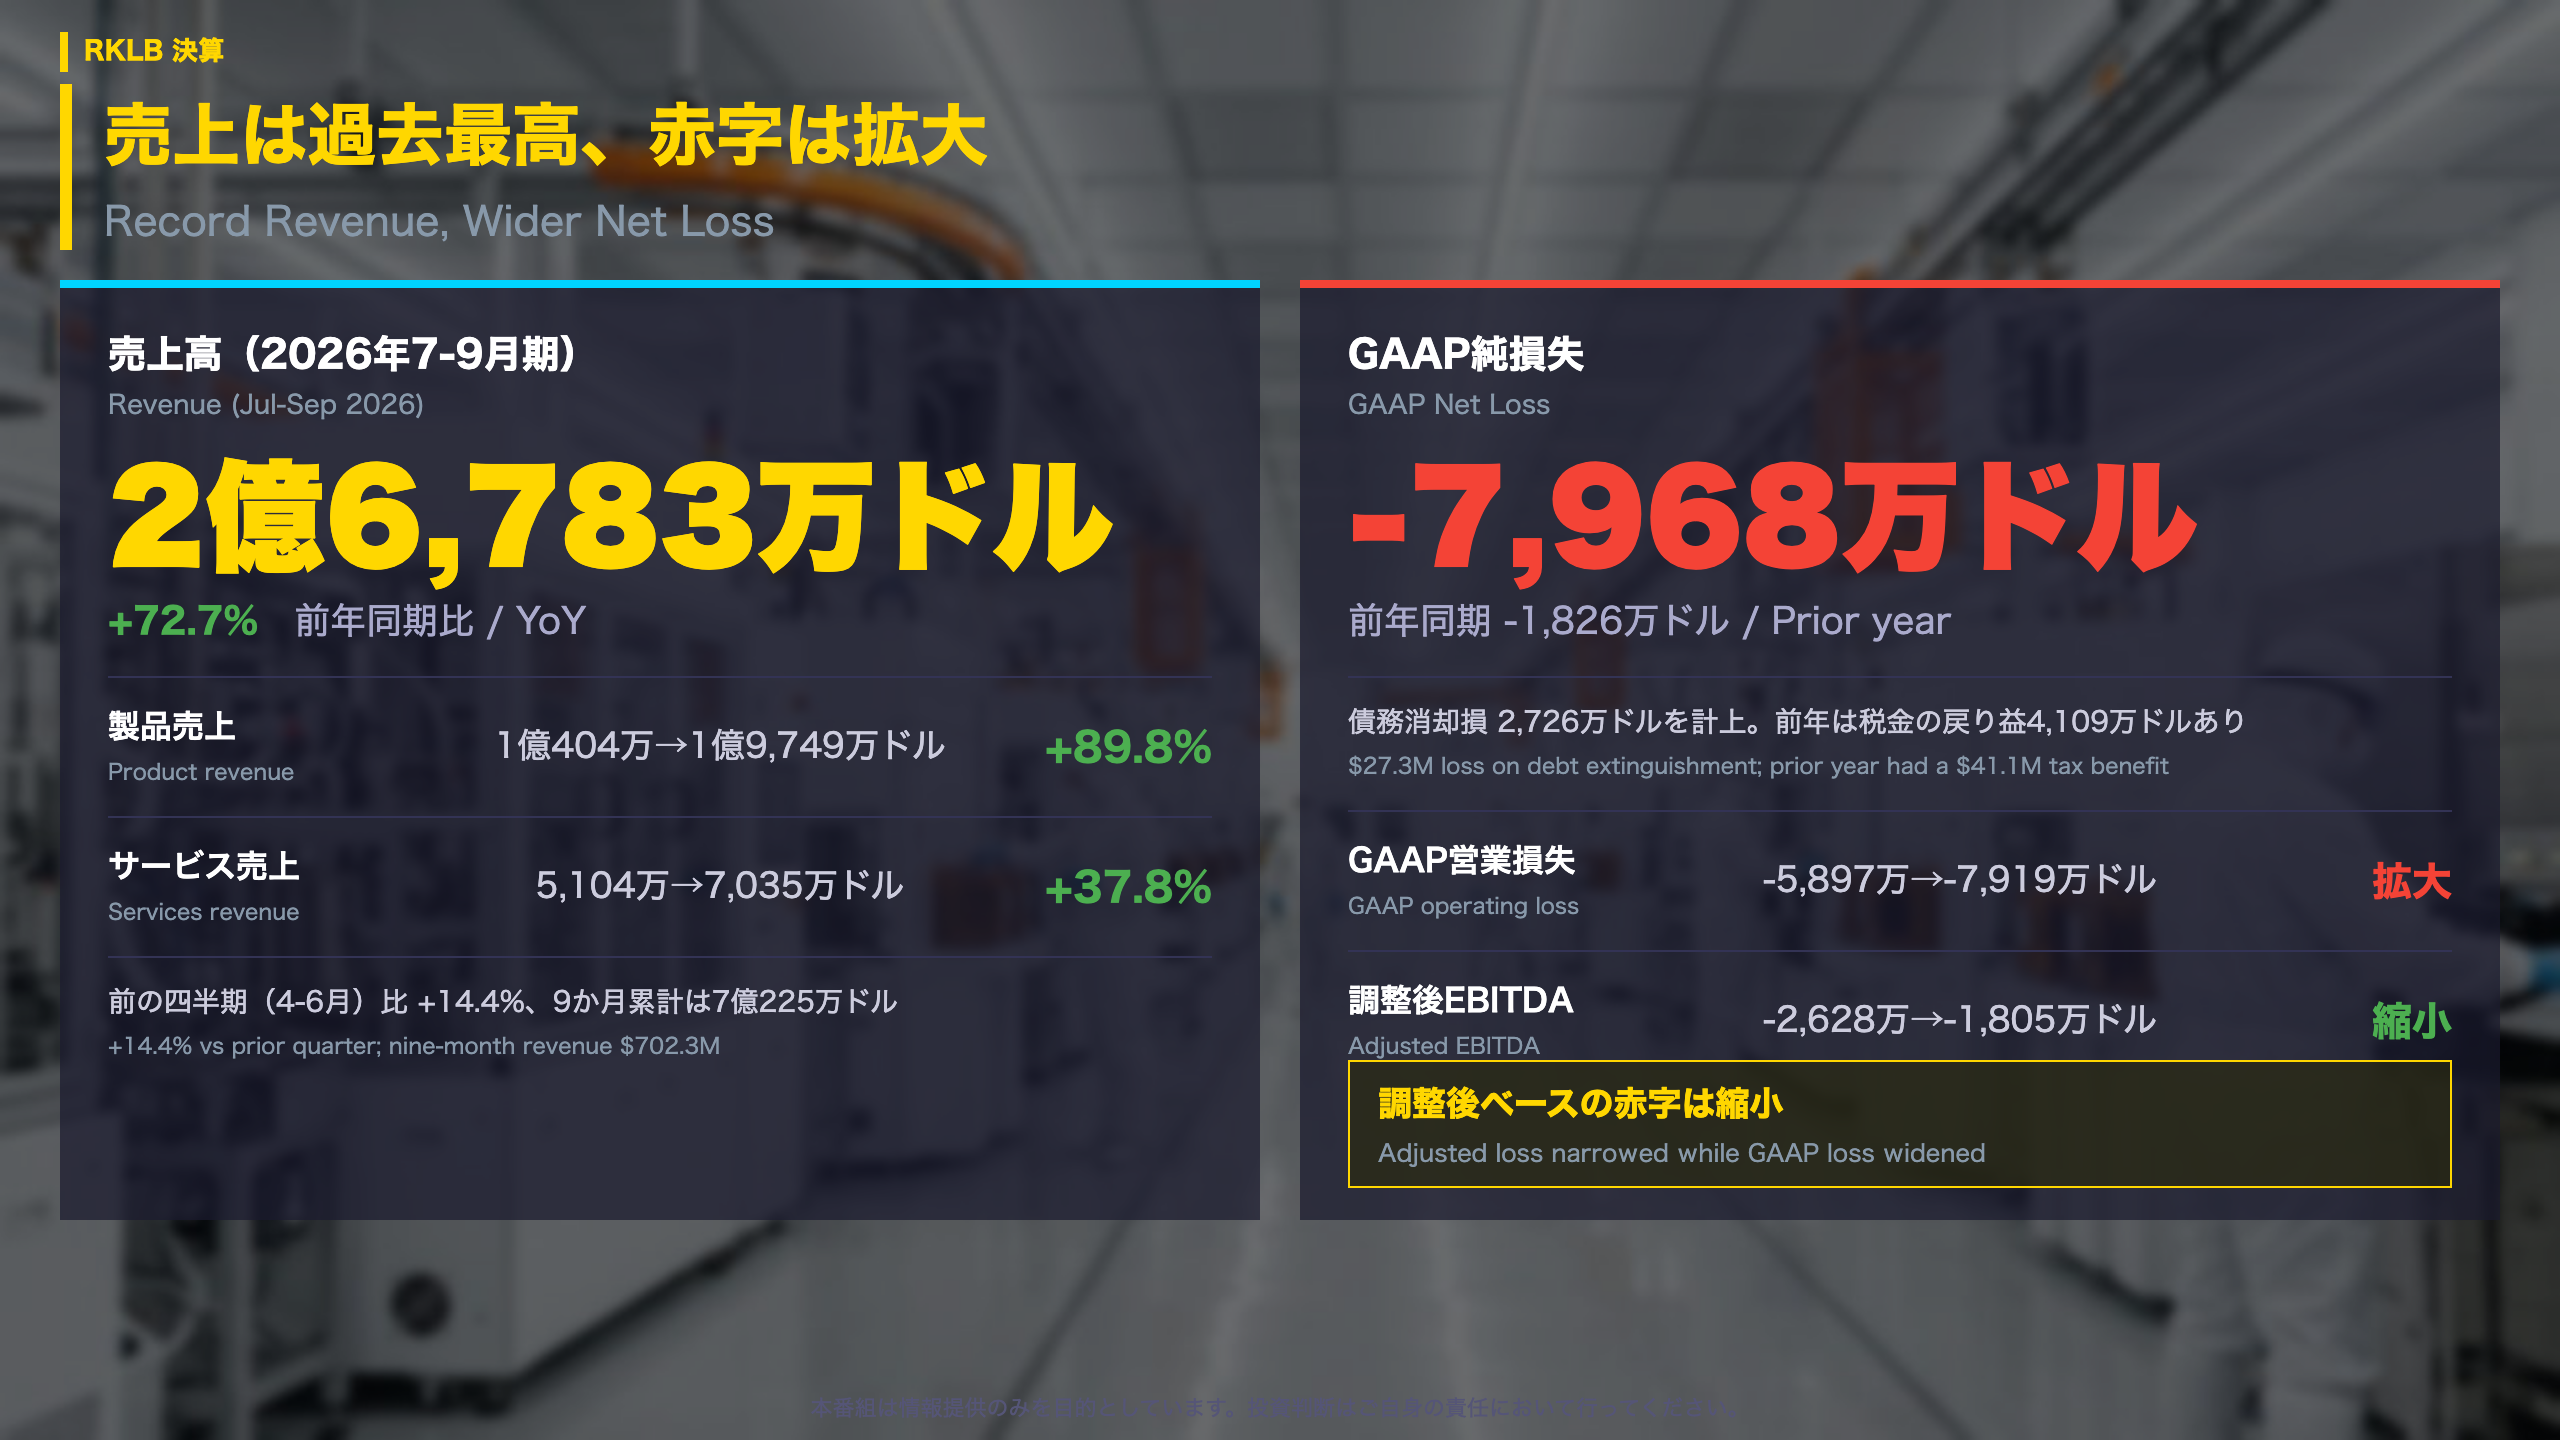
Rocket Lab Q3 2026: record revenue, wider GAAP loss
Rocket Lab Corp, a US company that builds launch vehicles (Electron, and the larger Neutron under development) and spacecraft, reported July-September 2026 results on November 9. Revenue was $267.8 million, up 72.7% from $155.1 million a year earlier. Product revenue rose 89.8% and services 37.8%.
Reading GAAP and adjusted figures together
GAAP net loss was $79.7 million versus $18.3 million a year ago. Two items distort the comparison: the current quarter includes a $27.3 million loss on extinguishment of debt, while the prior-year quarter was helped by a $41.1 million tax benefit. Meanwhile adjusted EBITDA improved from -$26.3 million to -$18.1 million, and adjusted operating loss narrowed from -$33.2 million to -$27.4 million.
Costs and margins
- GAAP operating expenses: $169.3 million, up 45.6%; SG&A includes $21.3 million of transaction-related costs (vs. $5.1 million)
- Product gross margin rose to roughly 32.6% from 30.0%, while services fell to about 36.5% from 51.2% (our calculation)
Two ways to read it
Constructive: sequential revenue growth of 14.4%, shrinking adjusted losses and a positive quarterly operating cash flow (+$7.2 million).
Cautious: nine-month operating cash flow remains negative at -$127.3 million, and the services margin dropped.
The filing does not give the next earnings date; the first check is whether Q4 lands inside guidance.
受注残は過去最高、Neutronの契約が積み上がる
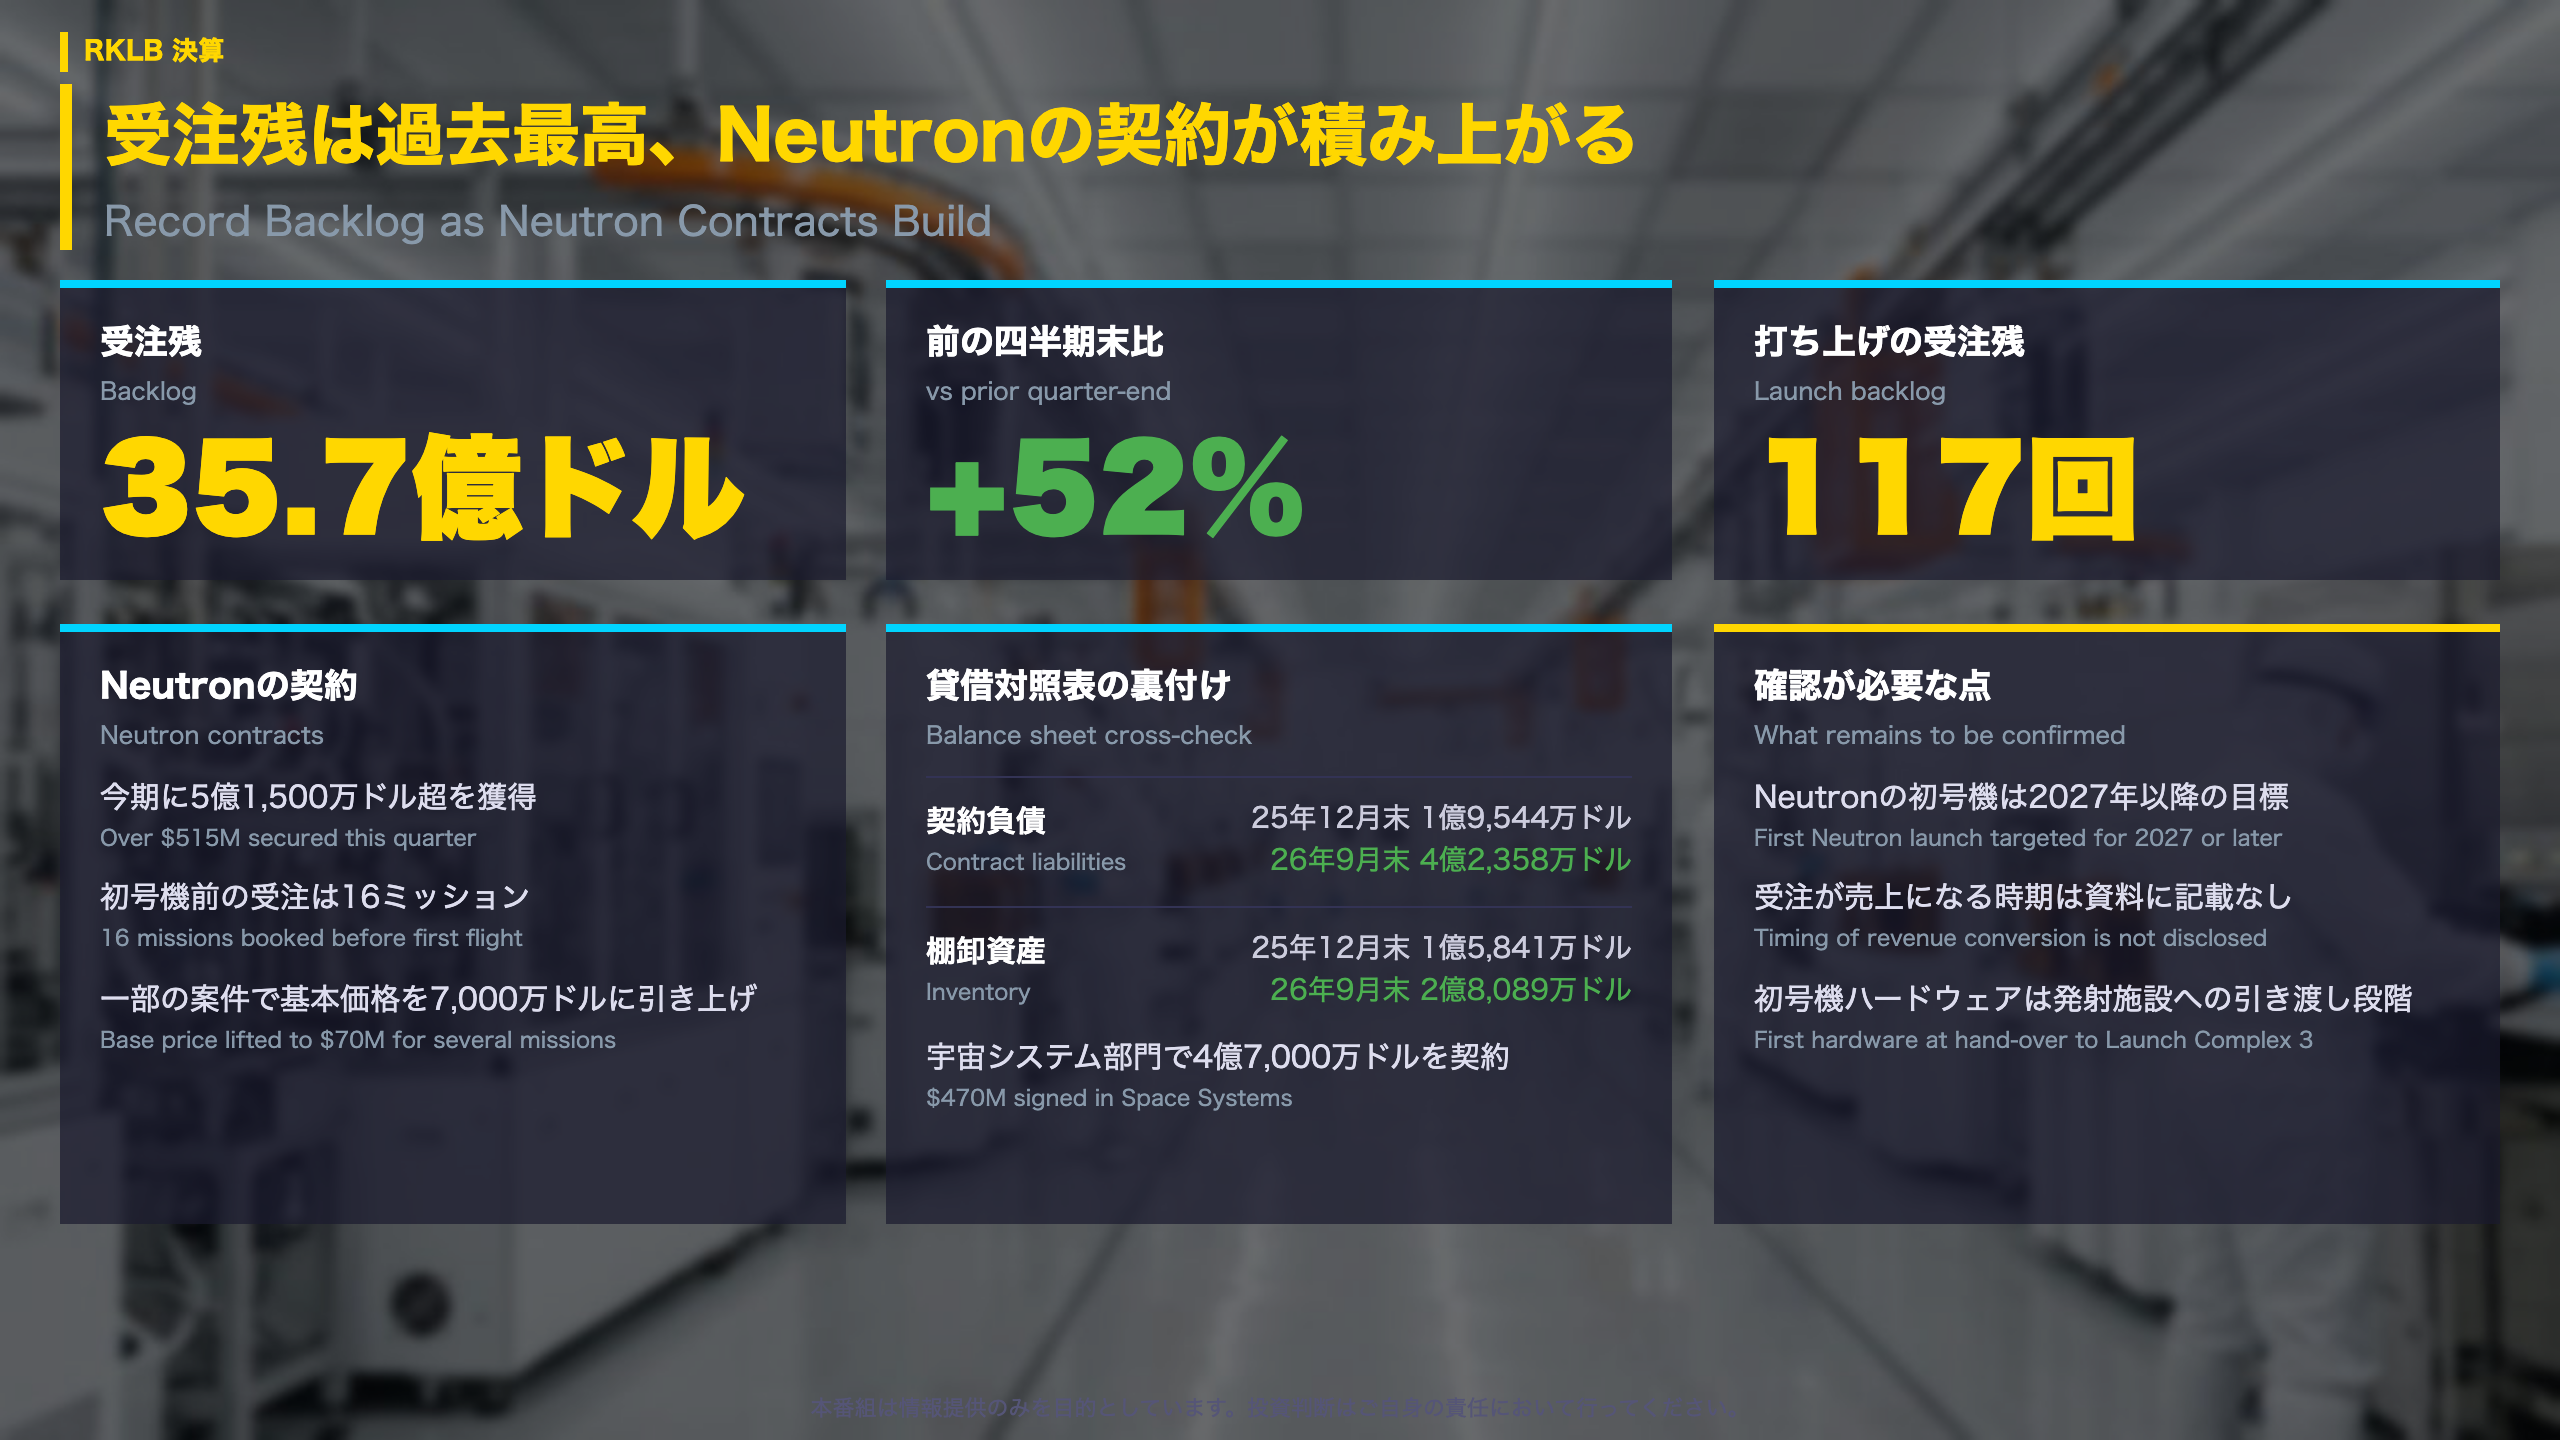
Backlog anatomy: what sits behind the $3.57 billion
Backlog is the value of signed work not yet recognized as revenue, so it is the closest thing in the filing to a view of future sales. Rocket Lab reports it at about $3.57 billion, up roughly $1.2 billion or 52% from the end of the prior quarter.
Key facts from the release
- Launch backlog: a record 117 launches across Electron, HASTE and Neutron
- Neutron: more than $515 million secured this quarter, with 16 missions booked before the first flight
- Pricing: the base launch price was lifted to $70 million for several Neutron missions as industry launch capacity tightens
- Space Systems: $470 million of contracts signed; more than 55 spacecraft in development or production; 12 in-house spacecraft reached orbit this quarter
Balance sheet cross-check
Contract liabilities (customer prepayments and similar items) rose from $195.4 million at end-December 2025 to $423.6 million at end-September 2026, and inventory from $158.4 million to $280.9 million. Both are consistent with a growing order book being turned into hardware.
Two readings
Constructive: price increases plus sizable contracts suggest firm demand.
Cautious: Neutron’s first launch is targeted for 2027 or later, and the filing does not say when backlog converts to revenue. The first Neutron hardware is at the hand-over stage to Launch Complex 3.
This is an independent summary of company disclosures, not a forecast.
第4四半期の見通しと資金面
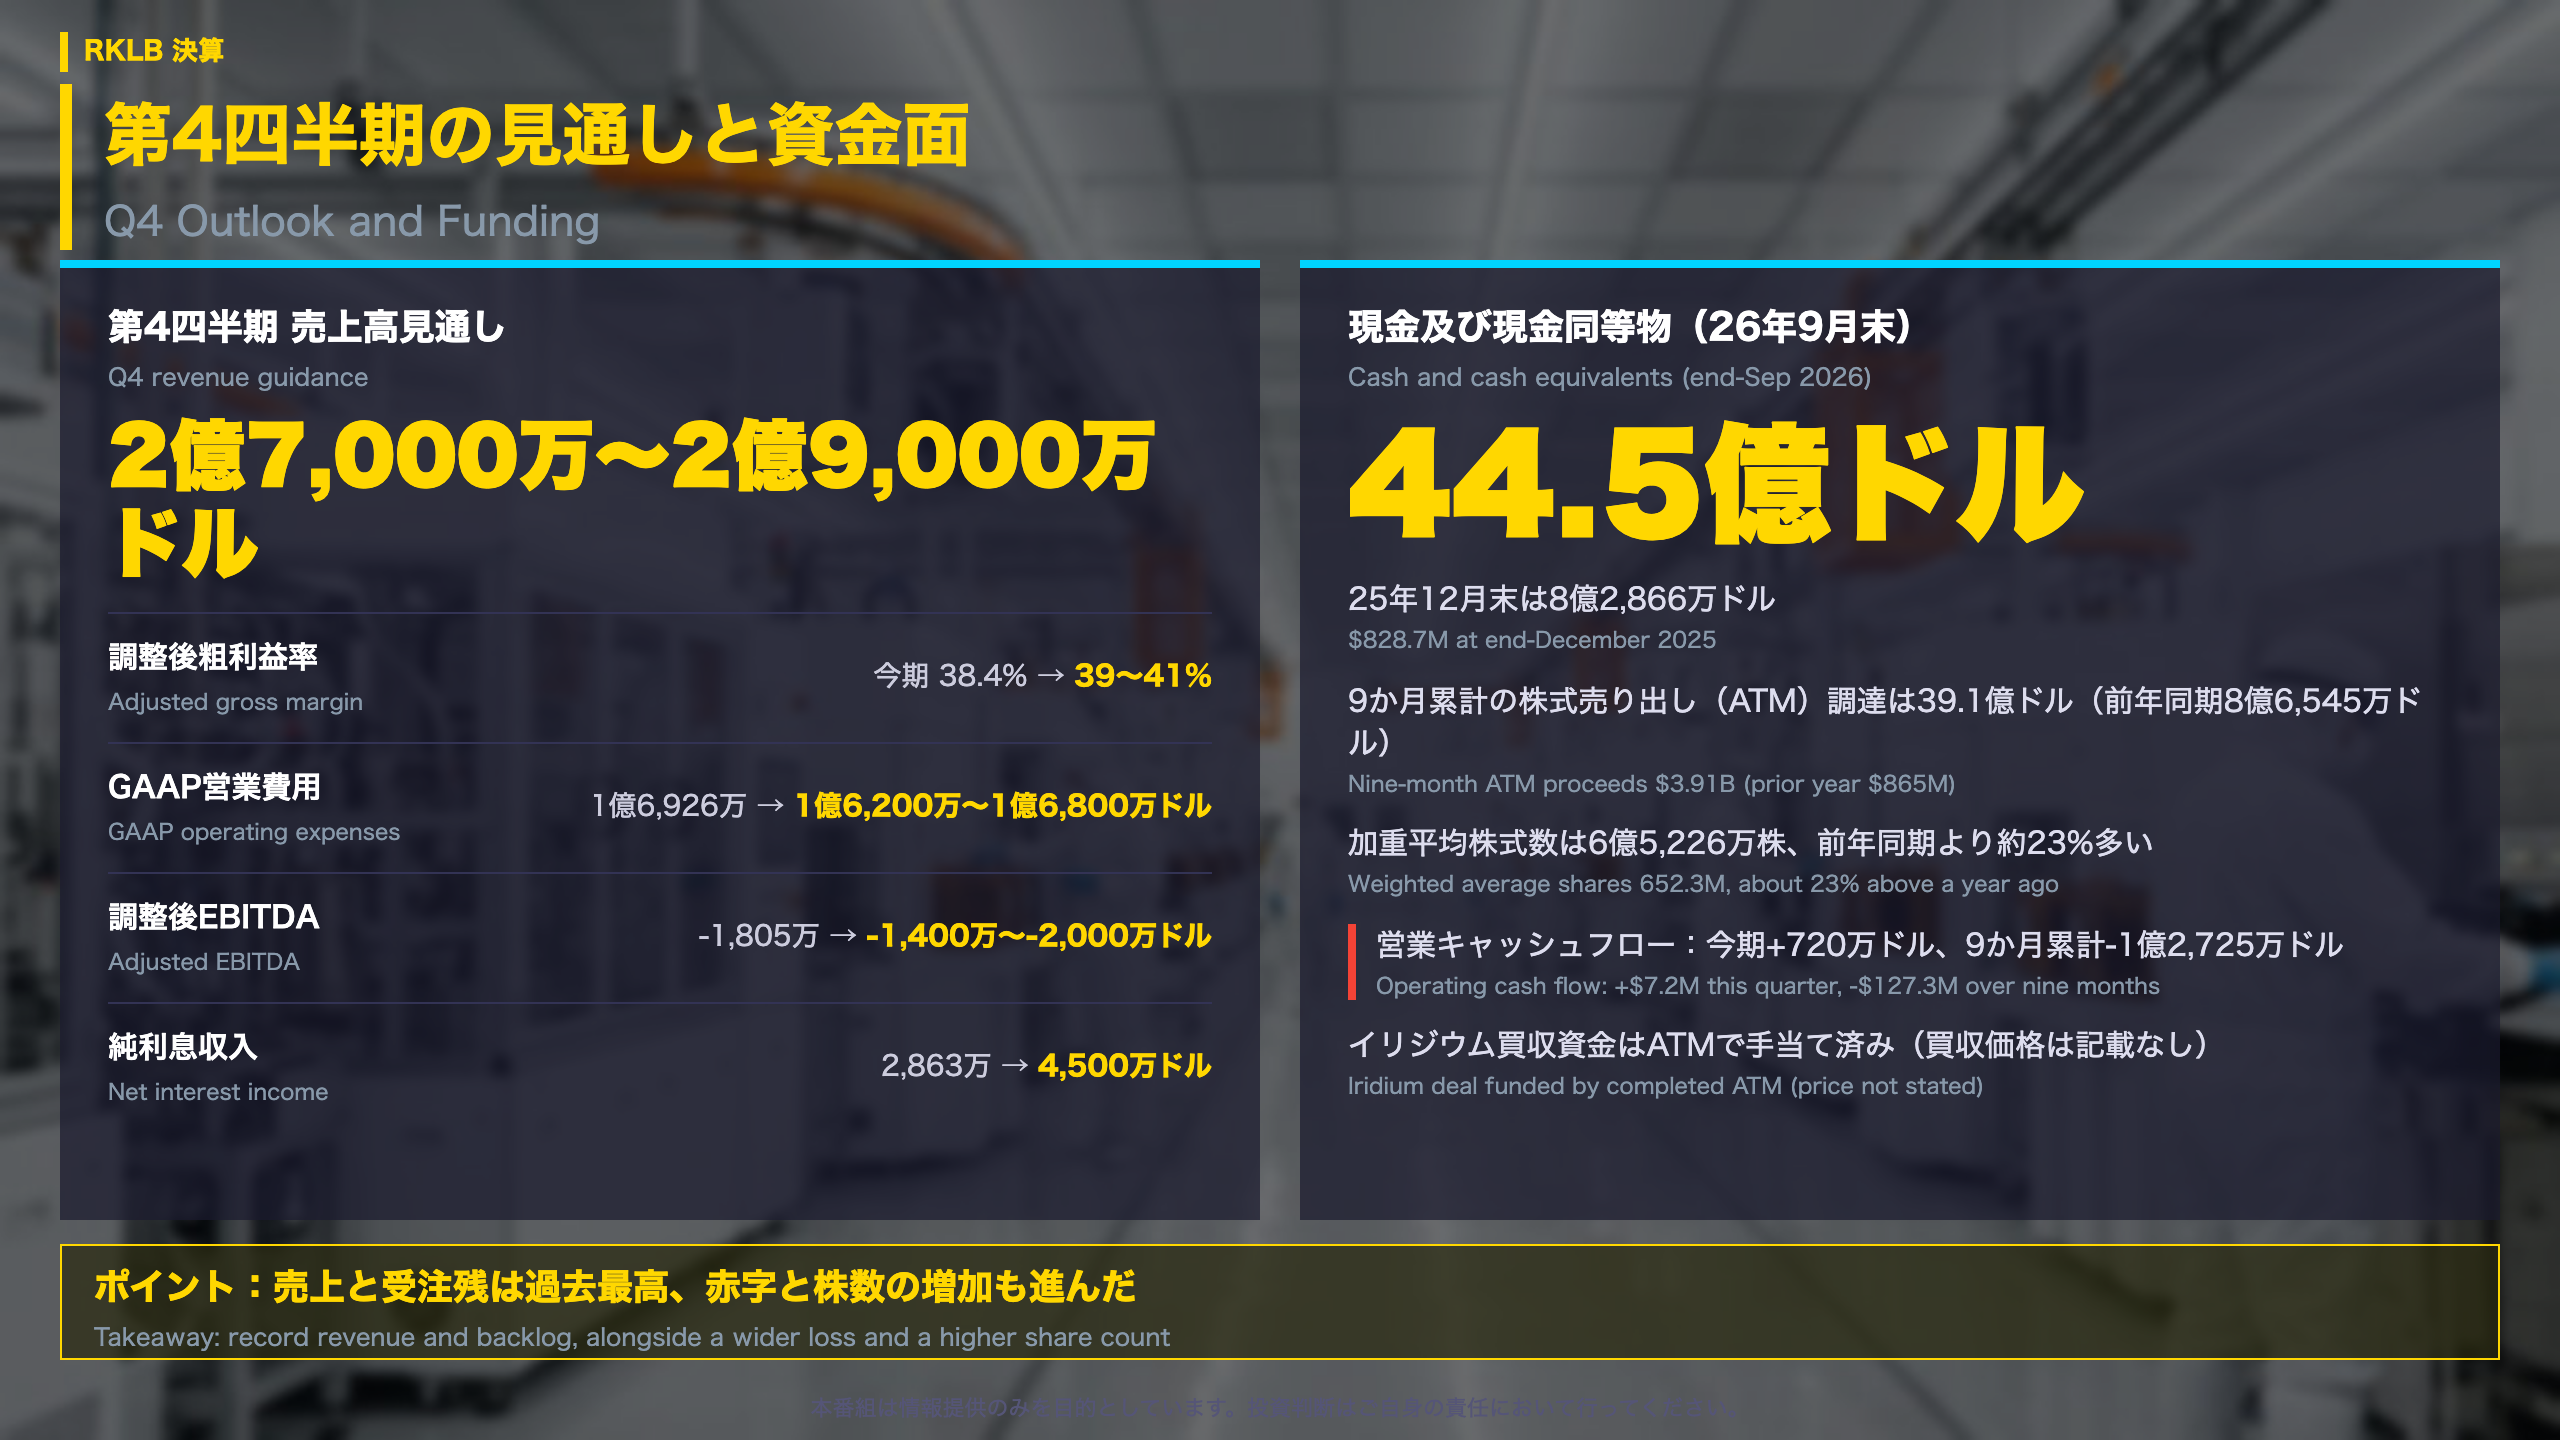
Q4 guidance and the funding picture
Rocket Lab guided fourth-quarter revenue to $270-290 million. Against the $267.8 million just reported, that is +0.8% to +8.3% sequentially, a calmer pace than the +14.4% delivered in Q3. Guidance also points to GAAP gross margin of 34-36% (about 33.6% this quarter by our calculation), adjusted gross margin of 39-41% (38.4%), and adjusted EBITDA of -$14 million to -$20 million (-$18.1 million).
How the company is financing growth
An at-the-market (ATM) program lets a listed company sell new shares gradually into the market. Rocket Lab raised $3.91 billion this way over nine months, versus $865 million a year earlier, lifting cash to $4.45 billion from $828.7 million at end-2025. It also cut convertible notes from $152.4 million to $1.3 million, booking a $27.3 million debt-extinguishment loss.
The dilution side
Weighted average shares were 652.3 million, about 23% above 528.7 million a year ago, and Q4 is guided to 681 million including roughly 41 million preferred shares. Per-share metrics are therefore affected even if total profit or loss is unchanged.
Iridium
The company says the acquisition is funded by the completed ATM and that Iridium’s lenders and shareholders approved the deal. The price is not stated in the source material.
Balanced view
Guidance implies growth, better margins and a smaller adjusted EBITDA loss. Against that, nine-month operating cash flow is -$127.3 million, so growth is still being underwritten by capital raising. The next earnings date is not disclosed.
売上の中身と通期見通し
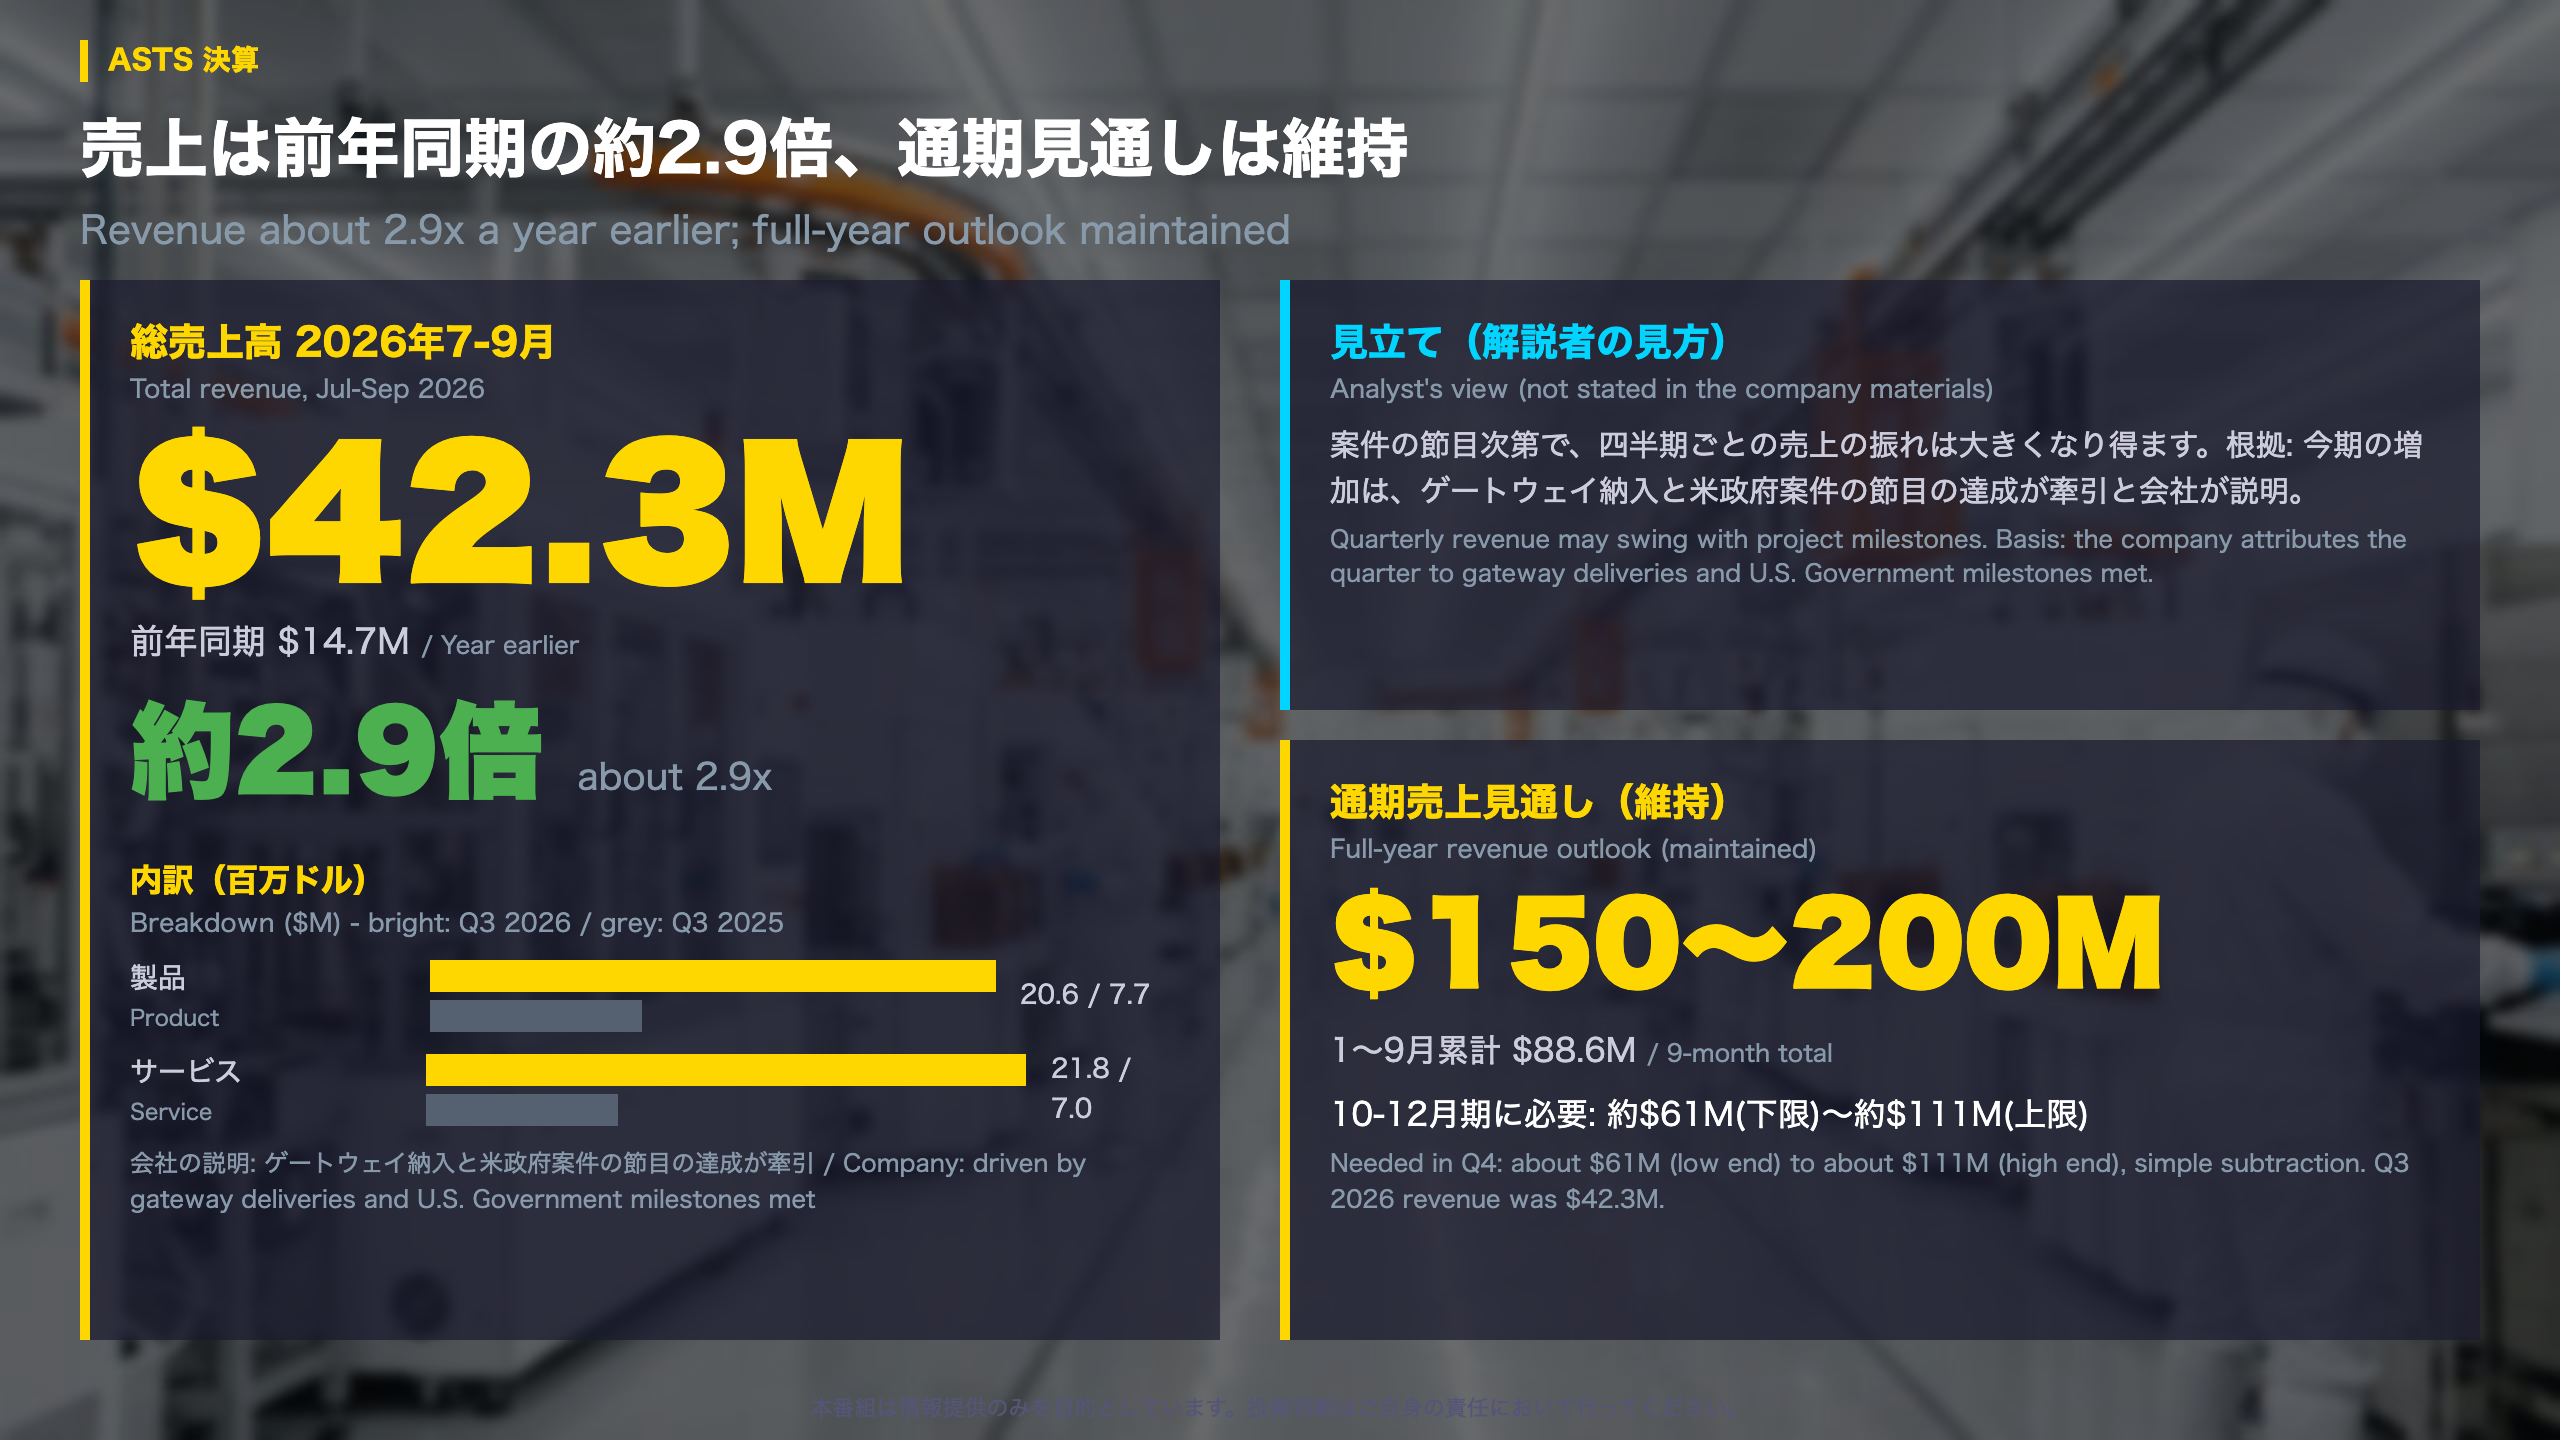
AST SpaceMobile Q3: Revenue Roughly 2.9x, Guidance Held
Who they are: AST SpaceMobile is building a satellite-based communications network. Its July-September 2026 results were released on November 9, 2026, together with a business update.
The headline numbers (USD millions)
| Item | Q3 2026 | Q3 2025 | 9M 2026 | 9M 2025 |
|---|---|---|---|---|
| Product | 20.6 | 7.7 | 58.4 | 8.1 |
| Service | 21.8 | 7.0 | 30.2 | 8.5 |
| Total | 42.3 | 14.7 | 88.6 | 16.6 |
Product and service revenue are almost equal in size this quarter. In the company’s words, revenue was driven by gateway deliveries and U.S. Government milestones met.
Long-run context
Quarterly revenue in 2024 was only 0.5, 0.9 and 1.1 million dollars (Q1 to Q3). This quarter is roughly 38 times the Q3 2024 level.
Working capital is growing with sales
Receivables rose to 104.1 million (37.7 at end-2025), inventory to 79.0 million (12.0), and non-current contract liabilities to 252.1 million (207.1).
Guidance arithmetic
The company kept full-year revenue guidance at 150 to 200 million dollars and cites upside from recent contract signatures. Against 88.6 million booked in nine months, the low end needs about 61 million in Q4 and the high end about 111 million. The materials do not say when a roughly 100 million dollar U.S. Space Force contract (SB-AMTI) will contribute.
Two readings
- Constructive: 16 U.S. government programs and agreements with more than 60 mobile operators widen the revenue base.
- Cautious: sales tied to deliveries and milestones can be lumpy from quarter to quarter. This is our interpretation, not a statement in the company’s materials.
What to watch: the Q4 revenue figure relative to the amounts above.
赤字の中身と資金
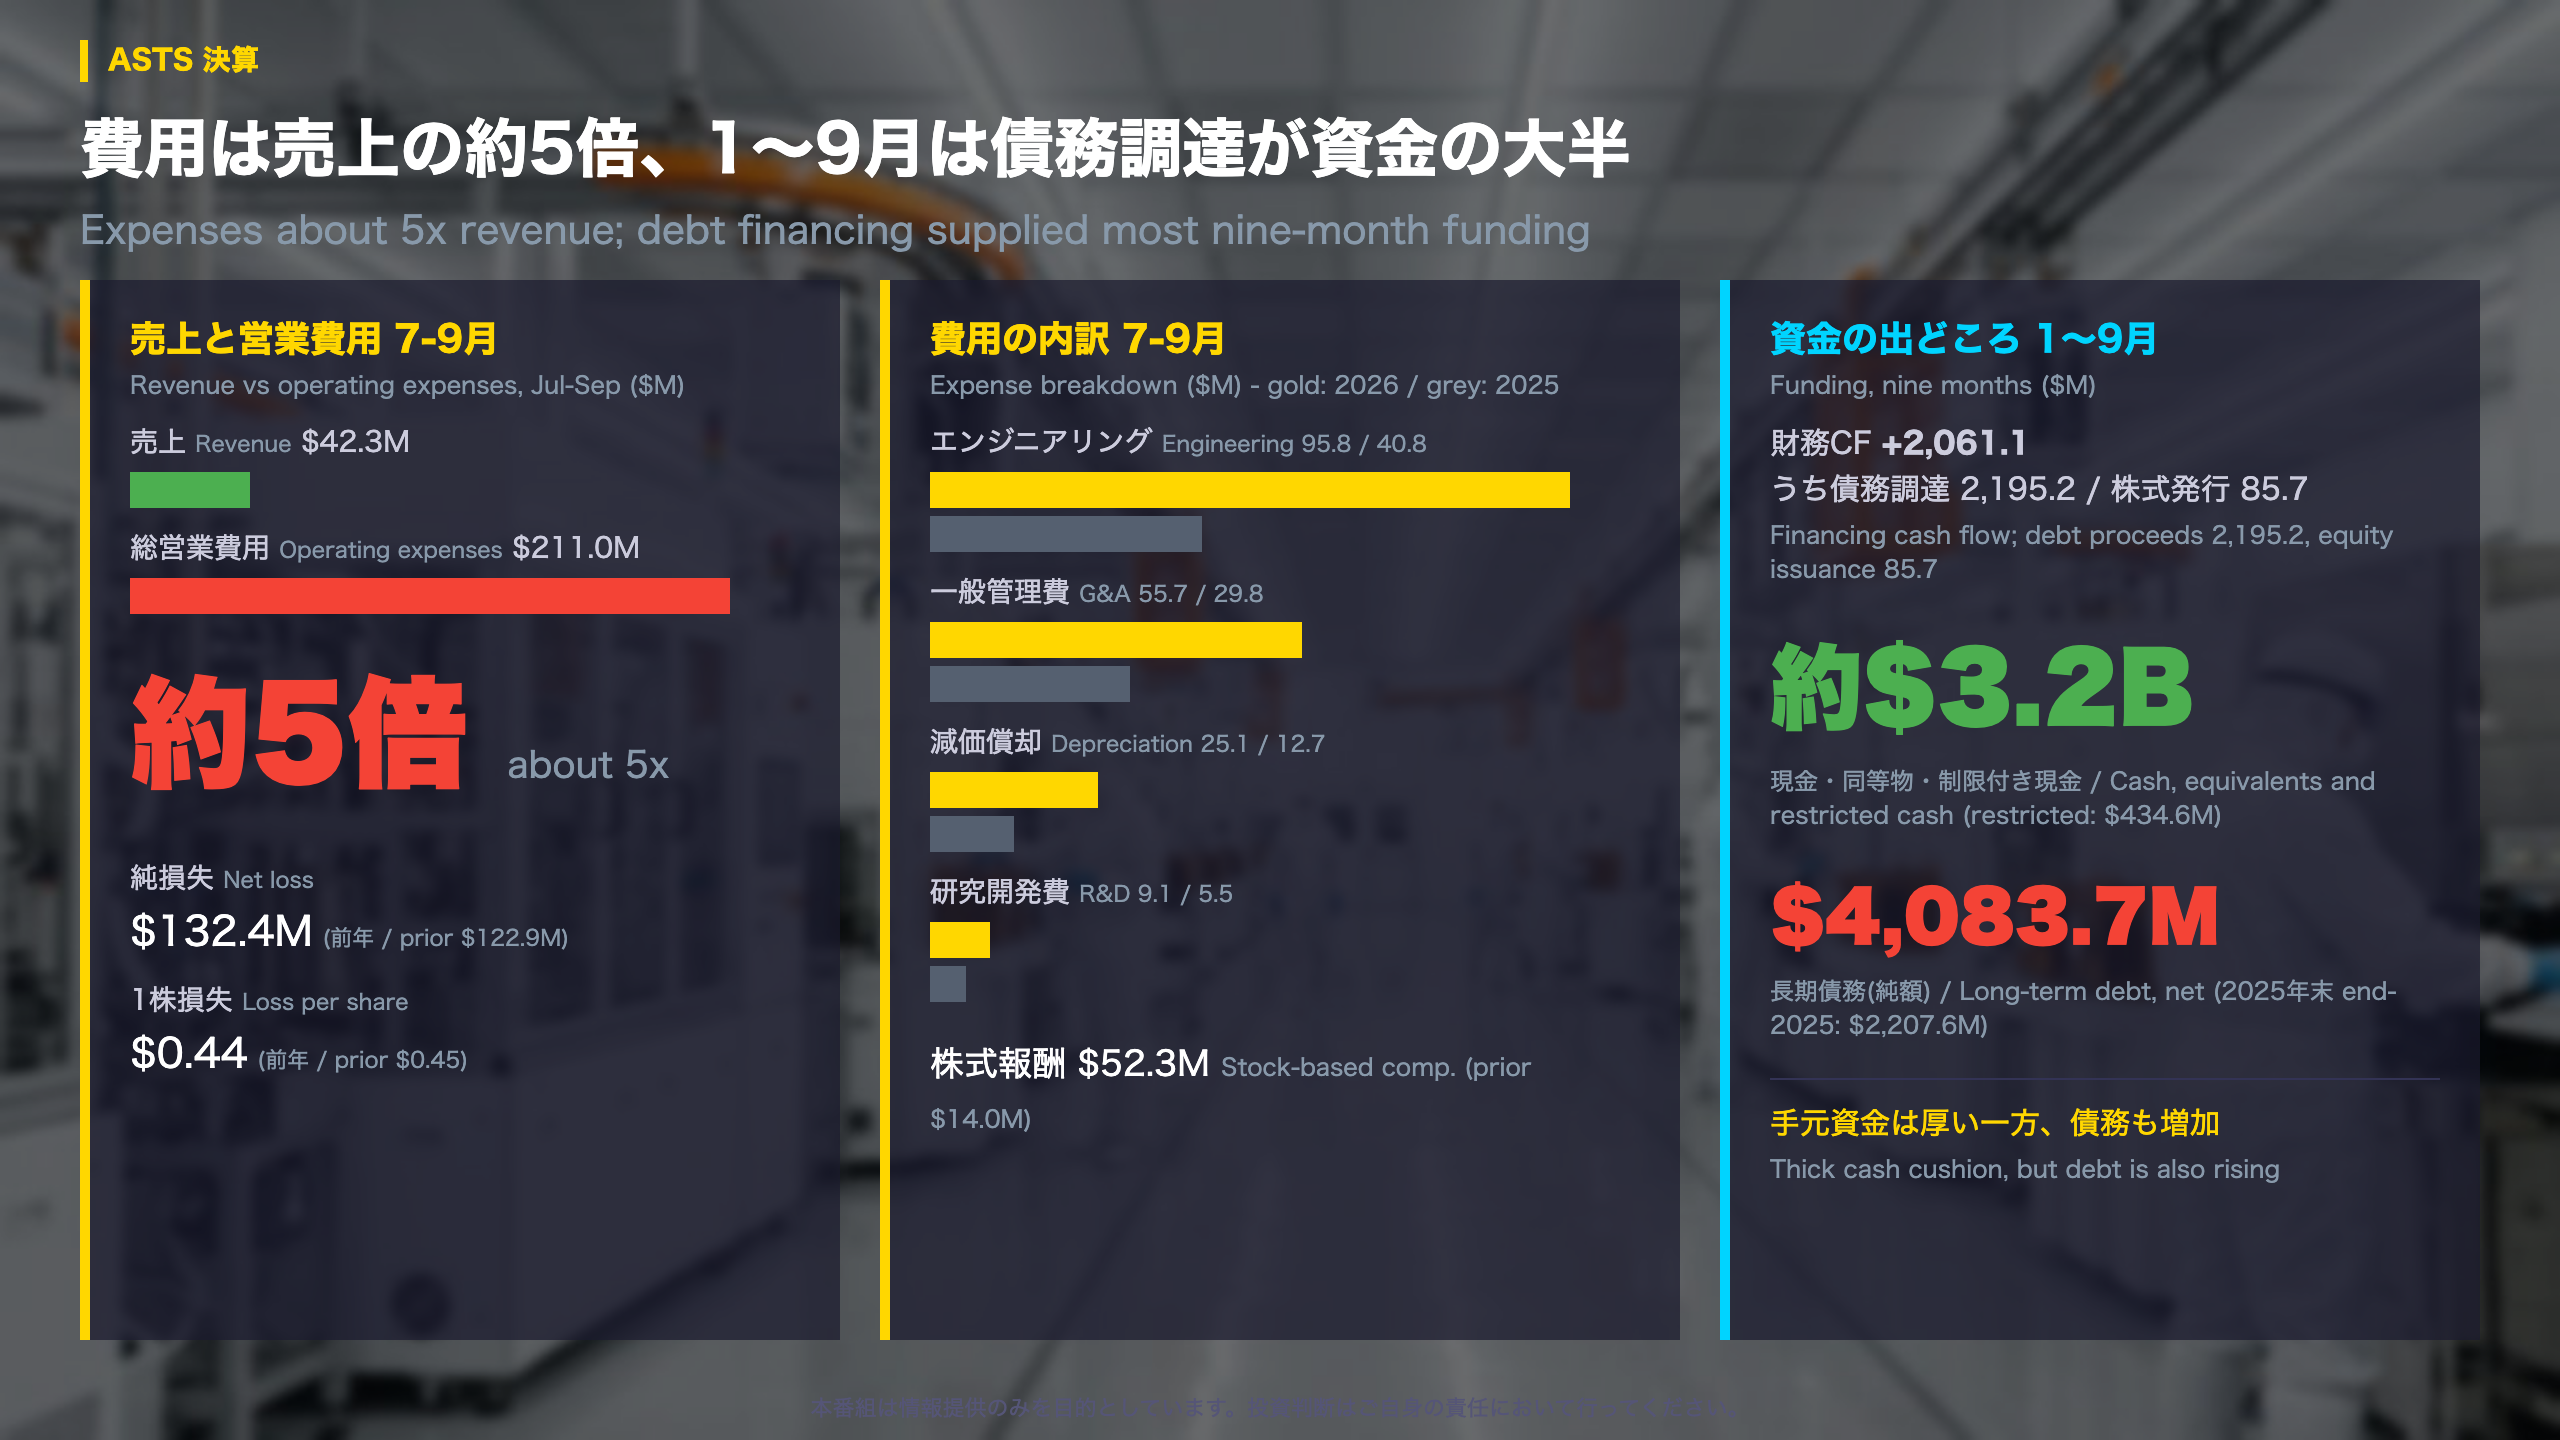
AST SpaceMobile Q3: Anatomy of the Loss and How It Is Funded
Where the money goes (USD millions)
| Item | Q3 2026 | Q3 2025 |
|---|---|---|
| Engineering | 95.8 | 40.8 |
| General and administrative | 55.7 | 29.8 |
| Depreciation | 25.1 | 12.7 |
| Research and development | 9.1 | 5.5 |
| Total operating expenses | 211.0 | 94.4 |
Stock-based compensation was 52.3 million (about 14.0 million a year earlier). Depreciation and stock compensation together total 77.4 million. Adjusted operating expenses, which exclude those items and an involuntary conversion loss, were 133.6 million, about double last year’s 67.7 million.
Net loss versus per-share loss
Net loss attributable to common shareholders was 132.4 million (122.9 million a year earlier). Loss per share was 0.44 dollars versus 0.45, which may partly reflect a larger share count (about 300 million weighted average shares versus about 273 million for the nine-month periods).
Nine-month cash flow
- Operating cash flow: -314.5 million (-136.5 a year earlier)
- Purchases of property and equipment: -1,154.2 million
- Financing cash flow: +2,061.1 million, of which debt proceeds were 2,195.2 million and equity issuance 85.7 million
- Cash interest paid: 40.9 million (4.2 a year earlier)
Balance sheet
The company describes a fortress balance sheet with about 3.2 billion dollars of cash, cash equivalents and restricted cash (of which 434.6 million is restricted). Long-term debt, net, reached 4,083.7 million versus 2,207.6 million at end-2025, while shareholders’ equity slipped to 2,162.6 million from 2,392.3 million.
Two readings
- Cautious: rising debt and a larger interest bill.
- Constructive: the company points to a pipeline of roughly 1.2 billion dollars in U.S. quasi-government financing and about 1 billion dollars tied to Japan’s J-LEO program, involving Japan’s Ministry of Internal Affairs and Communications and Rakuten.
The materials do not provide an adjusted EPS figure.
次の確認点:月産ペースと打ち上げ
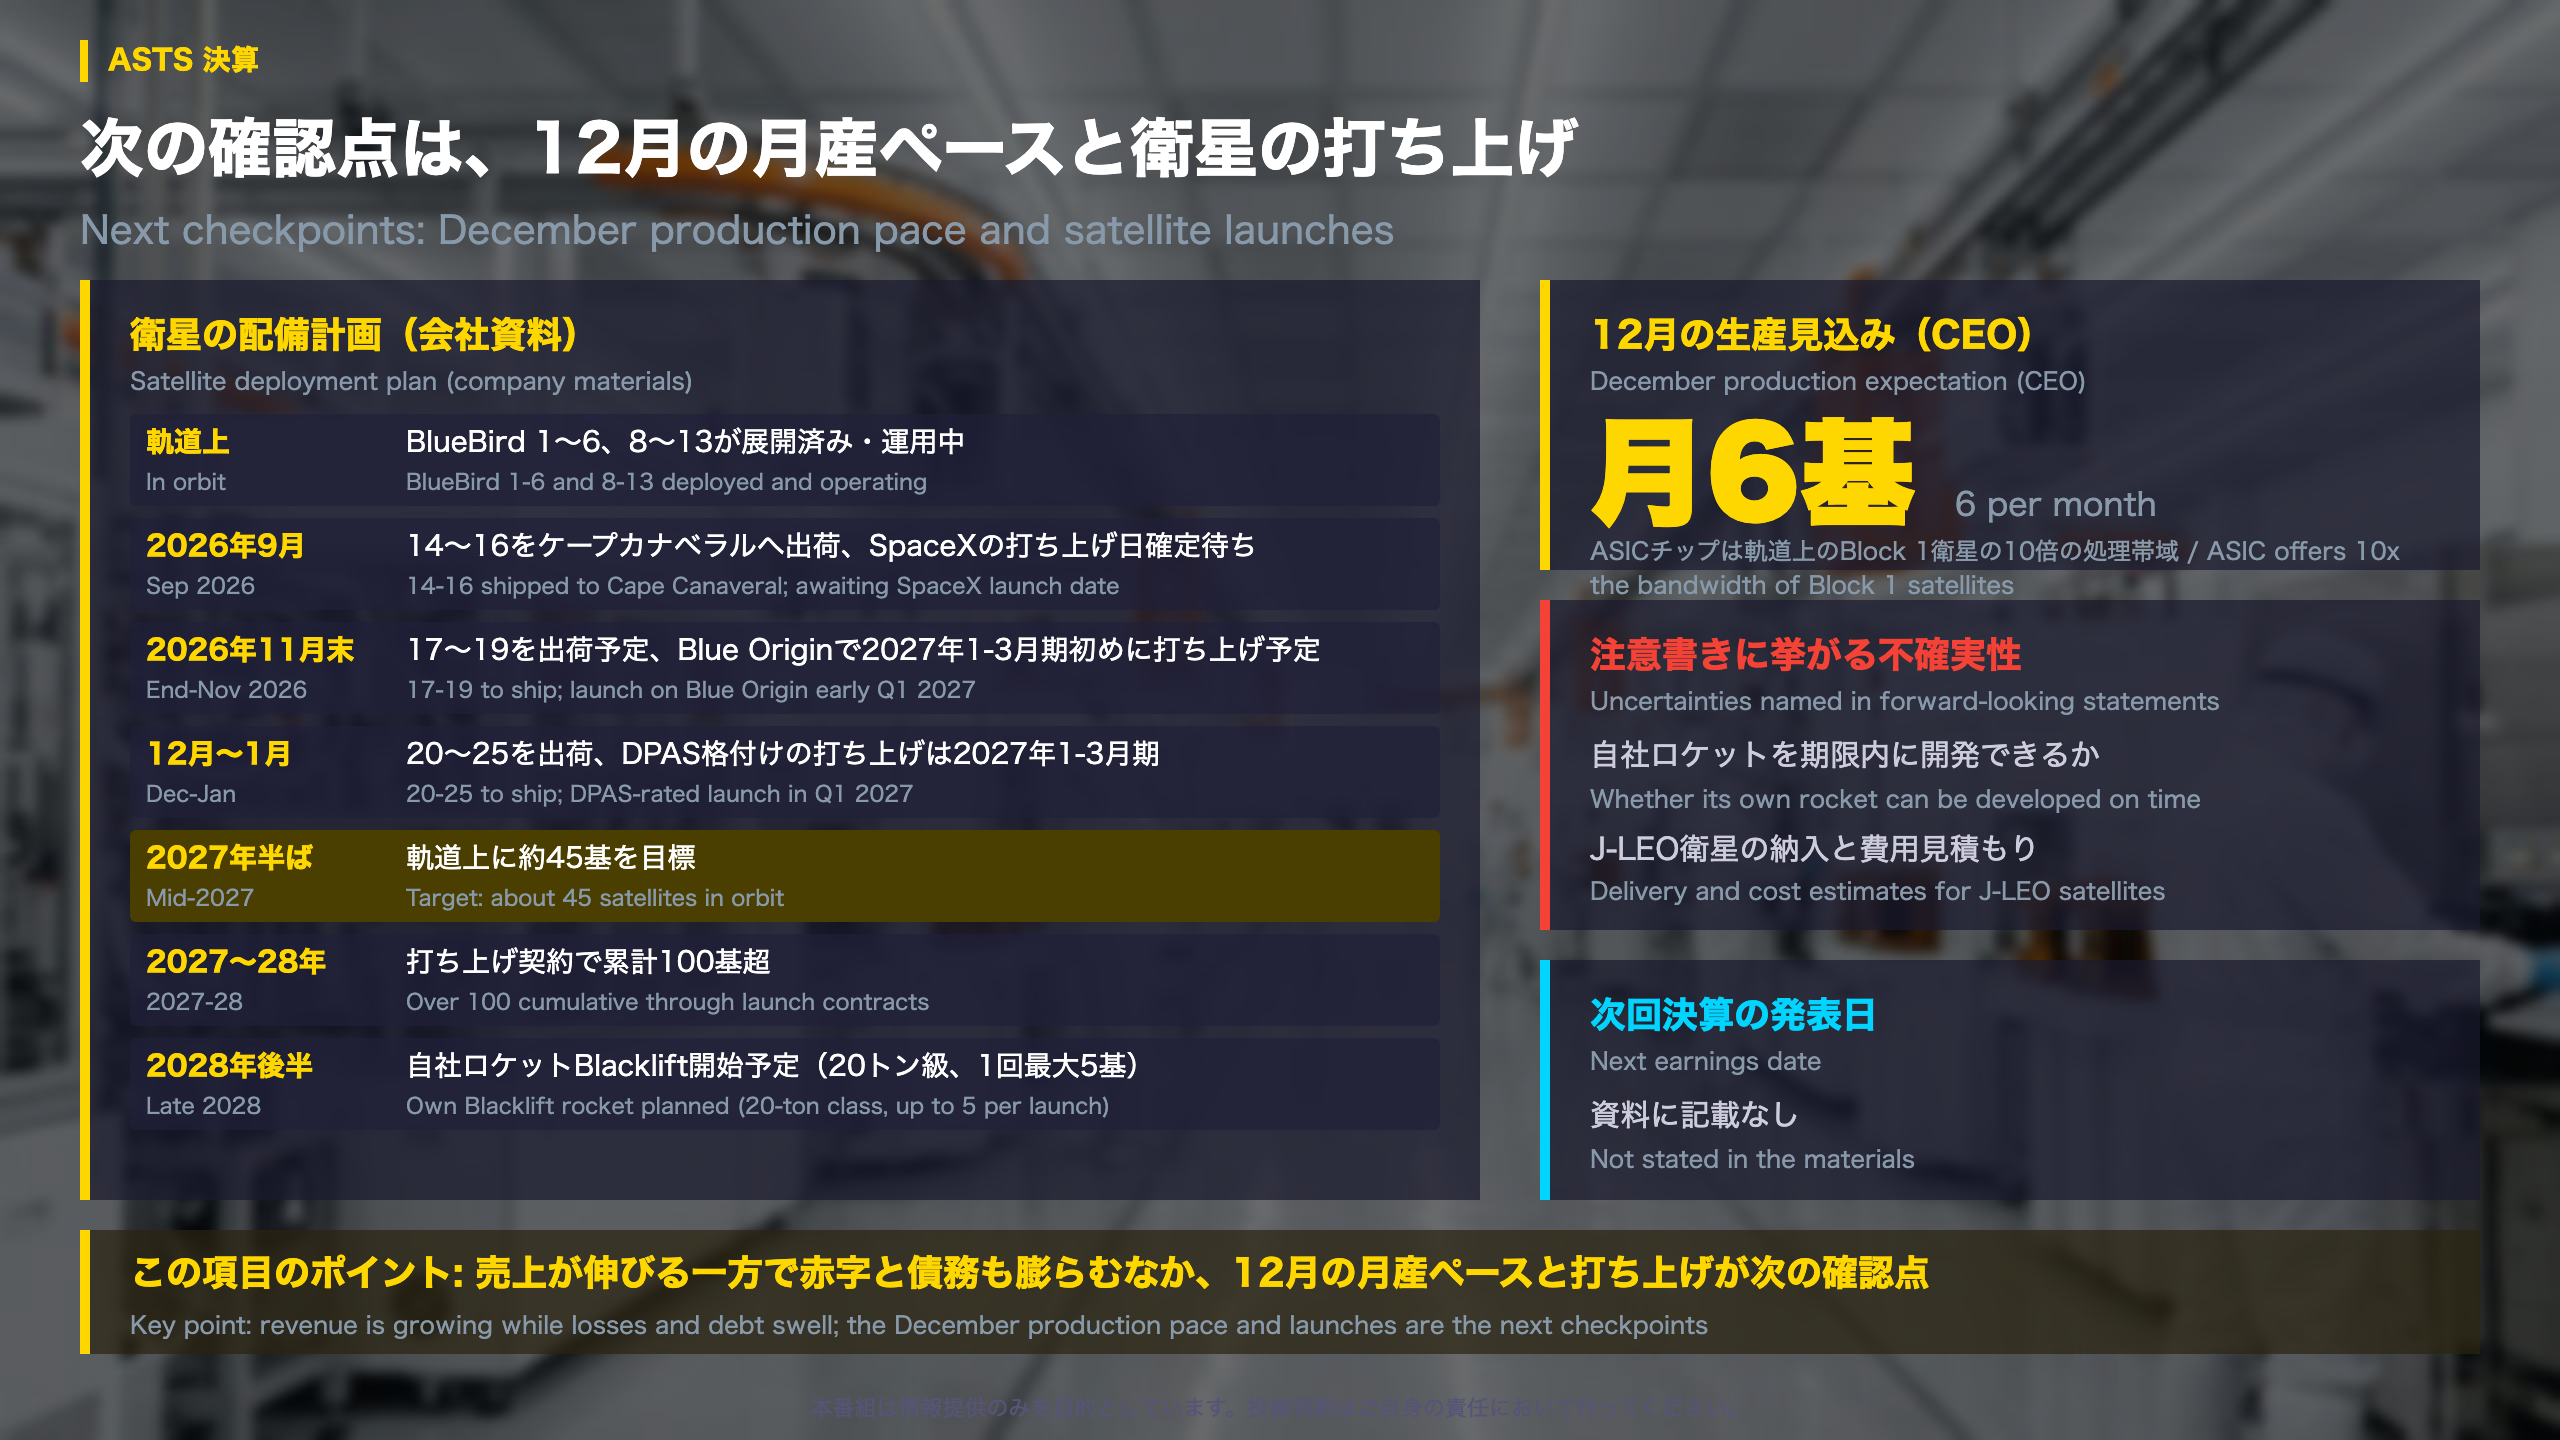
AST SpaceMobile: What to Check Next
Deployment roadmap (company materials)
| Timing | Milestone |
|---|---|
| In orbit | BlueBird 1-6 and 8-13 deployed and operating |
| Sep 2026 | BlueBird 14-16 shipped to Cape Canaveral; awaiting SpaceX launch date |
| End-Nov 2026 | BlueBird 17-19 to ship; launch on Blue Origin planned early Q1 2027 |
| Dec-Jan | BlueBird 20-25 to ship; DPAS-rated launch in Q1 2027 |
| Mid-2027 | Target of about 45 satellites in orbit |
| 2027-28 | Over 100 cumulative via launch contracts |
| Late 2028 | Own Blacklift rocket (20-ton class, up to 5 satellites per launch) planned |
Why the ASIC matters
The CEO said the company expects a production rate of six ASIC satellites per month in December. The ASIC chip offers 10 times the processing bandwidth of the Block 1 satellites now in orbit. Full adoption begins with BlueBird 34, pulled forward from the original plan of BlueBird 50, and two Texas facilities are running at full capacity.
Funding support cited
The company points to about 1 billion dollars tied to the J-LEO contract (involving Japan’s Ministry of Internal Affairs and Communications and Rakuten) and a pipeline of roughly 1.2 billion dollars in U.S. quasi-government financing for 2027.
Risks named in the filing language
The forward-looking statements list uncertainties including completion of the proposed transaction with Firefly Aerospace, developing its own rocket on schedule, and delivery and cost estimates for the J-LEO satellites.
What can be verified next
The next earnings date is not stated. Observable milestones, in order: the December monthly production pace, the launch date for BlueBird 14-16, and the start of intermittent service by year-end.
Balanced view: the production target was pulled forward and funding pipelines exist, while some launches still await dates and several items remain uncertain.
7-9月期の全体像:売上急拡大と赤字の重さ
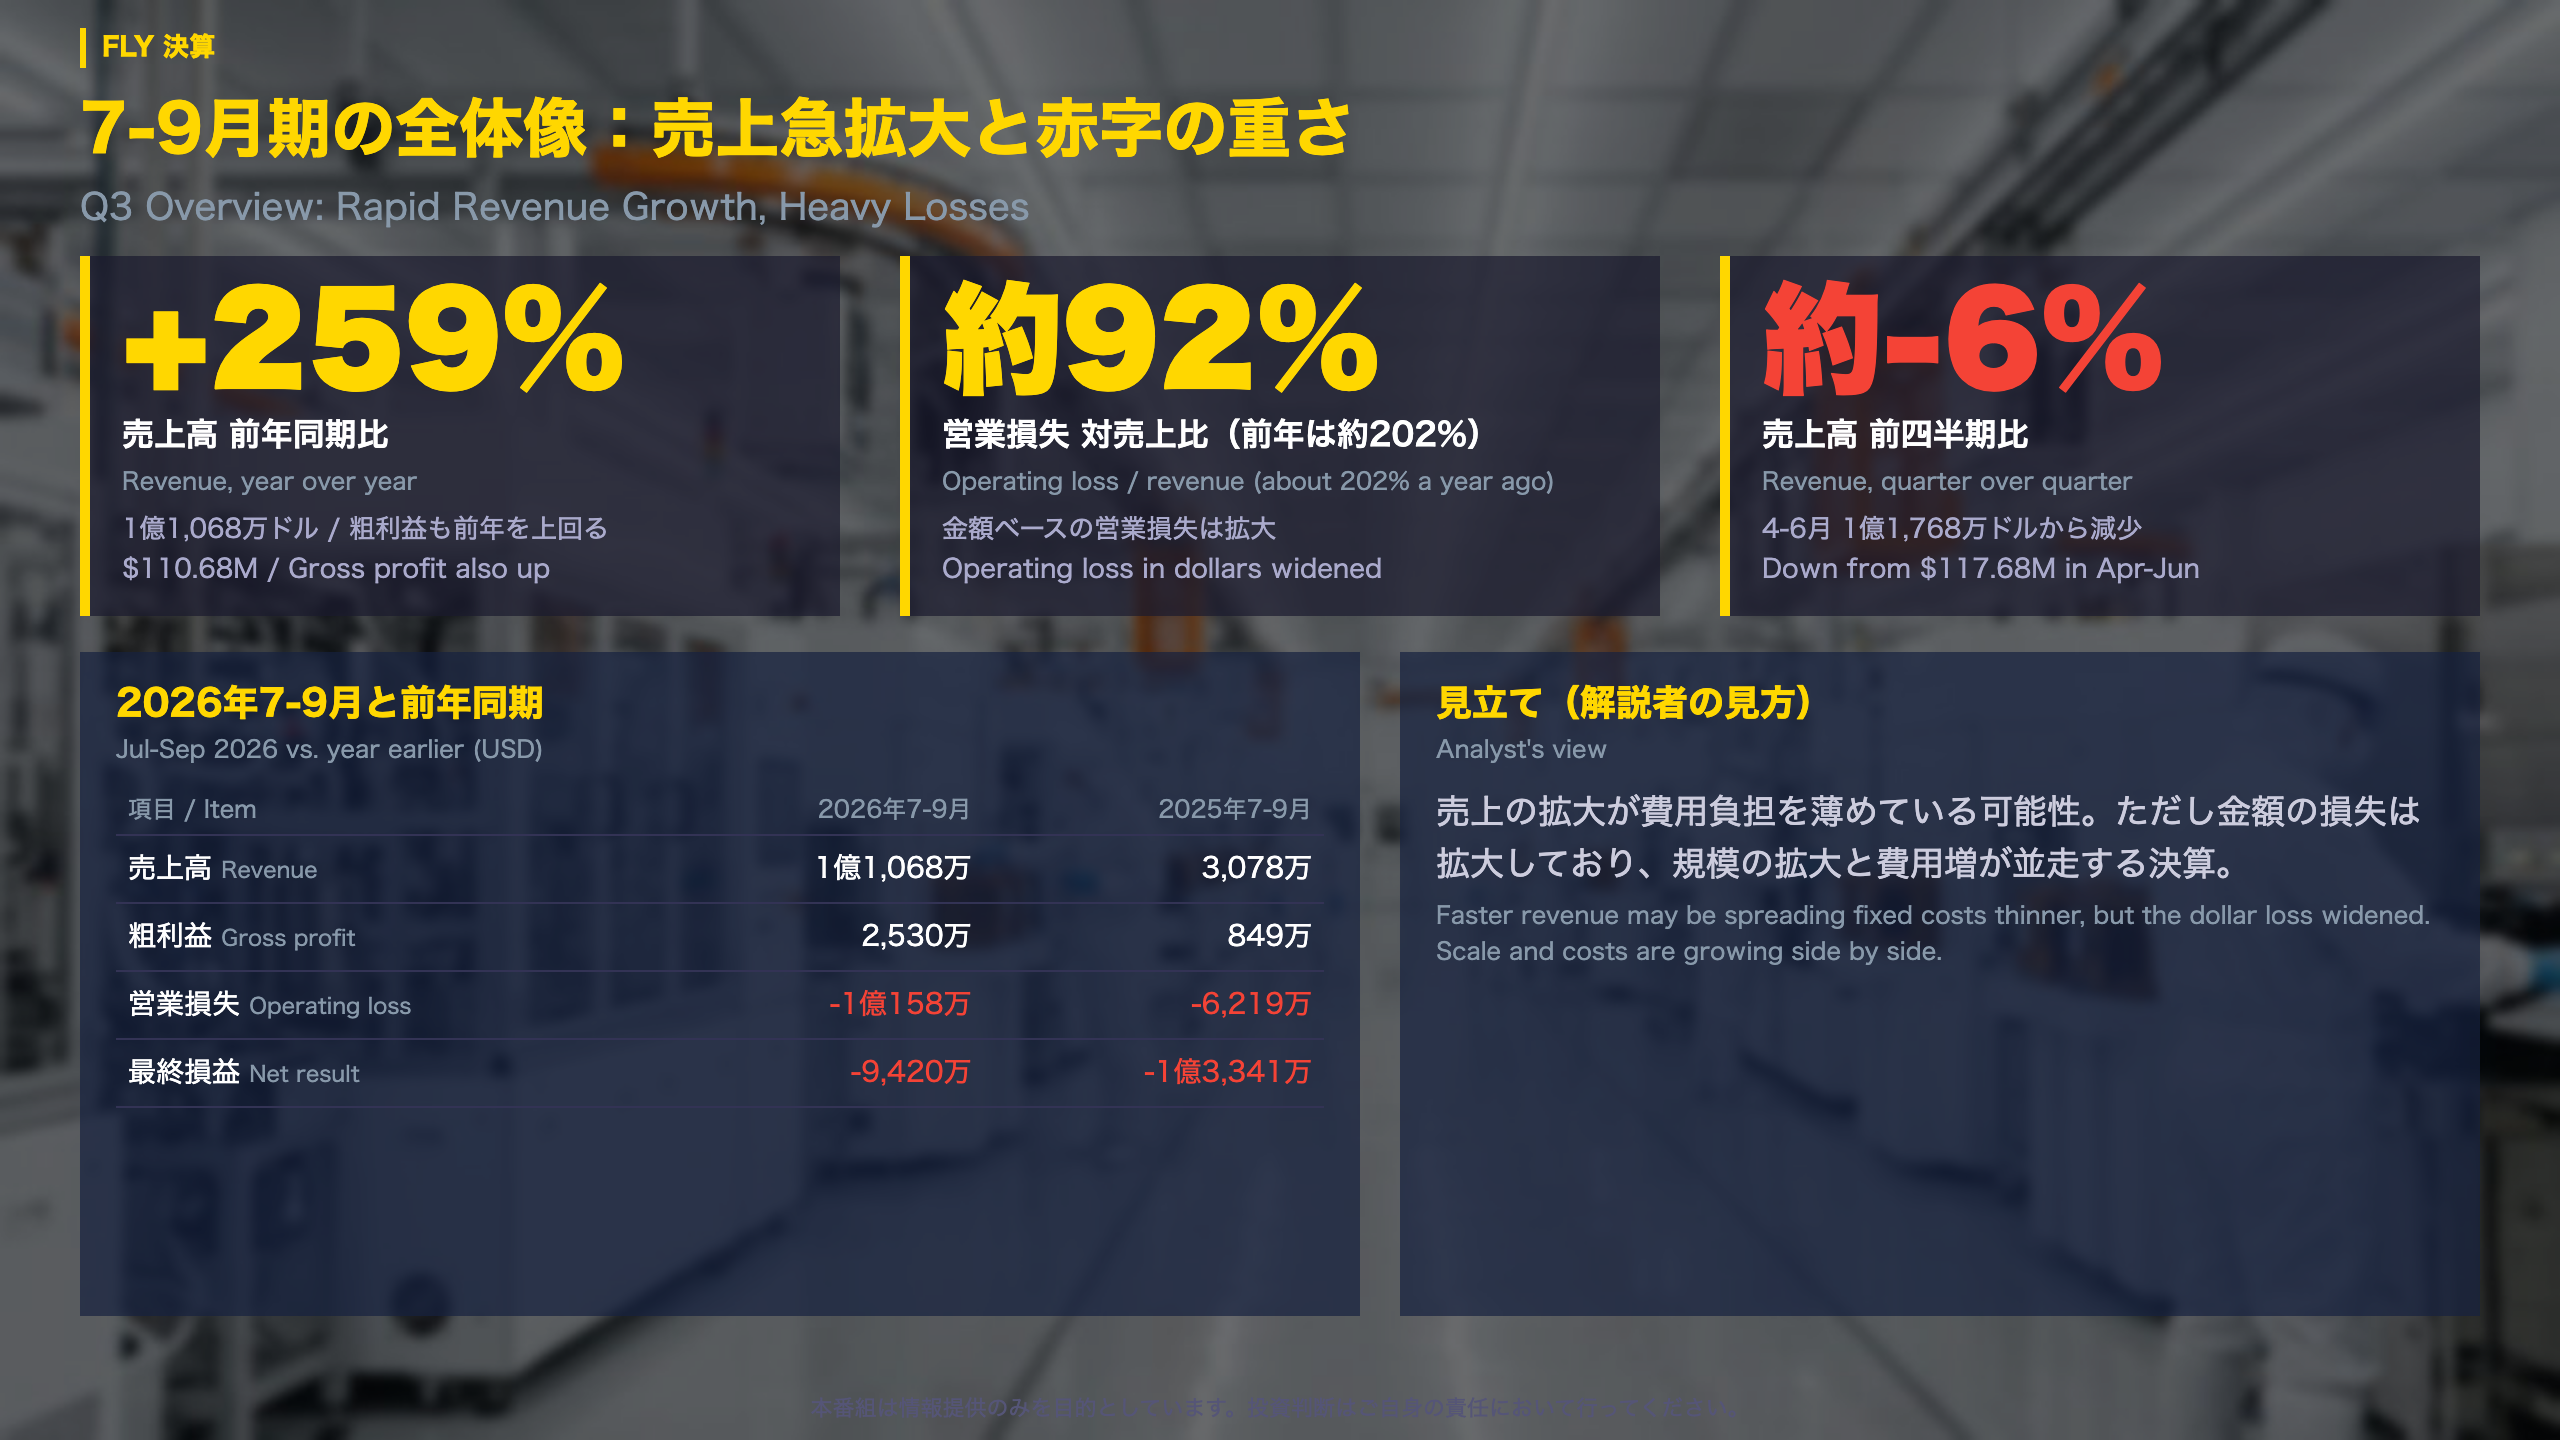
Reading the July-September numbers against last year and last quarter
“Revenue of $110.7 million, up 259% from the same period a year prior.” (company release)
Revenue path
Quarterly revenue climbed from $30.78 million in July-September 2025 to $80.88 million in January-March 2026 and $117.68 million in April-June, before landing at $110.68 million this quarter. The materials do not provide the October-December figures, so a continuous series cannot be confirmed.
Profit-side detail
| Item | Jul-Sep 2026 | Jul-Sep 2025 |
|---|---|---|
| Gross profit | $25.3M | $8.49M |
| Adjusted EBITDA | -$69.5M | -$46.3M |
| Operating loss | -$101.6M | -$62.2M |
Gross margin was about 23%, below roughly 28% a year earlier. Revenue growth has therefore not yet translated into a higher margin.
Two ways to read it
- Constructive: revenue, gross profit and backlog all expanded, and operating loss as a share of revenue fell from about 202% to about 92%.
- Cautious: revenue fell about 6% from the prior quarter, and the dollar operating loss and the adjusted EBITDA loss both widened.
Why the ratio matters, and why it is not enough
A falling loss-to-revenue ratio can mean fixed costs are being spread over a larger base. It is a single-quarter ratio, though, and costs themselves rose, so it should not be read as a structural turnaround.
What to watch
The next release covers the fourth quarter. The check is whether results are consistent with the full-year revenue outlook of $440-450 million.
受注残17億ドルの中身
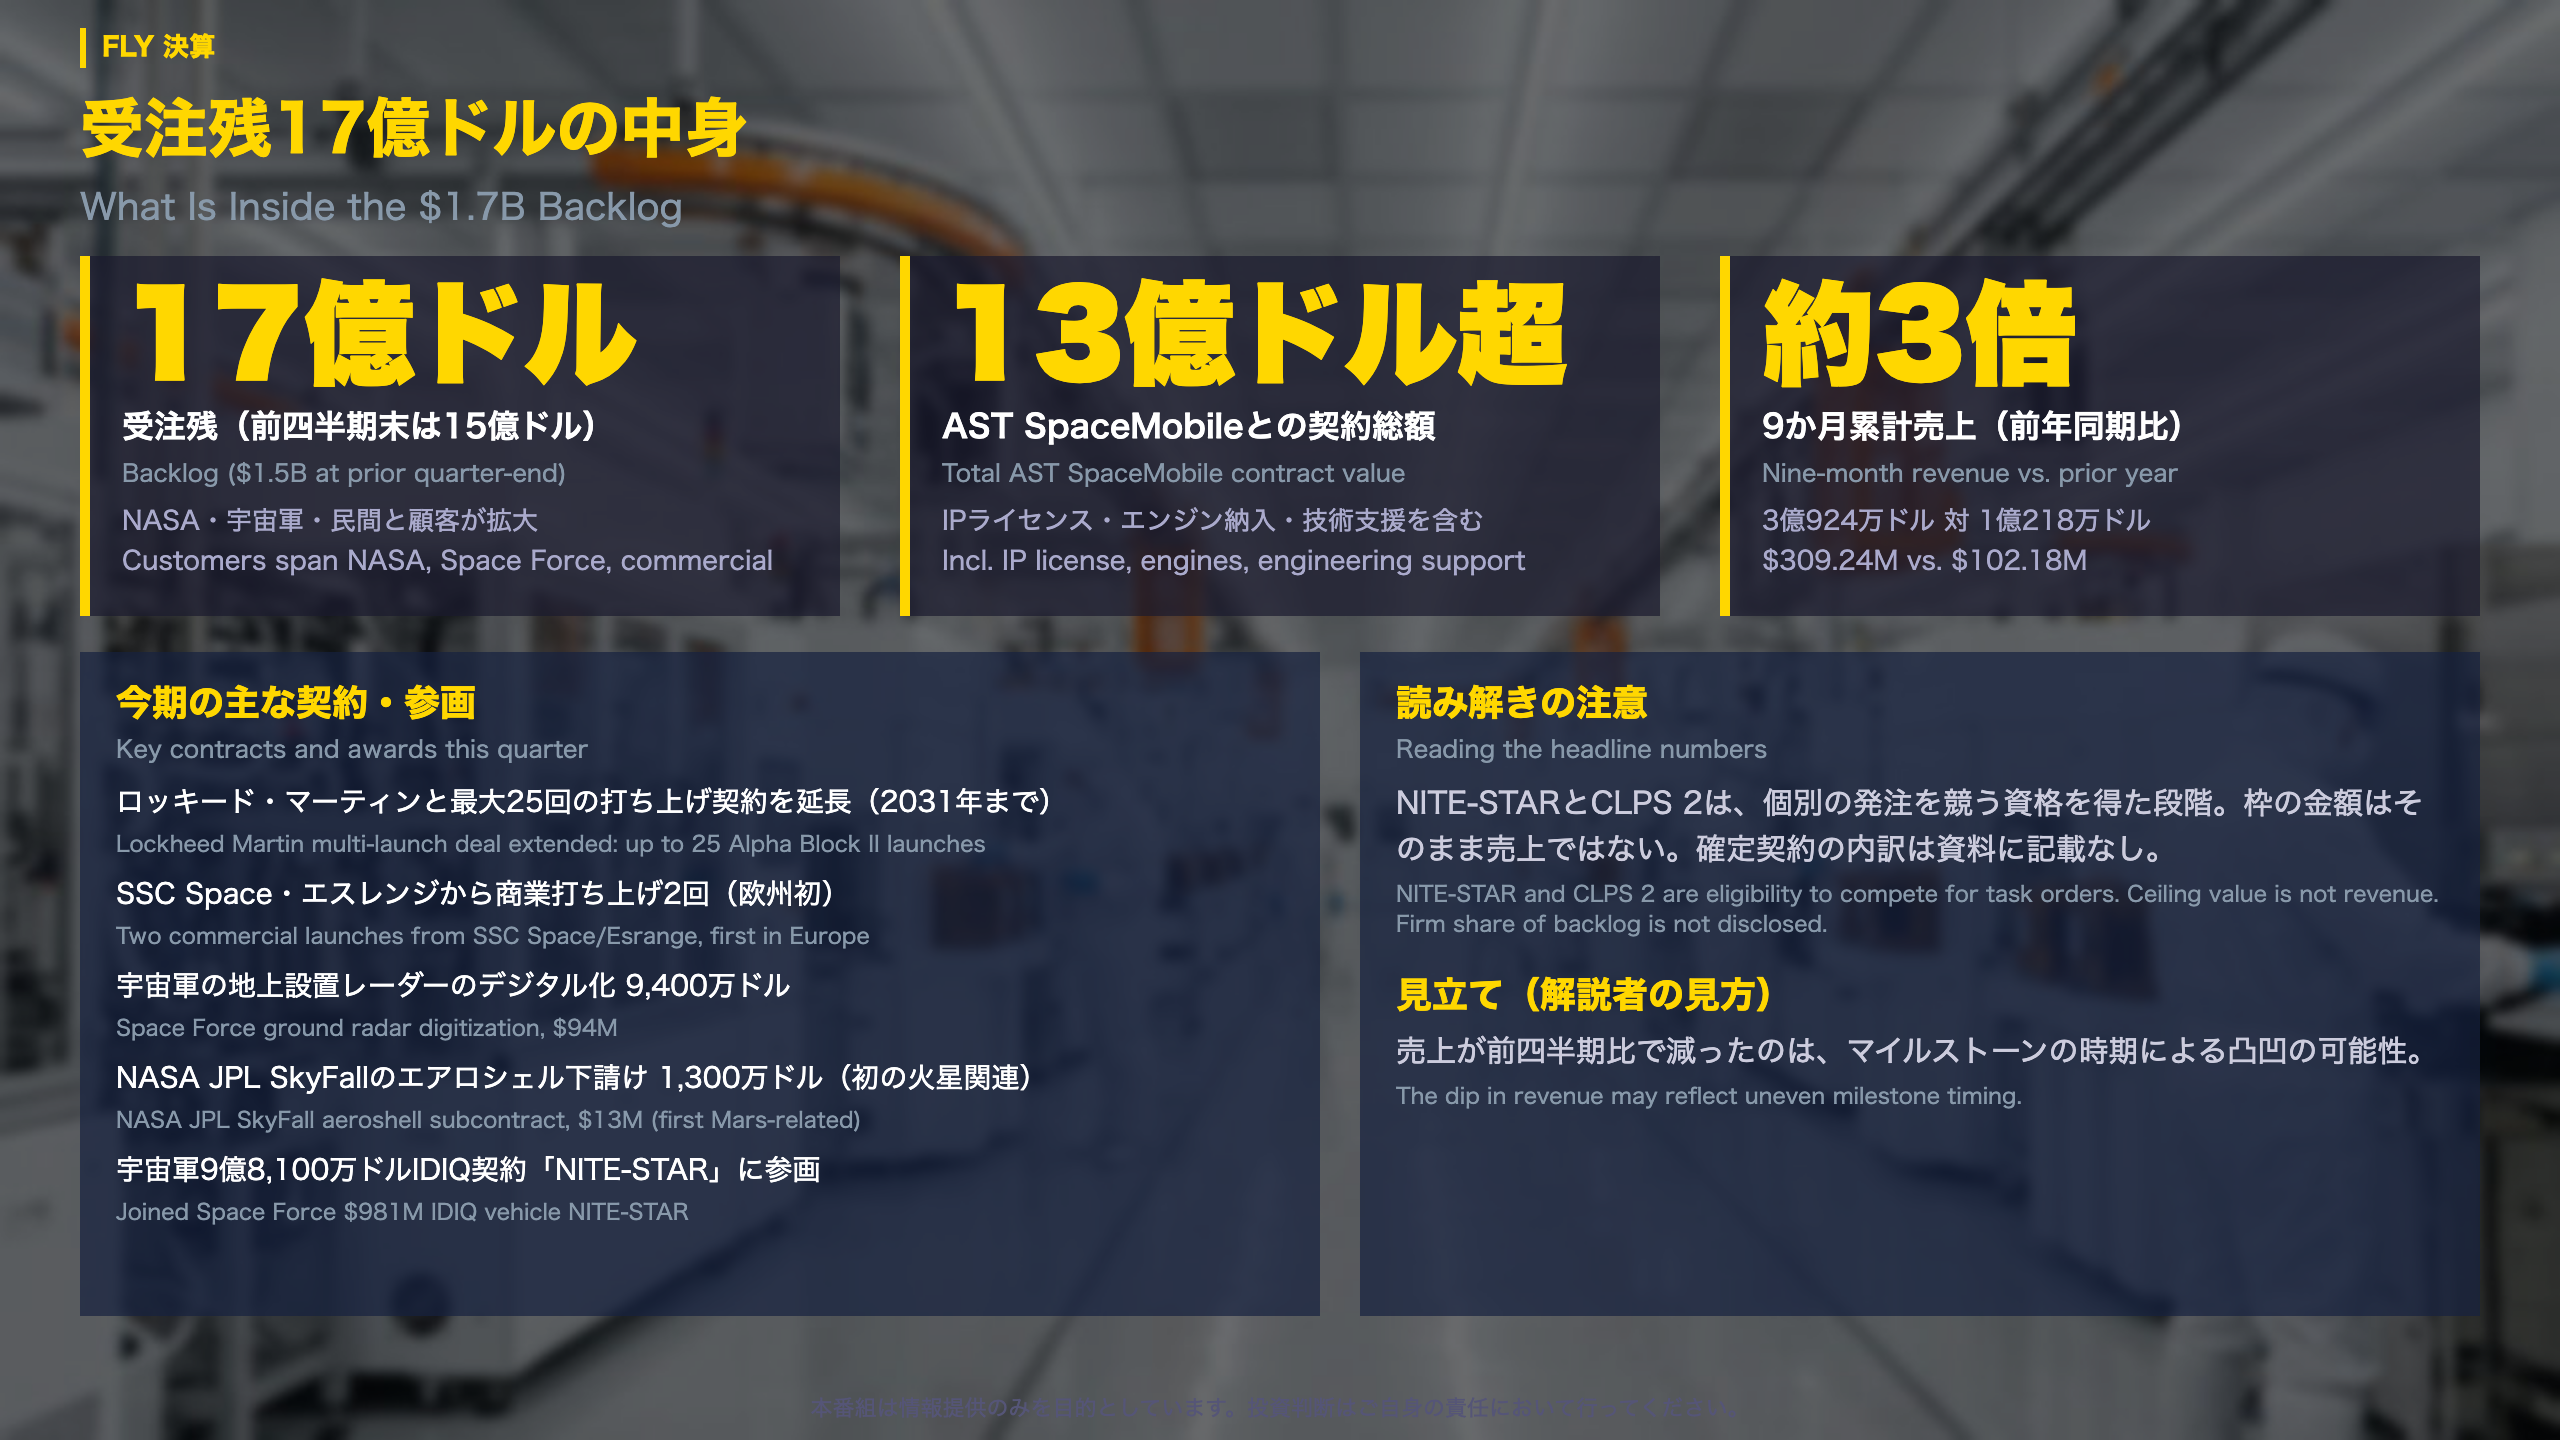
What sits behind the backlog
Contracts and awards the company cited this quarter
- Extended multi-launch agreement with Lockheed Martin: up to 25 Alpha Block II launches through 2031
- Two commercial launches from SSC Space and the Esrange site in Sweden, the company’s first European launch contract
- A $94 million Space Force contract to digitize ground-based radar
- A $13 million subcontract for the aeroshell on NASA JPL’s SkyFall mission, its first Mars-related award
- Participation in the Space Force’s $981 million IDIQ vehicle, NITE-STAR
Recent highlights also include a contract with AST SpaceMobile worth more than $1.3 billion in total (IP licensing, engine deliveries and engineering support), vendor registration for NASA’s roughly $10 billion CLPS 2, and an agreement with Japan’s Synspective for up to 10 launches.
A note on how to read the headline numbers
IDIQ stands for indefinite-delivery, indefinite-quantity: a ceiling value under which individual task orders are later awarded. The company’s own wording for NITE-STAR and CLPS 2 is “to compete for task orders,” so the ceiling is a qualification, not booked revenue. The share of backlog that is firm is not disclosed.
Revenue lumpiness
Revenue was $80.88 million in January-March, $117.68 million in April-June and $110.68 million in July-September 2026. The nine-month total of $309.24 million is about three times the $102.18 million of a year earlier.
Two readings
- Constructive: backlog rose from $1.5 billion to $1.7 billion, and the customer base spans NASA, the Space Force and commercial buyers.
- Cautious: revenue slipped about 6% from the prior quarter. Milestone timing can make quarterly figures uneven.
What to watch
The pace at which backlog converts into revenue is the next check. The materials do not give a schedule for that conversion.
赤字の中身と手元資金
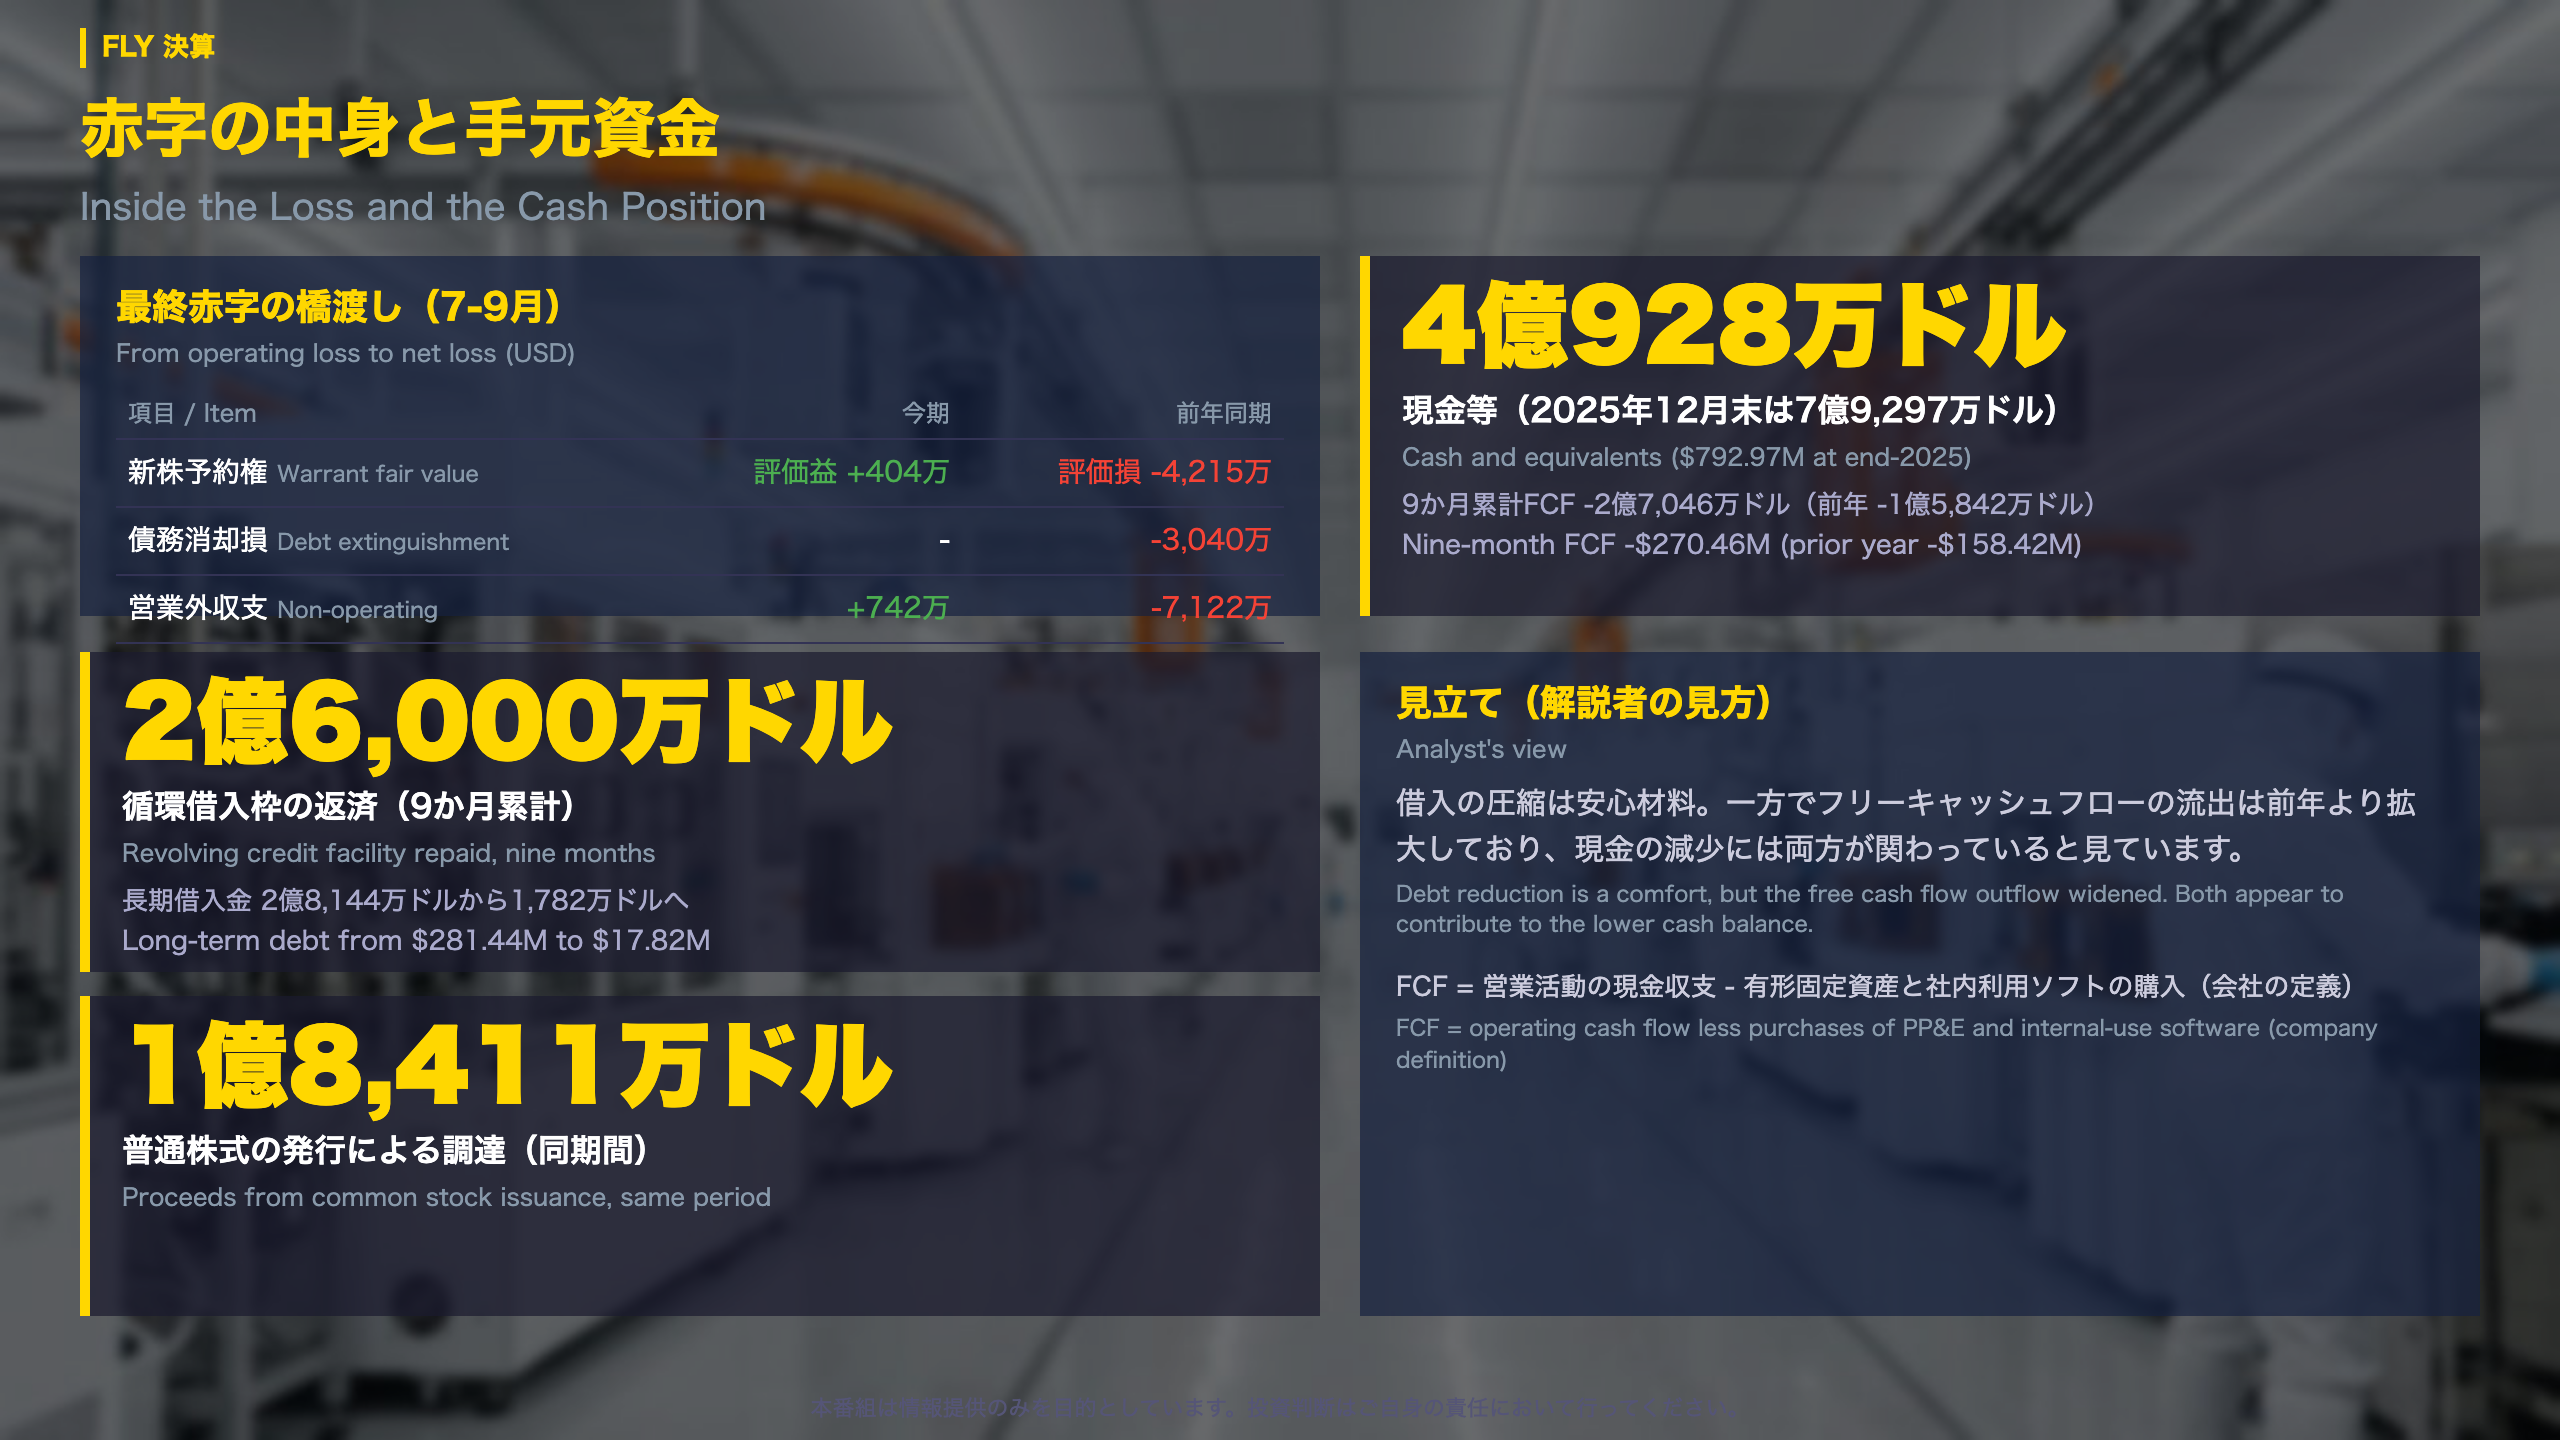
Adjusted figures and the cash picture
Non-GAAP detail (July-September)
| Item | This quarter | Year earlier |
|---|---|---|
| Non-GAAP operating loss | -$78.7M | -$52.8M |
| Non-GAAP R&D | $67.7M | $48.3M |
| Non-GAAP SG&A | $36.3M | $13.0M |
| Non-GAAP loss per share | -$0.45 | -$0.55 |
| GAAP loss per share | -$0.56 | -$1.50 |
Non-GAAP figures strip out items such as stock-based compensation, which rose to $15.29 million from $4 million. The per-share improvement also reflects a larger share count: weighted average shares rose from 93.85 million to 168.37 million. A smaller loss per share therefore does not by itself mean a smaller loss in dollars.
From operating loss to net loss
Non-operating results were +$7.42 million versus -$71.22 million a year earlier. The prior year carried a $42.15 million warrant fair-value loss and a $30.40 million loss on debt extinguishment; this quarter booked a $4.04 million gain.
Balance sheet moves
- Cash and equivalents: $409.28M (vs. $792.97M at end-2025); short-term investments $125.45M
- Long-term debt: from $281.44M to $17.82M
- Current deferred revenue rose from $116.14M to $171.17M; the non-current portion fell from $92.57M to $46.00M
Two readings
Paying down debt is a balance-sheet positive. But nine-month free cash flow was -$270.46 million versus -$158.42 million a year earlier, so the outflow widened.
The company defines free cash flow as operating cash flow less purchases of property and equipment and internally developed software.
What to watch
The quarterly free cash flow figure (-$85.26 million this quarter) is the number to track alongside the cash balance.
通期見通しと次の確認点
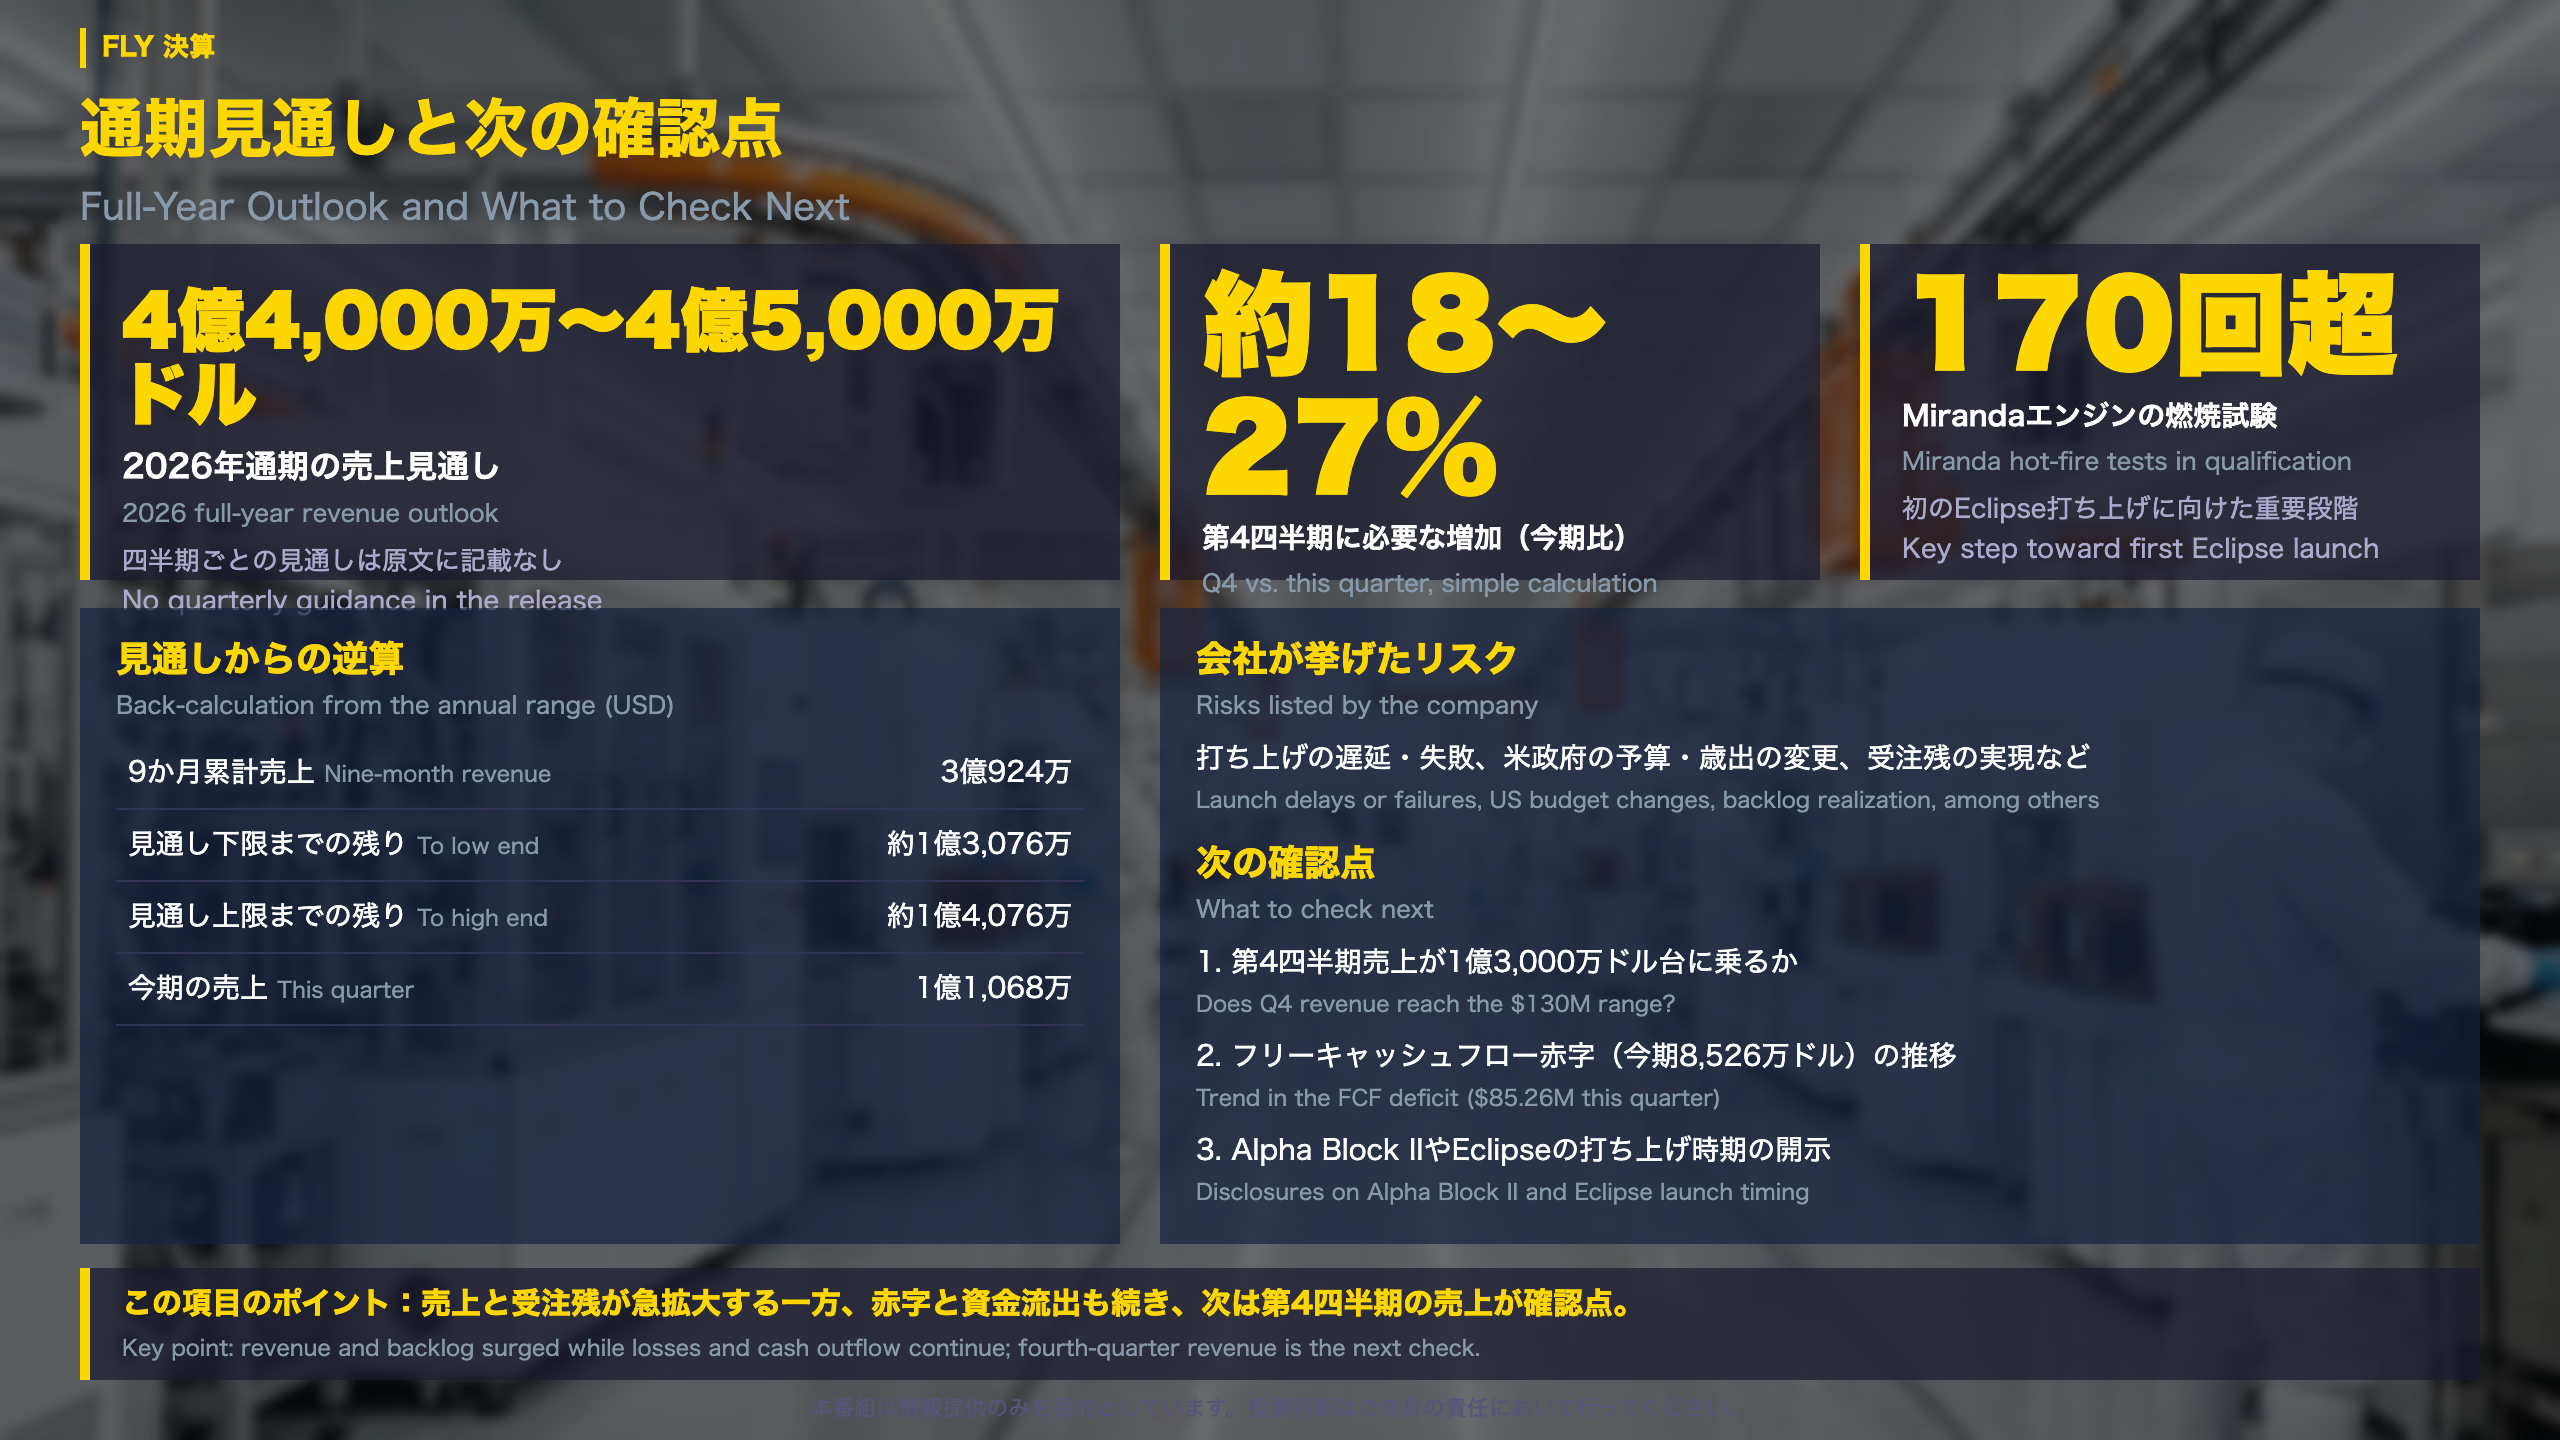
The outlook arithmetic, the risks and the progress markers
What the fourth quarter would need to look like
The company’s 2026 full-year revenue outlook is $440-450 million.
| Item | Amount |
|---|---|
| Nine-month revenue | $309.24M |
| Remaining to low end | about $130.76M |
| Remaining to high end | about $140.76M |
| This quarter’s revenue | $110.68M |
A simple calculation implies fourth-quarter revenue roughly 18-27% above this quarter. The company gives no quarterly guidance, so this is a back-calculation from the annual range, not a company target.
Risks the company lists
The forward-looking-statement language names launch delays or failures, the cadence of Alpha launches and completion of Eclipse development, changes in US government budgets and appropriations, delays in delivering engines and IP to AST SpaceMobile, and the realization of backlog.
Progress markers
- Miranda engine qualification: more than 170 hot-fire tests, a key stage ahead of the first Eclipse launch
- A third hypersonic task order for Alpha
- MoonFall preliminary design review and Blue Ghost lunar south pole mission critical design review completed
Two readings
- Constructive: $1.7 billion of backlog and about $535 million of cash and short-term investments give room to keep developing.
- Cautious: nine-month free cash flow was -$270.46 million and cash is below the end-2025 level.
What to watch next
- Whether fourth-quarter revenue reaches the $130 million range
- The free cash flow deficit (-$85.26 million this quarter)
- Disclosures on timing for Alpha Block II and Eclipse launches
The next earnings date is not stated in the materials.
決算の全体像:売上約5倍、営業赤字は拡大
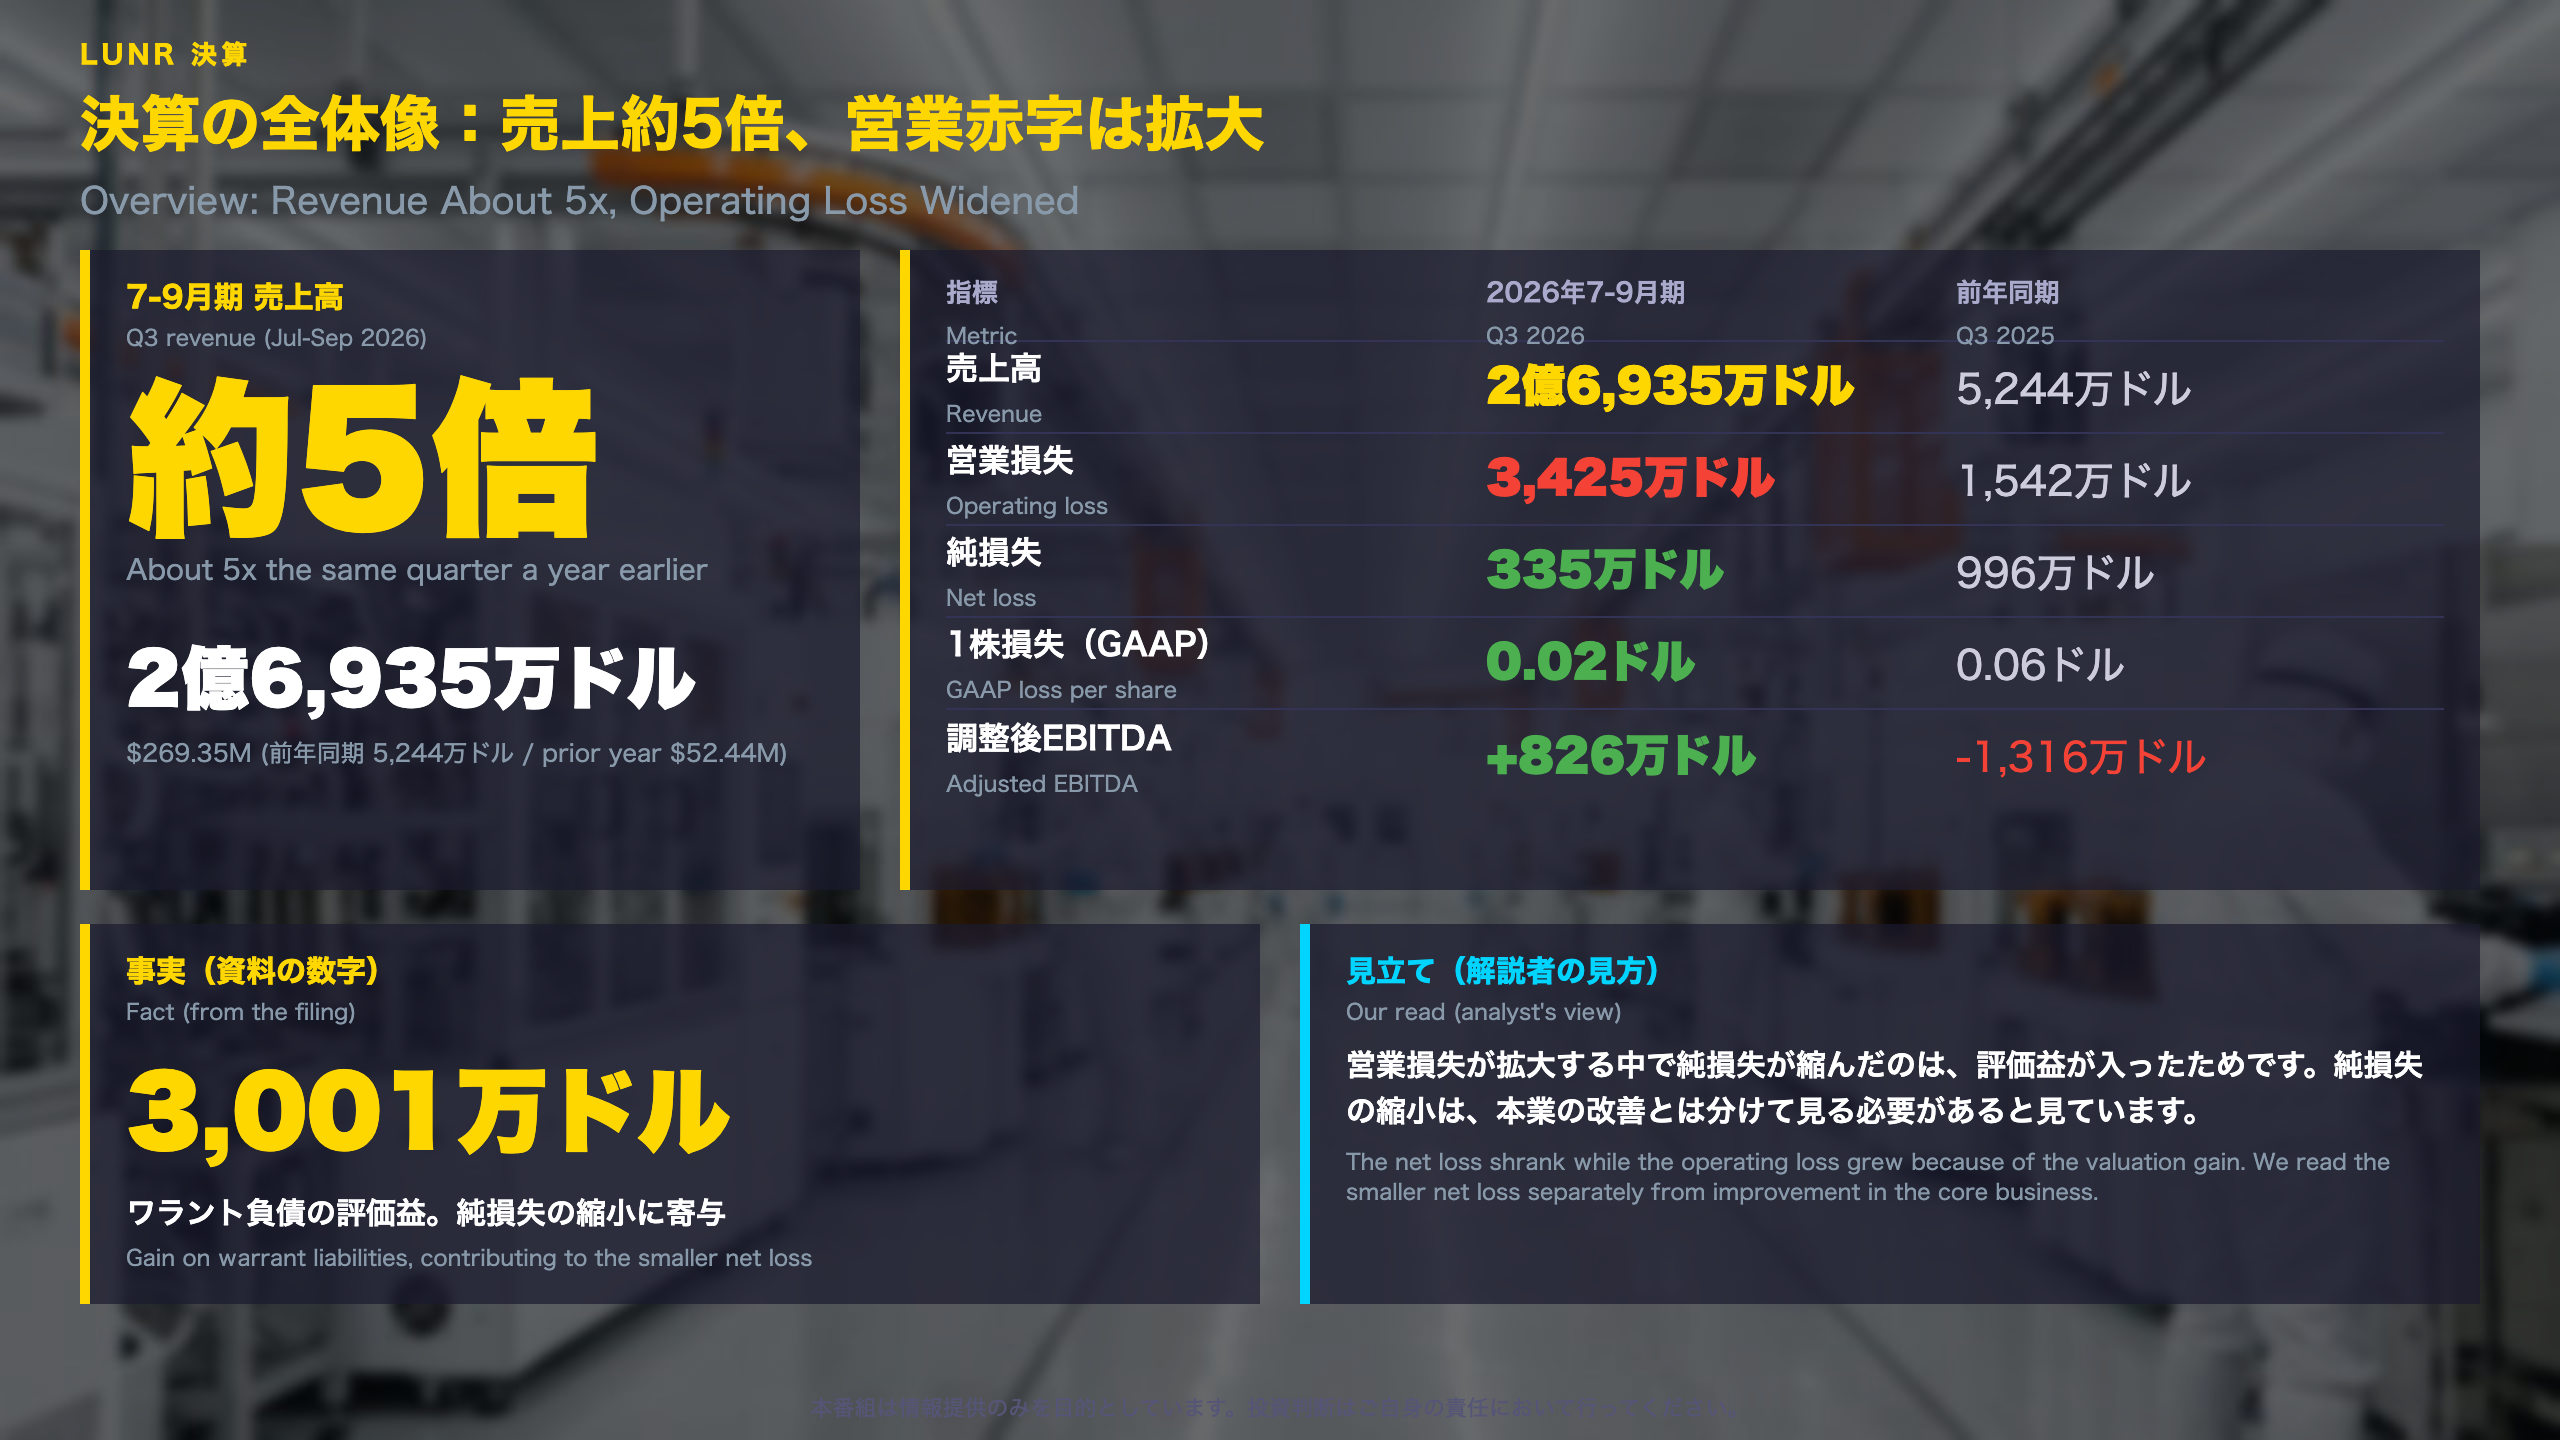
Intuitive Machines (LUNR): a record quarter, with the core business still loss-making
Context. Intuitive Machines reports on a calendar-year basis, so this quarter covers July to September 2026. Revenue was $269.35M versus $52.44M a year earlier. The nine-month total of $662.25M is roughly four times last year’s $165.27M, and revenue grew about 30.6% from $206.17M in the previous quarter.
Why the headline needs a second look
- Operating loss widened to $34.25M from $15.42M, even as revenue surged.
- Net loss narrowed to $3.35M, helped by a $30.01M gain on warrant liabilities, an accounting revaluation rather than an operating result.
- Share count rose about 47% to 173.43M weighted-average shares, so the $0.02 GAAP loss per share also reflects a larger share base.
Balance sheet
Cash fell to $463.81M from $582.61M at the end of 2025, while total assets grew to $2.235B. Goodwill jumped to $406.65M from $18.7M, consistent with the acquisitions the company completed this year.
How to read it
CEO Altemus said the company delivered “record financial performance across the board.” The release supports records in revenue, gross profit, operating cash flow and backlog. It also shows a wider operating loss. Both are facts from the same document.
What to watch next: full-year revenue guidance of $920M to $950M and positive full-year adjusted EBITDA. The next earnings date is not stated in the materials.
売上の中身:製品売上の立ち上がり
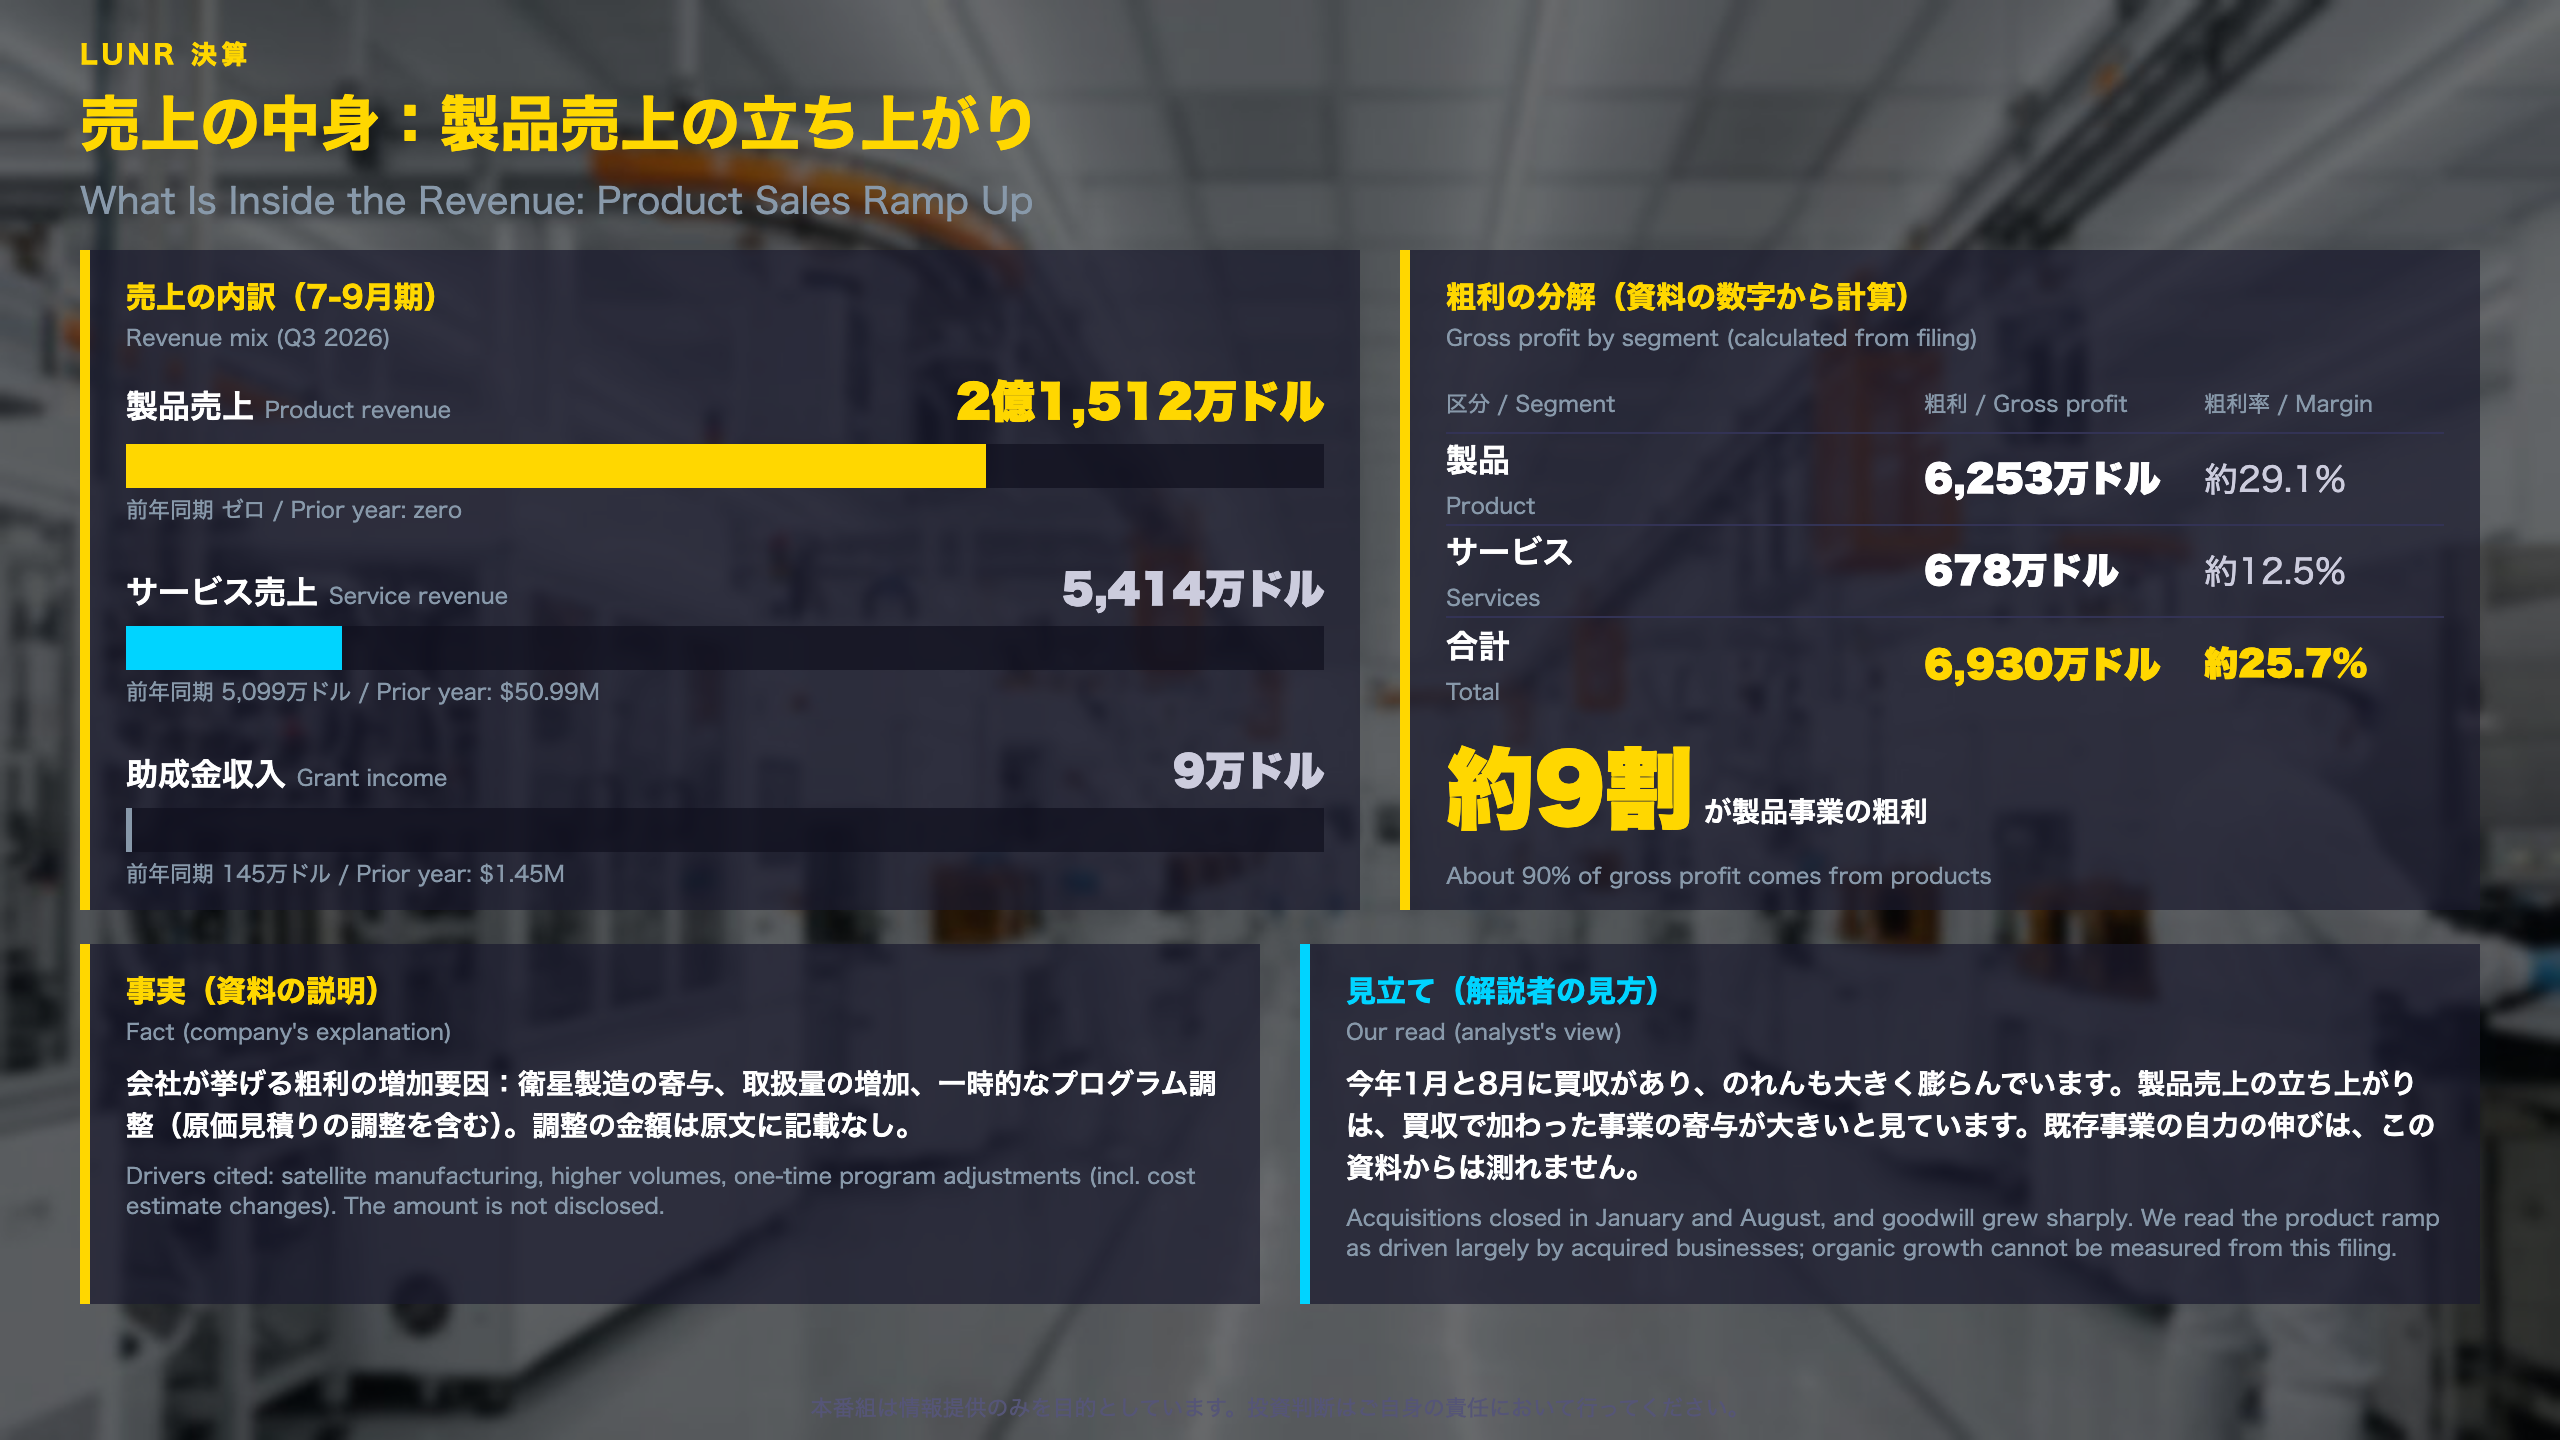
Revenue mix and the cost side: what sits behind a fivefold sales jump
Reading the mix. Product revenue was $215.12M in the quarter (zero a year ago) and $523.41M over nine months. Service revenue was $54.14M, up about 6.2% from $50.99M. Grant income, once a small contributor at $1.45M, fell to $0.09M.
Gross profit by segment (calculated from the filing, before depreciation)
| Segment | Gross profit | Margin |
|---|---|---|
| Product | $62.53M | ~29.1% |
| Services | $6.78M | ~12.5% |
| Total | $69.30M | ~25.7% |
The company cites satellite manufacturing, higher volumes and “net favorable one-time program adjustments” as drivers. These adjustments can include changes to estimated-at-completion (EAC) cost estimates on long-term contracts. The dollar impact is not disclosed.
Cost lines worth noting
- Depreciation and amortization was $13.18M versus $0.82M, consistent with intangible assets rising to $274.87M.
- G&A expense was $82.91M versus $16.32M, about five times last year.
Two readings
- Constructive: revenue has stayed at a high level for three consecutive quarters ($186.73M, $206.17M, $269.35M).
- Cautious: because the growth centers on businesses acquired this year, organic growth of the legacy business cannot be measured from this filing.
What to watch next: whether gross margin holds near 26% once one-time adjustments are stripped out. The next earnings date is not stated in the materials.
黒字転換の質:調整後EBITDA +826万ドル
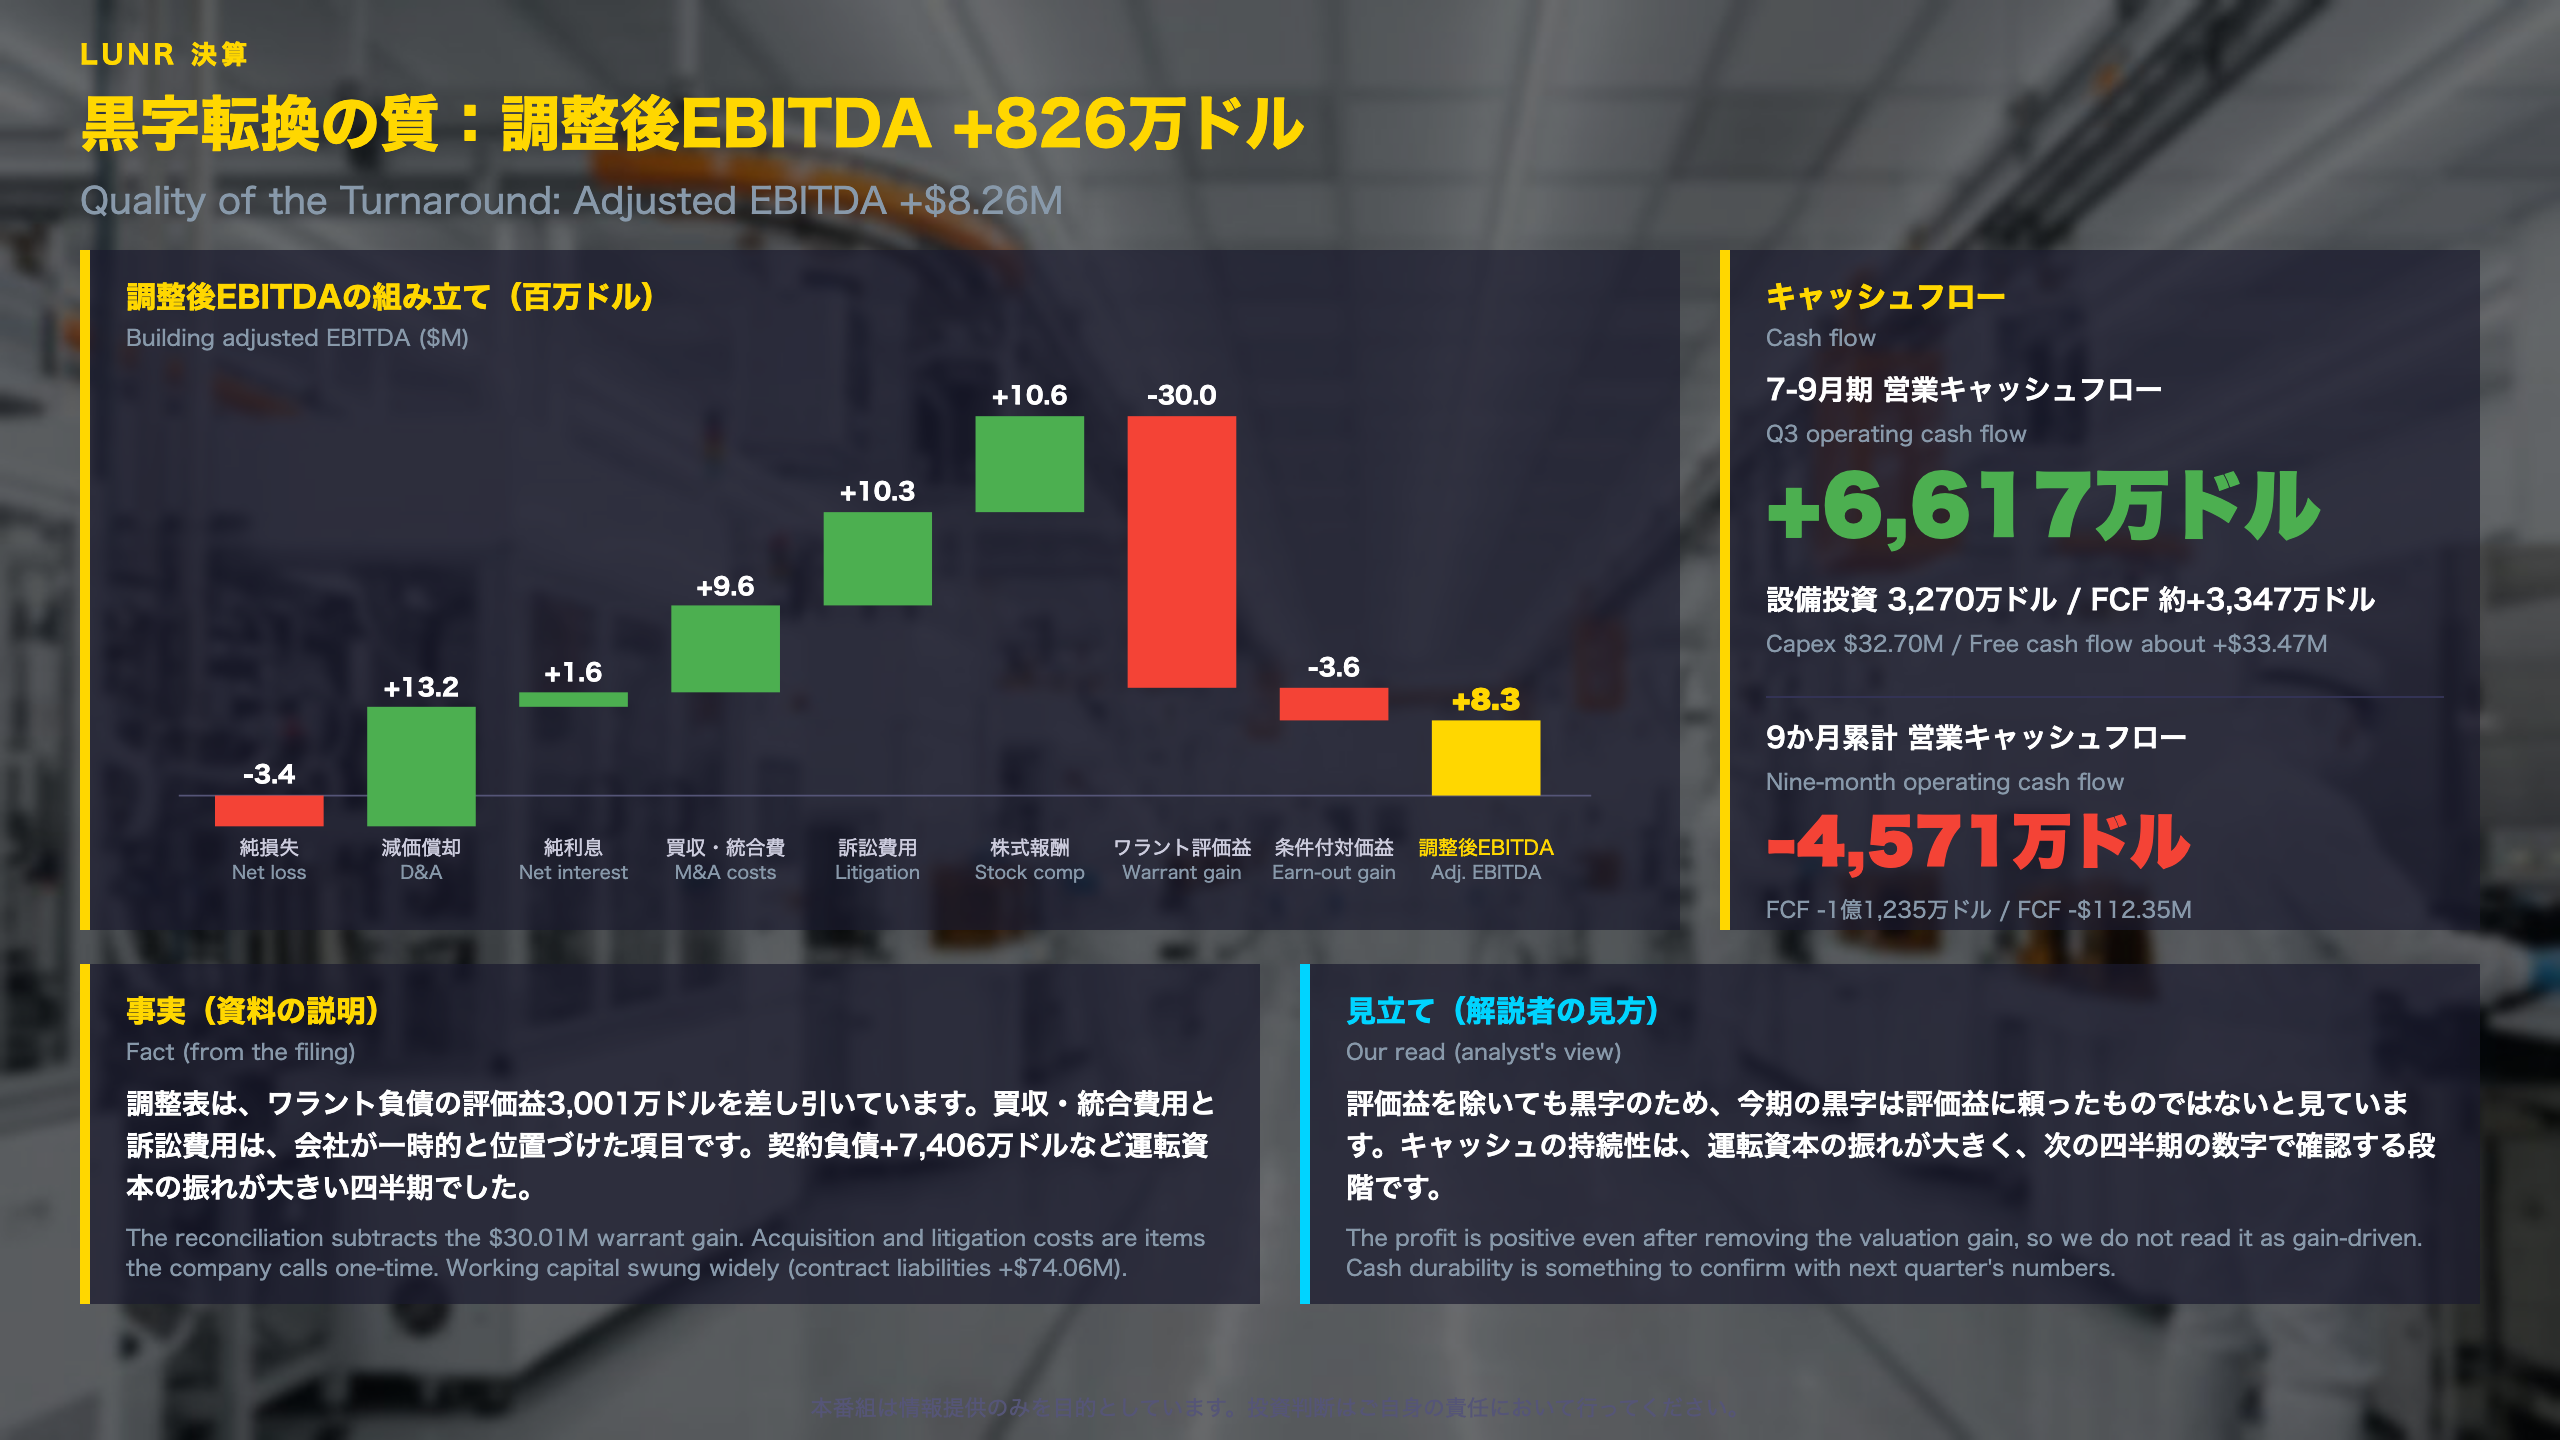
Inside the swing to positive adjusted EBITDA
What the metric is. Adjusted EBITDA is a non-GAAP measure: the company starts from net loss and adds back items such as depreciation and amortization, stock-based compensation, and costs it classifies as one-time. It is not an audited GAAP result, so the reconciliation table matters.
The reconciliation ($M)
- Net loss: -3.4
- Depreciation and amortization: +13.2
- Net interest: +1.6
- Acquisition and integration costs: +9.6
- One-time litigation costs: +10.3
- Stock-based compensation: +10.6
- Gain on warrant liabilities: -30.0
- Gain on contingent consideration: -3.6
- Adjusted EBITDA: +8.3
Over nine months, adjusted EBITDA was -$2.98M versus -$45.08M a year earlier, a large improvement.
Cash flow detail
Operating cash flow was +$66.17M and capex $32.70M, so free cash flow was about +$33.47M. Working capital moved a lot: contract liabilities added $74.06M and other liabilities $98.68M, while contract assets absorbed $68.97M. The company also booked a $9.54M credit loss allowance. Over nine months, free cash flow was -$112.35M.
Financing
The company raised $98.1M through securities issuance in the quarter ($511.88M year to date) and spent $464.89M on acquisitions.
Two readings
- Constructive: both operating and free cash flow were positive for the quarter, and the adjusted EBITDA reconciliation already strips out the warrant gain.
- Cautious: large working-capital swings make a single quarter hard to extrapolate, and the operating loss widened.
What to watch next: the company guides to positive full-year adjusted EBITDA. With nine months at -$2.98M, a Q4 result similar to this quarter’s would get there. The next earnings date is not stated.
受注残の中身と通期見通し
Backlog anatomy and the full-year arithmetic
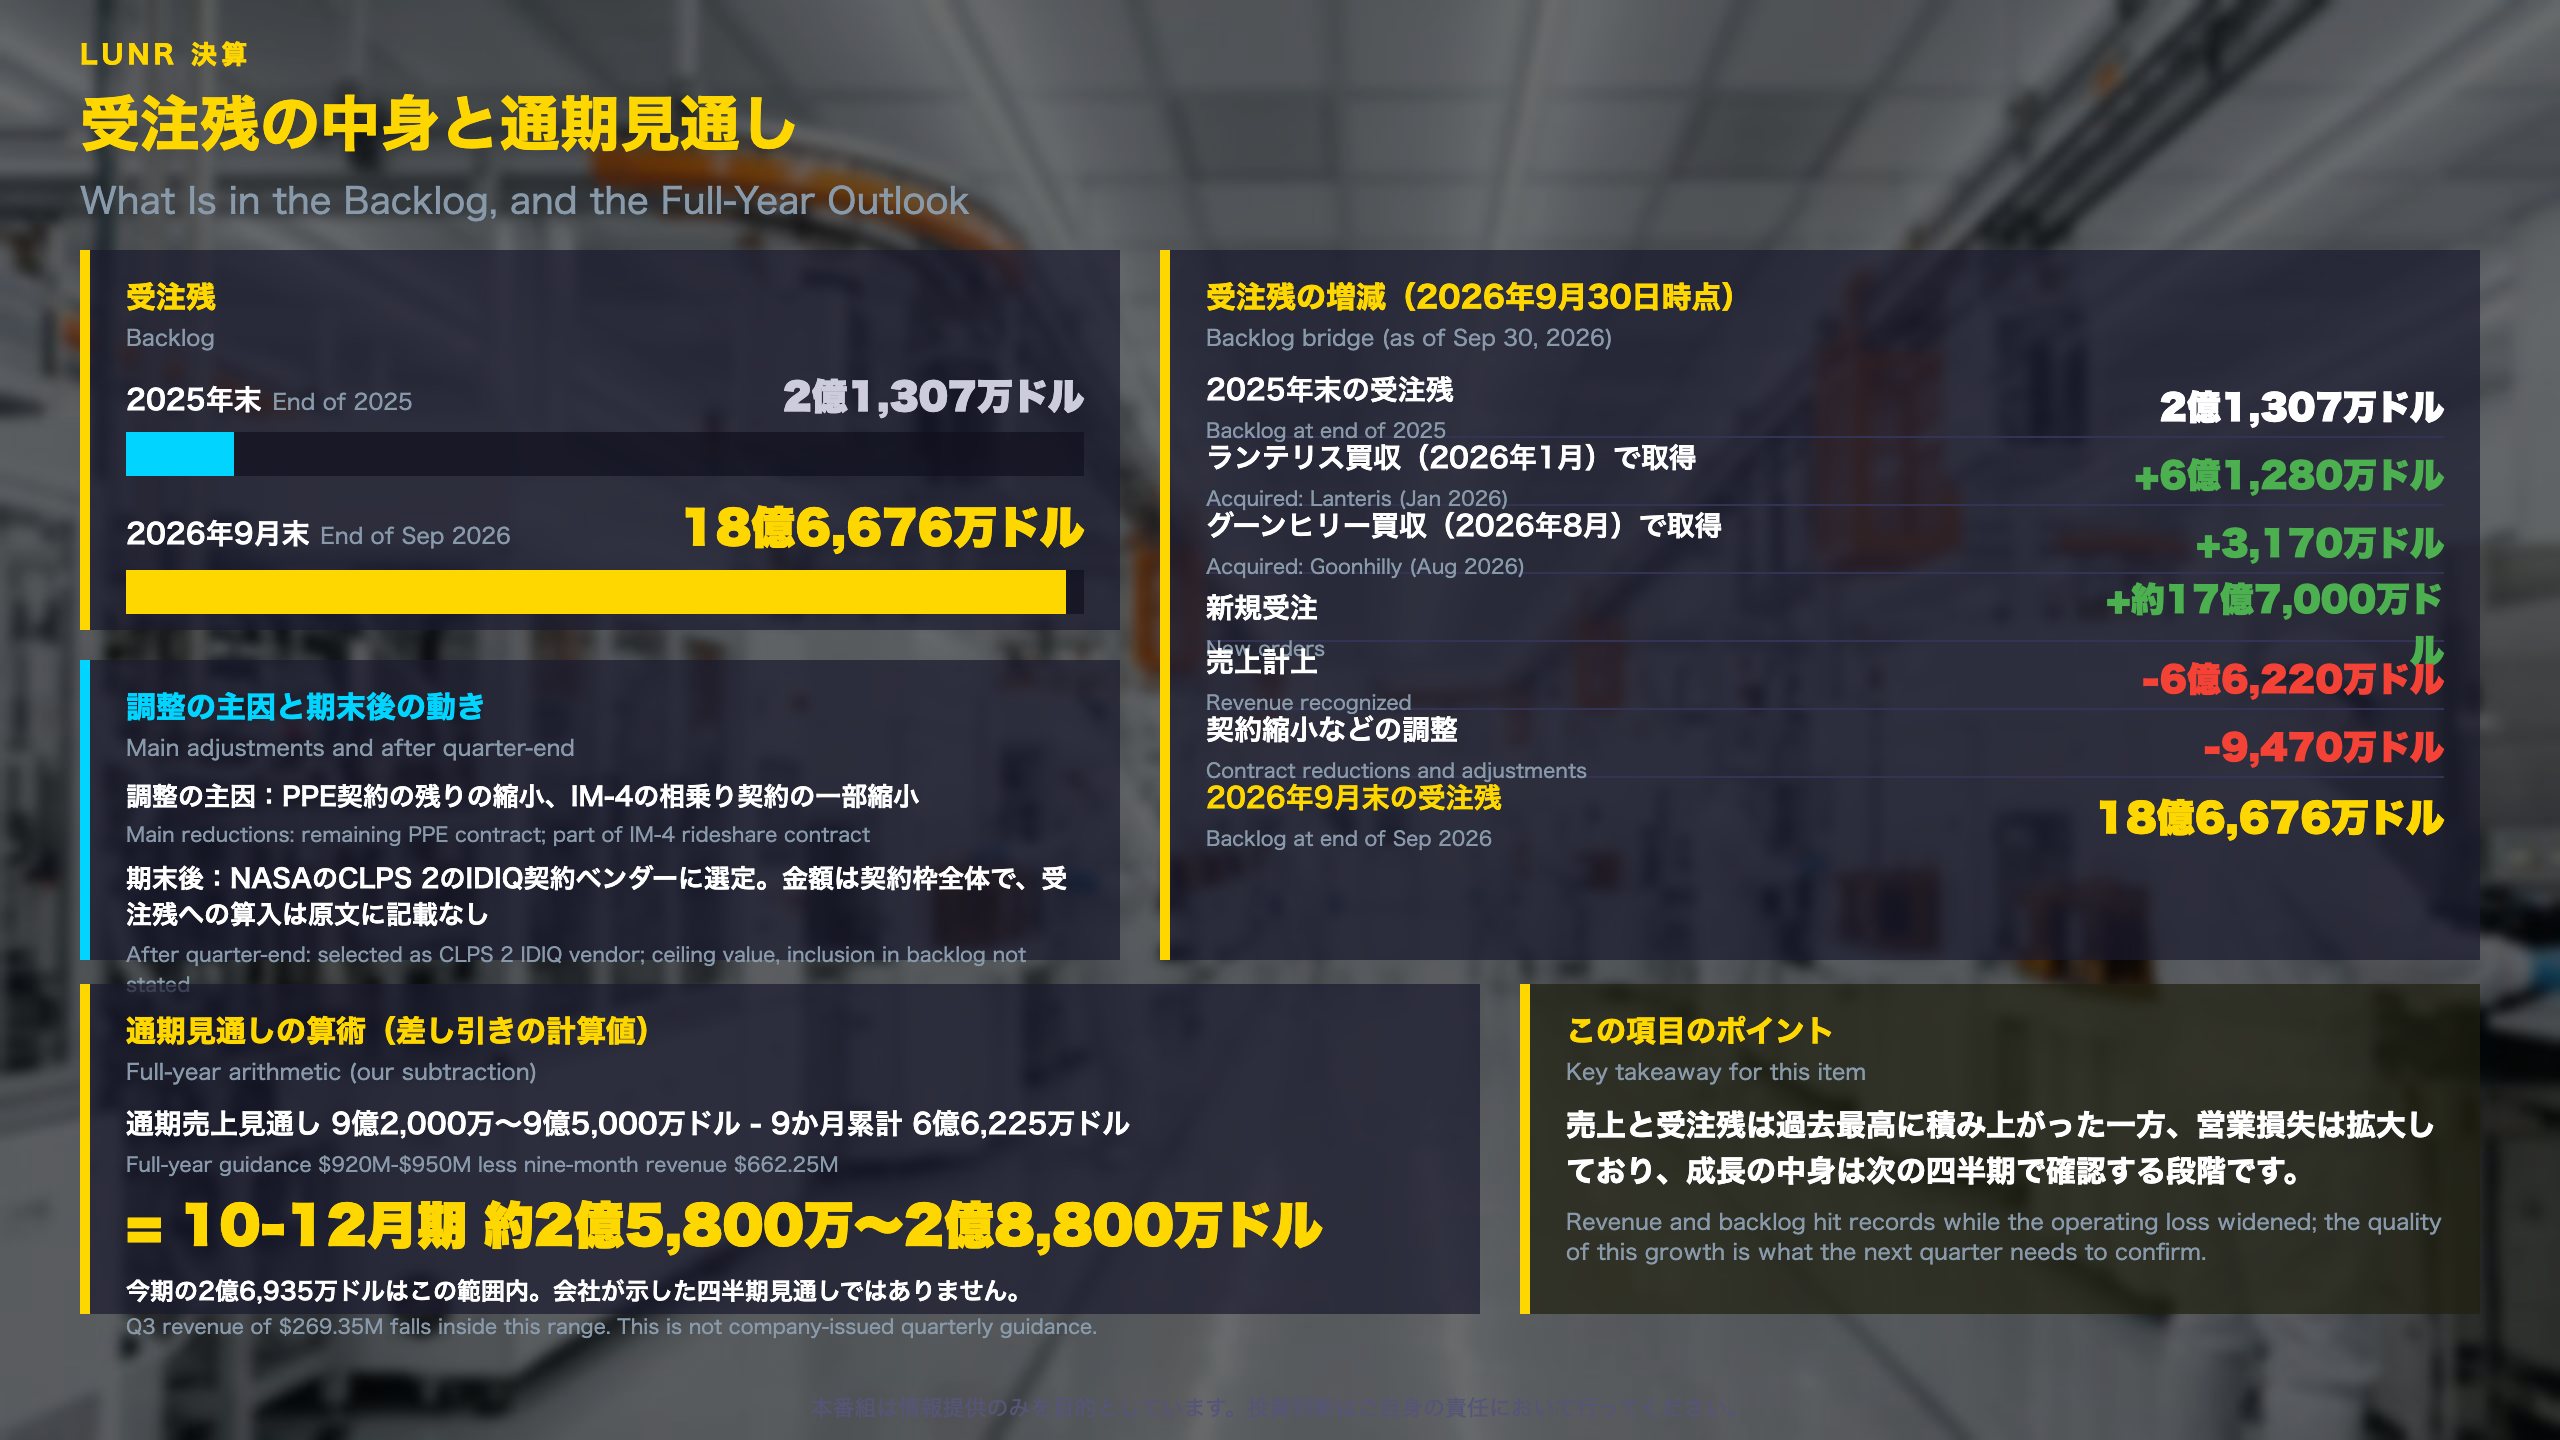
Why backlog matters. For a company that books revenue as contracts are executed over several quarters, backlog shows contracted work not yet recognized as sales. Here, backlog was $1.867B at September 30, 2026, about nine times the $213.07M at end-2025.
What moved it
- Acquired backlog: $612.8M from the January acquisition of Lanteris and $31.7M from the August acquisition of Goonhilly.
- New orders: about $1.77B.
- Revenue recognized: -$662.2M.
- Contract reductions: -$94.7M, mainly the remaining Power Propulsion Element (PPE) contract and part of a rideshare contract tied to the IM-4 mission.
New orders and acquired backlog in Q3 alone totaled $450M. Named awards include a three-satellite commercial multi-satellite deal, an SDA tracking-layer contract, and a NASA JPL instrument contract.
After quarter-end
The company was selected as a vendor on NASA’s CLPS 2 contract, an IDIQ (indefinite delivery, indefinite quantity) vehicle with a $10B ceiling plus $5B in options. An IDIQ ceiling is the total size of the contract pool, not guaranteed orders, and the filing does not say whether it is included in backlog.
Full-year arithmetic
Guidance of $920M to $950M less nine-month revenue of $662.25M implies roughly $258M to $288M for Q4. Q3 revenue of $269.35M falls inside that range. This is our subtraction, not company-issued quarterly guidance.
Two readings
- Constructive: backlog spans commercial, civil government and national security customers.
- Cautious: the company itself lists launch delays or failures, customer concentration and reliance on government budgets as risks.
Next: IM-3 and Altus 1 are slated for launch around March to April 2027. The next earnings date is not stated.
まとめ:売上の伸びと、費用・資金の負担
Nine reports, three profit profiles
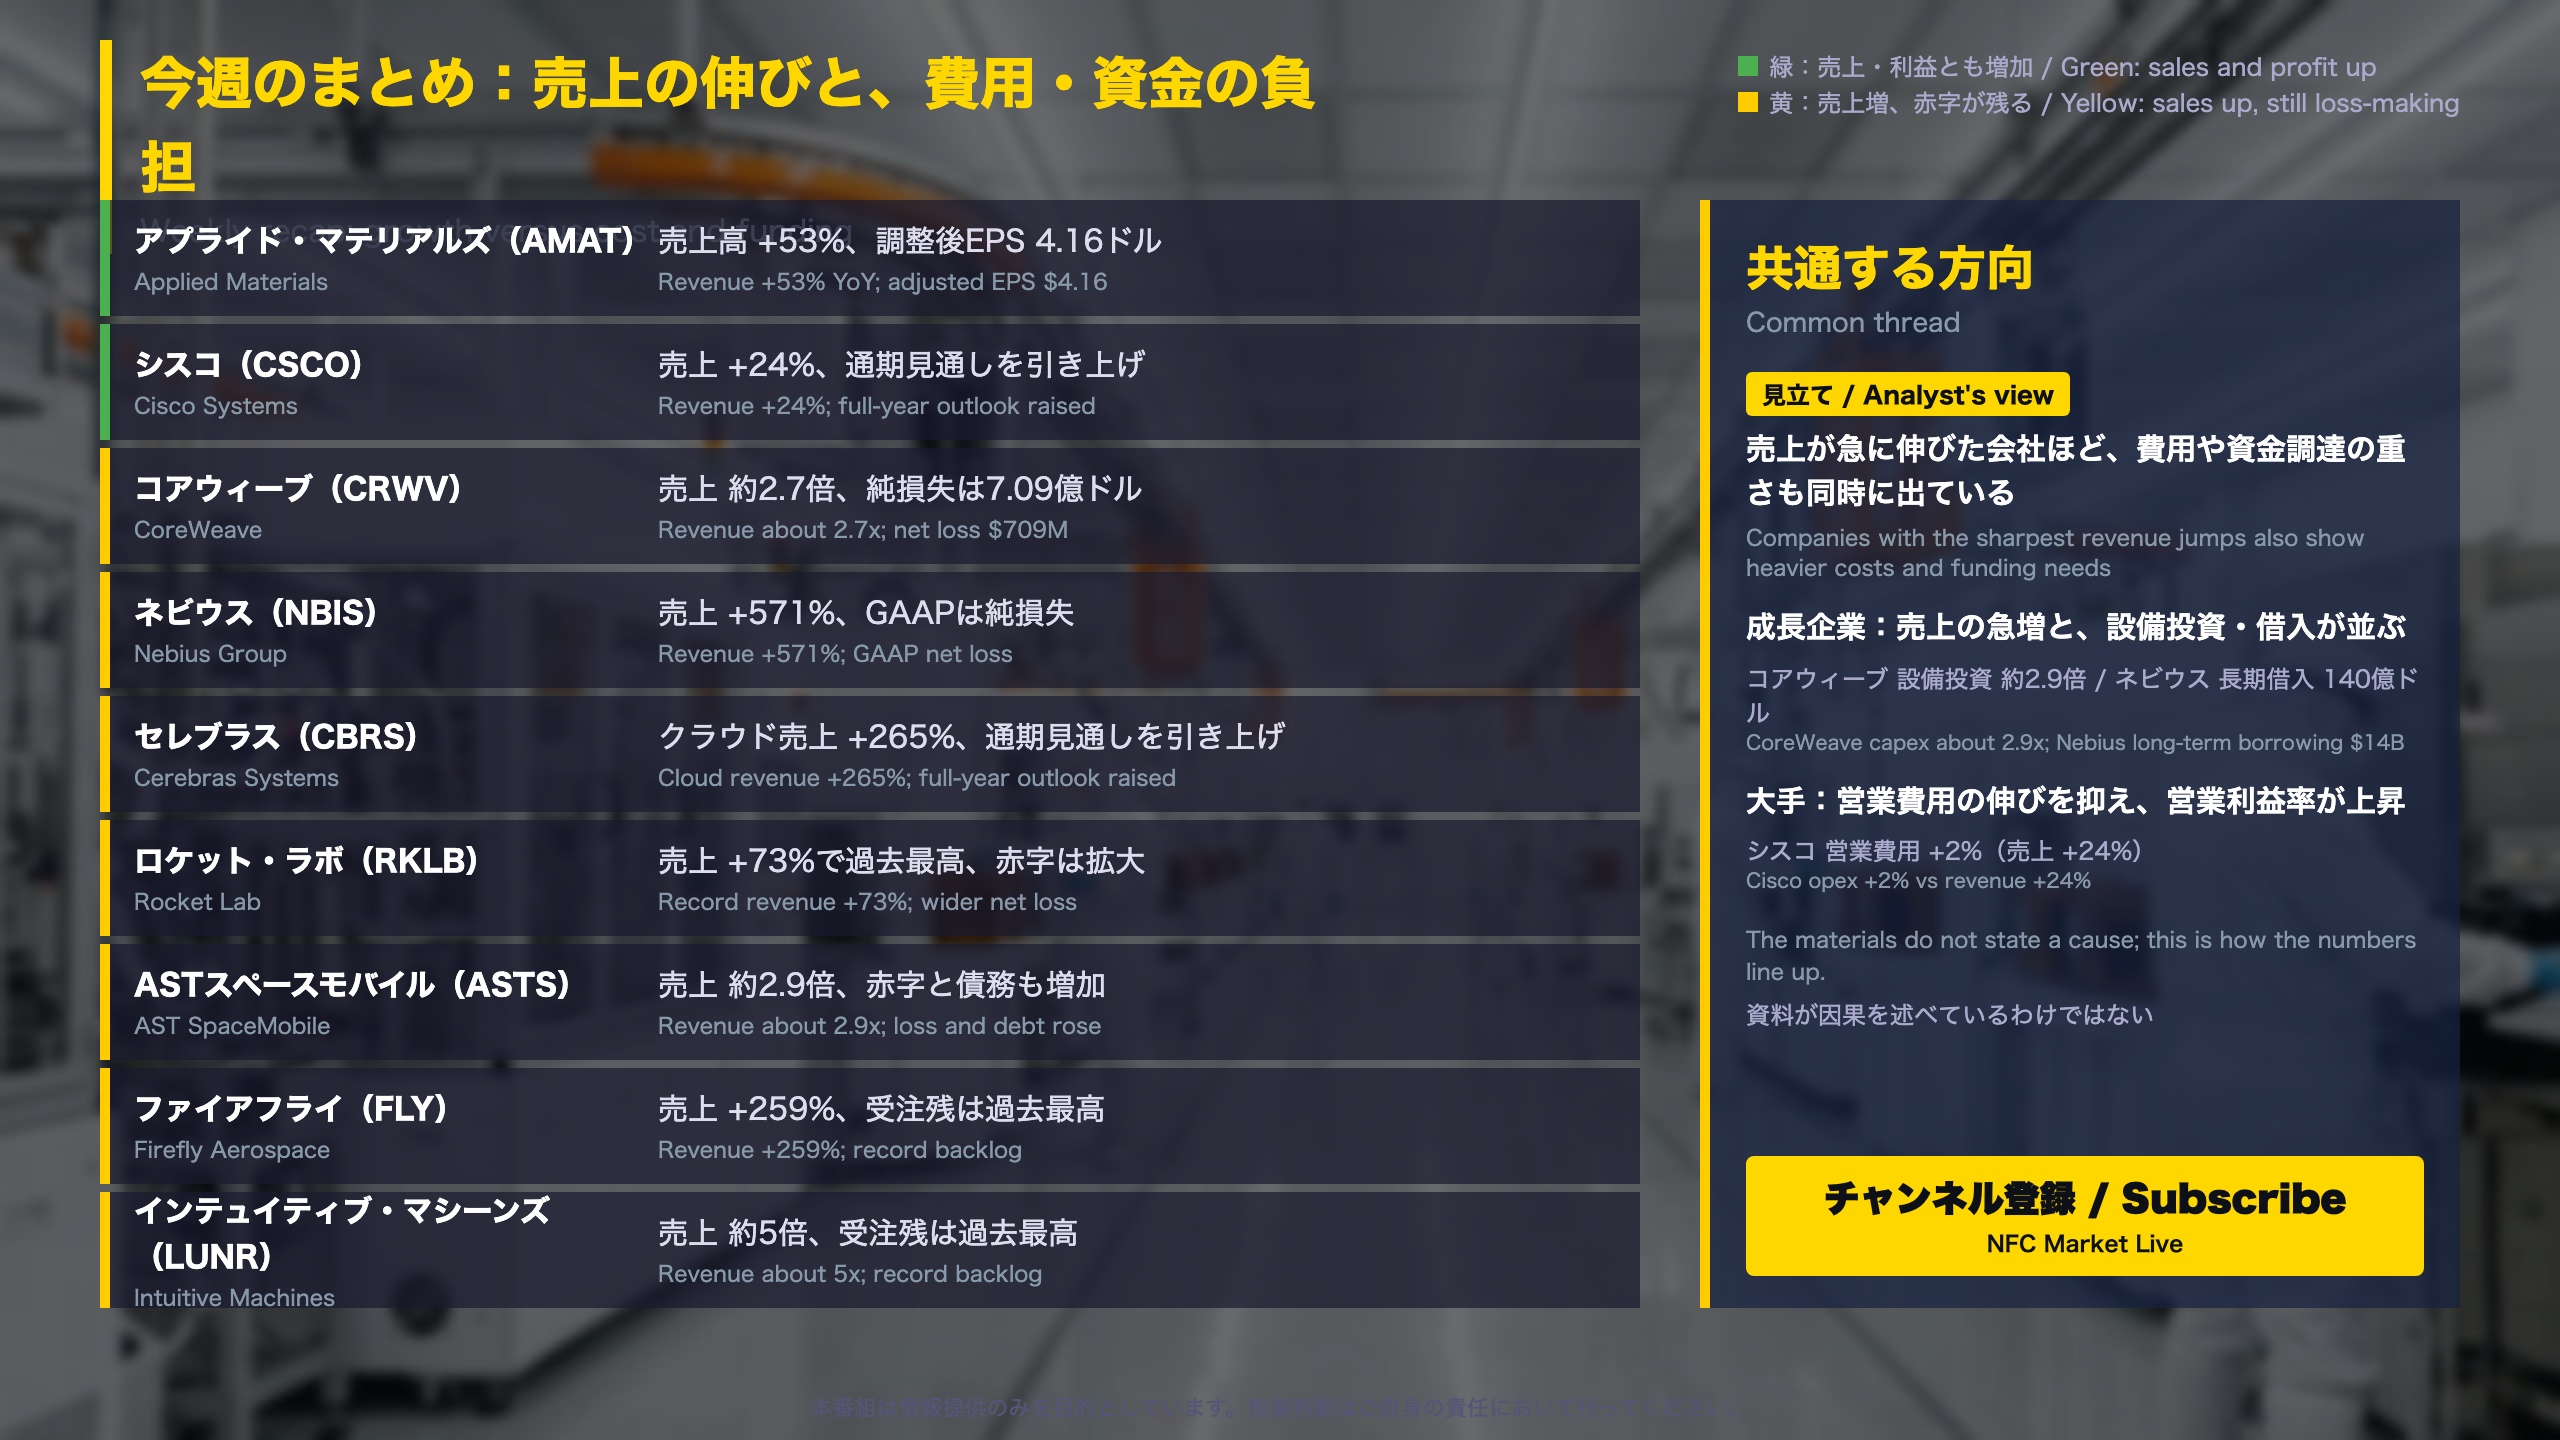
Revenue jumped at many of this week’s companies, but the profit and funding picture differs by company. Using figures from the source materials, they fall into three groups.
| Group | Company | Profit and funding snapshot |
|---|---|---|
| Large cap | Applied Materials | GAAP operating margin 35.1% vs 25.2%; operating cash flow $3.3B |
| Large cap | Cisco | Operating cash flow $4.36B (+36%); adjusted operating expenses +2% |
| AI cloud | CoreWeave | Operating income $207M, but net interest expense of $846M led to a $709M net loss |
| AI cloud | Nebius | Operating income $50.4M; net loss from continuing operations $37.5M |
| AI cloud | Cerebras | GAAP operating loss $224M; company-defined core net income $29.8M |
| Space | Rocket Lab | GAAP net loss $79.7M (vs $18.3M); backlog about $3.57B |
| Space | AST SpaceMobile | Operating expenses $211M against revenue of $42.3M |
| Space | Firefly | Net loss $94.2M; backlog $1.7B |
| Space | Intuitive Machines | Adjusted EBITDA +$8.3M, net loss $3.4M; backlog about $1.87B |
Company guidance (the companies’ own figures)
- Applied Materials: next-quarter revenue of $11.1B, plus or minus $0.5B
- Cisco: fiscal Q2 revenue of $18.0B-$18.2B
- CoreWeave: 2026 revenue of $13.0B-$13.3B
- Nebius: 2027 revenue of $12B-$13B
These are management targets, not outcomes.
Two readings
- Constructive: Several companies reported record backlogs, and contract balances tied to AI infrastructure are large.
- Cautious: Growth companies are funding expansion through borrowing and share issuance, and interest costs and losses remain.
None of the companies’ next earnings dates appear in the source materials.
Disclaimer: This article is for informational purposes only. All investment decisions are made solely at your own risk.