This article was automatically generated by the NFC Market Live AI analysis system. (Updated: 2026-11-19 10:11 JST)
📄 Primary Source
Australian Bureau of Statistics
https://www.abs.gov.au/statistics/labour/employment-and-unemployment/labour-force-australia/latest-release
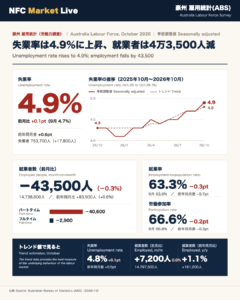
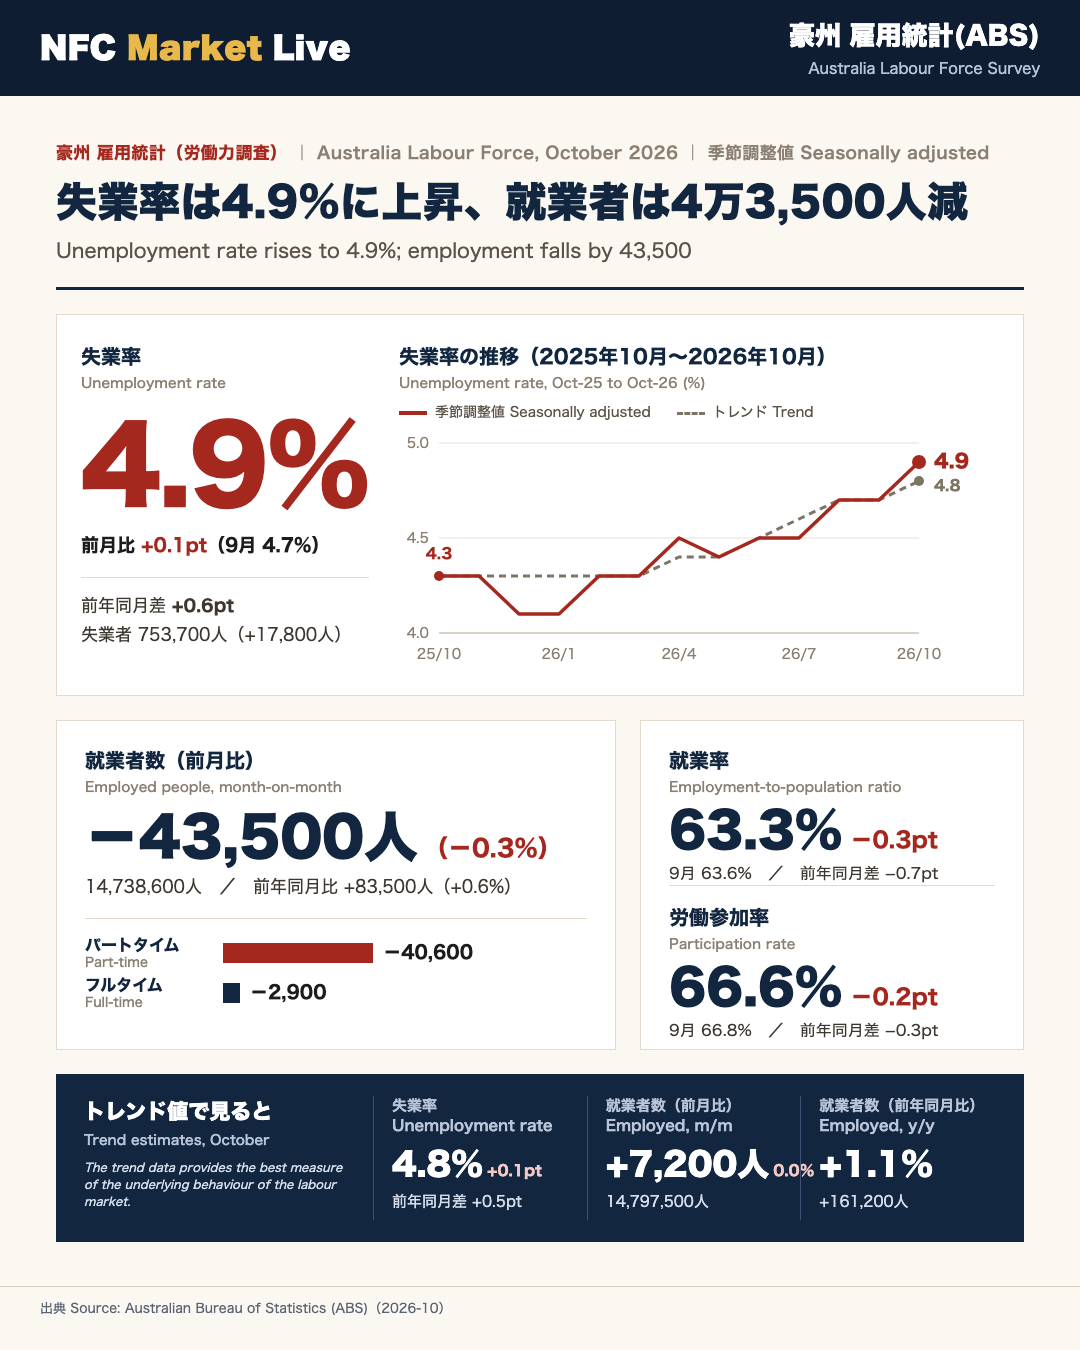
The Australian Bureau of Statistics (ABS) released its October 2026 Labour Force Survey on 19 November 2026. In seasonally adjusted terms, the unemployment rate rose 0.1 points to 4.9%, up 0.6 points from a year earlier. Employment fell 43,500 (-0.3%) to 14,738,600, though it is still 83,500 (0.6%) higher than a year ago. Full-time employment fell by 2,900 to 10,228,700, and part-time employment fell by 40,600 to 4,509,900. The employment-to-population ratio dropped 0.3 points to 63.3%, and the participation rate fell 0.2 points to 66.6%. The underemployment rate eased 0.1 point to 6.2%, while the underutilisation rate stayed at 11.1%. Monthly hours worked fell 0.2% to 2,006 million. In trend terms, the unemployment rate was 4.8% (+0.1 point) and employment was 14,797,500 (+7,200). The ABS adjusted weights for about 1,390 respondents (around 2.7% of the sample) in one Victorian rotation group, and noted that South Australia’s incoming rotation group had a higher unemployment rate. The ABS advises caution when interpreting short-term changes. The next release, covering November, is scheduled for 17 December 2026.
The Ultimate Summary:失業率4.9%へ上昇、就業者は減少
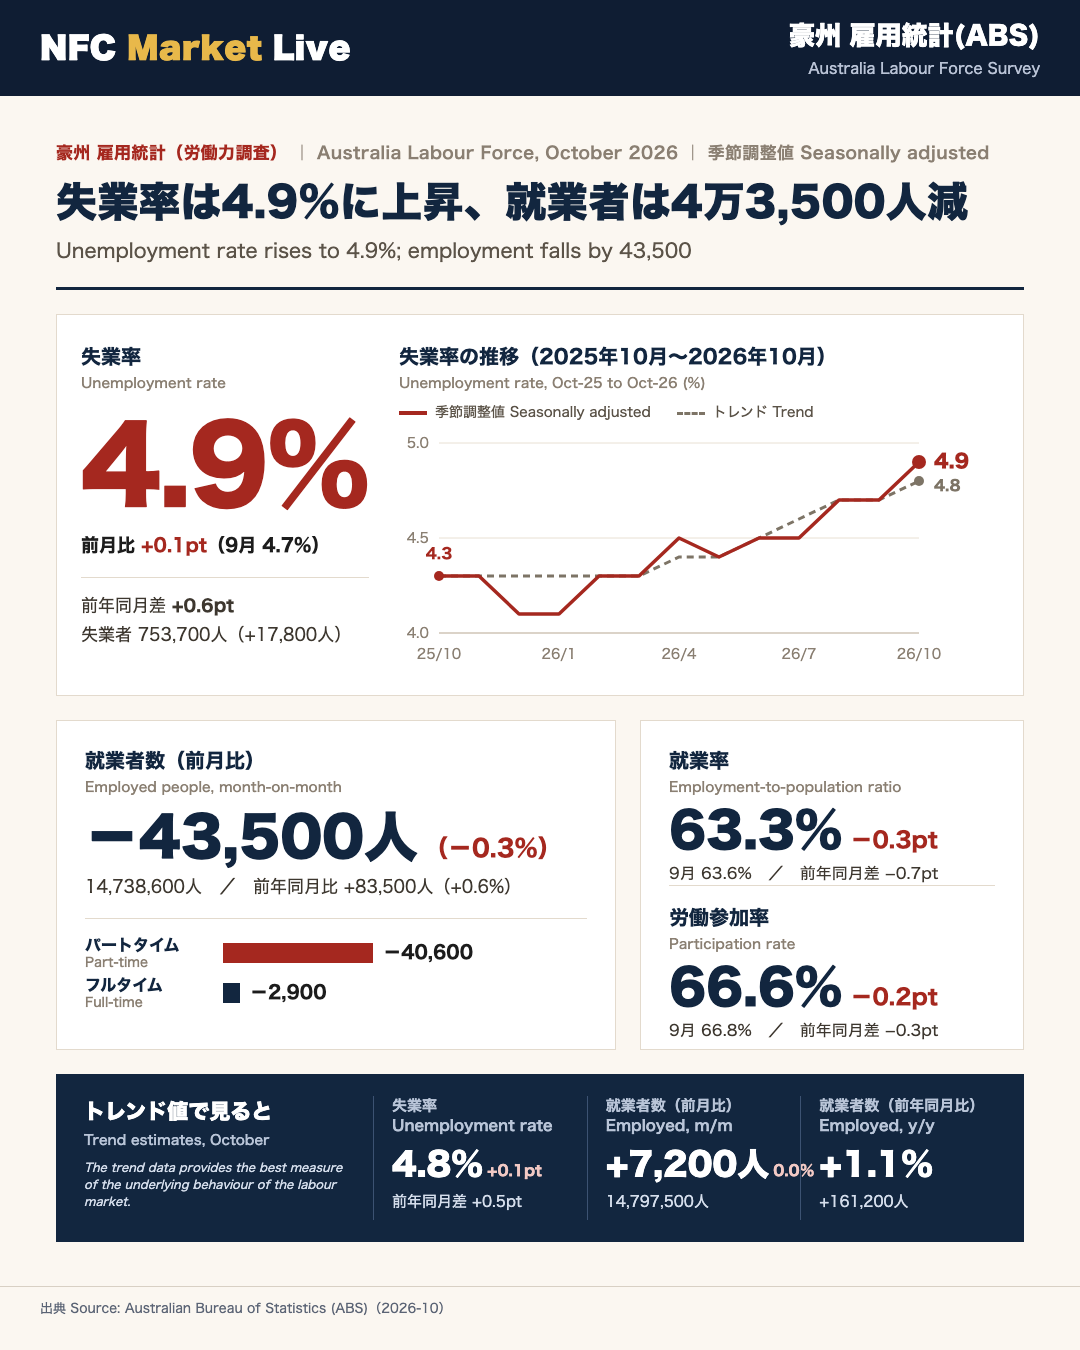
Australia’s October Labour Force Survey at a glance
The Australian Bureau of Statistics (ABS), the national statistics agency, published its monthly Labour Force Survey for October 2026 on 19 November 2026. In seasonally adjusted terms, the unemployment rate rose 0.1 points to 4.9%, while employment fell 43,500 (-0.3%) to 14,738,600. The ABS headline reads “Unemployment rate rises to 4.9%”.
Key numbers (seasonally adjusted)
| Indicator | June release | Sep | Oct |
|---|---|---|---|
| Unemployment rate | 4.4% | 4.7% | 4.9% |
| Employed people | 14,823,300 | 14,782,200 | 14,738,600 |
| Employment-to-population ratio | 64.0% | 63.6% | 63.3% |
| Participation rate | 67.0% | 66.8% | 66.6% |
| Underemployment rate | 6.5% | 6.3% | 6.2% |
June figures are as first published. The latest tables show June revised to 4.5% unemployment and 14,806,300 employed.
Reading both sides
- Softer: unemployment is 0.6 points higher than a year ago, and the employment ratio is 0.7 points lower.
- More resilient: employment is still 83,500 (0.6%) above a year earlier. Full-time jobs slipped by only 2,900, underemployment eased, and trend employment was roughly flat (+7,200).
Why the trend series matters
The survey is sample-based, so single-month moves carry sampling noise. The ABS itself “recommends exercising a degree of caution in interpreting short-term changes” and points to trend data as the best gauge of underlying behaviour. The trend unemployment rate is 4.8%. As with household-survey labour data elsewhere, such as the US, one month rarely settles the picture. This note sticks to what the ABS data show and draws no policy or currency conclusions.
ヘッドライン3指標:失業率・就業者数・参加率の中身
What sits behind the 4.9% unemployment rate
Falling employment and a lower participation rate arrived together
The number of unemployed people rose 17,800 to 753,700, while employment fell 43,500 and the participation rate dropped 0.2 points to 66.6%. Adding employed and unemployed people from the ABS tables gives a labour force of roughly 15.518 million in September and 15.492 million in October, about 25,700 smaller. That suggests the rise in unemployment reflects fewer people working and some leaving the labour market, not a surge of new job seekers. It is a single-month reading, so it should be treated cautiously.
Versus last month and last year
| Sep | Oct | YoY change | |
|---|---|---|---|
| Unemployment rate | 4.7% | 4.9% | +0.6pt |
| Employment-to-population | 63.6% | 63.3% | -0.7pt |
| Participation rate | 66.8% | 66.6% | -0.3pt |
A rounding quirk
The published rates move from 4.7% to 4.9%, but the ABS describes a 0.1-point rise in unrounded terms. The underlying series runs from about 4.74% to about 4.86%.
Gender and youth
Male unemployment is 5.0% (+0.1) and female 4.7% (+0.1). The youth rate is 11.3% (+0.1). Male participation fell 0.3 points to 70.3%, and female participation fell 0.1 point to 63.0%.
Two readings
A cautious view stresses the second straight monthly rise and the 0.6-point annual increase. A neutral view notes that the trend rate is 4.8% (+0.1) and that employment remains above its year-ago level. The ABS data do not settle between the two.
雇用の「質」:フルタイム・パートタイム・労働時間
The October fall in employment was concentrated in part-time work
Employment fell 43,500 in October. Full-time employment slipped 2,900 to 10,228,700, while part-time employment fell 40,600 to 4,509,900. In other words, part-time work accounts for roughly 93% of the net decline.
“Full-time employment decreased by 2,900 to 10,228,700 people, and part-time employment decreased by 40,600 to 4,509,900 people.”
Versus the June release (derived from ABS figures)
| June (as published) | Oct | Difference | |
|---|---|---|---|
| Full-time | 10,173,500 | 10,228,700 | +55,200 |
| Part-time | 4,649,800 | 4,509,900 | -139,900 |
| Full-time share | ~68.6% | ~69.4% | +0.8pt |
June figures are as first published and do not reflect later revisions.
Hours and spare capacity
- Monthly hours worked fell 0.2% to 2,006 million, a slightly smaller drop than employment (-0.3%).
- Year on year, hours are up 0.7% against employment up 0.6%.
- Underemployment eased to 6.2% (-0.1), but the underutilisation rate, which combines unemployed and underemployed people, was unchanged at 11.1%. That is high relative to anything shown since 2022.
Balance
The resilient side: full-time jobs held up, and hours per worker do not look weaker on an annual basis. The softer side: spare capacity remains elevated, and both employment and hours fell together this month. The data show what changed, but not why. The ABS release does not attribute the part-time decline to a cause.
州別・属性別と、調査上の注意点(ウェイト調整・ローテーショングループ)
Wide state-by-state dispersion, and survey caveats
States (seasonally adjusted)
| State | Employment (m/m) | Unemployment rate (change) |
|---|---|---|
| New South Wales | -0.2% | 4.6% (-0.1) |
| Victoria | +0.1% | 5.4% (+0.3) |
| Queensland | -0.3% | 4.8% (+0.3) |
| South Australia | -0.5% | 4.8% (+0.6) |
| Western Australia | -1.1% | 4.5% (+0.2) |
| Tasmania | +0.7% | 5.4% (+0.4) |
Unemployment rose in five of six states; New South Wales was the exception. Western Australia saw its employment ratio fall 0.9 points and participation fall 0.7 points, while Tasmania improved on both. State monthly samples are small, so swings are larger than national ones.
Survey notes from the ABS
The Labour Force Survey rotates its sample through eight groups. In October the ABS adjusted weights for about 1,390 respondents (around 2.7% of the sample) in one Victorian rotation group, and reported that South Australia’s incoming group had a higher unemployment rate than others. By rotation group, unemployment was 4.5% for the September outgoing group, 5.1% for the October incoming group, 4.7% for the October outgoing group, and 4.7% in the original October estimate.
“The ABS will continue to monitor this rotation group as they continue to progress through their time in our survey.”
Versus June
In June, the ABS adjusted roughly 2,700 respondents (about 6% of the sample) in New South Wales and Victoria. This month’s adjustment is narrower. Whether sampling effects fade is something only future releases can show. For now, the state-level moves, especially South Australia’s +0.6 points, are best read with caution.
トレンドで見る基調と次回の確認点
Smoothing the noise: what the trend series says
The ABS describes trend data as the best measure of the labour market’s underlying behaviour. For October:
Trend figures
- Unemployment rate: 4.8% (+0.1 point; +0.5 point on a year ago)
- Employment: 14,797,500 (+7,200, 0.0%; +1.1% year on year)
- Employment-to-population ratio: 63.6% (-0.1)
- Participation rate: 66.8% (unchanged)
- Underemployment rate: 6.3% (unchanged); underutilisation 11.0%
- Monthly hours worked: 2,007 million (+0.1%)
Unemployment rate path (latest tables)
| Jun | Jul | Aug | Sep | Oct | |
|---|---|---|---|---|---|
| Trend | 4.5% | 4.6% | 4.7% | 4.7% | 4.8% |
| Seasonally adjusted | 4.5% | 4.5% | 4.7% | 4.7% | 4.9% |
The June trend rate was first published as 4.4% and now shows 4.5% after revision.
Balance
On the softer side, the trend unemployment rate has risen gradually and the employment ratio is trending down. On the more resilient side, trend employment is still 1.1% above a year ago and participation is steady, so the trend data do not show a sharp deterioration.
What to check next
The November survey is due on 17 December 2026, with December data on 21 January 2027. Points to watch: whether the seasonally adjusted rate stays near 4.9%, how the trend rate moves from 4.8%, whether part-time employment keeps falling, and whether the employment ratio (63.3%) and participation (66.6%) recover. This note draws no policy or currency conclusions.
Disclaimer: This article is for informational purposes only. All investment decisions are made solely at your own risk.