This article was automatically generated by the NFC Market Live AI analysis system. (Updated: 2026-11-19 17:53 JST)
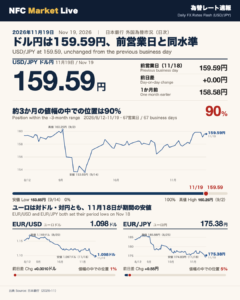
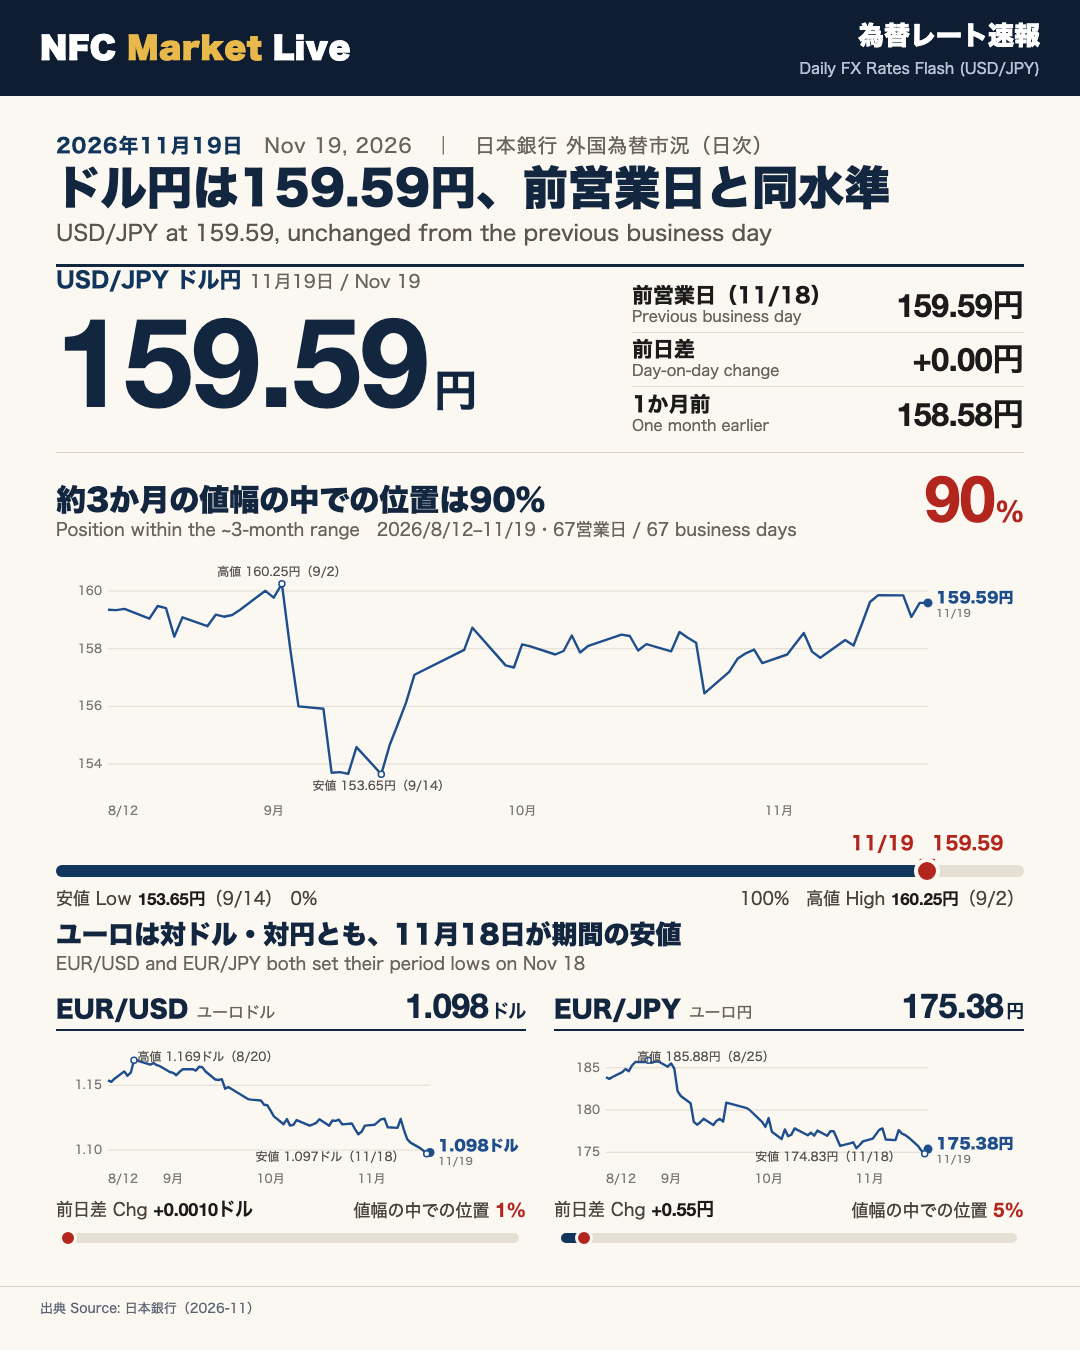
📊 According to the Bank of Japan’s daily FX market data, USD/JPY stood at 159.59 yen on November 19, 2026. The previous business day (November 18) was also 159.59 yen, so the day-over-day change was +0.00 yen. One month earlier the rate was 158.58 yen.
📈 Within the roughly three-month window covered (August 12 to November 19, 67 business days), the high was 160.25 yen on September 2 and the low was 153.65 yen on September 14. The latest reading sits at 90% of the range (0% = low, 100% = high).
💶 EUR/USD was 1.098 (previous day 1.097, change +0.0010, one month earlier 1.123). The window’s high was 1.169 on August 20 and the low was 1.097 on November 18, putting the latest reading at 1% of the range.
💴 EUR/JPY was 175.38 yen (previous day 174.83, change +0.55 yen, one month earlier 177.49). The high was 185.88 on August 25 and the low was 174.83 on November 18, putting the latest reading at 5% of the range.
In the daily series, USD/JPY has stayed in the 159 yen range from November 12 through November 19.
ドル円は159.59円、前日と同水準
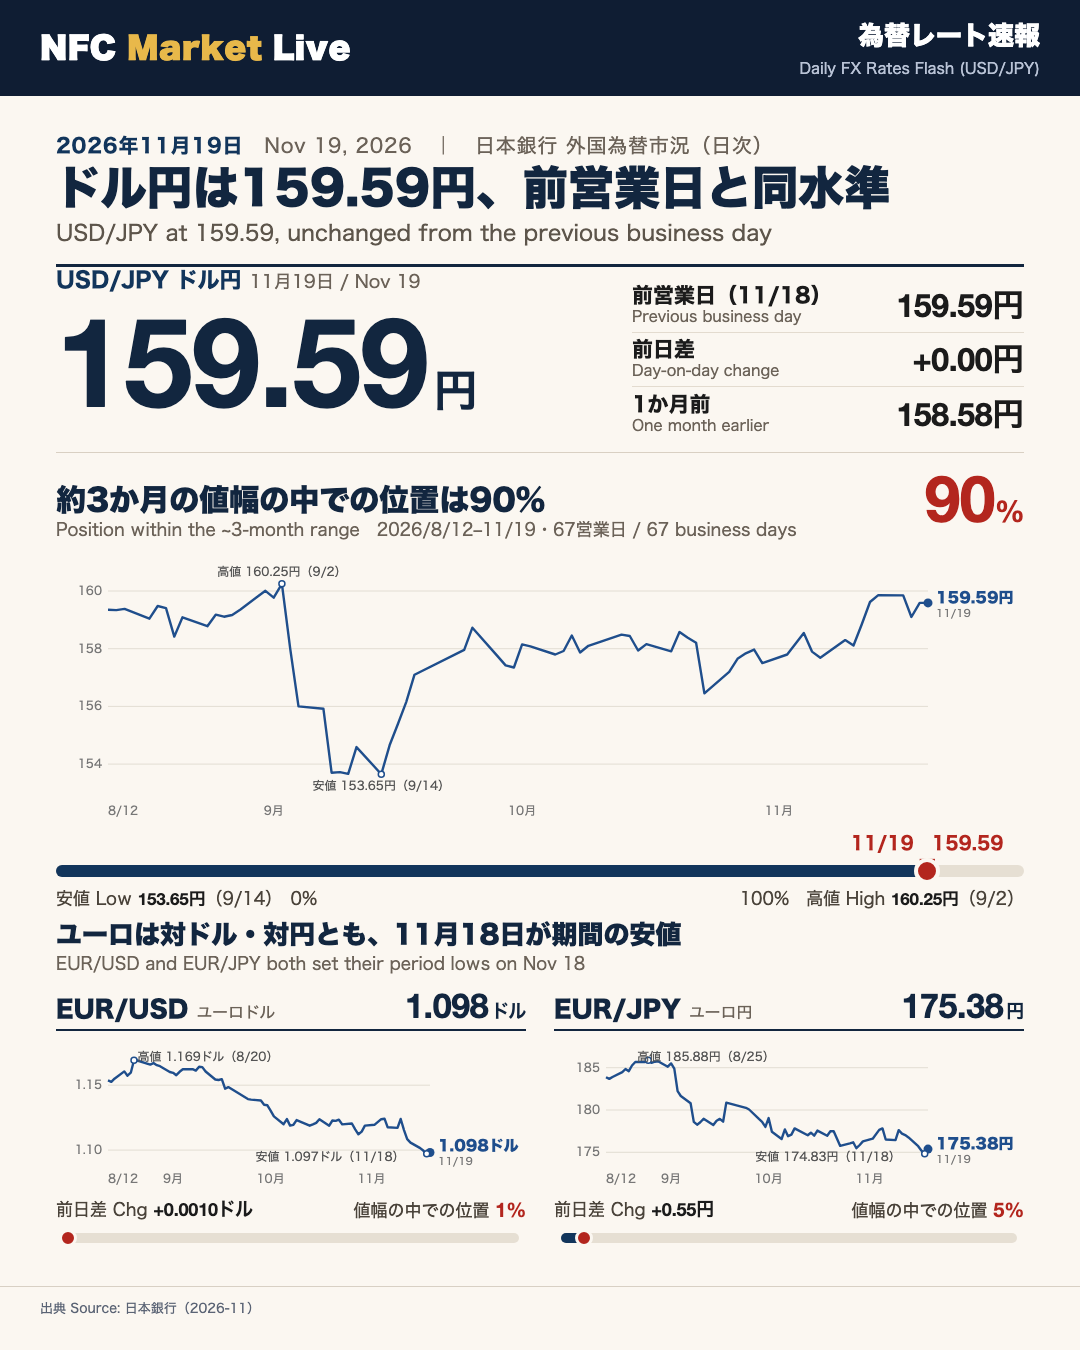
USD/JPY at 159.59, unchanged from the prior business day
The Bank of Japan’s daily FX market series shows USD/JPY at 159.59 yen on November 19, 2026. The previous business day (November 18) was also 159.59 yen, so the day-over-day change was +0.00 yen.
| Item | USD/JPY |
|---|---|
| Nov 19, 2026 | 159.59 |
| Prior business day (Nov 18) | 159.59 |
| Day-over-day change | +0.00 |
| One month earlier | 158.58 |
The latest level is above the reading from one month earlier.
Recent daily readings
In the daily series, USD/JPY printed 159.62 on Nov 12, 159.86 on Nov 13, 159.85 on Nov 16, 159.10 on Nov 17, and 159.59 on both Nov 18 and Nov 19. Every reading since November 12 has been in the 159 yen range.
約3か月の値幅の中での位置は90%
Where the latest reading sits in the window
For the window covered (August 12 to November 19, 2026; 67 business days), USD/JPY’s extremes were:
- High: 160.25 yen (September 2)
- Low: 153.65 yen (September 14)
- November 19: 159.59 yen
The latest level sits at 90% of the range (0% = low, 100% = high). It has not yet reached the window’s high of 160.25 yen.
How the series moved
The daily values show USD/JPY hovering around 159 yen in August and printing the 160.25 high on September 2. The next business day, September 3, was 158.00, and the low of 153.65 came on September 14. From late September through October the rate was mostly in the 157-158 range, and since November 12 it has been in the 159 range.
ユーロドル・ユーロ円の水準
EUR/USD and EUR/JPY
| Item | EUR/USD | EUR/JPY |
|---|---|---|
| Nov 19 | 1.098 | 175.38 |
| Prior business day (Nov 18) | 1.097 | 174.83 |
| Day-over-day change | +0.0010 | +0.55 |
| One month earlier | 1.123 | 177.49 |
| Window high | 1.169 (Aug 20) | 185.88 (Aug 25) |
| Window low | 1.097 (Nov 18) | 174.83 (Nov 18) |
| Position in range | 1% | 5% |
For both EUR/USD and EUR/JPY, the prior business day (November 18) was the low of the window (August 12 to November 19). On November 19 both rose slightly from that day. Their positions within the range are 1% for EUR/USD and 5% for EUR/JPY (0% = low, 100% = high).
Disclaimer: This article is for informational purposes only. All investment decisions are made solely at your own risk.