📺 Watch the Full Video Analysis
This article was automatically generated by the NFC Market Live AI analysis system. (Updated: 2026-09-11 05:44 JST)
Oracle (NYSE: ORCL) reported Q1 FY2027 earnings. 📊
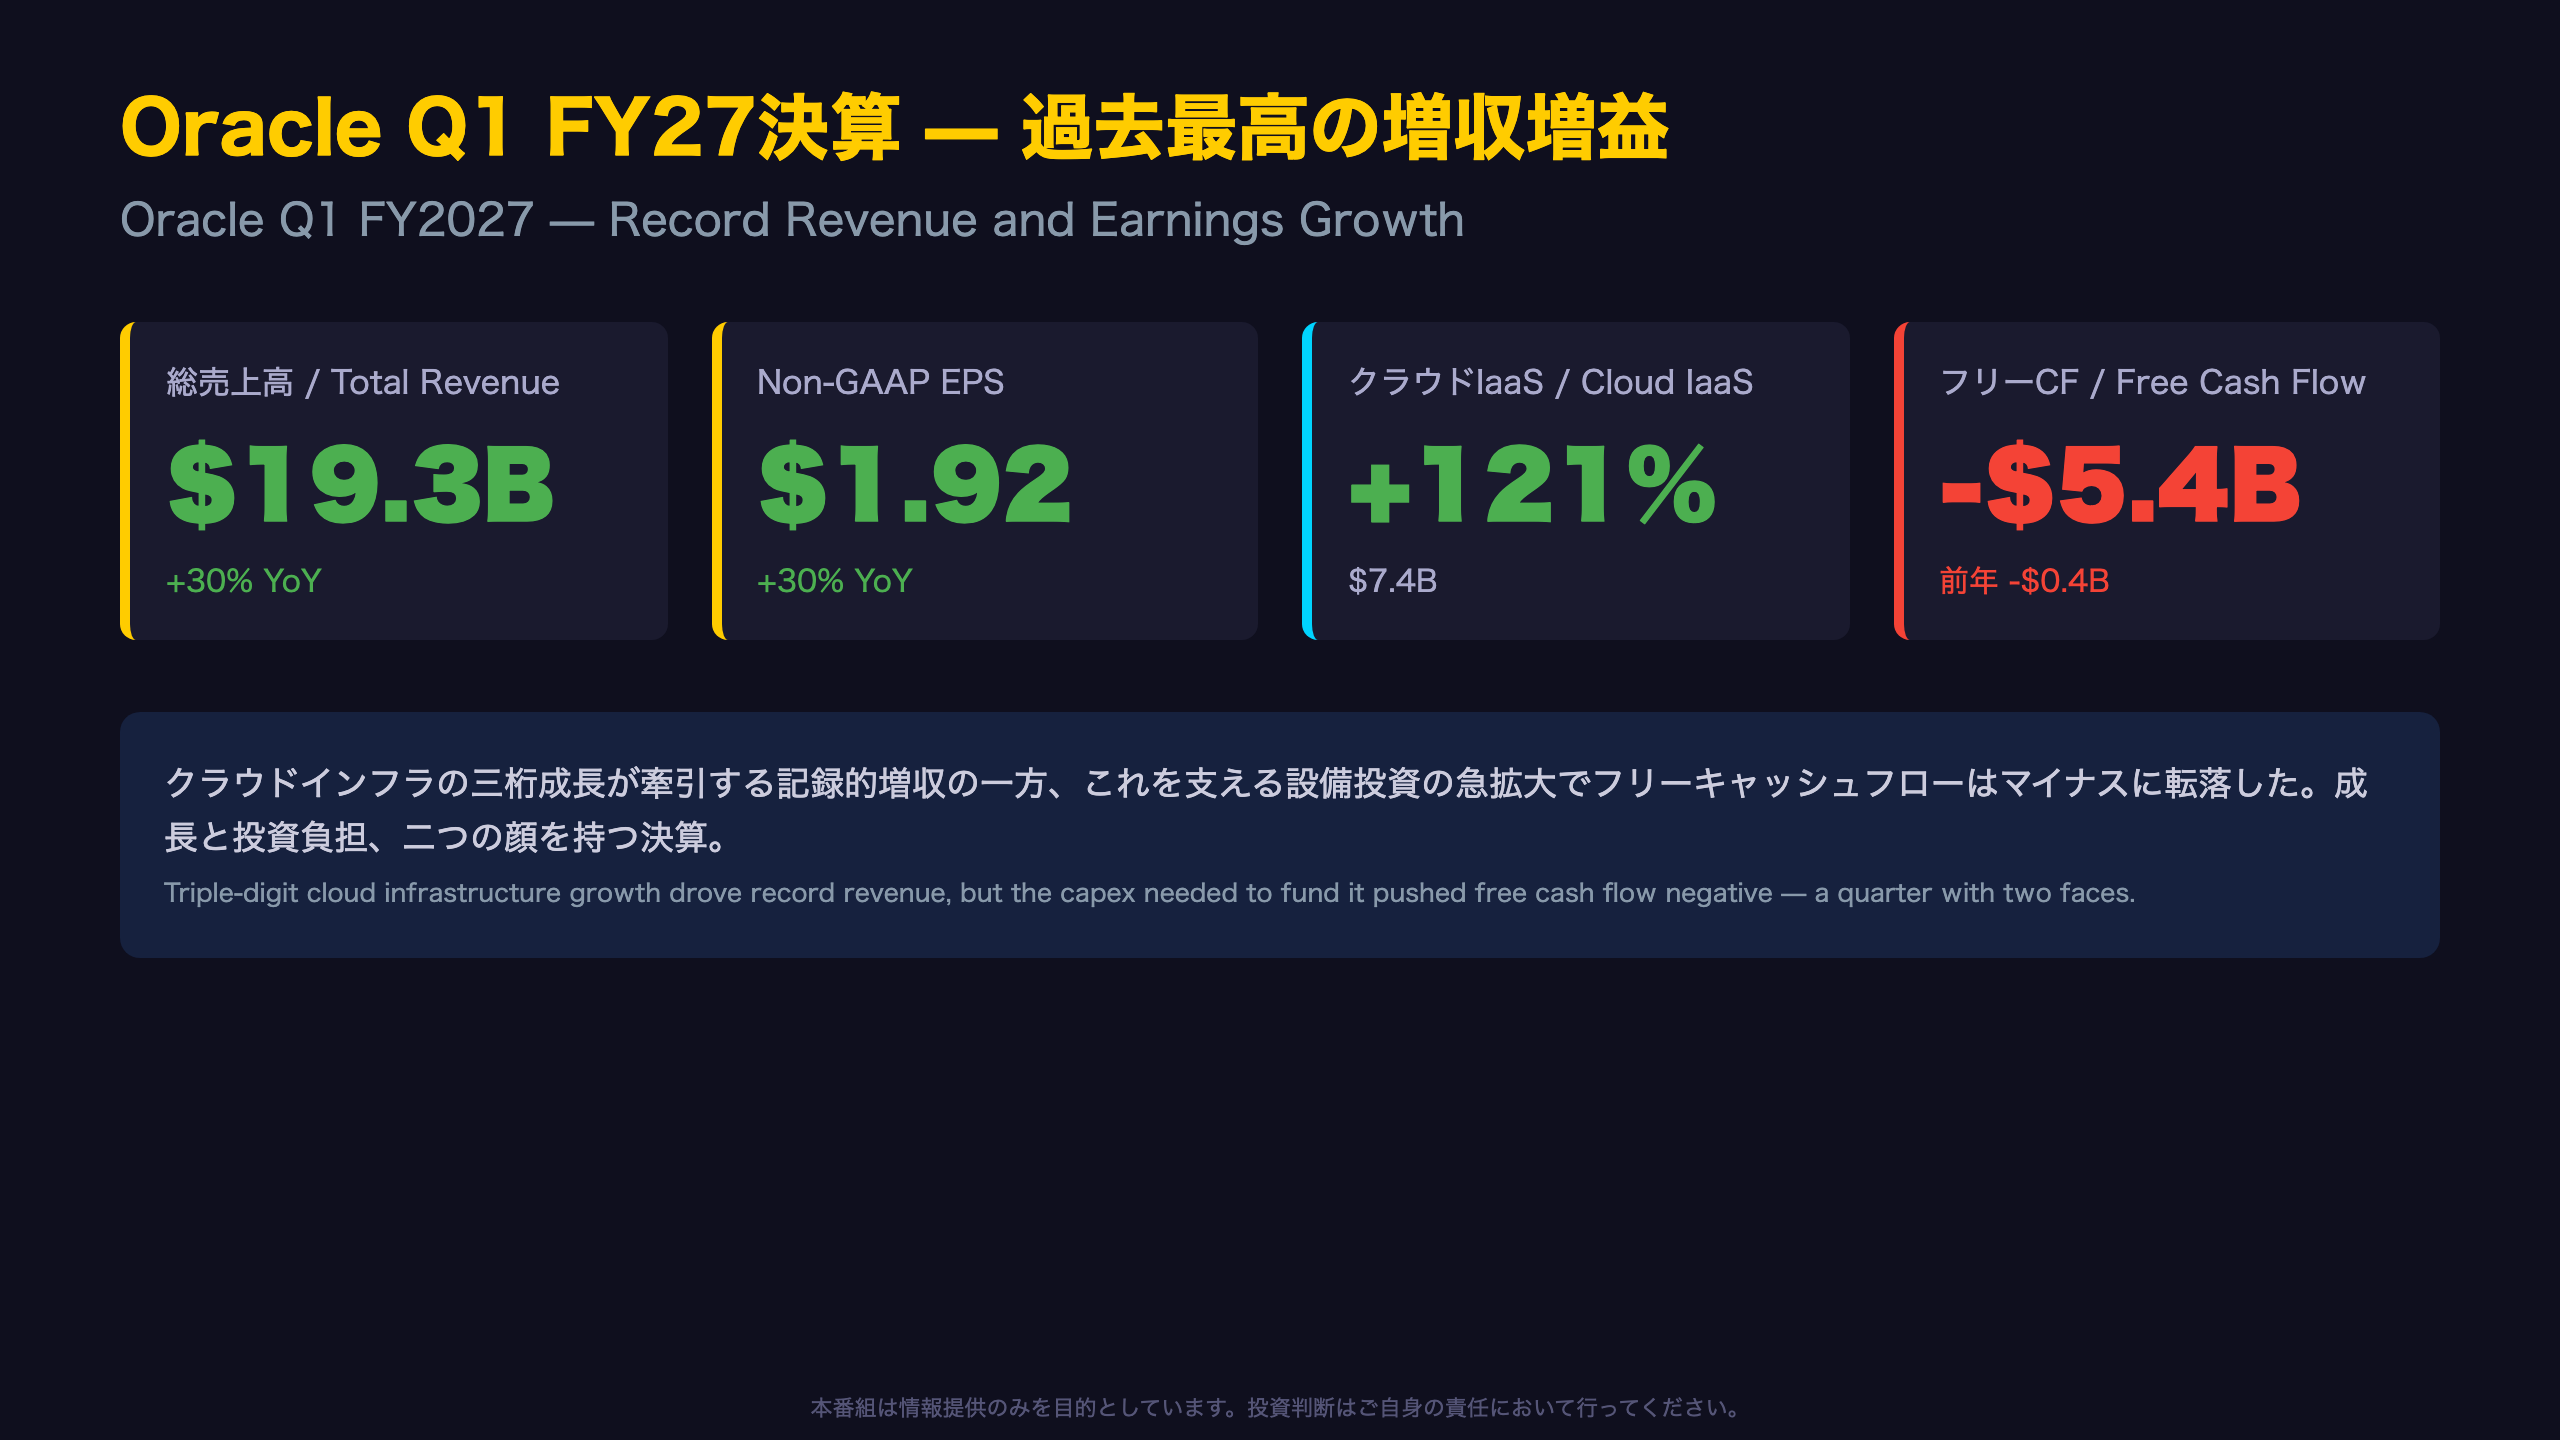
Total revenue hit a record $19.3B (+30% YoY), Non-GAAP EPS reached $1.92 (+30% YoY).
📈 Cloud Infrastructure (IaaS) revenue rocketed 121% YoY to $7.4B, extending triple-digit growth. RPO surged $209B YoY to $664B.
⚠️ But capital expenditures ballooned to $28.5B, pushing Free Cash Flow to negative $5.4B. We break down the GAAP and Non-GAAP numbers behind Oracle’s AI infrastructure investment cycle.
💡 Also covering Q2 FY27 guidance and the raised full-year revenue outlook of at least $90B.
Oracle Q1 FY27決算:記録的増収の裏でキャッシュ収支が急激悪化
The Big Picture
Oracle’s fiscal Q1 2027 (June-August 2026) closed with record total revenue of $19.345 billion (+30% YoY) and Non-GAAP EPS of $1.92 (+30% YoY).
For context, Oracle’s fiscal year runs June-May, so this is the first quarter of FY2027 for a company whose reporting calendar differs from the calendar year — a detail that can confuse investors used to calendar-year fiscal reporting common among most US tech peers.
Looking at the trailing four quarters of FY2026, total revenue growth accelerated steadily: 12% → 14% → 22% → 21%, before jumping to 30% this quarter. This is not an isolated spike but the continuation of a multi-quarter acceleration trend.
The press release explicitly attributes this to infrastructure execution: “the delivery of 850MW additional datacenter capacity.” This is a physical capacity metric rare among software companies, underscoring how capital-intensive Oracle’s cloud pivot has become.
Bull vs. Bear
- Bull case: Remaining Performance Obligations (RPO) — Oracle’s backlog metric — surged to $664 billion, providing strong forward revenue visibility.
- Bear case: To fund this growth, capital expenditures exploded, pushing free cash flow to a negative $5.4 billion. For context, US mega-cap peers rarely report negative free cash flow at this scale, making Oracle’s cash burn a distinctive feature of this earnings cycle.
Subsequent slides break down exactly where this growth and cash burn are concentrated.
GAAP・Non-GAAPともに大幅増益 — 営業利益率は35%へ改善
Reading Between GAAP and Non-GAAP
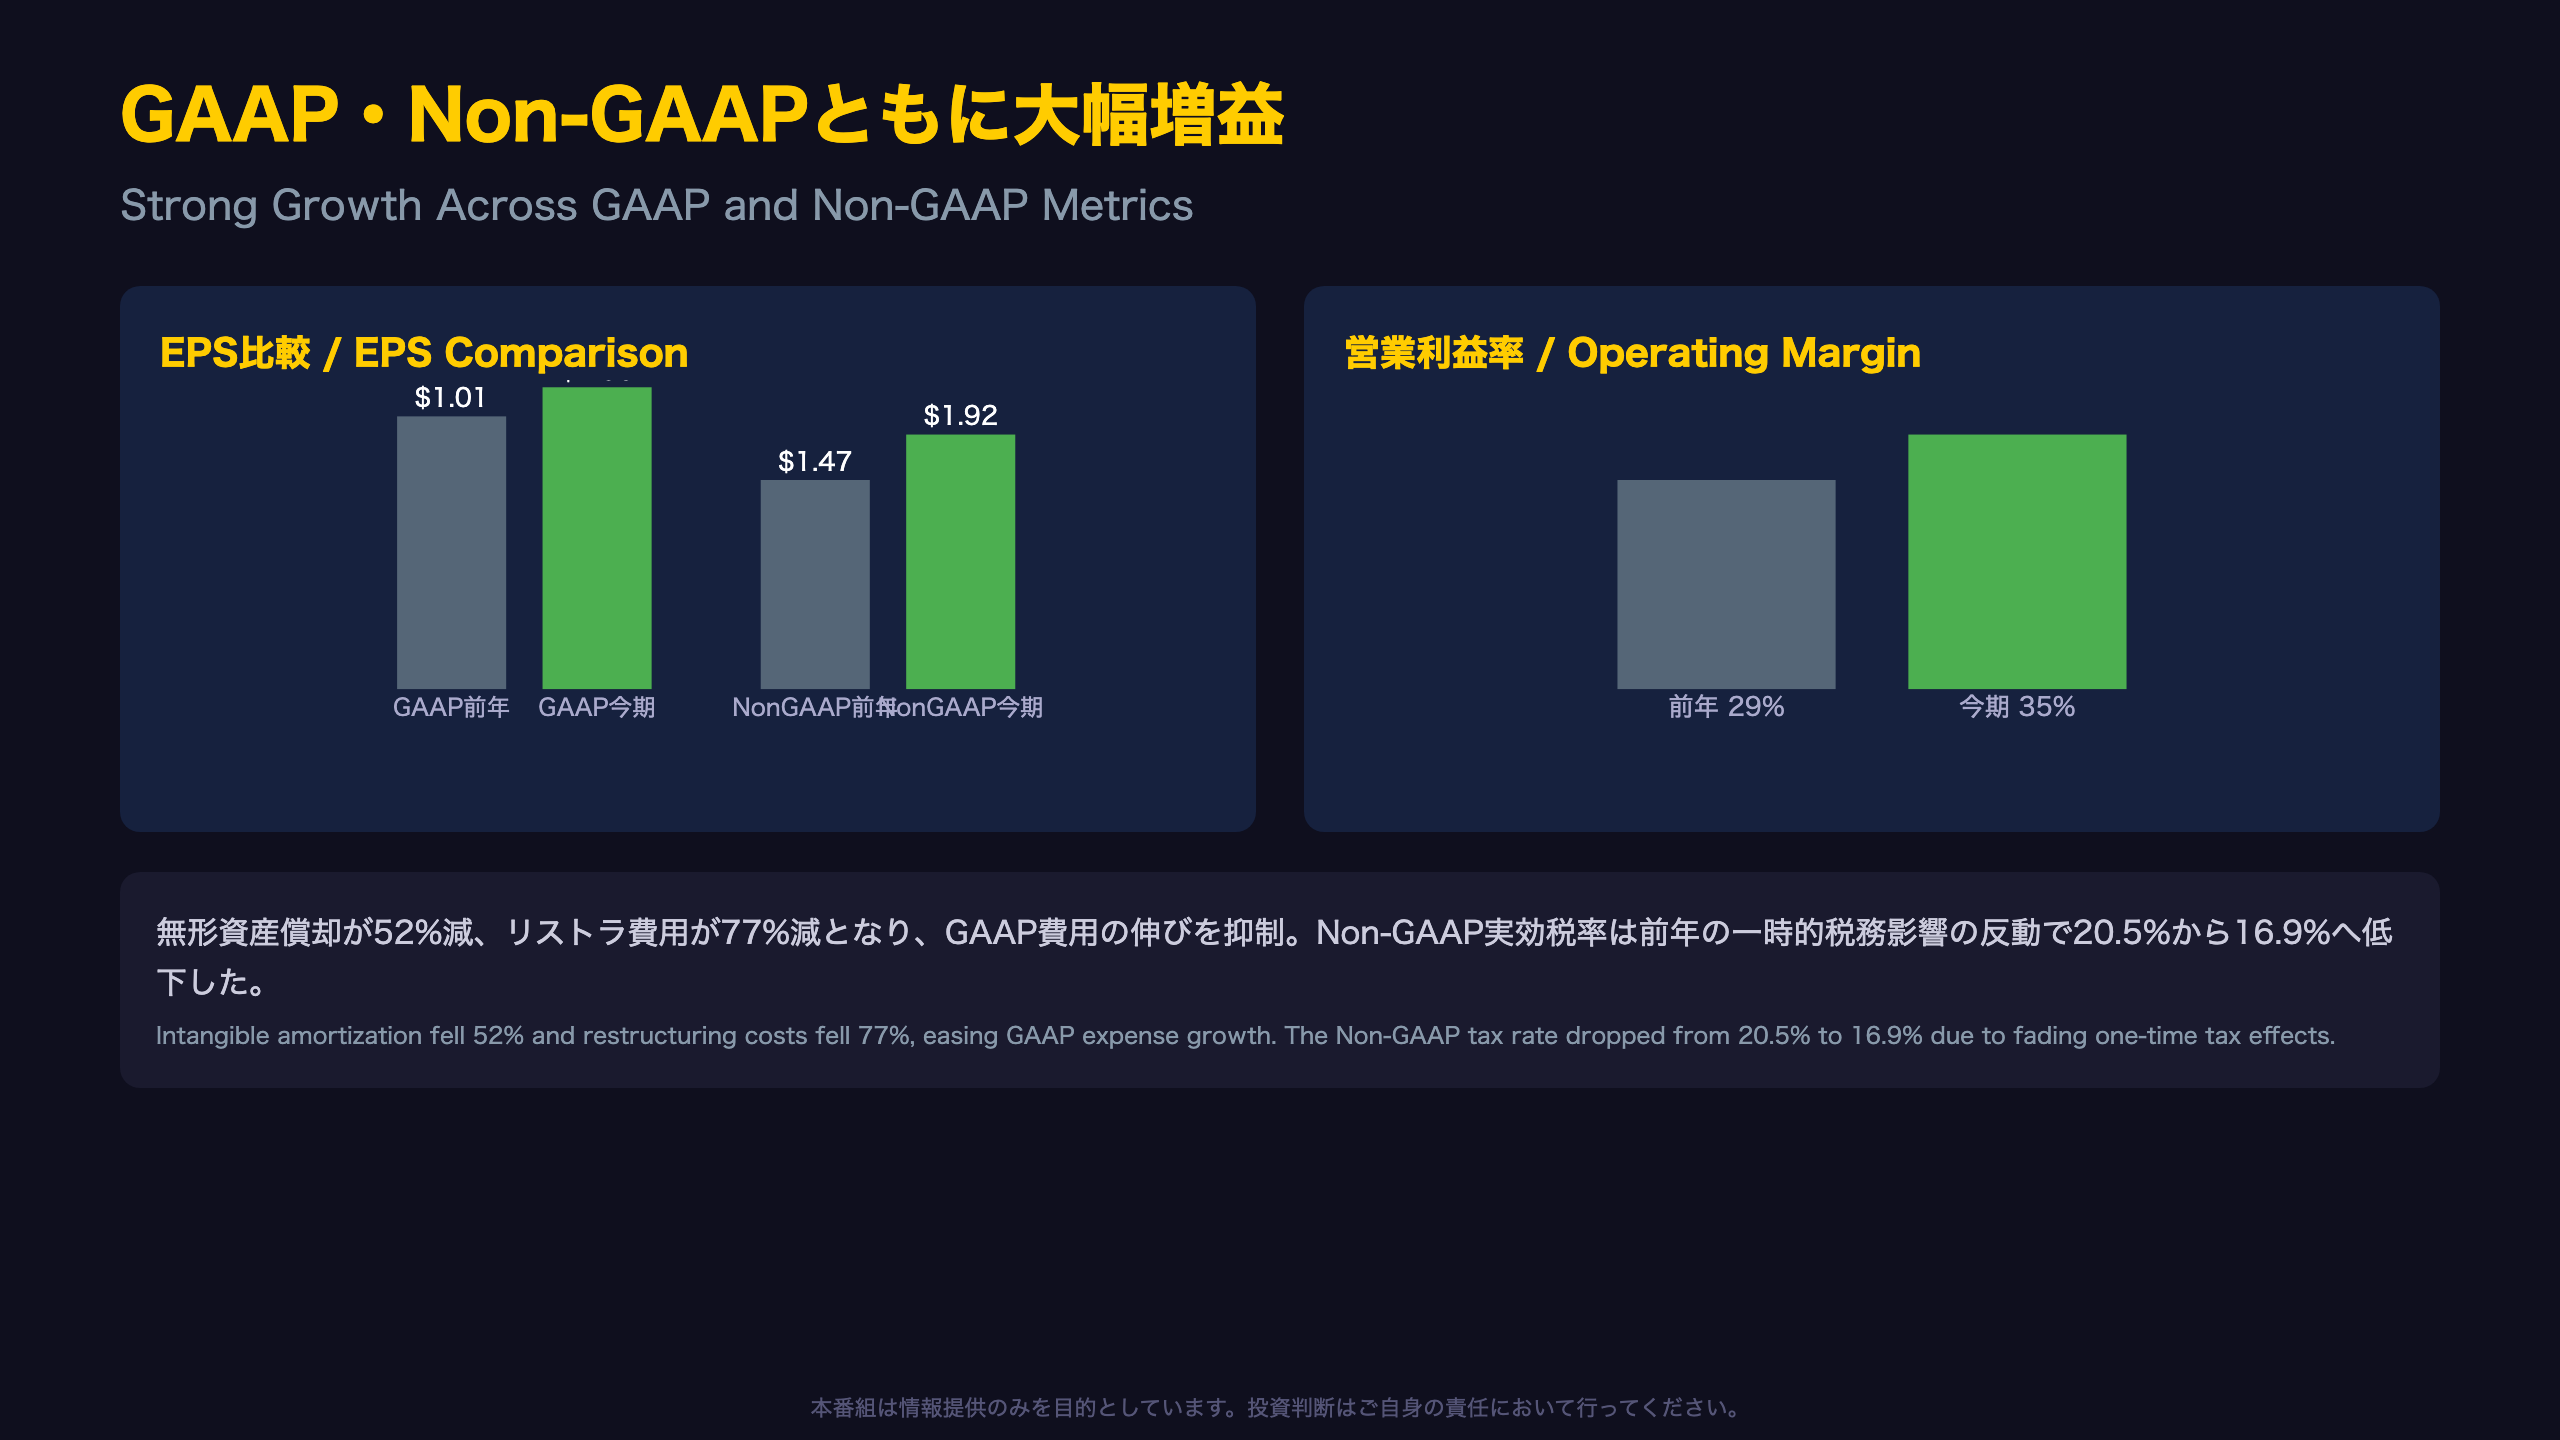
Both GAAP and Non-GAAP metrics posted strong growth this quarter, but the adjustments reveal important nuance for investors unfamiliar with Oracle’s reconciliation methodology.
Key Adjustment Items (Q1 FY27 vs Q1 FY26, in millions)
| Item | This Quarter | Prior Year |
|---|---|---|
| Stock-based compensation | $1,127 | $1,124 |
| Intangible amortization | $202 | $420 (-52%) |
| Restructuring & other | $94 | $415 (-77%) |
While stock-based compensation was essentially flat, both intangible amortization and restructuring costs fell sharply — suggesting that the drag from past acquisitions is fading, a structurally positive (though non-recurring in nature) tailwind to reported GAAP expenses.
Tax Rate Dynamics
The GAAP effective tax rate was 15.1% (vs. 14.6% a year ago), while the Non-GAAP effective rate dropped to 16.9% from 20.5%. This decline largely reflects the fading impact of a one-time $958 million tax charge related to the 2025 “One, Big, Beautiful Bill Act” legislation recorded in the prior-year quarter.
For US-based readers familiar with GAAP/Non-GAAP reconciliations common among large-cap tech (similar to how companies like Salesforce or Adobe report), this pattern is standard. But it’s worth noting: some of this quarter’s margin improvement stems from non-recurring prior-year comparisons rather than purely structural efficiency gains — a nuance often lost in headline EPS-beat narratives.
クラウドインフラが牽引役 — IaaS売上は前年比121%増の74億ドル
Segment Deep-Dive: Accelerating IaaS, Plateauing SaaS
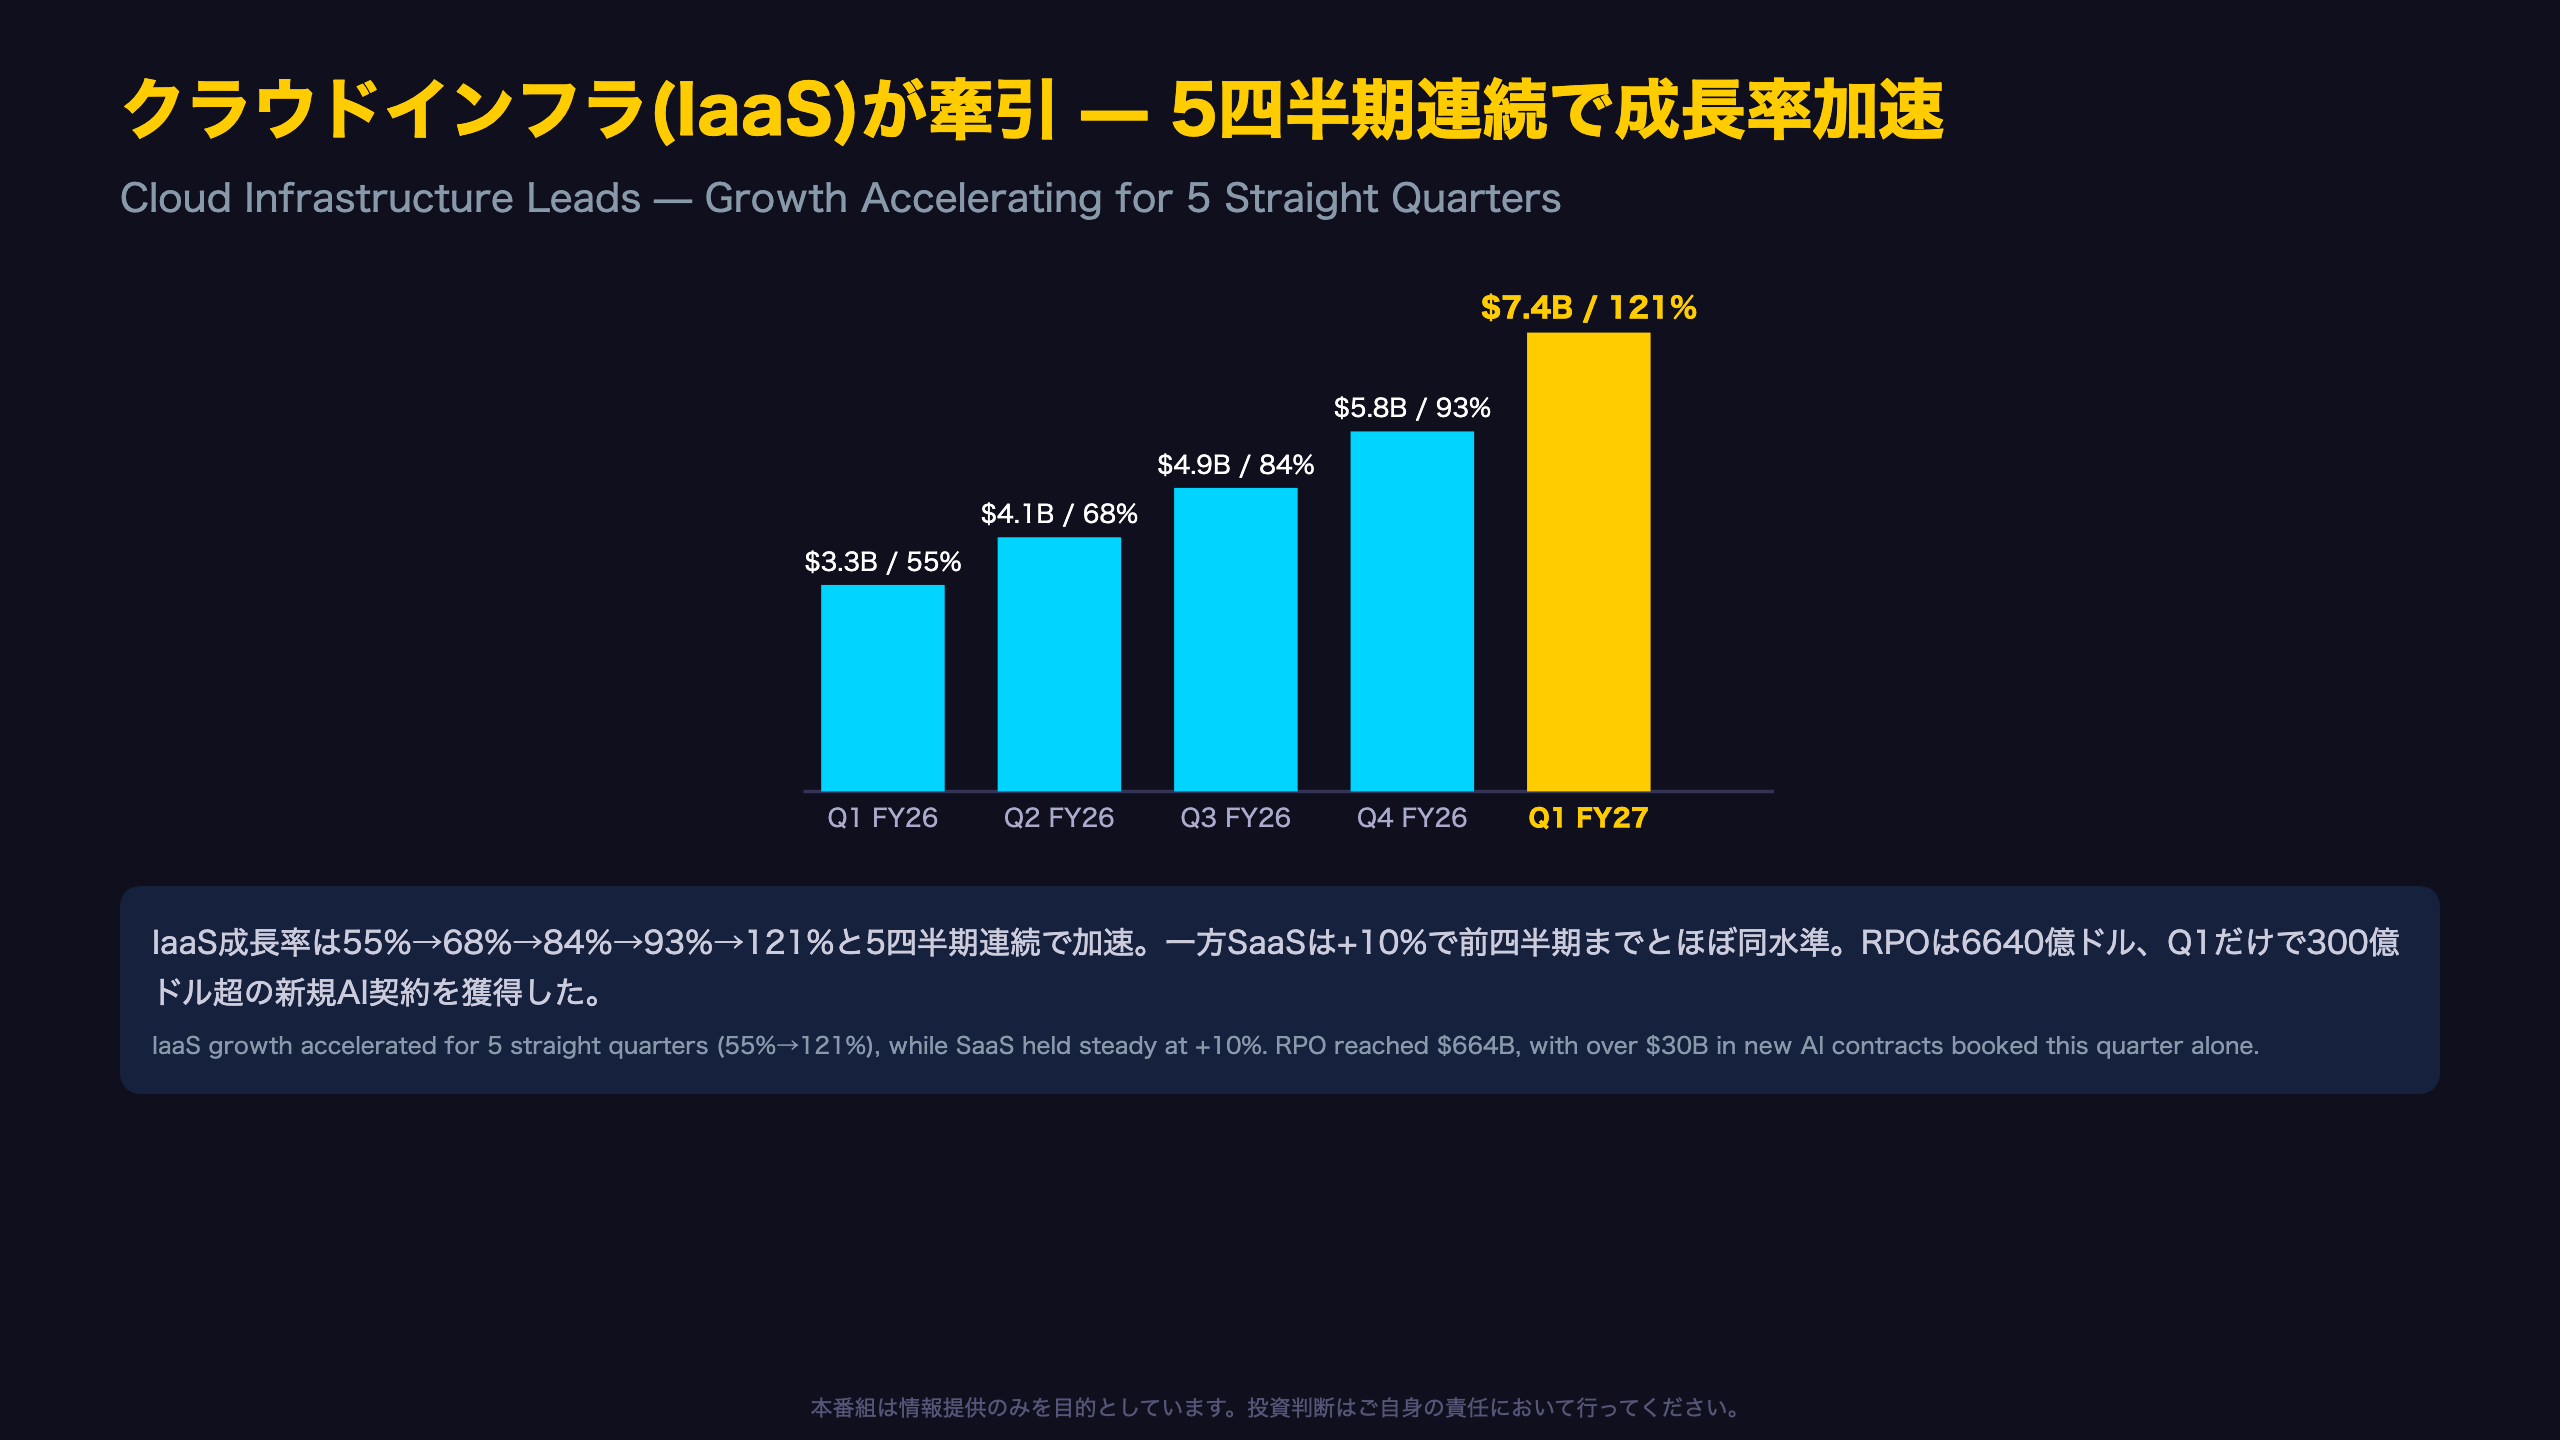
Laying out Oracle’s Cloud Infrastructure (IaaS) revenue by quarter reveals a clear acceleration pattern:
| Quarter | IaaS Revenue | YoY Growth |
|---|---|---|
| FY26 Q1 | $3.35B | 55% |
| FY26 Q2 | $4.08B | 68% |
| FY26 Q3 | $4.89B | 84% |
| FY26 Q4 | $5.79B | 93% |
| FY27 Q1 | $7.39B | 121% |
Growth has accelerated for five consecutive quarters — a pattern that suggests structural demand expansion (AI training/inference workloads) rather than a one-off spike, though a single quarter of any metric should still be read cautiously.
By contrast, Cloud Applications (SaaS) revenue grew a more modest 10% to $4.2 billion, roughly matching the 10-13% range seen throughout FY2026. The widening gap between IaaS and SaaS growth rates suggests Oracle’s growth engine has shifted decisively from application software (its traditional SaaS suite, competing with Salesforce and Workday) toward AI compute infrastructure — a business more comparable to AWS, Azure, and Google Cloud, though Oracle’s IaaS scale remains far smaller than the hyperscalers.
Geographically, the Americas accounted for $13.7 billion (71% of total revenue), dwarfing EMEA ($3.7B) and Asia Pacific ($1.9B) — underscoring that the AI infrastructure buildout is heavily concentrated in the US market.
The release states: “Customer demand for AI Cloud Training and Inferencing Services continues to grow faster than supply.” However, GPU deliveries exceeding 300,000 units since Q4 — nearly triple the prior quarter’s pace — suggest supply constraints are gradually easing, a genuinely balanced data point worth noting alongside the demand narrative.
オンプレミスからの移行止まらず — ソフトウェア売上3%減の構造
Software Segment and the Shifting Cost Base
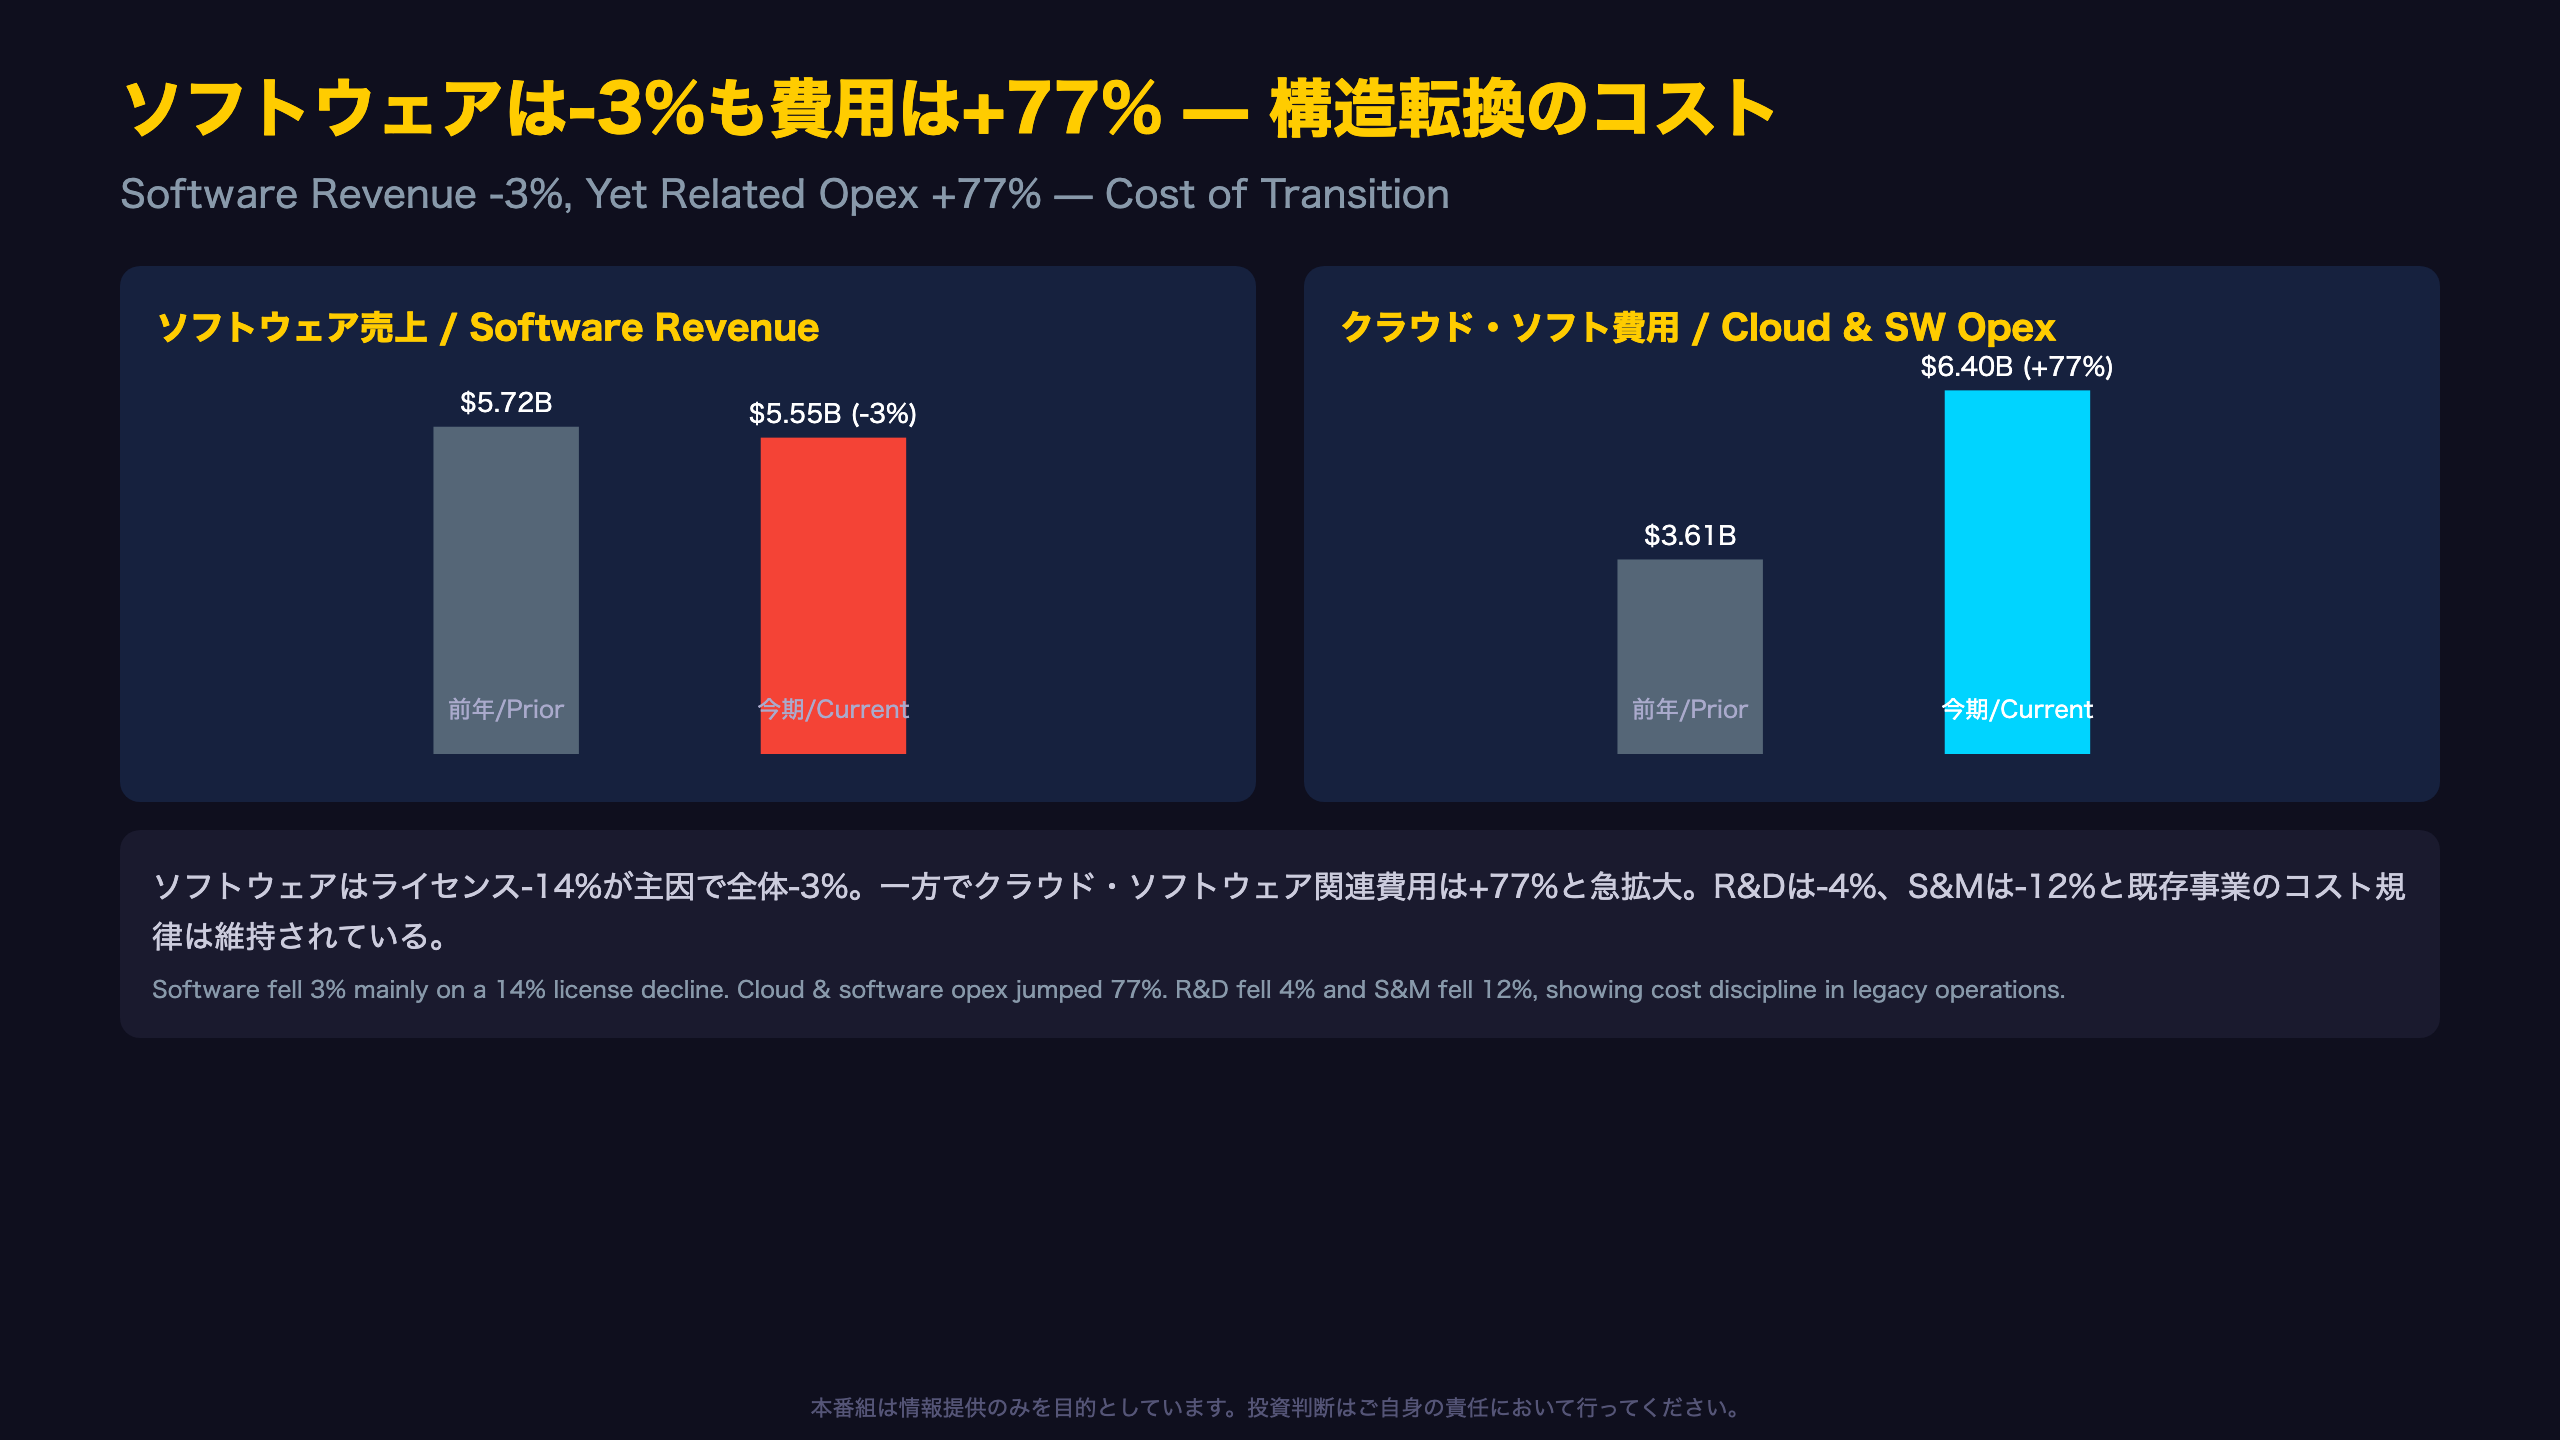
Software revenue was $5.55 billion, down 3% year-over-year, but the composition reveals structural change:
| Item | This Quarter | Prior Year | Change |
|---|---|---|---|
| License | $655M | $766M | -14% (constant currency) |
| Support | $4,895M | $4,955M | -1% |
| Total | $5,550M | $5,721M | -3% |
For context, Oracle’s traditional on-premises software business (competing historically with SAP and IBM) has been in gradual decline for years as customers migrate to cloud alternatives — a trend management explicitly cites as ongoing. Comparing sequentially to FY26 Q4 ($6.82B), this quarter’s figure looks like a steep drop, but Q4 typically sees seasonally elevated license sales, so a purely sequential read would overstate the decline. The year-over-year comparison (-3%) is the more reliable signal.
Meanwhile, Cloud and Software operating expenses (cost of revenue) surged 77% to $6.4 billion (78% in constant currency) — a cost base expansion likely driven by depreciation, power, and staffing costs tied to the infrastructure buildout. Notably, the filing states: “Movements in international currencies relative to the United States dollar…decreased our total operating expenses by 1 percentage point,” indicating FX was a modest tailwind, not the primary driver of expense growth.
By contrast, R&D spending fell 4% and Sales & Marketing fell 12% — showing Oracle maintained cost discipline in its legacy operating lines even as infrastructure costs ballooned. This divergence suggests capital and operating resources are being reallocated decisively toward the AI cloud infrastructure business, a strategic pivot reminiscent of how legacy enterprise software vendors have historically responded to platform shifts (e.g., IBM’s mainframe-to-cloud transition, though at a different scale and era).
営業キャッシュフローは184%増も、フリーキャッシュフローは54億ドルの赤字
The Real Cash Flow Picture: Earning Power and Spending Power Both Expanding
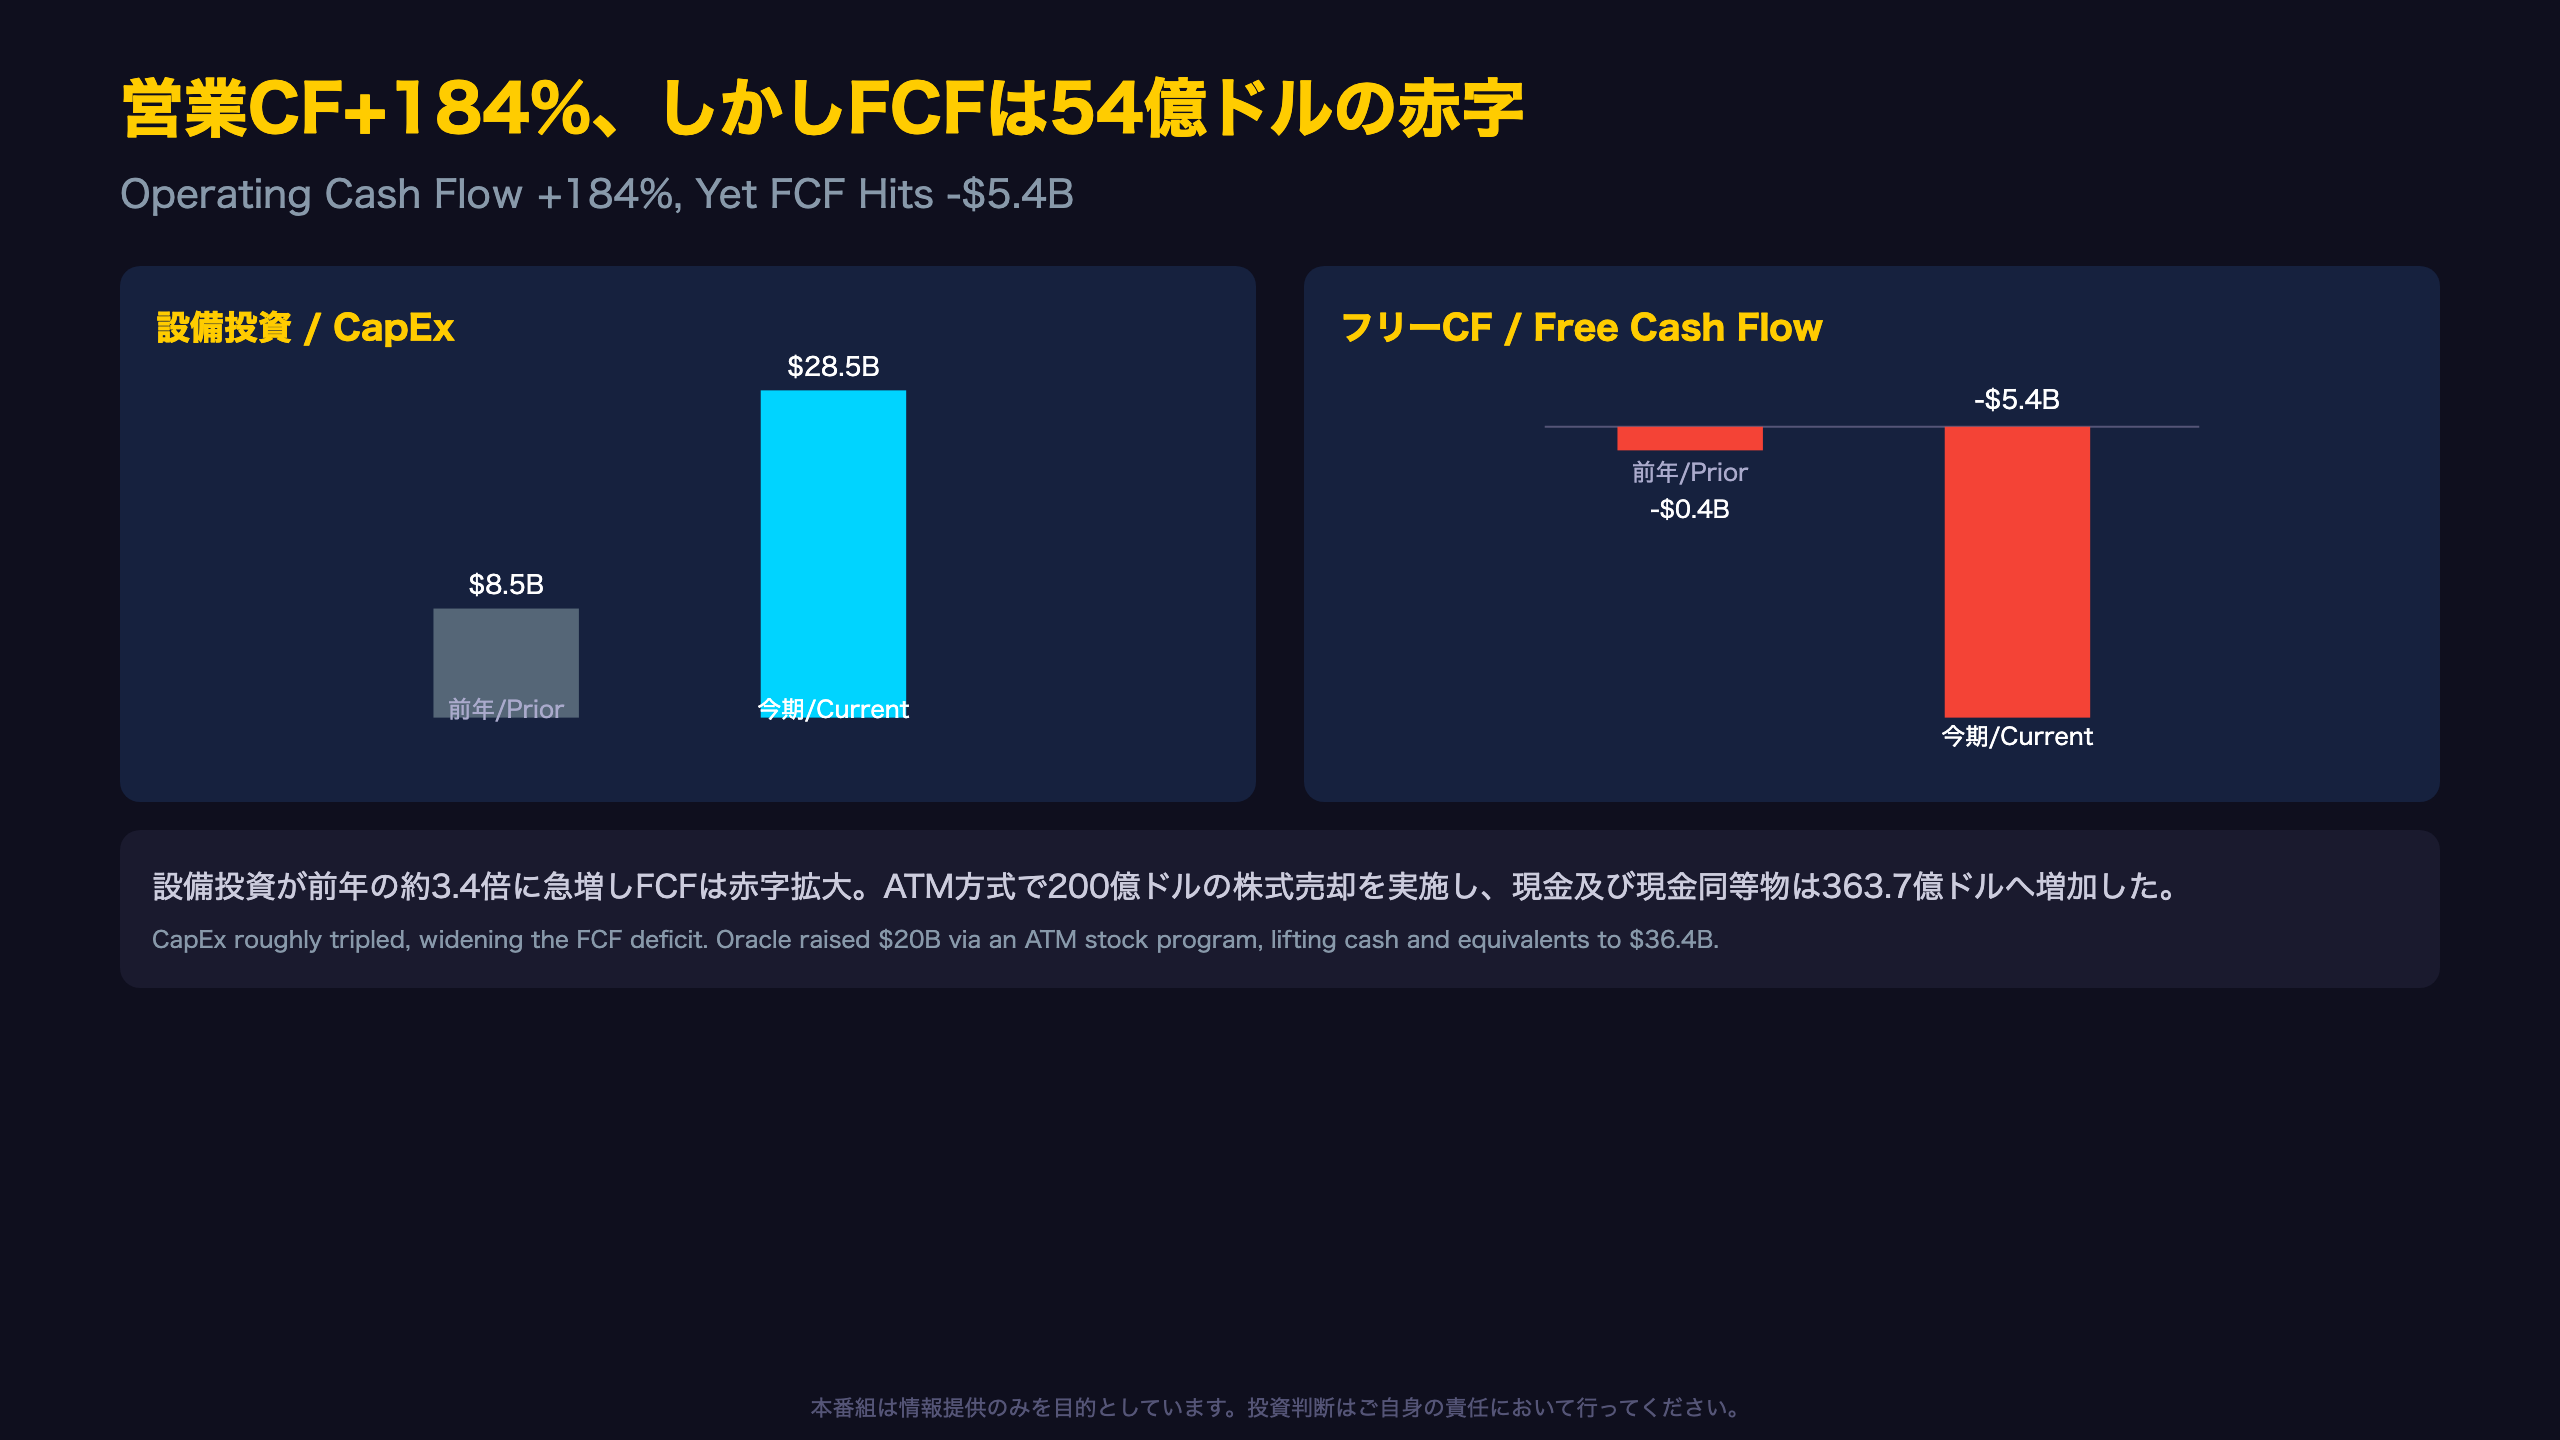
Operating cash flow hit a record $23.1 billion (+184% YoY), but capital expenditures reached $28.5 billion, pushing free cash flow to negative $5.4 billion.
Free Cash Flow Trend Over the Last Five Quarters (in millions)
| Quarter | Operating CF | CapEx | FCF |
|---|---|---|---|
| FY26 Q1 | $8,140 | $8,502 | -$362 |
| FY26 Q2 | $2,066 | $12,033 | -$9,967 |
| FY26 Q3 | $7,151 | $18,635 | -$11,484 |
| FY26 Q4 | $14,620 | $16,493 | -$1,873 |
| FY27 Q1 | $23,103 | $28,499 | -$5,396 |
Full-year FY2026 free cash flow totaled negative $23.7 billion; this single quarter alone represents roughly 23% of that entire annual deficit. For US investors accustomed to mega-cap tech generating substantial positive free cash flow (as Apple, Microsoft, and Google typically do), Oracle’s sustained negative FCF is a notable divergence — though it mirrors the capital intensity seen at AI infrastructure-heavy peers building out large GPU clusters.
Importantly, $11.4 billion of this quarter’s capex relates to “customer prepayments with significant financing component” — meaning a portion of infrastructure spending is effectively pre-funded by customer contracts rather than purely self-funded. Adjusting for this, Oracle’s “net cash outlay for capital expenditures” was $18.0 billion — still a large number, but meaningfully lower than the headline $28.5 billion.
Capital Raising Activity
Oracle raised $20 billion (before commissions, $19.9 billion net) through an At-the-Market (ATM) equity program — a funding mechanism common among growth-stage companies but less typical for a company of Oracle’s scale. Diluted weighted average shares outstanding rose from 2.909 billion to 3.0 billion as a result. Stockholders’ equity expanded sharply from $43.1 billion to $67.2 billion.
The filing notes: “Based on the structuring of those new contracts, the Company confirms there is no incremental impact on its plans to raise capital” — management’s own framing of the RPO-financing relationship. Both bullish (backlog-backed growth) and bearish (equity dilution, negative FCF) readings are defensible here, which the next slide’s guidance figures help clarify further.
次期ガイダンスはクラウド成長65〜71%を想定 — 通期売上900億ドル以上へ
Reading the Guidance: Watch Out for the One-Time Gain Distortion
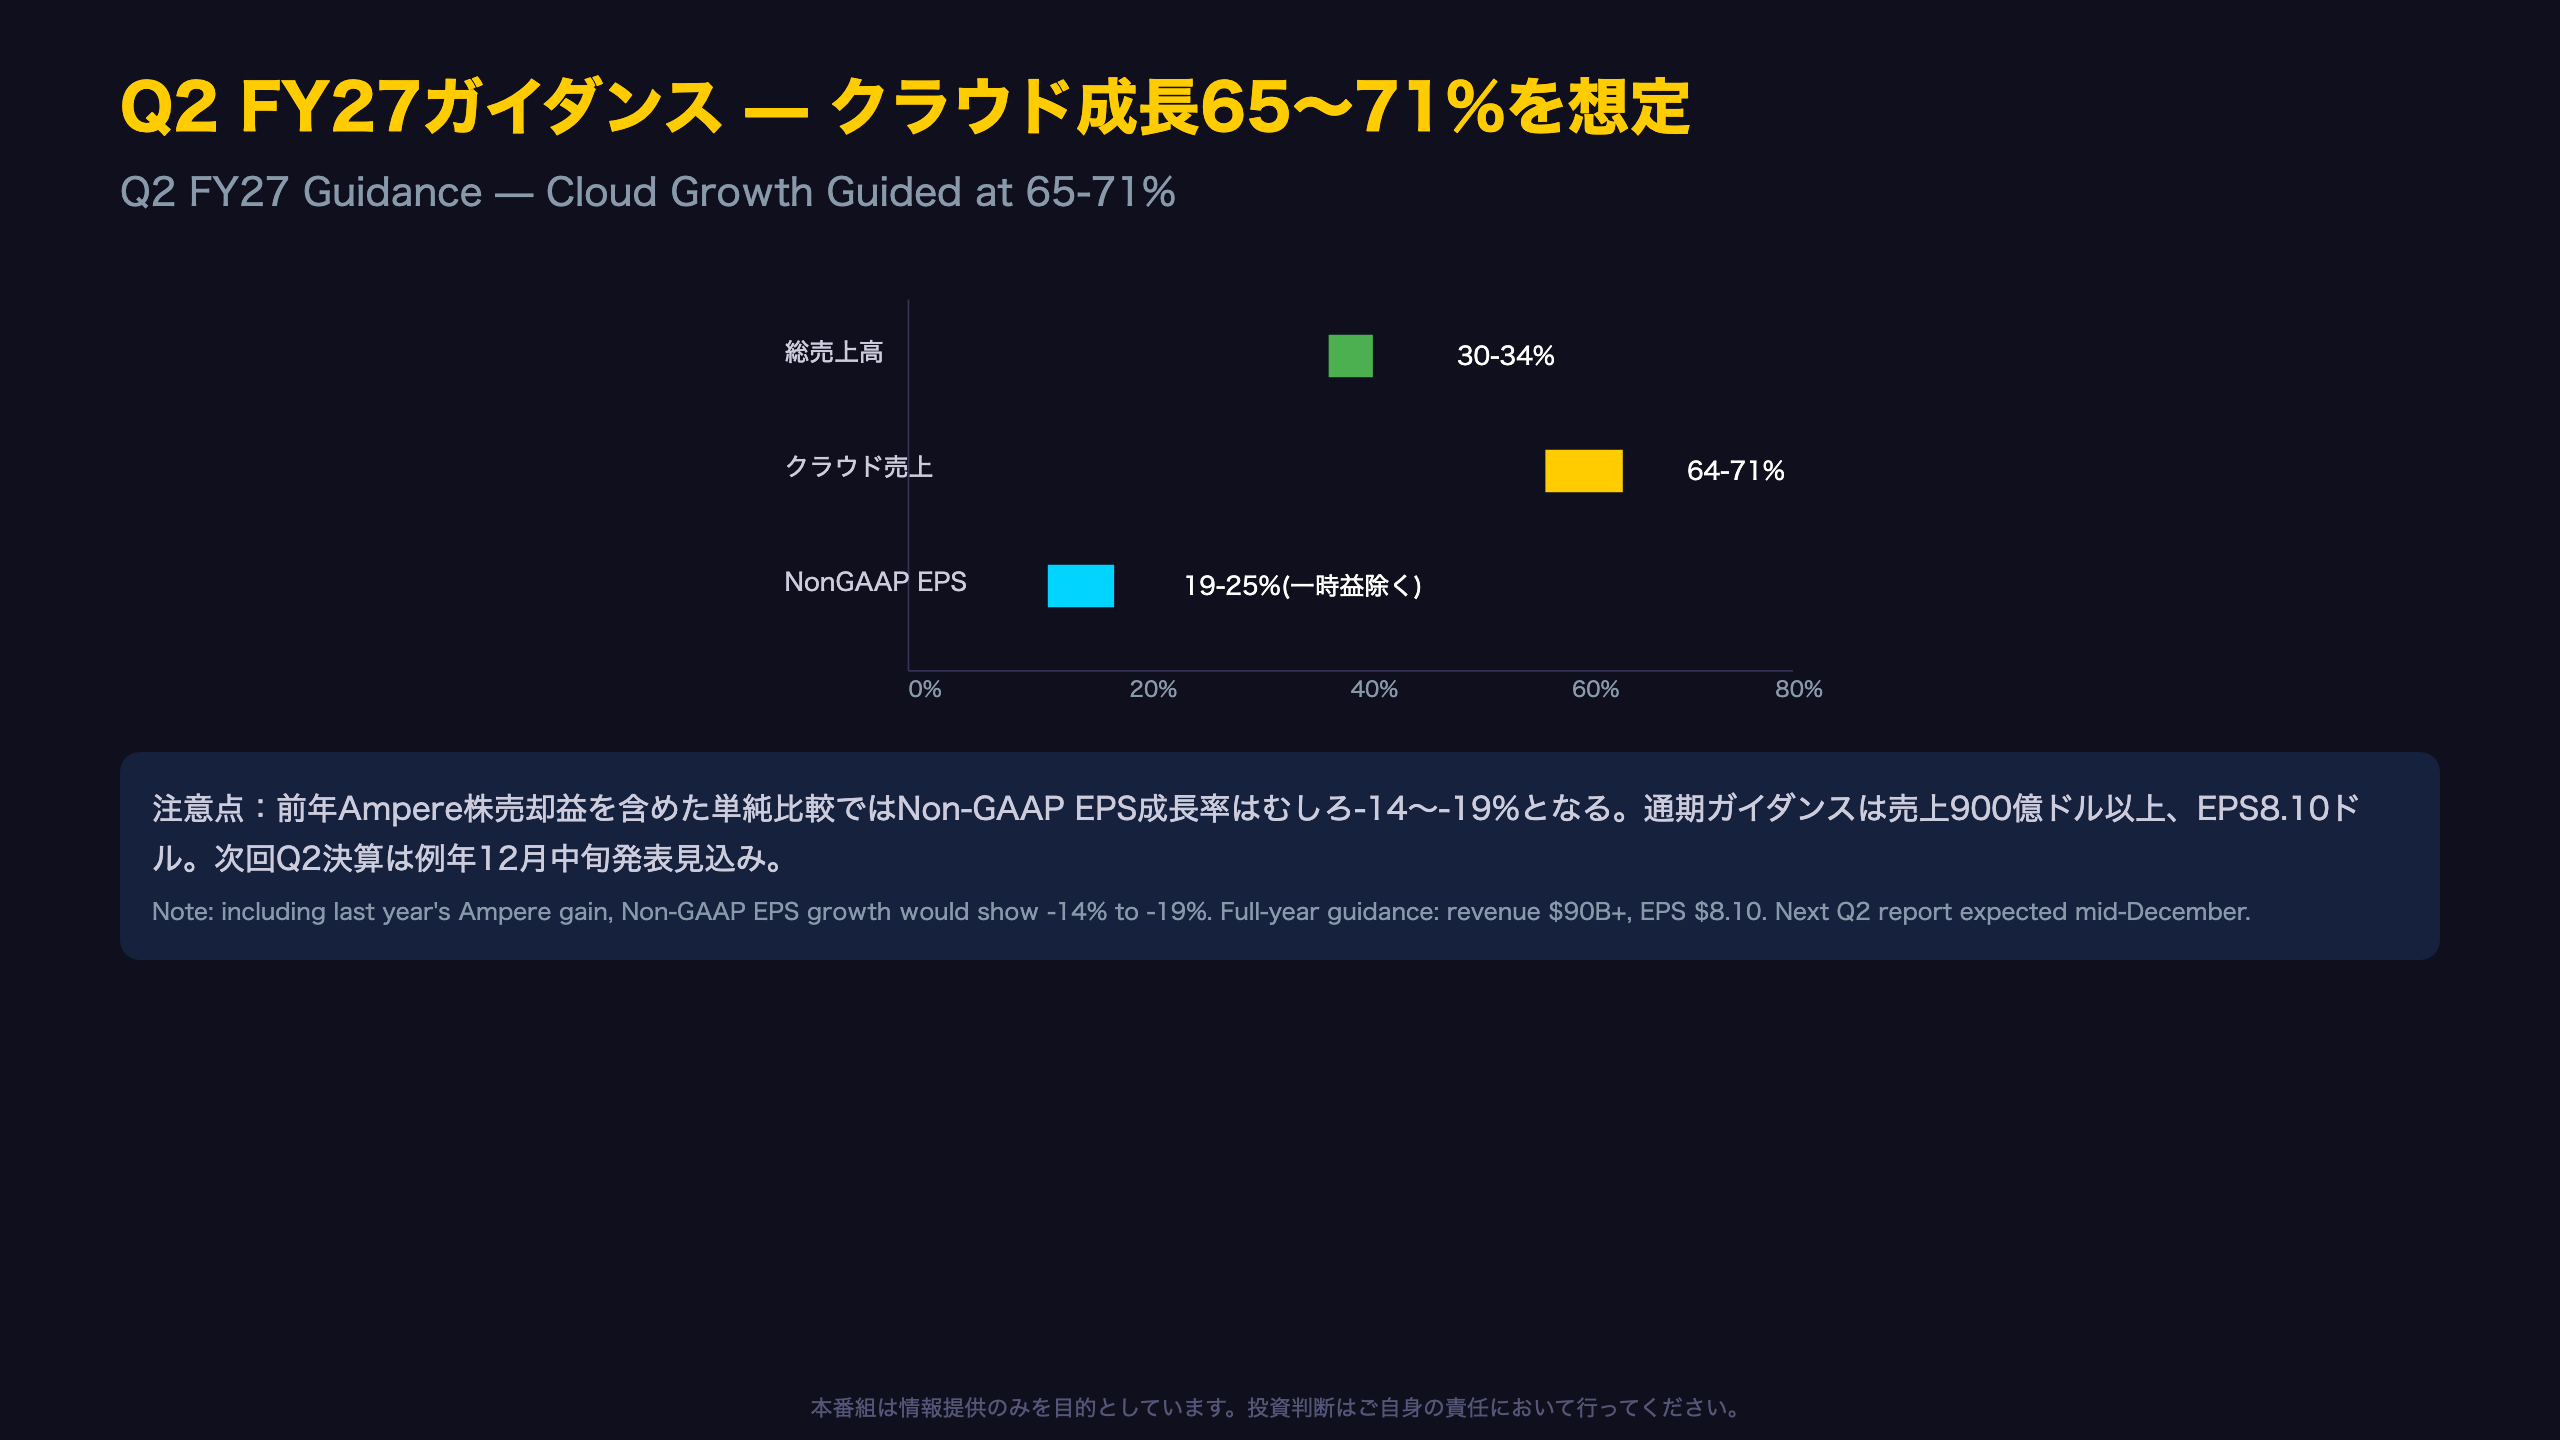
Oracle’s Q2 FY2027 guidance calls for total revenue growth of 30-34% and cloud revenue growth of 64-71% — implying further acceleration from this quarter’s already strong 30% revenue and 62% cloud growth.
The EPS Guidance “Double Standard”
Footnote 1 in the release contains a crucial detail for investors modeling EPS trends. Q2 FY26 (the year-ago comparison quarter) included a one-time investment gain from Oracle’s sale of its stake in Ampere Computing (the Arm-based chip designer).
- Excluding the one-time gain: Non-GAAP EPS growth guided at +19% to +25%
- Including the one-time gain (straight YoY comparison): Non-GAAP EPS growth would actually show a decline of 14% to 19%
This is a classic “base effect” distortion — the prior-year comparison quarter itself contained non-recurring noise, meaning a superficial glance at headline EPS growth could produce a misleadingly negative impression. This is analogous to how US companies sometimes need to flag one-time divestiture gains skewing YoY comparisons (e.g., similar disclosures seen around asset sales at other large-cap tech firms).
Full-Year Guidance
For FY2027, Oracle guided total revenue of at least $90 billion and Non-GAAP EPS of $8.10. Simply annualizing Q1’s $19.3 billion (×4) would suggest roughly $77.3 billion — meaning the $90 billion+ guidance implicitly assumes continued sequential acceleration through the back half of the fiscal year (Q2-Q4).
“For fiscal year 2027, we now expect total revenue to be at least $90 billion, and non-GAAP EPS to be at $8.10.” (verbatim from the release)
What to Watch Next
The next Q2 FY2027 earnings report — typically released in mid-December given Oracle’s June-May fiscal calendar — will be a key test of three things: (1) whether SaaS growth breaks out of its 10% plateau, (2) whether the free cash flow deficit begins to narrow, and (3) whether RPO continues accumulating at a similar pace, sustaining the multi-year revenue visibility story.
Disclaimer: This article is for informational purposes only. All investment decisions are made solely at your own risk.