
📺 Watch the Full Video Analysis
This article was automatically generated by the NFC Market Live AI analysis system. (Updated: 2026-10-30 09:56 JST)
📄 Primary Source
総務省統計局
https://www.stat.go.jp/data/roudou/sokuhou/tsuki/pdf/gaiyou.pdf
📊 A walkthrough of Japan’s September Labour Force Survey, released Oct 30 by the Statistics Bureau.
📉 The seasonally adjusted unemployment rate eased 0.1 pt to 2.4%. Employment rose 330K year on year, and employees rose for a 55th straight month.
💡 The drop was driven mainly by a 130K fall in voluntary-quit job seekers (SA); involuntary separations rose only slightly.
⚠️ But non-regular employees rose 470K and accommodation and food services employment fell 210K. The survey has no wage or price data.
📅 The October data are due December 1.
The Ultimate Summary:雇用データが発したシグナル
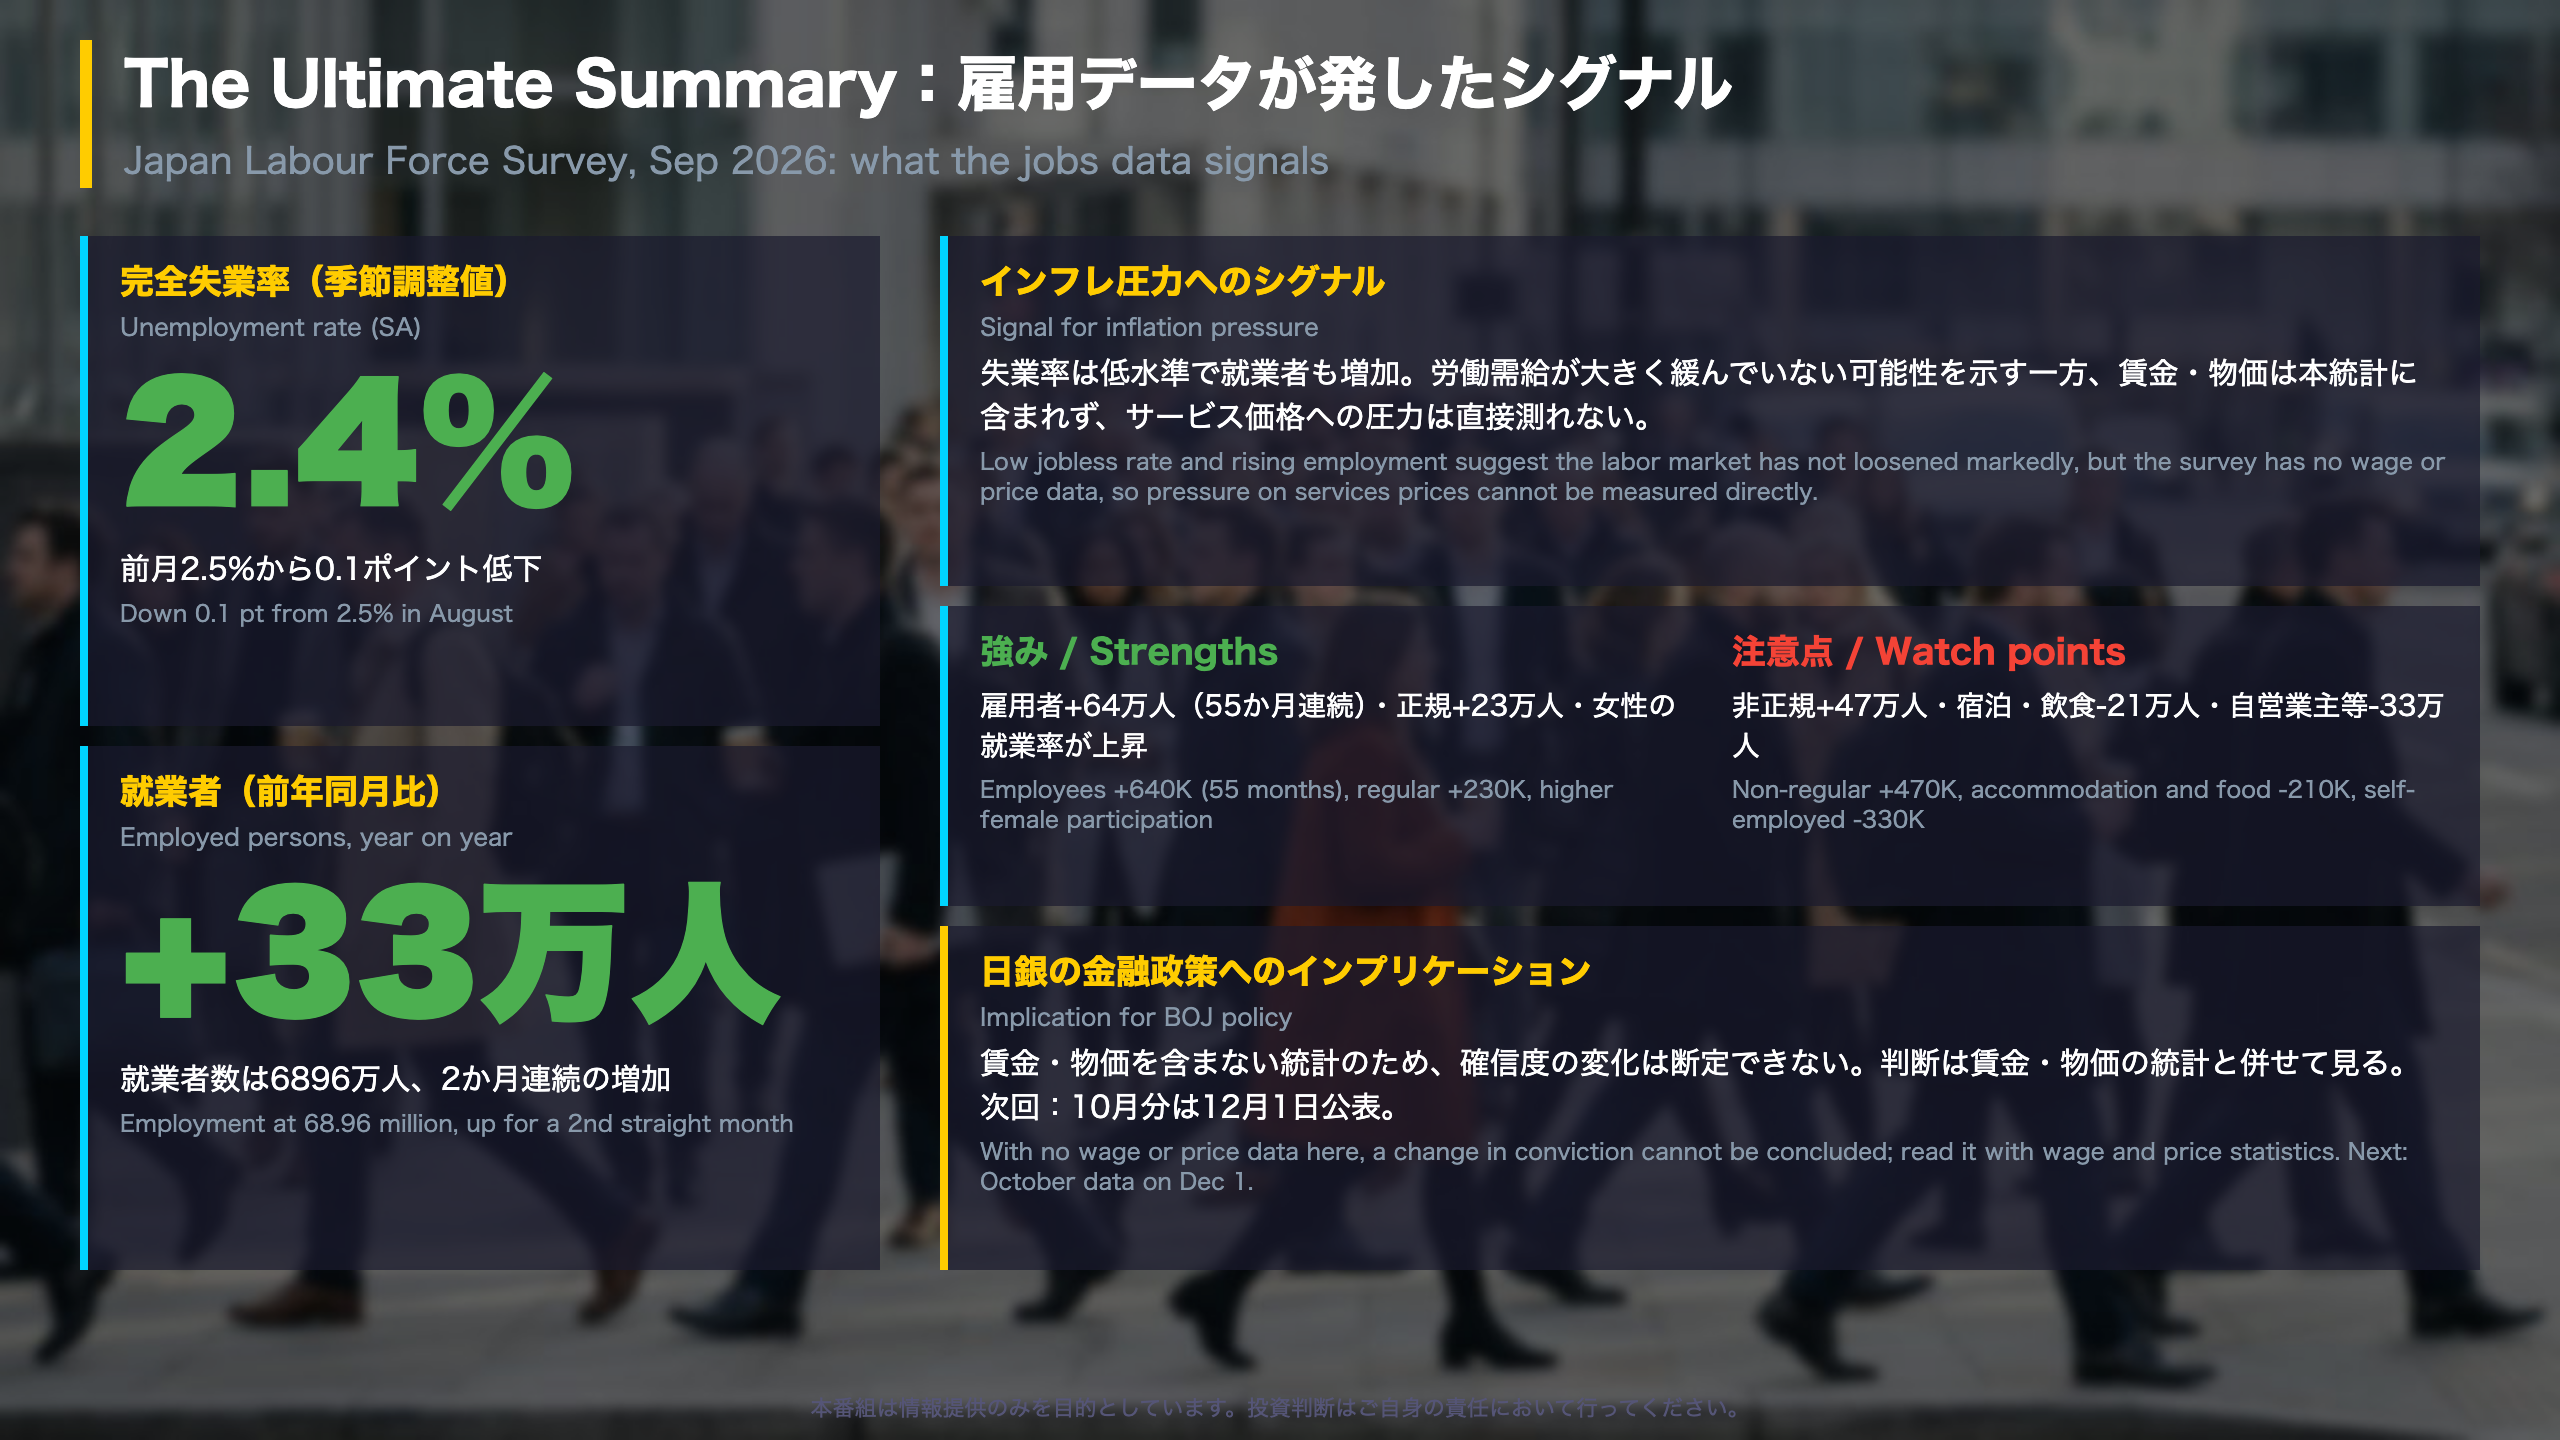
Japan Labour Force Survey, September 2026: The Big Picture
What it is. The Labour Force Survey is compiled monthly by the Statistics Bureau of the Ministry of Internal Affairs and Communications (MIC). It is Japan’s counterpart to the US nonfarm payrolls and household survey rolled into one: it counts employed people, job seekers and those outside the labor force. Unlike US payrolls, it comes from a household sample and has no wage data.
Headline numbers
- Unemployment rate (seasonally adjusted): 2.4%, down from 2.5% in August. Since June the rate has moved in a 2.4-2.5% range, after 2.7% in January.
- Employed persons: 68.96 million, +330,000 year on year, the second straight rise.
- Employees: 62.65 million, up for a 55th consecutive month.
- Employment rate: 62.9%, +0.4 pt year on year. Non-labor-force population fell for a 55th month.
International comparison
Japan’s jobless rate sits well below the US level, but the comparison is loose: Japan’s labor force is shrinking with demographics, so low unemployment reflects tight supply as much as strong demand. That is why the Bank of Japan (BOJ) watches wages and services prices alongside this survey.
Balanced reading
Strengths: broad job gains, regular employment up for 35 months, falling non-participation. Watch points: non-regular employees account for +470,000 of the gains and self-employed workers fell 330,000.
Market relevance
The release carries no wage or price information, so by itself it does not change the picture for BOJ policy. Investors typically combine it with wage data and the national CPI. The October data are due December 1.
失業率低下の中身:自己都合離職の減少
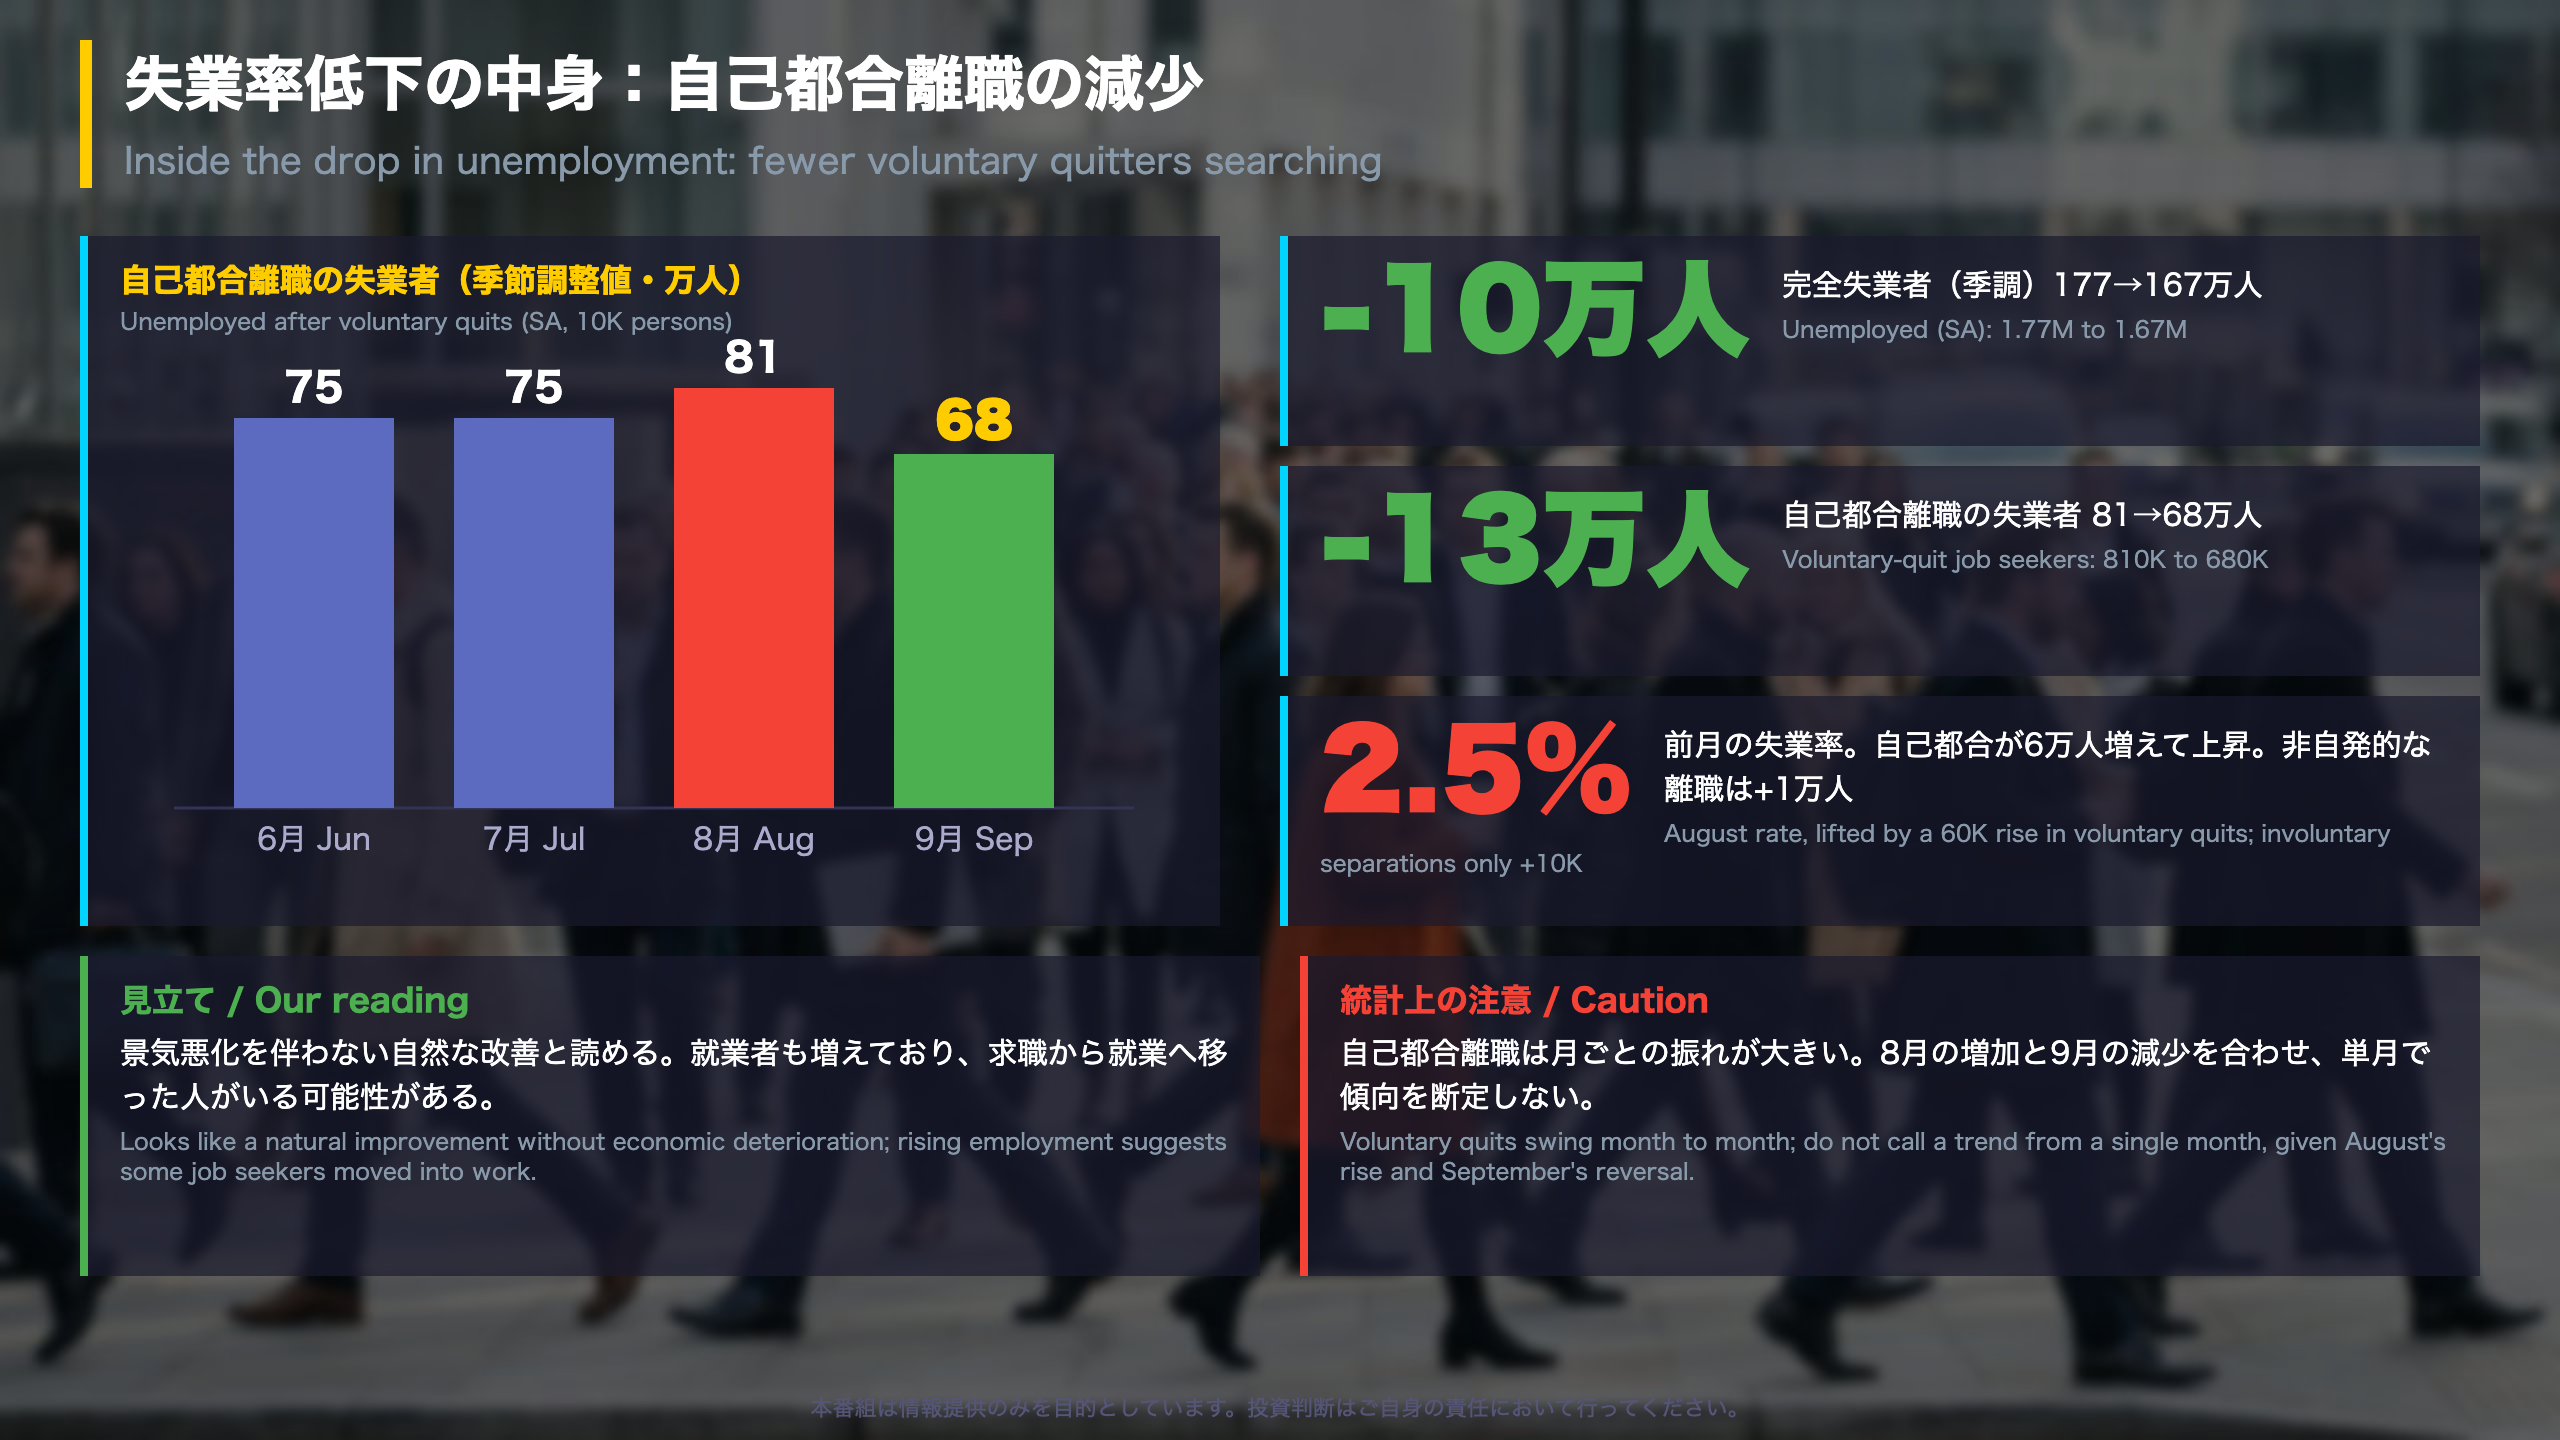
Inside the Drop in Unemployment
Context. Japan’s unemployment rate is derived from a monthly household survey, so it is noisy. The Statistics Bureau publishes seasonally adjusted components, which is what we use here.
Seasonally adjusted breakdown (10,000 persons)
| Item | Aug | Sep | Change |
|---|---|---|---|
| Unemployed | 177 | 167 | -10 |
| Involuntary separations | 40 | 41 | +1 |
| Voluntary quits (own reasons) | 81 | 68 | -13 |
| New job seekers | 46 | 47 | +1 |
The components do not add up to the total because each series is adjusted separately.
Gender split
The male jobless rate fell 0.3 pt to 2.5%; the female rate fell 0.1 pt to 2.2%. Men contributed more to the improvement.
Two readings
- Constructive: seasonally adjusted employment rose 340,000 and the non-labor-force population fell 220,000, so many job seekers may simply have found work.
- Cautious: voluntary-quit job seekers rose 60,000 in August and fell 130,000 in September. That size of swing suggests sampling noise, so one month cannot confirm a trend.
International angle
In the US, a falling unemployment rate driven by job leavers is usually read as a sign of lower worker confidence in finding new jobs; in Japan the voluntary-quit category is more often tied to job switching. Either way it is a volatile series.
What to watch
The October release on December 1 will show whether the rate stays in its 2.4-2.5% range and whether voluntary-quit job seekers settle near 680,000.
雇用の中身:非正規と医療・福祉が主役
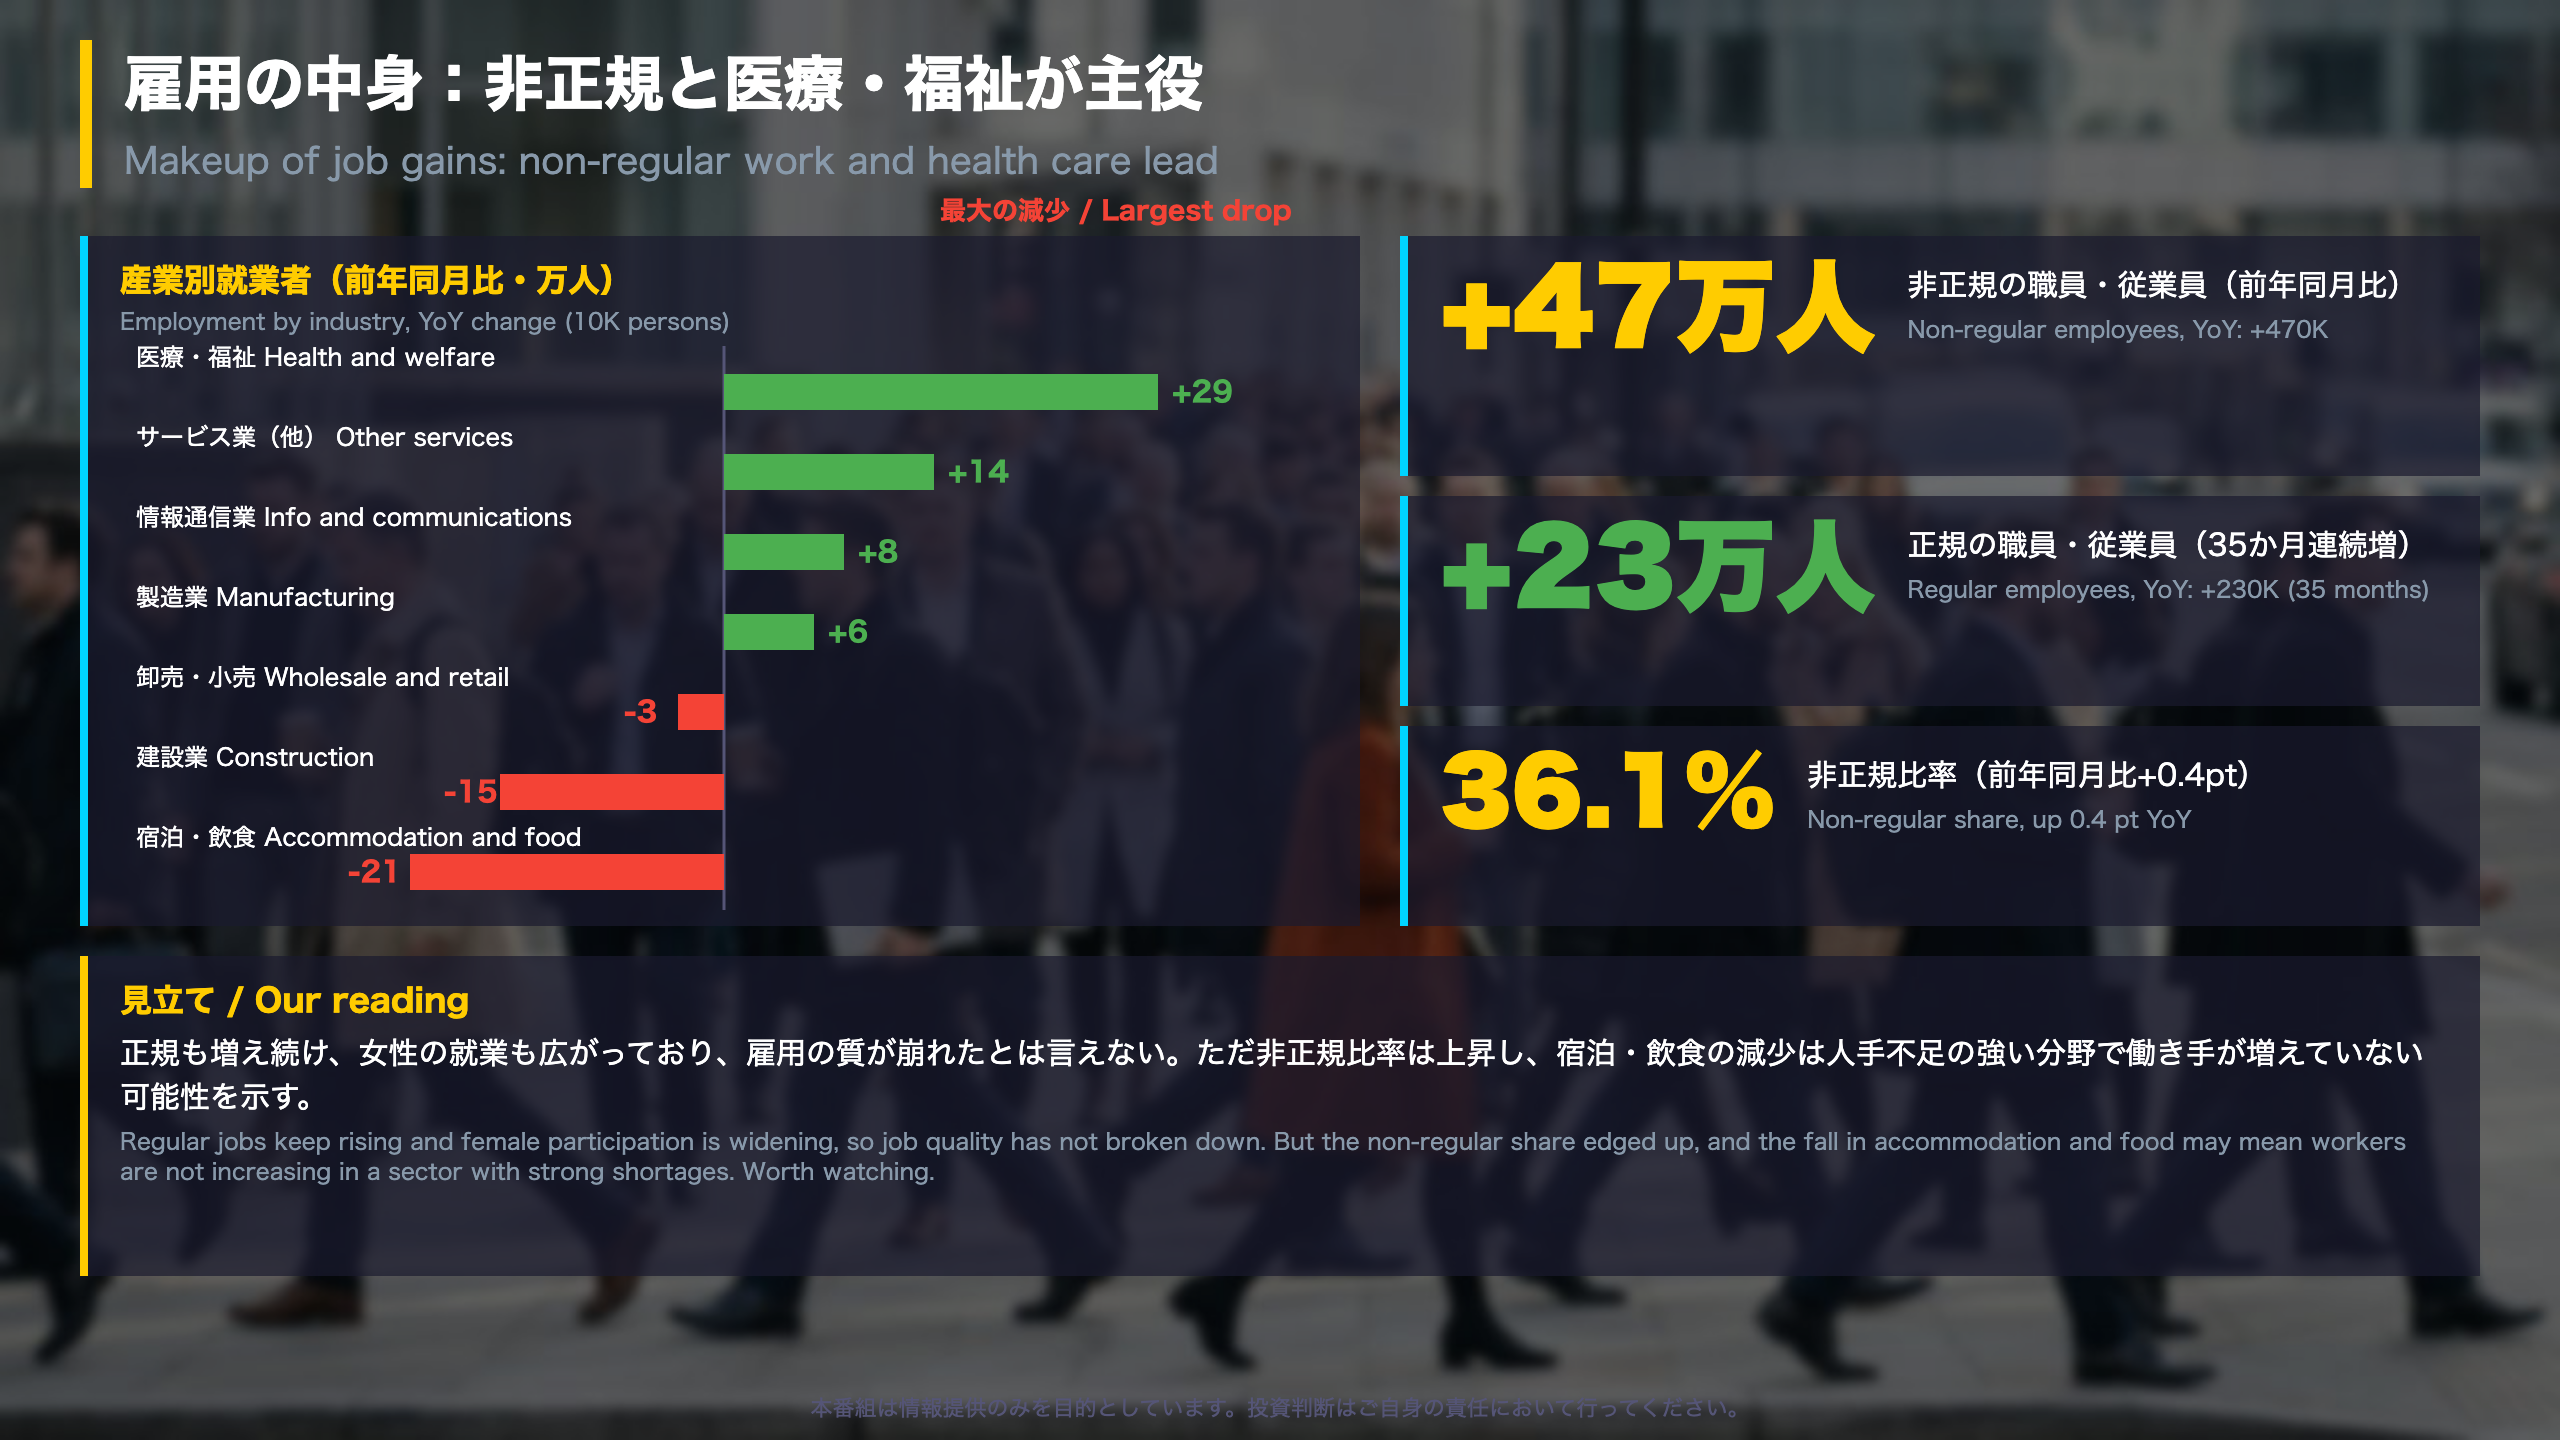
What Kind of Jobs Were Added?
Reading the data. The Labour Force Survey splits employees into regular (full-time, open-ended) and non-regular (part-time, casual, dispatched, contract and fixed-term) workers. Japan’s non-regular share is structurally high at about 36%, and it matters because non-regular work tends to carry lower pay and weaker job security.
Employees excluding executives, year on year
| Category | Level (10K) | Change (10K) |
|---|---|---|
| Regular | 3783 | +23 |
| Non-regular | 2138 | +47 |
| Part-time | 1030 | +7 |
| Casual (arubaito) | 494 | +17 |
| Dispatched | 154 | -1 |
| Contract | 280 | +16 |
The non-regular share was 36.1%, up 0.4 pt from 35.7% a year earlier. Women accounted for 430,000 of the 640,000 rise in employees, and the female employment rate (ages 15-64) rose 0.9 pt to 76.7%.
By industry (year on year)
- Up: health and welfare +290K, other services +140K, information and communications +80K, manufacturing +60K.
- Down: accommodation and food services -210K (-4.9%), construction -150K, personal services and entertainment -60K.
Two readings
- Constructive: regular jobs have risen for 35 straight months and female participation is broadening.
- Cautious: a rising non-regular share and a drop in accommodation and food, a sector often cited for labor shortages, could indicate a supply constraint. This survey cannot separate weak demand from a lack of available workers.
Why investors care
For the BOJ, labor shortages in services are a key channel for wage and price pressure. Employment counts alone cannot confirm that channel; the monthly wage survey and services CPI are the cross-checks. The detailed July-September tabulation is due November 10.
質疑で深める:非正規・宿泊飲食・賃金物価との接続
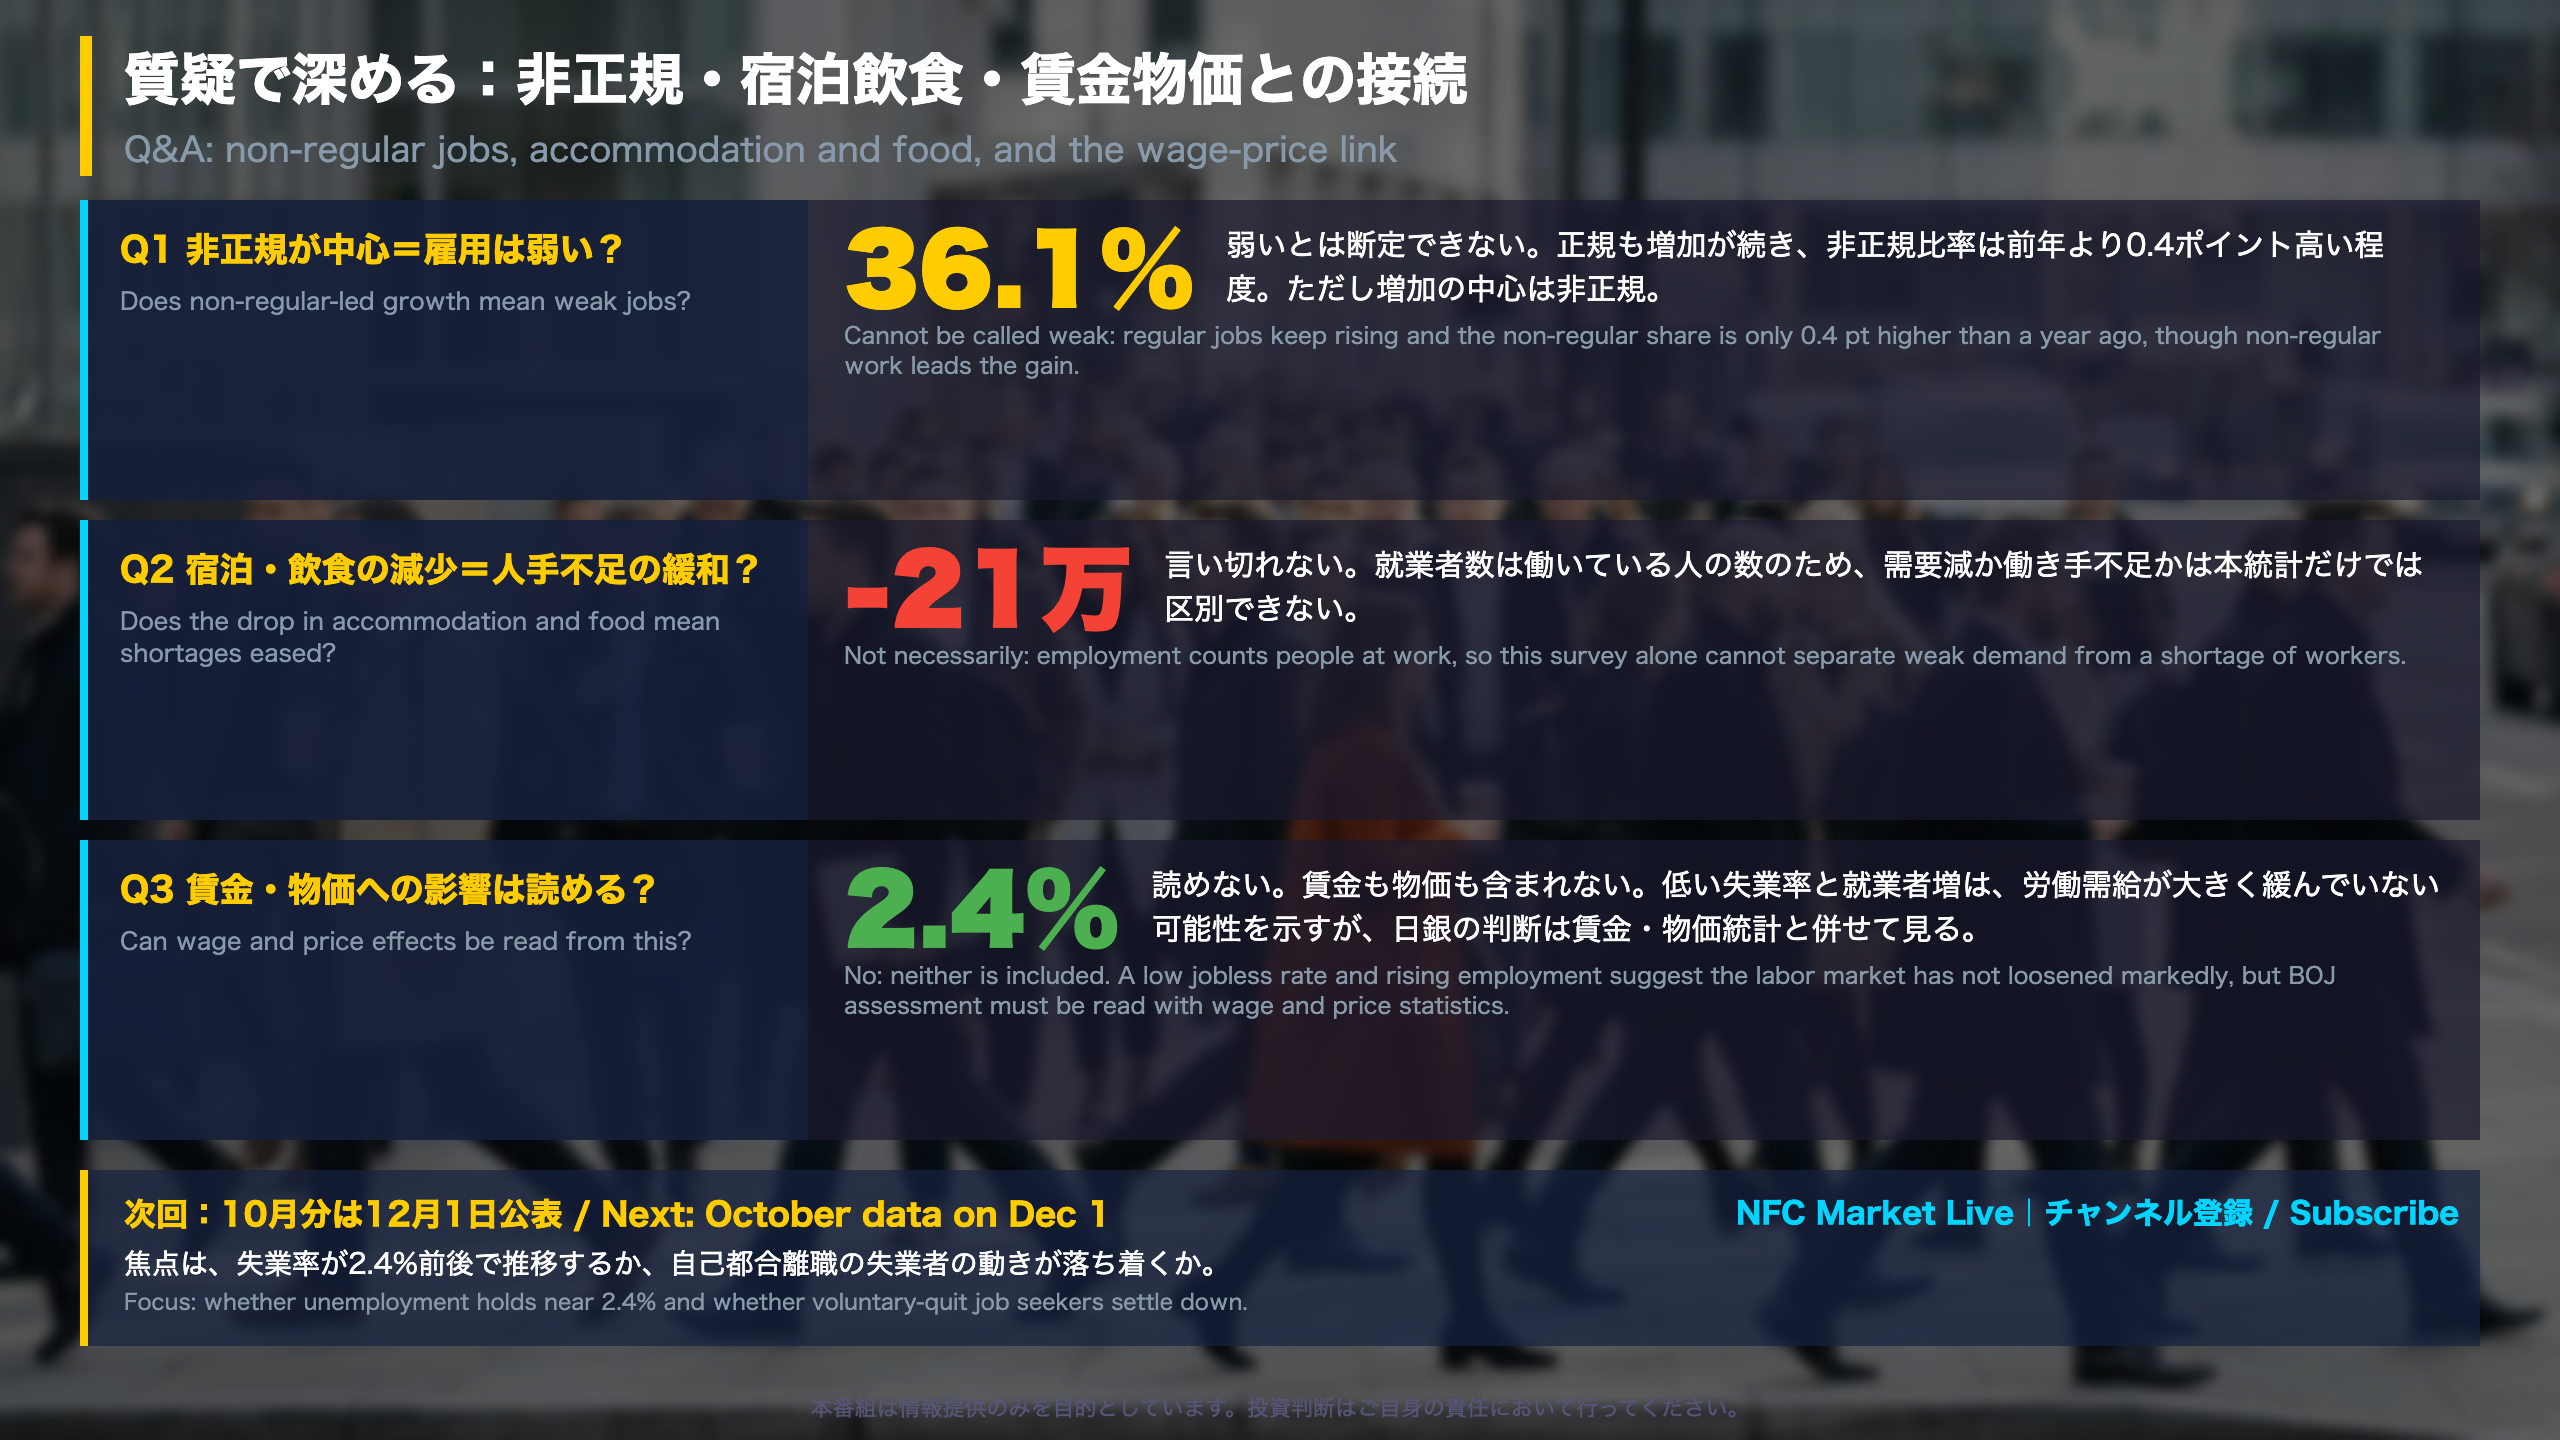
Q&A Follow-up: Three Issues
1. Is non-regular-led growth a weakness?
Regular employees stand at 37.83 million (+230,000 YoY, up 35 months) and non-regular at 21.38 million (+470,000, up 6 months). The non-regular share is far higher among the young (54.5% for ages 15-24, versus 19.8% for 25-34 and 24.8% for 35-44), a long-standing structural feature. The 0.4 pt rise in the overall share is a single-month change and should be treated cautiously.
2. The drop in accommodation and food services
Employment was 4.08 million, down 210,000 (-4.9%) year on year. In August it was 4.09 million (-50,000 YoY), so the decline widened in September. This is a volatile line item, and judging labor shortages needs other data such as the job-openings-to-applicants ratio and wages.
3. Linking to wages and prices
This survey has neither. Reference points for labor-market tightness are the unemployment rate (2.4%), the employment rate (62.9%, +0.4 pt YoY) and the shrinking non-labor-force population (55 straight months of decline).
Two readings
- Constructive: the employment rate is up 0.4 pt from a year ago and participation is broadening.
- Cautious: the quality of growth (non-regular led) and the decline in a specific sector must be weighed together.
Context for global investors
The BOJ’s framework hinges on a virtuous cycle between wages and prices. The labor survey speaks to the first link only indirectly, through slack. The next data points are the October release on December 1 at 08:30 JST, plus wage and CPI data from other agencies.
Disclaimer: This article is for informational purposes only. All investment decisions are made solely at your own risk.