📺 Watch the Full Video Analysis
This article was automatically generated by the NFC Market Live AI analysis system. (Updated: 2026-09-07 18:52 JST)
📄 Primary Source
内閣府経済社会総合研究所
https://www.esri.cao.go.jp/jp/stat/di/202607psummary.pdf
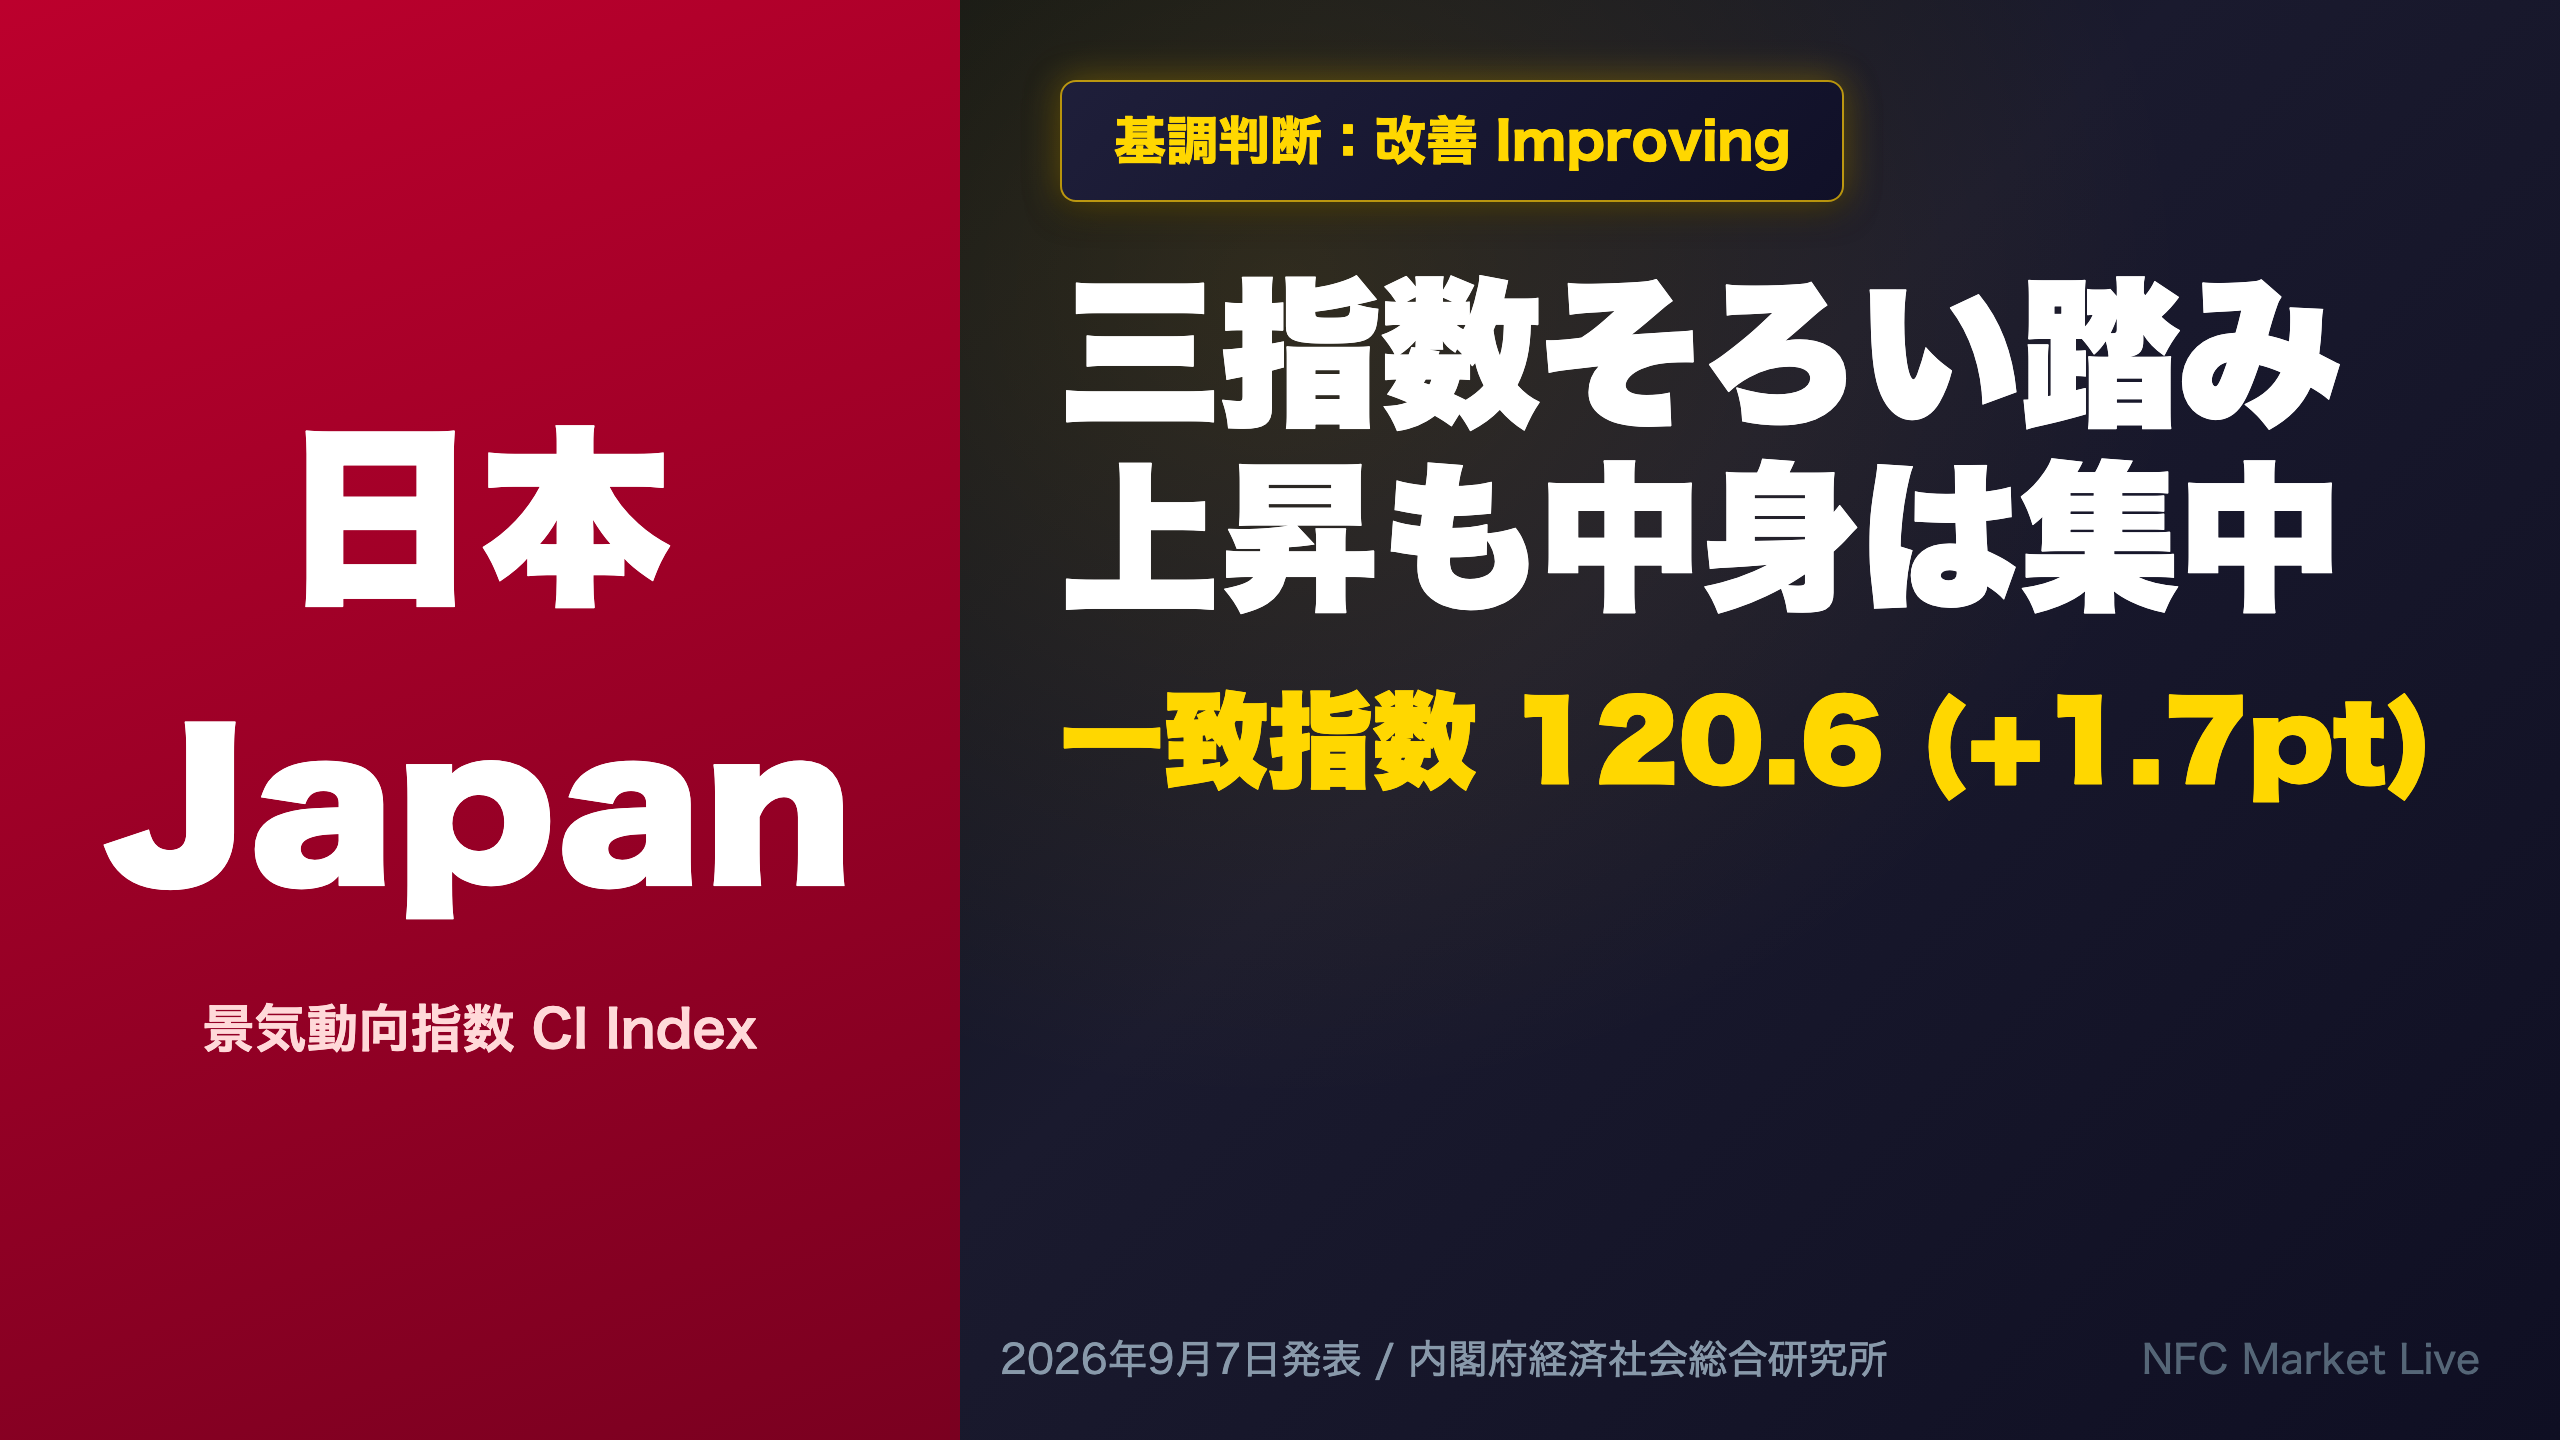
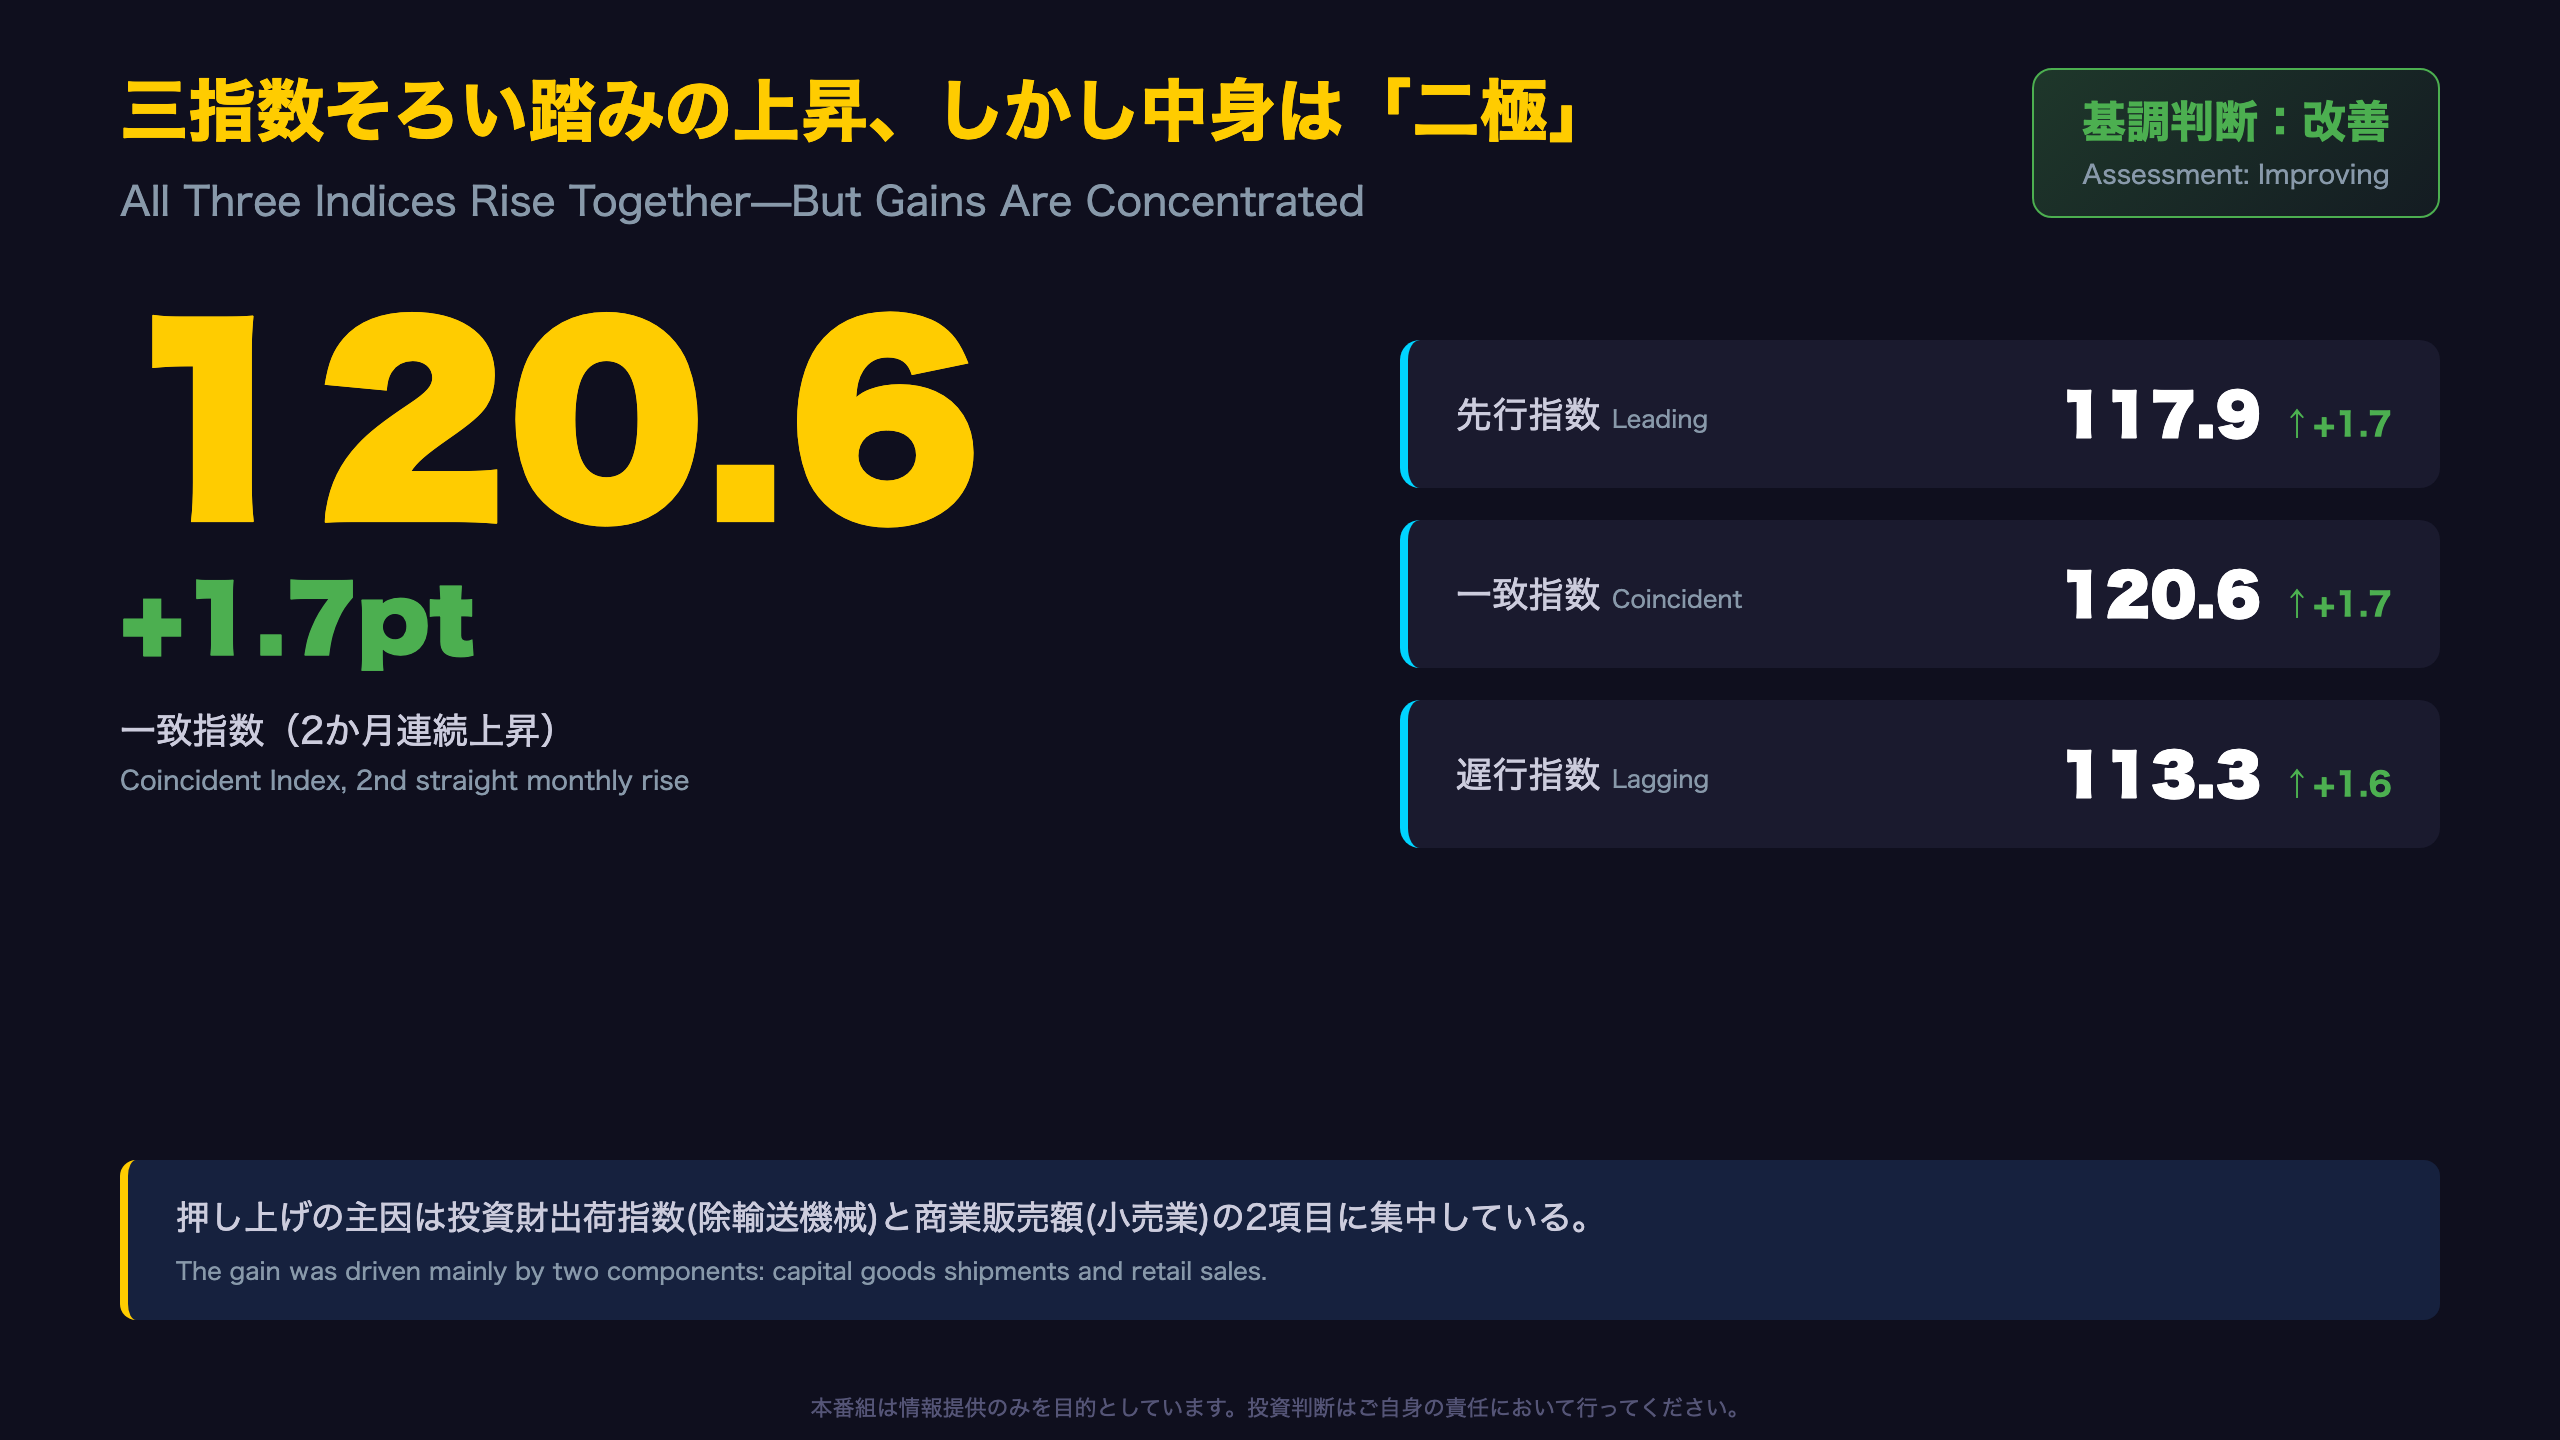
Japan’s Cabinet Office released the July 2026 preliminary Composite Index (CI) of Business Conditions. 📊 The Coincident Index rose to 120.6, up 1.7 points MoM for a second straight monthly gain, keeping the official assessment at “Improving.”
All three indices (leading, coincident, lagging) rose together, but the gain was concentrated in just two components: capital goods shipments and retail sales. 💡 Production and job-openings-ratio contributions were near zero.
On the bright side, the Leading Index’s 3-month moving average has risen for 13 straight months, and the Lagging Index’s 7-month average turned positive for the first time in 9 months. ⚠️ However, June’s data was revised upward twice, a reminder of Japan’s frequent statistical revisions.
A balanced deep dive into the strengths and weaknesses beneath Japan’s headline economic indicators.
三指数そろい踏みの上昇、しかし中身は『二極』
What “All Three Indices Rising Together” Means
Japan’s Cabinet Office (Economic and Social Research Institute) released the preliminary Composite Index (CI) of Business Conditions for July 2026 on September 7, 2026. The Coincident Index rose to 120.6 (2020=100), up 1.7 points month-on-month, the second consecutive monthly gain.
For readers unfamiliar with Japanese macro data: the CI is Japan’s equivalent of a diffusion-based leading/coincident/lagging indicator system, similar in spirit to the US Conference Board’s Leading Economic Index (LEI), but Japan’s Cabinet Office publishes three parallel indices (Leading, Coincident, Lagging) built from 10-11 component series each.
Recent Trend
| Month | Coincident Index | MoM Change |
|---|---|---|
| April | 118.3 | +1.3 |
| May | 118.3 | 0.0 |
| June | 118.9 | +0.6 |
| July | 120.6 | +1.7 |
After stalling in May, the index has now accelerated for two straight months.
Why the “Improving” Verdict Held
Under the Cabinet Office’s mechanical criteria, an “Improving” verdict requires the 3-month moving average to rise for three or more consecutive months, with the current month’s change also positive. Both the 3-month and 7-month moving averages have now risen for seven consecutive months, comfortably meeting the bar.
However, unlike the U.S. Conference Board’s LEI—which has flashed recession warnings for extended periods in recent years—Japan’s CI framework rarely triggers dramatic single-month narratives. Investors should look past the headline MoM figure toward which components are actually driving the move, which the next section explores.
押し上げの主役は投資財と小売、生産と雇用は横ばい
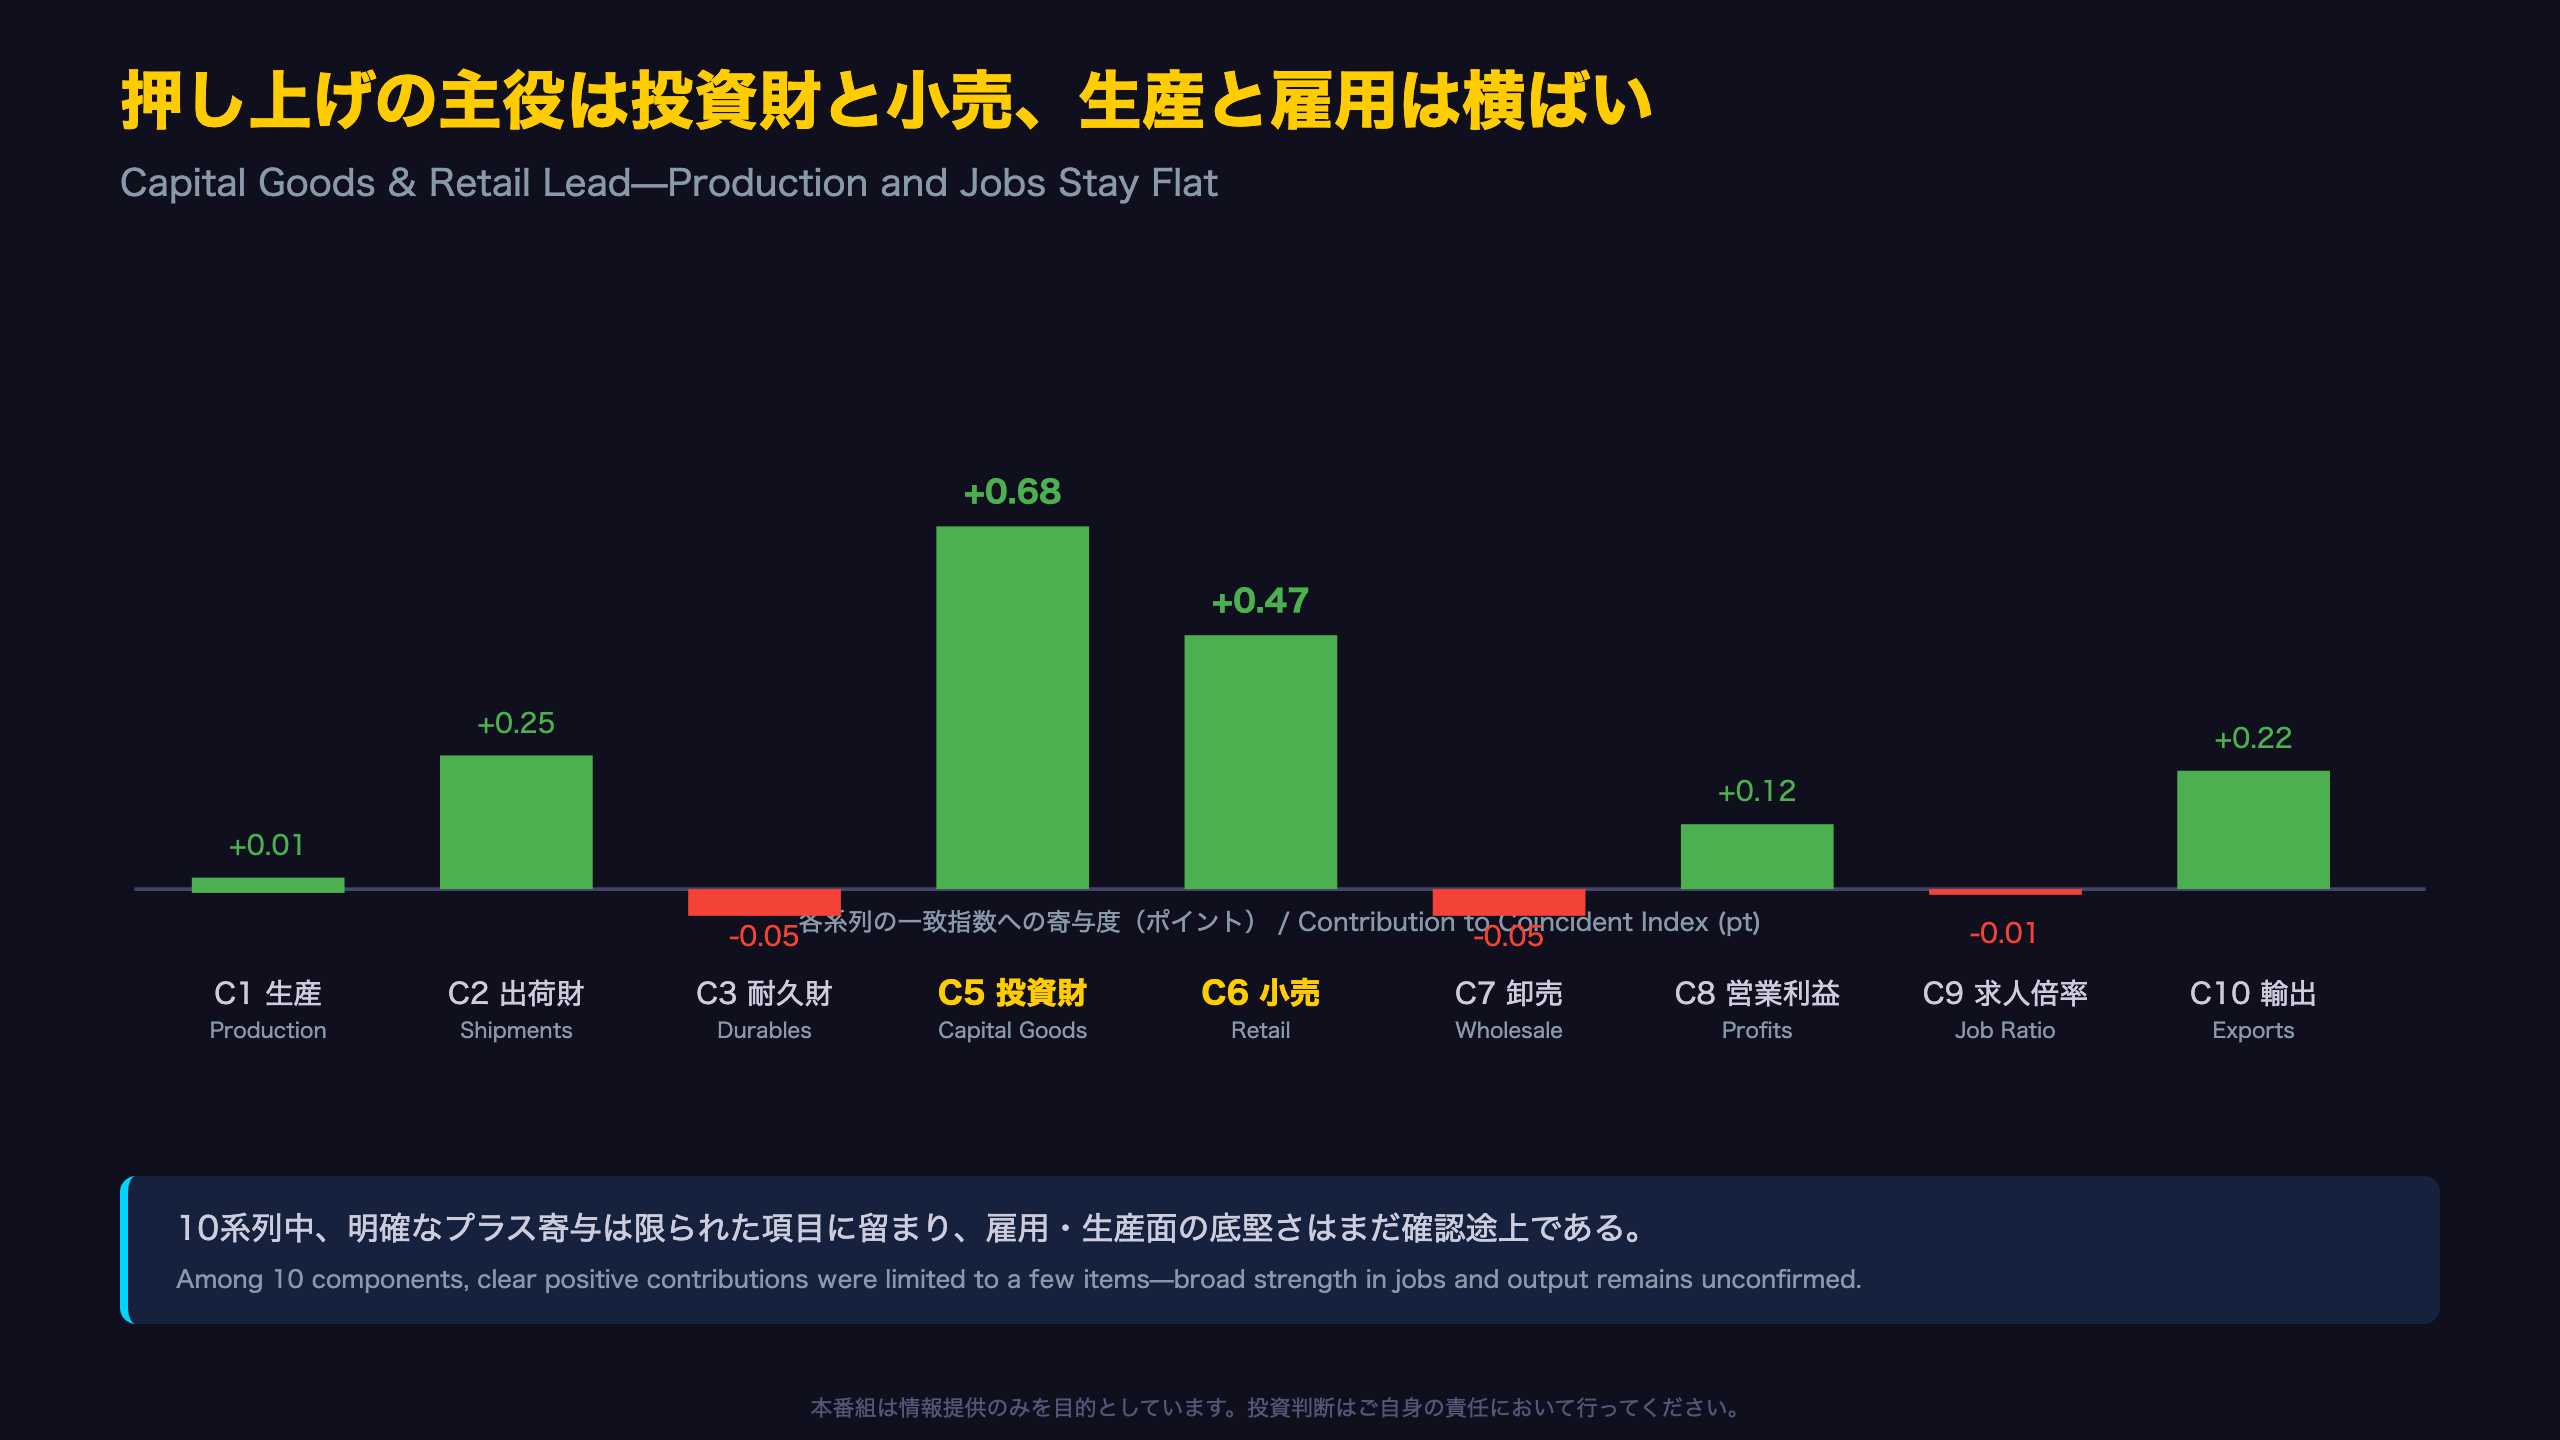
Decomposing the Gain: Which Components Drove It
Breaking down the Coincident Index’s +1.7 point monthly change by component contribution (as reported):
| Component | Contribution |
|---|---|
| Capital goods shipments (ex-transport) | +0.68 |
| Retail sales (YoY) | +0.47 |
| Export volume index | +0.22 |
| Operating profits (all industries) | +0.12 |
| Producer goods shipments | +0.25 |
| Industrial Production Index | +0.01 |
| Labor input index | 0.00 |
| Job-openings-to-applicants ratio | -0.01 |
| Durable consumer goods shipments | -0.05 |
| Wholesale sales (YoY) | -0.05 |
Capital goods shipments (excluding transport equipment) climbed from 100.4 in May to 103.4 in June and 109.0 in July—two consecutive months of accelerating growth, potentially signaling firming capital expenditure demand.
Production and Labor Market Remain Flat
However, the Industrial Production Index barely moved (102.6 → 104.6 → 104.7), and the job-openings ratio has held at essentially the same level (1.17 → 1.18 → 1.18) for three straight months.
Note that two components—labor input and corporate operating profits—had not yet been published for July (shown as “-” in the source table) and are represented only by trend estimates. This means the headline figure carries a built-in one-to-two month reporting lag on these series, a structural quirk of Japan’s CI methodology worth understanding when comparing it to, say, the U.S. ISM PMI which is fully current each month.
Bull vs. Bear Read
The optimistic read: demand-side drivers (capex and consumption) are clearly firming. The cautious read: without a corresponding pickup in production or the labor market, the durability of this demand-led gain remains unproven.
先行指数、3か月平均は13か月連続上昇——息の長い改善基調
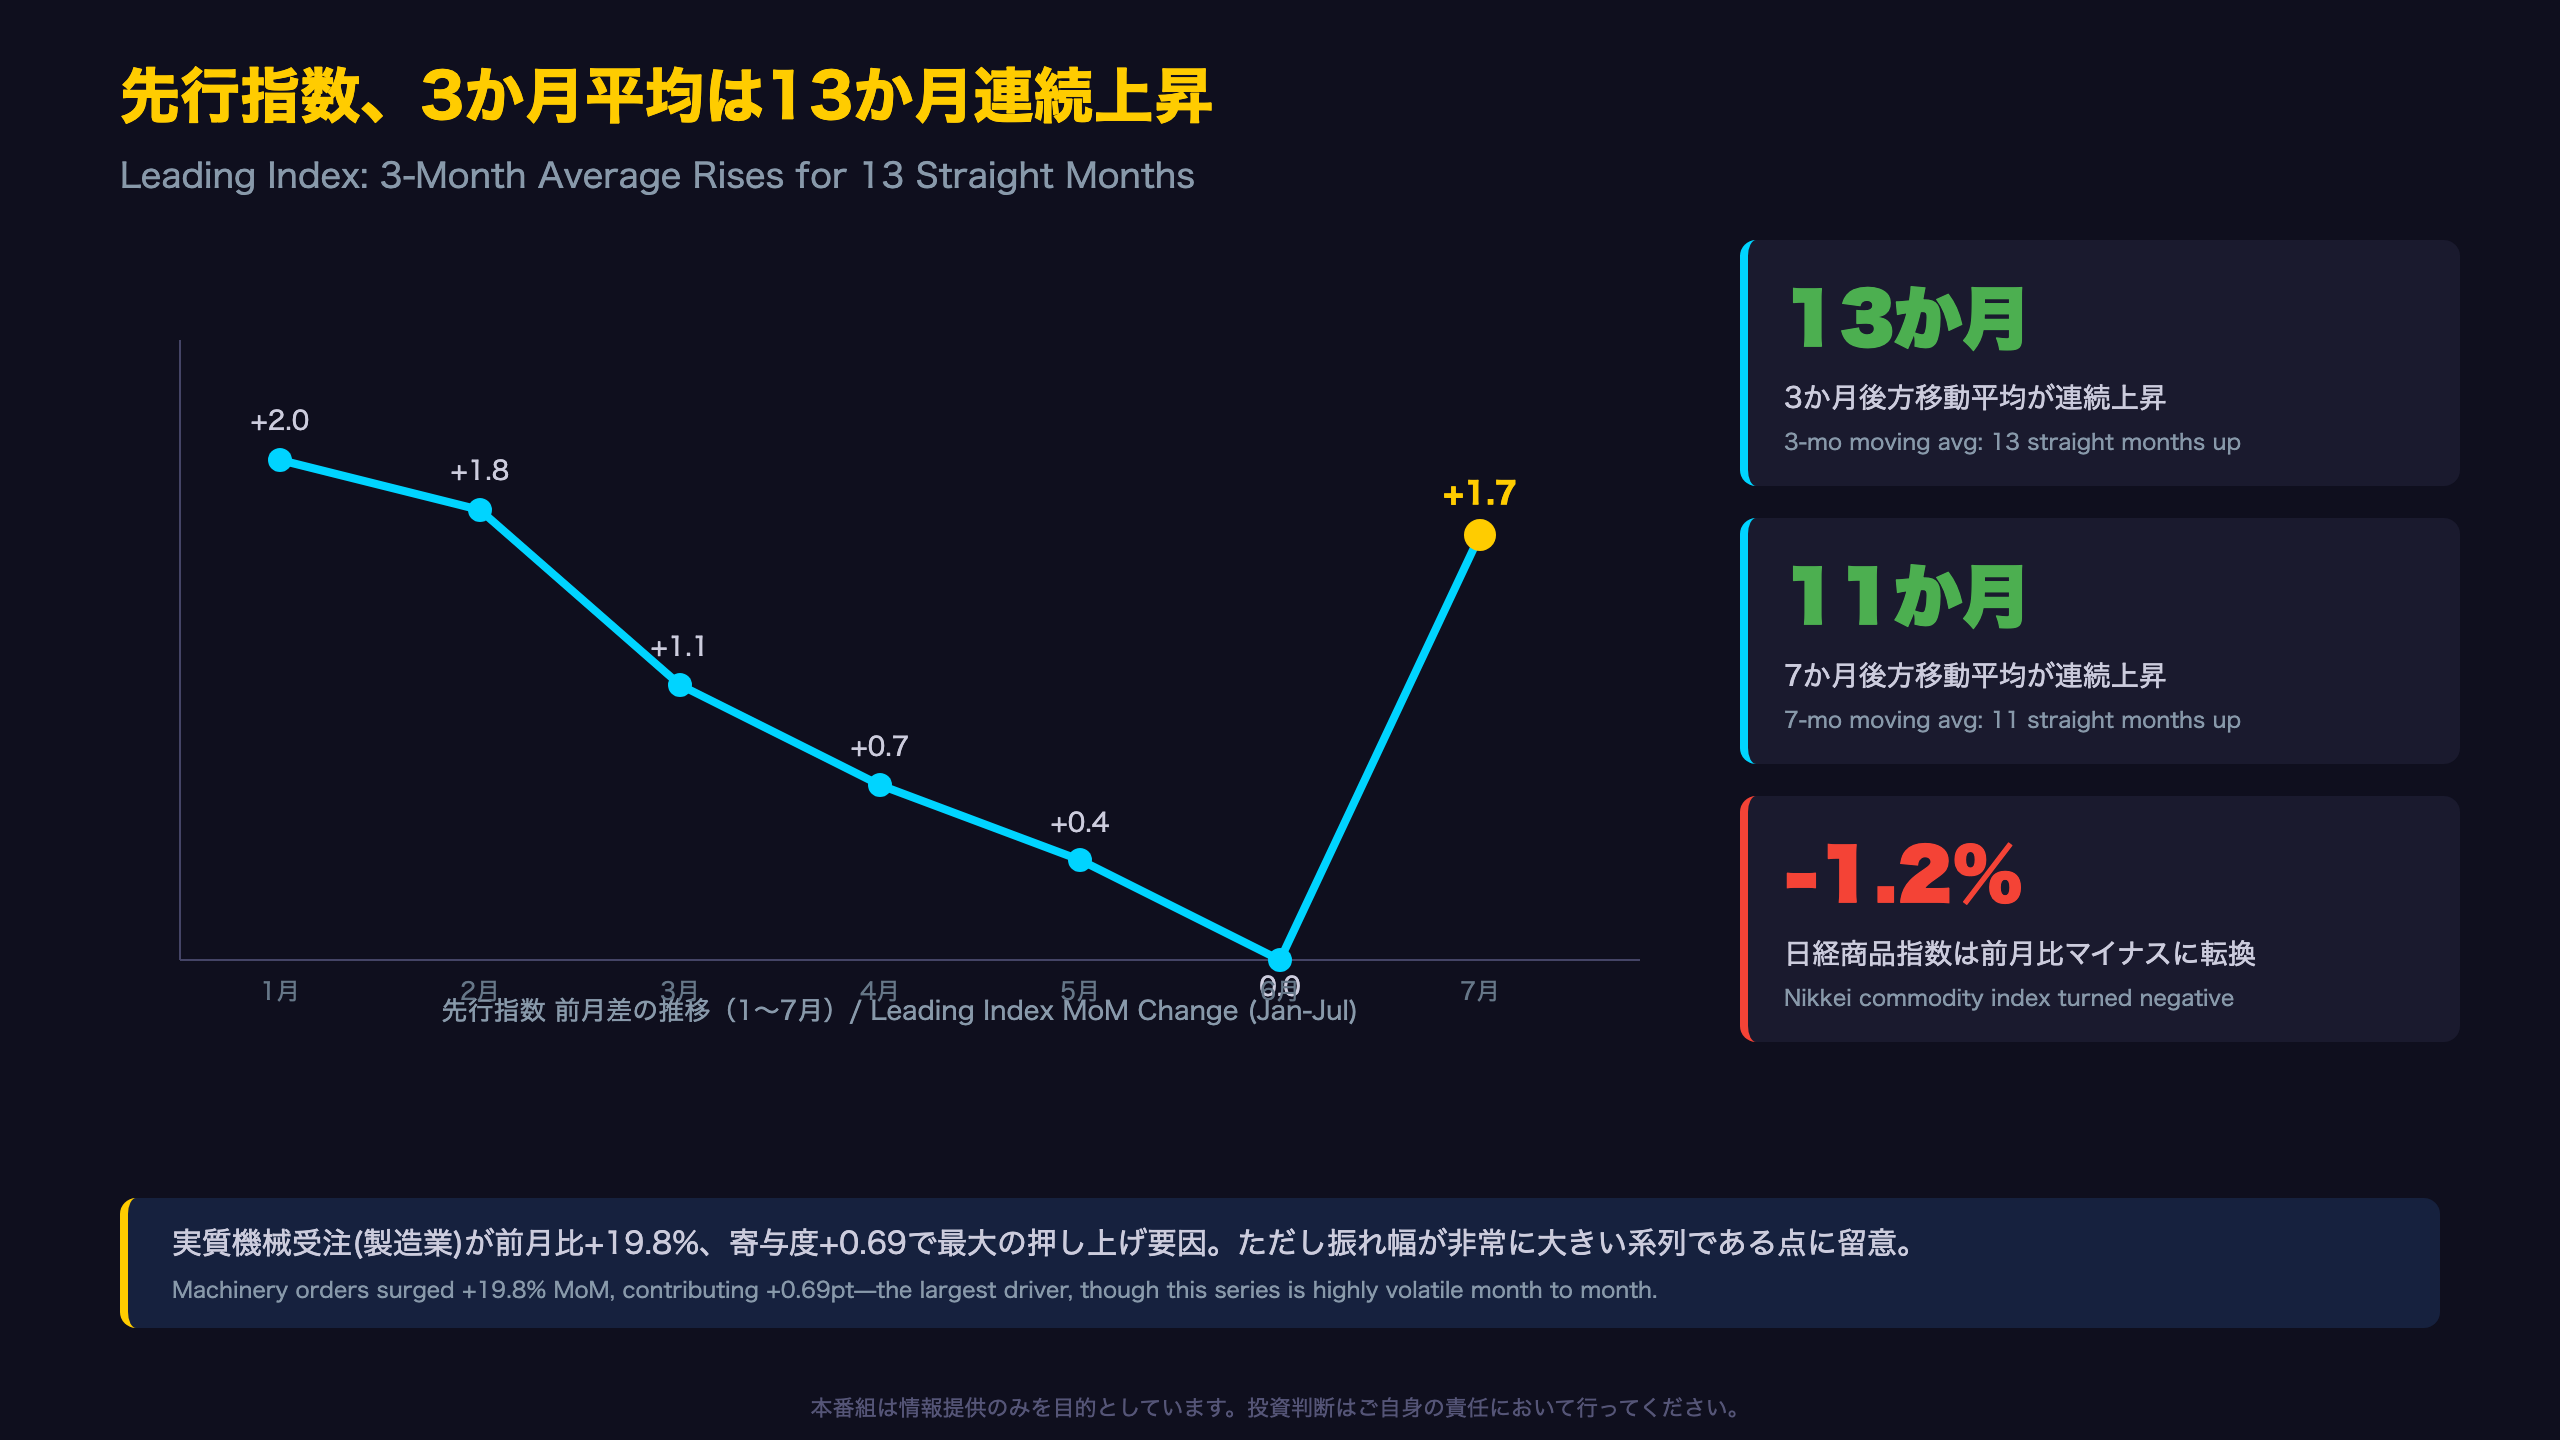
Reading the Leading Index’s Long-Run Momentum
The Leading Index rose to 117.9 (+1.7pt MoM), its first gain in two months. What matters more than the single-month figure is the persistence of its moving averages.
The Cabinet Office’s release states the 3-month moving average rose for its 13th consecutive month, while the 7-month moving average extended its rise to 11 consecutive months. For context, the Leading Index functions similarly to the U.S. Conference Board’s LEI, but Japan’s version places heavier weight on machinery orders, credit conditions, and inventory-cycle indicators rather than yield-curve spreads.
Component Deep Dive
The single largest driver has been real machinery orders in manufacturing (L4), an extremely volatile series that swung from -12.4% in January to +30.3% in February, then -14.7%, +3.8%, -14.8%, and +19.8% through June. While this is a genuine capex-cycle signal, its month-to-month swings comfortably exceed the CI’s historical standard deviation (1.08 points for the 3-month moving average), meaning single-month readings should be treated with caution.
Meanwhile, the Nikkei Commodity Index (L7) turned negative in June (-1.2% MoM), a reminder that commodity price swings can become a headwind for the Leading Index going forward.
Bull vs. Bear Take
Bulls would argue that 13 and 11 months of consistent moving-average improvement is too long to be statistical noise—it likely reflects genuine underlying momentum, comparable to a sustained uptrend in the U.S. LEI. Bears would counter that leaning heavily on a single volatile series like machinery orders creates asymmetric reversal risk if capex orders cool.
遅行指数7か月平均、9か月ぶりプラス転換——ただし改定の振れ幅に注意
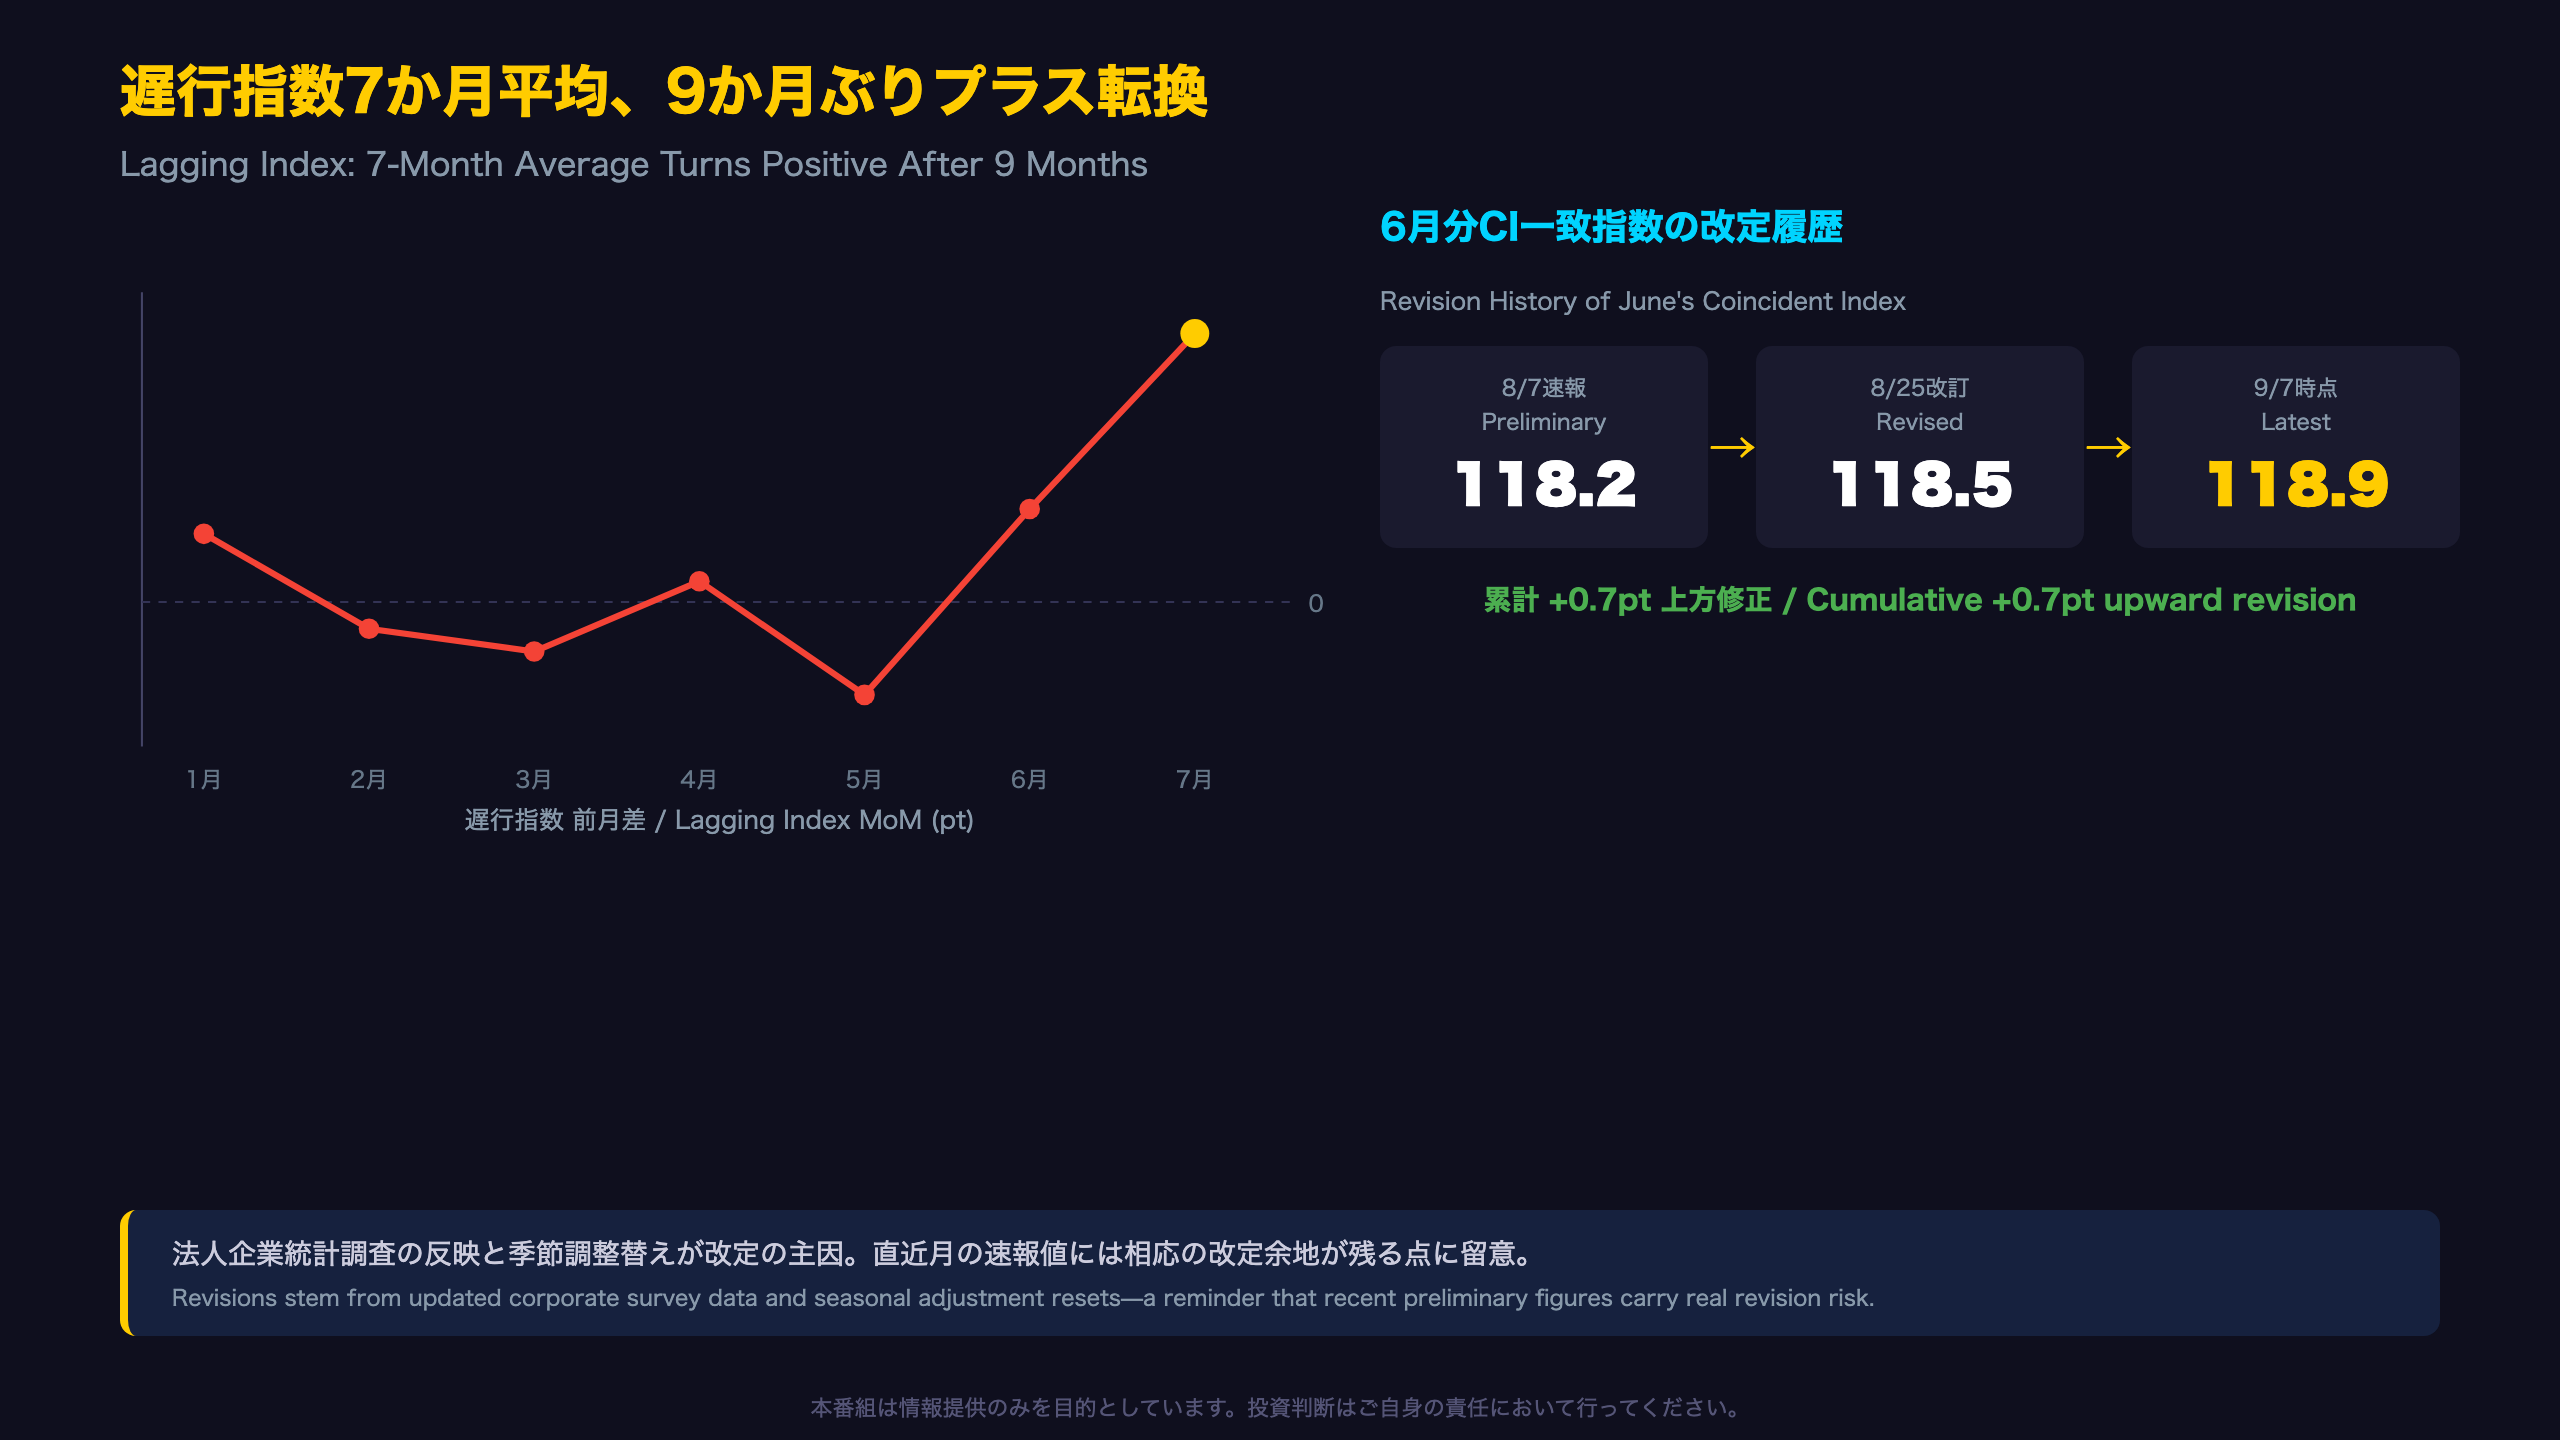
Signs of a Bottom in the Lagging Index
The Lagging Index rose to 113.3 (+1.6pt MoM), its second consecutive increase. Notably, its 7-month moving average turned positive at +0.21 points, the first rise in nine months.
Japan’s Lagging Index comprises series such as the unemployment rate, real corporate capital expenditure, and household consumption expenditure, indicators that typically respond only after the broader cycle has already turned. A turn in the 7-month average after nine months of decline suggests employment and capex-related adjustment may be nearing completion, though this remains a moderate-confidence inference (Level B) rather than a confirmed structural shift.
Revision Risk: Tracking June’s Coincident Index
One of the more striking details in this release is how much June’s coincident index figure moved across successive publications:
| Release Date | June Coincident Index |
|---|---|
| Aug 7 (preliminary) | 118.2 |
| Aug 25 (revised) | 118.5 |
| Sep 7 (as shown in July report) | 118.9 |
That’s a cumulative +0.7 point upward revision across two rounds. According to the Cabinet Office, this reflects the incorporation of the Q2 (Apr-Jun) Financial Statements Statistics of Corporations survey and a seasonal adjustment reset, which retroactively revised the investment environment index, real corporate capex, and operating profits series.
For context, this kind of multi-round revision is larger than what U.S. investors typically see with, say, initial GDP estimates being revised in the second and third readings, underscoring that Japan’s monthly CI, like many coincident economic indicators globally, should be read with an awareness of its preliminary nature.
Looking Ahead
Optimists would note that a turn in the lagging composite, historically the last piece of the cycle to improve, adds credibility to the broader improving narrative. Skeptics would point out that if June was revised up by 0.7 points across two releases, July’s headline 120.6 could itself see similar revision in the months ahead. The next release, covering August data, will be watched closely for whether labor-market series such as the job-openings ratio show renewed strength.
Disclaimer: This article is for informational purposes only. All investment decisions are made solely at your own risk.