📺 Watch the Full Video Analysis
This article was automatically generated by the NFC Market Live AI analysis system. (Updated: 2026-09-04 21:39 JST)
📄 Primary Source
Statistics Canada
https://www150.statcan.gc.ca/n1/daily-quotidien/260904/dq260904a-eng.htm
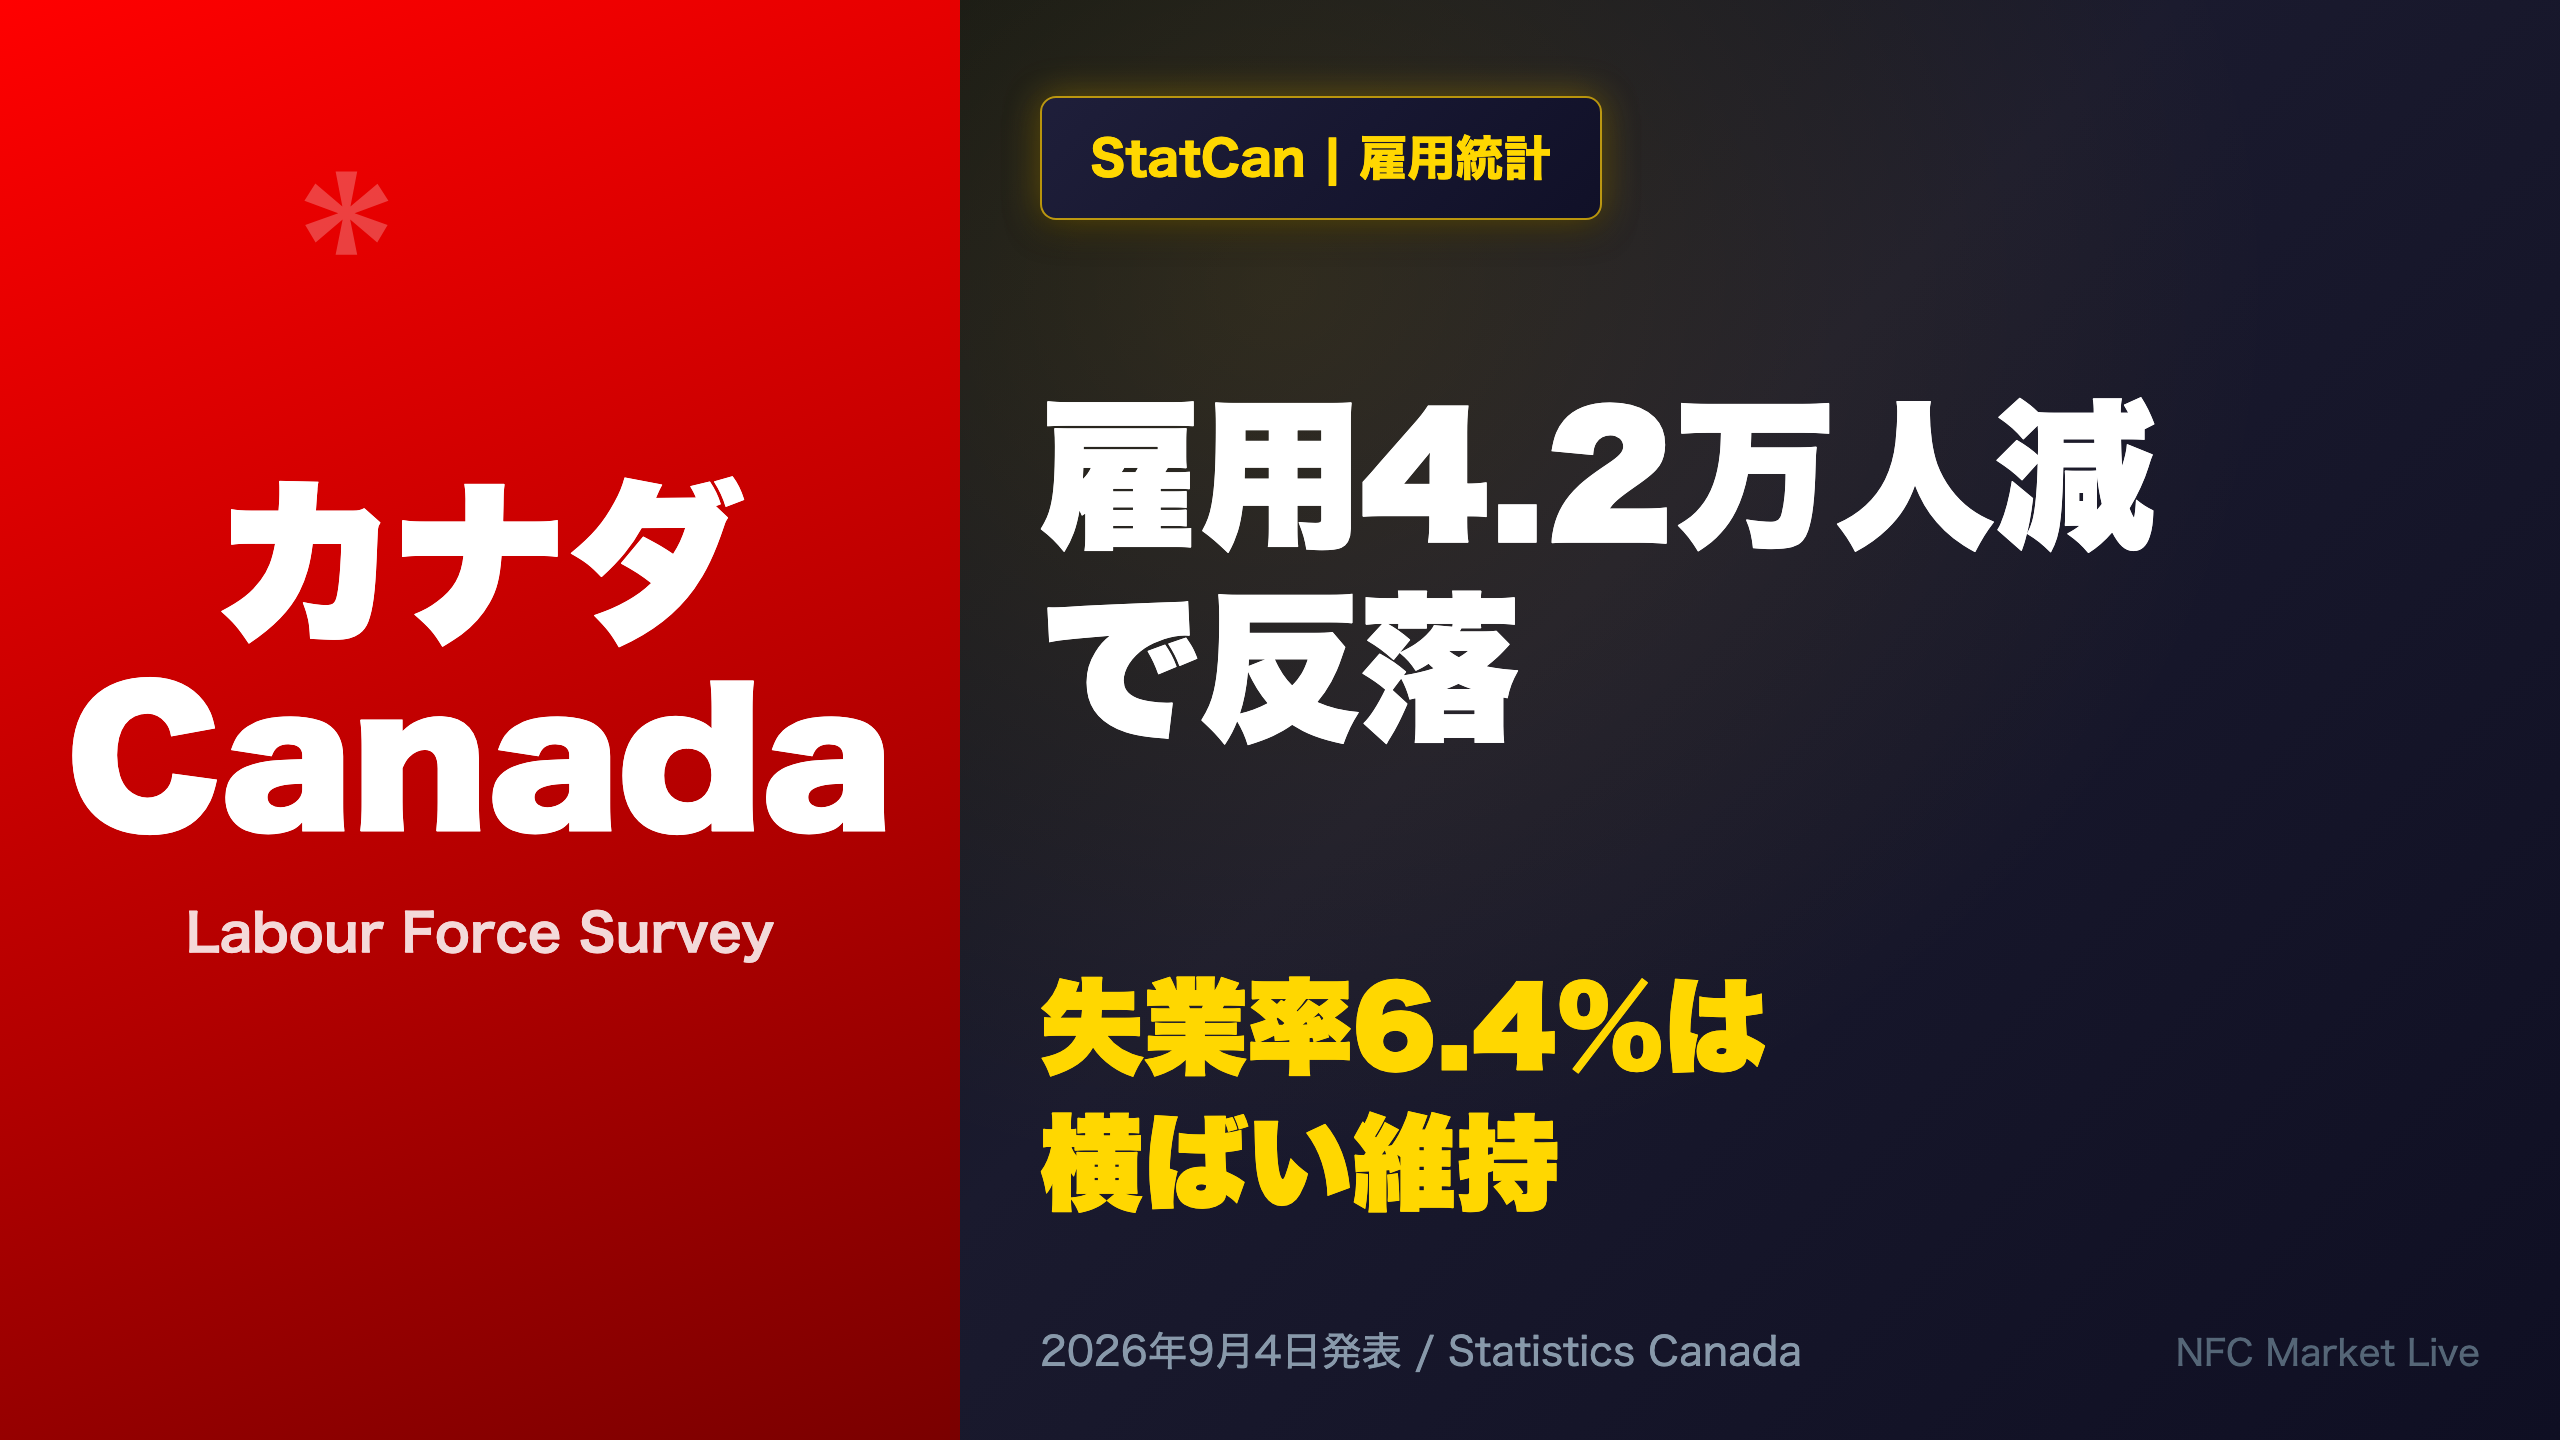
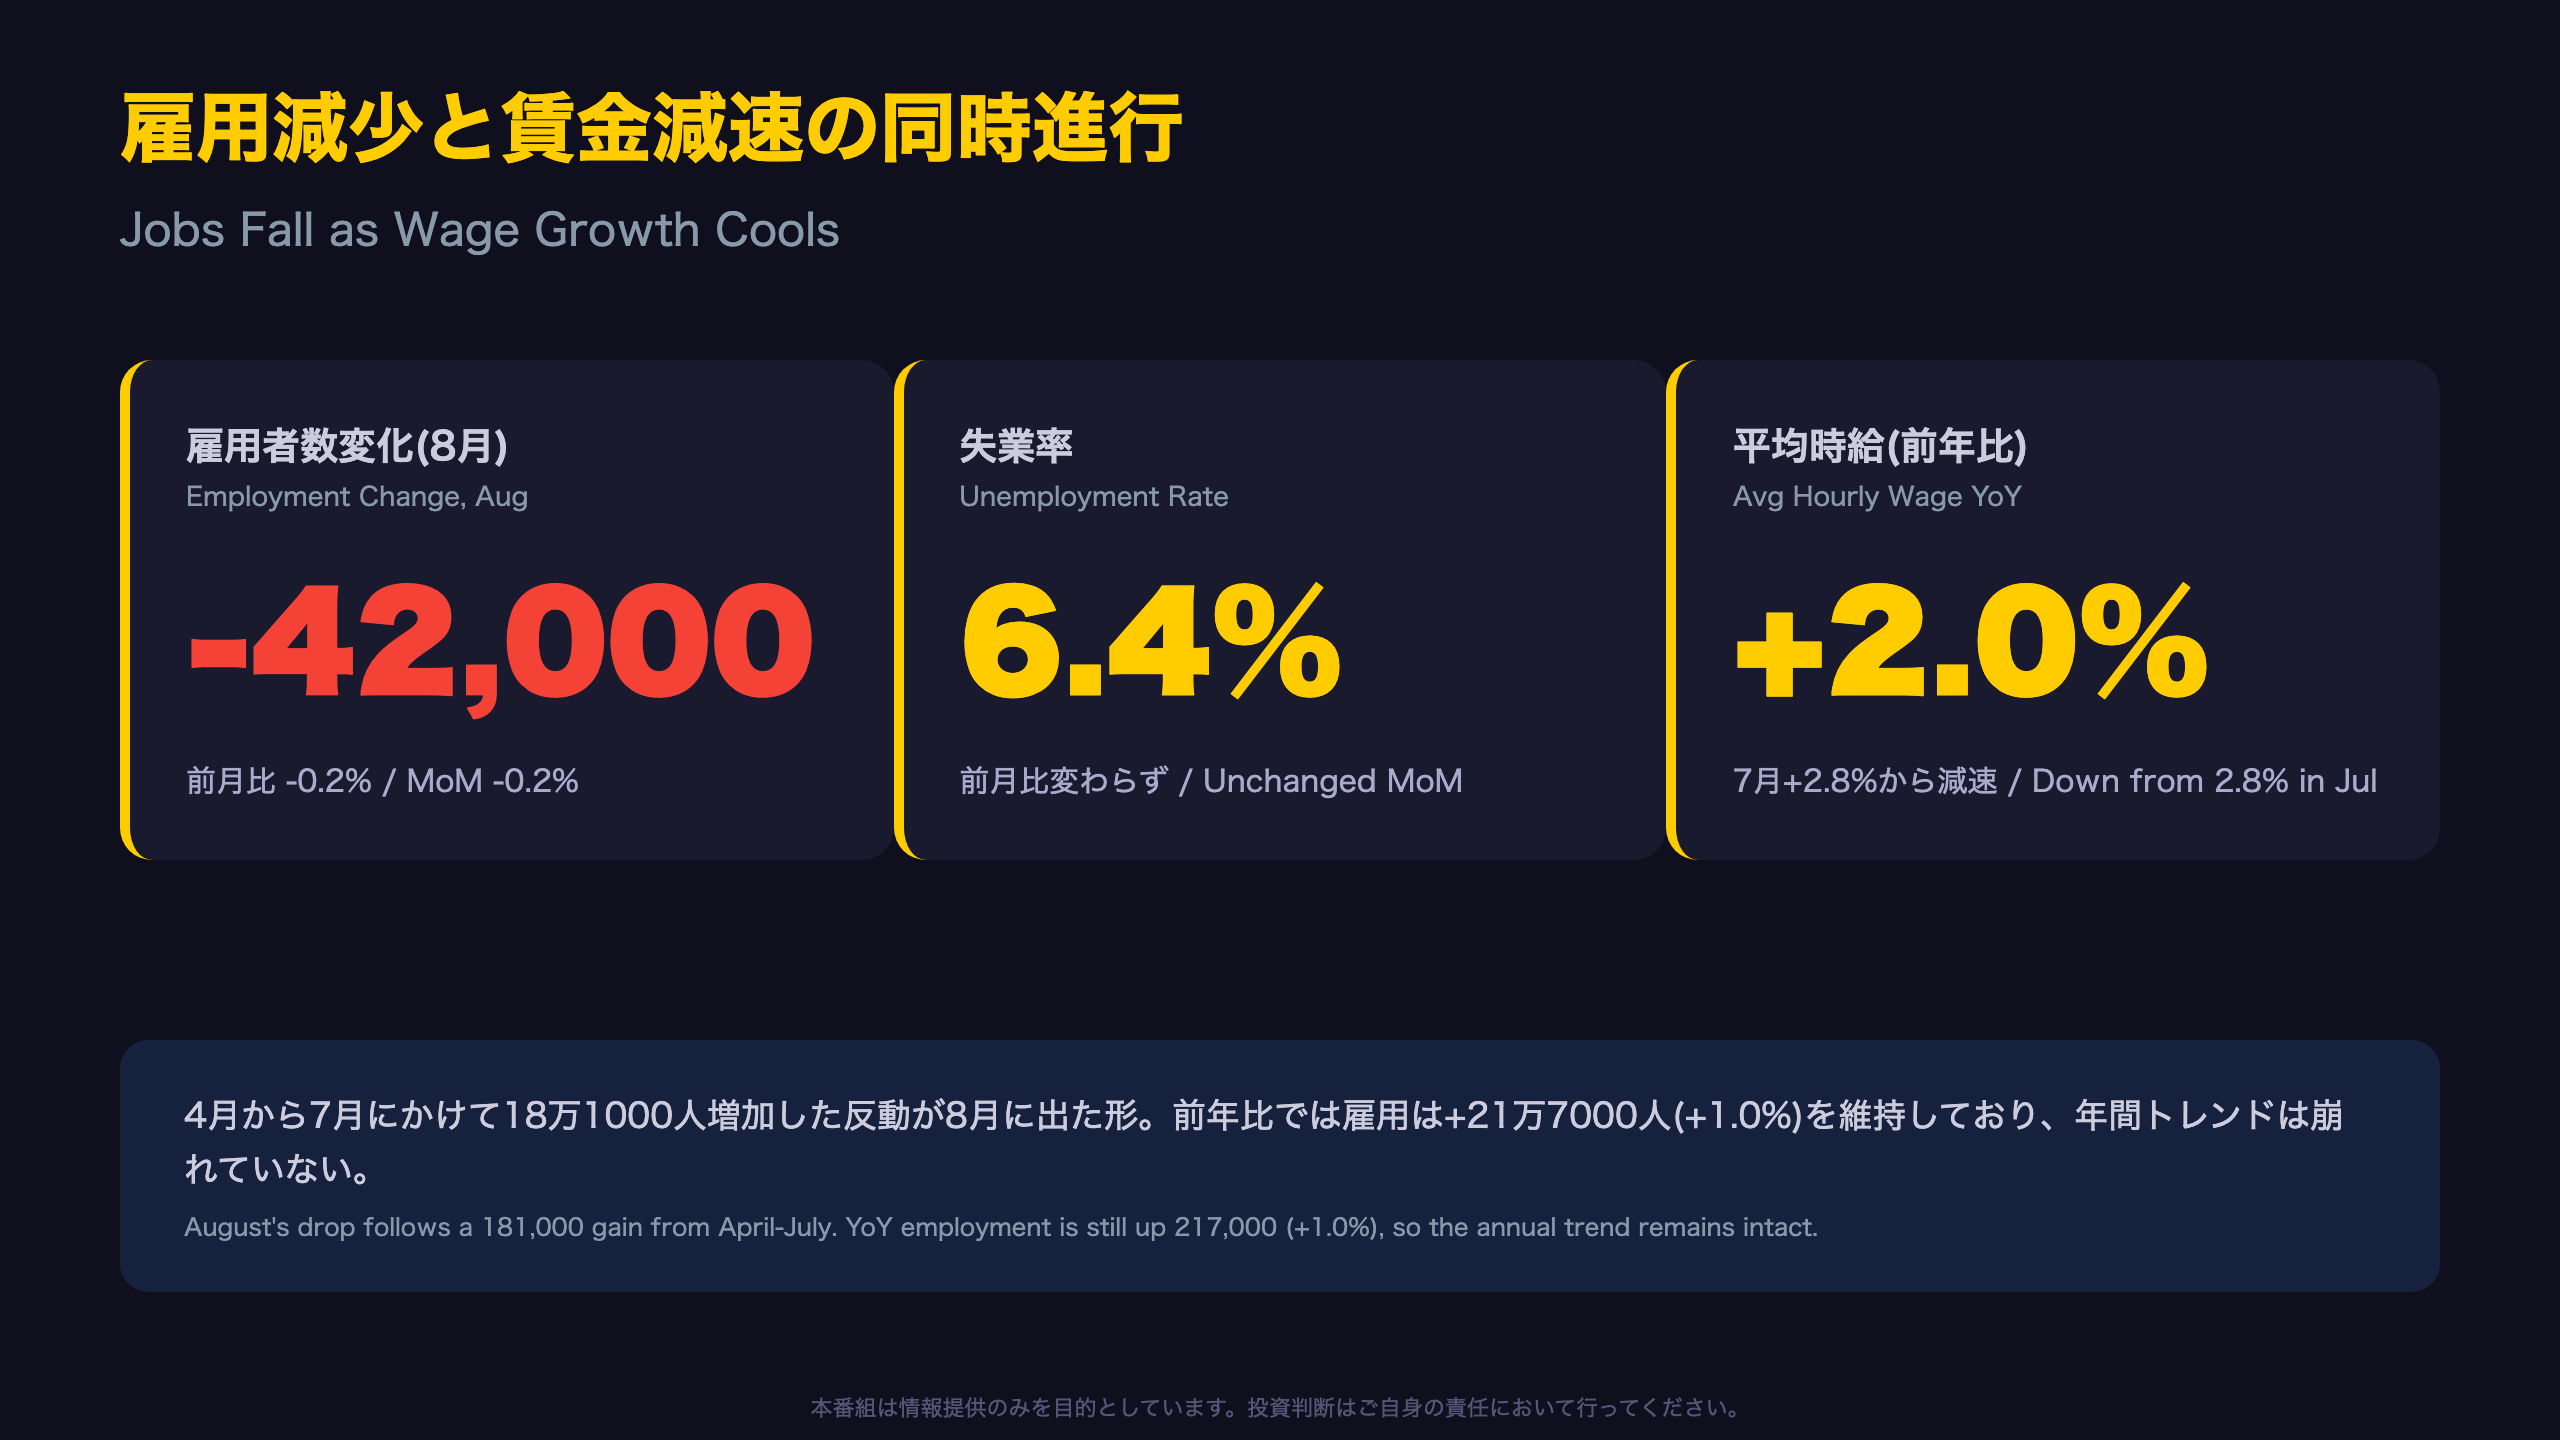
Canada’s August Labour Force Survey shows employment fell by 42,000 (-0.2%), reversing a cumulative 181,000 gain from April to July. 📊
The unemployment rate held steady at 6.4%. Meanwhile, year-over-year wage growth decelerated to 2.0% — the slowest pace since November 2017 (excluding the pandemic). 💰
Public sector employment fell for a third straight month, manufacturing was the lone bright spot, and Quebec was the only province with a year-over-year employment decline. ⚠️
We break down what this means for the Bank of Canada’s policy stance and its hidden Markov model’s unemployment variable. 📉
雇用減少と賃金減速の同時進行
Context: A Pullback After Four Months of Gains
August’s 42,000 job decline should be read against the backdrop of a strong run: employment rose by a cumulative 181,000 (+0.9%) from April through July, according to Statistics Canada’s Labour Force Survey (LFS). The agency’s own release frames the drop as following “a cumulative increase of 181,000 (+0.9%) from April to July,” which tempers the headline’s negative optics.
Background: What is the LFS?
The LFS is Canada’s equivalent of the US Bureau of Labor Statistics’ monthly jobs report, surveying roughly 65,000 households (100,000+ respondents) monthly. It is the primary input for the Bank of Canada’s labour market assessment, feeding directly into models such as its hidden Markov regime-switching framework for the unemployment rate.
Year-over-year trend remains intact
On a 12-month basis, employment is still up 217,000 (+1.0%), indicating the underlying annual growth trend has not broken down despite the monthly dip.
Employment rate near year-start levels
The employment rate fell to 60.8%, which StatCan describes as “on par with the rate recorded at the start of the year” — a detail that argues against reading August as a trend reversal.
Market implication: A single soft print with an intact YoY trend is unlikely to be a standalone trigger for a BOC rate move; markets will look for confirmation in the September release (Oct 9).
内訳の中身:若年層減少とコア男女の対照
What Falling Participation Tells Us
The participation rate slipped 0.1 points to 65.0%, which StatCan notes was simply “offsetting a similar-sized increase in July” — suggesting this is noise around a flat trend rather than a new signal.
The Core-Age Gender Divergence
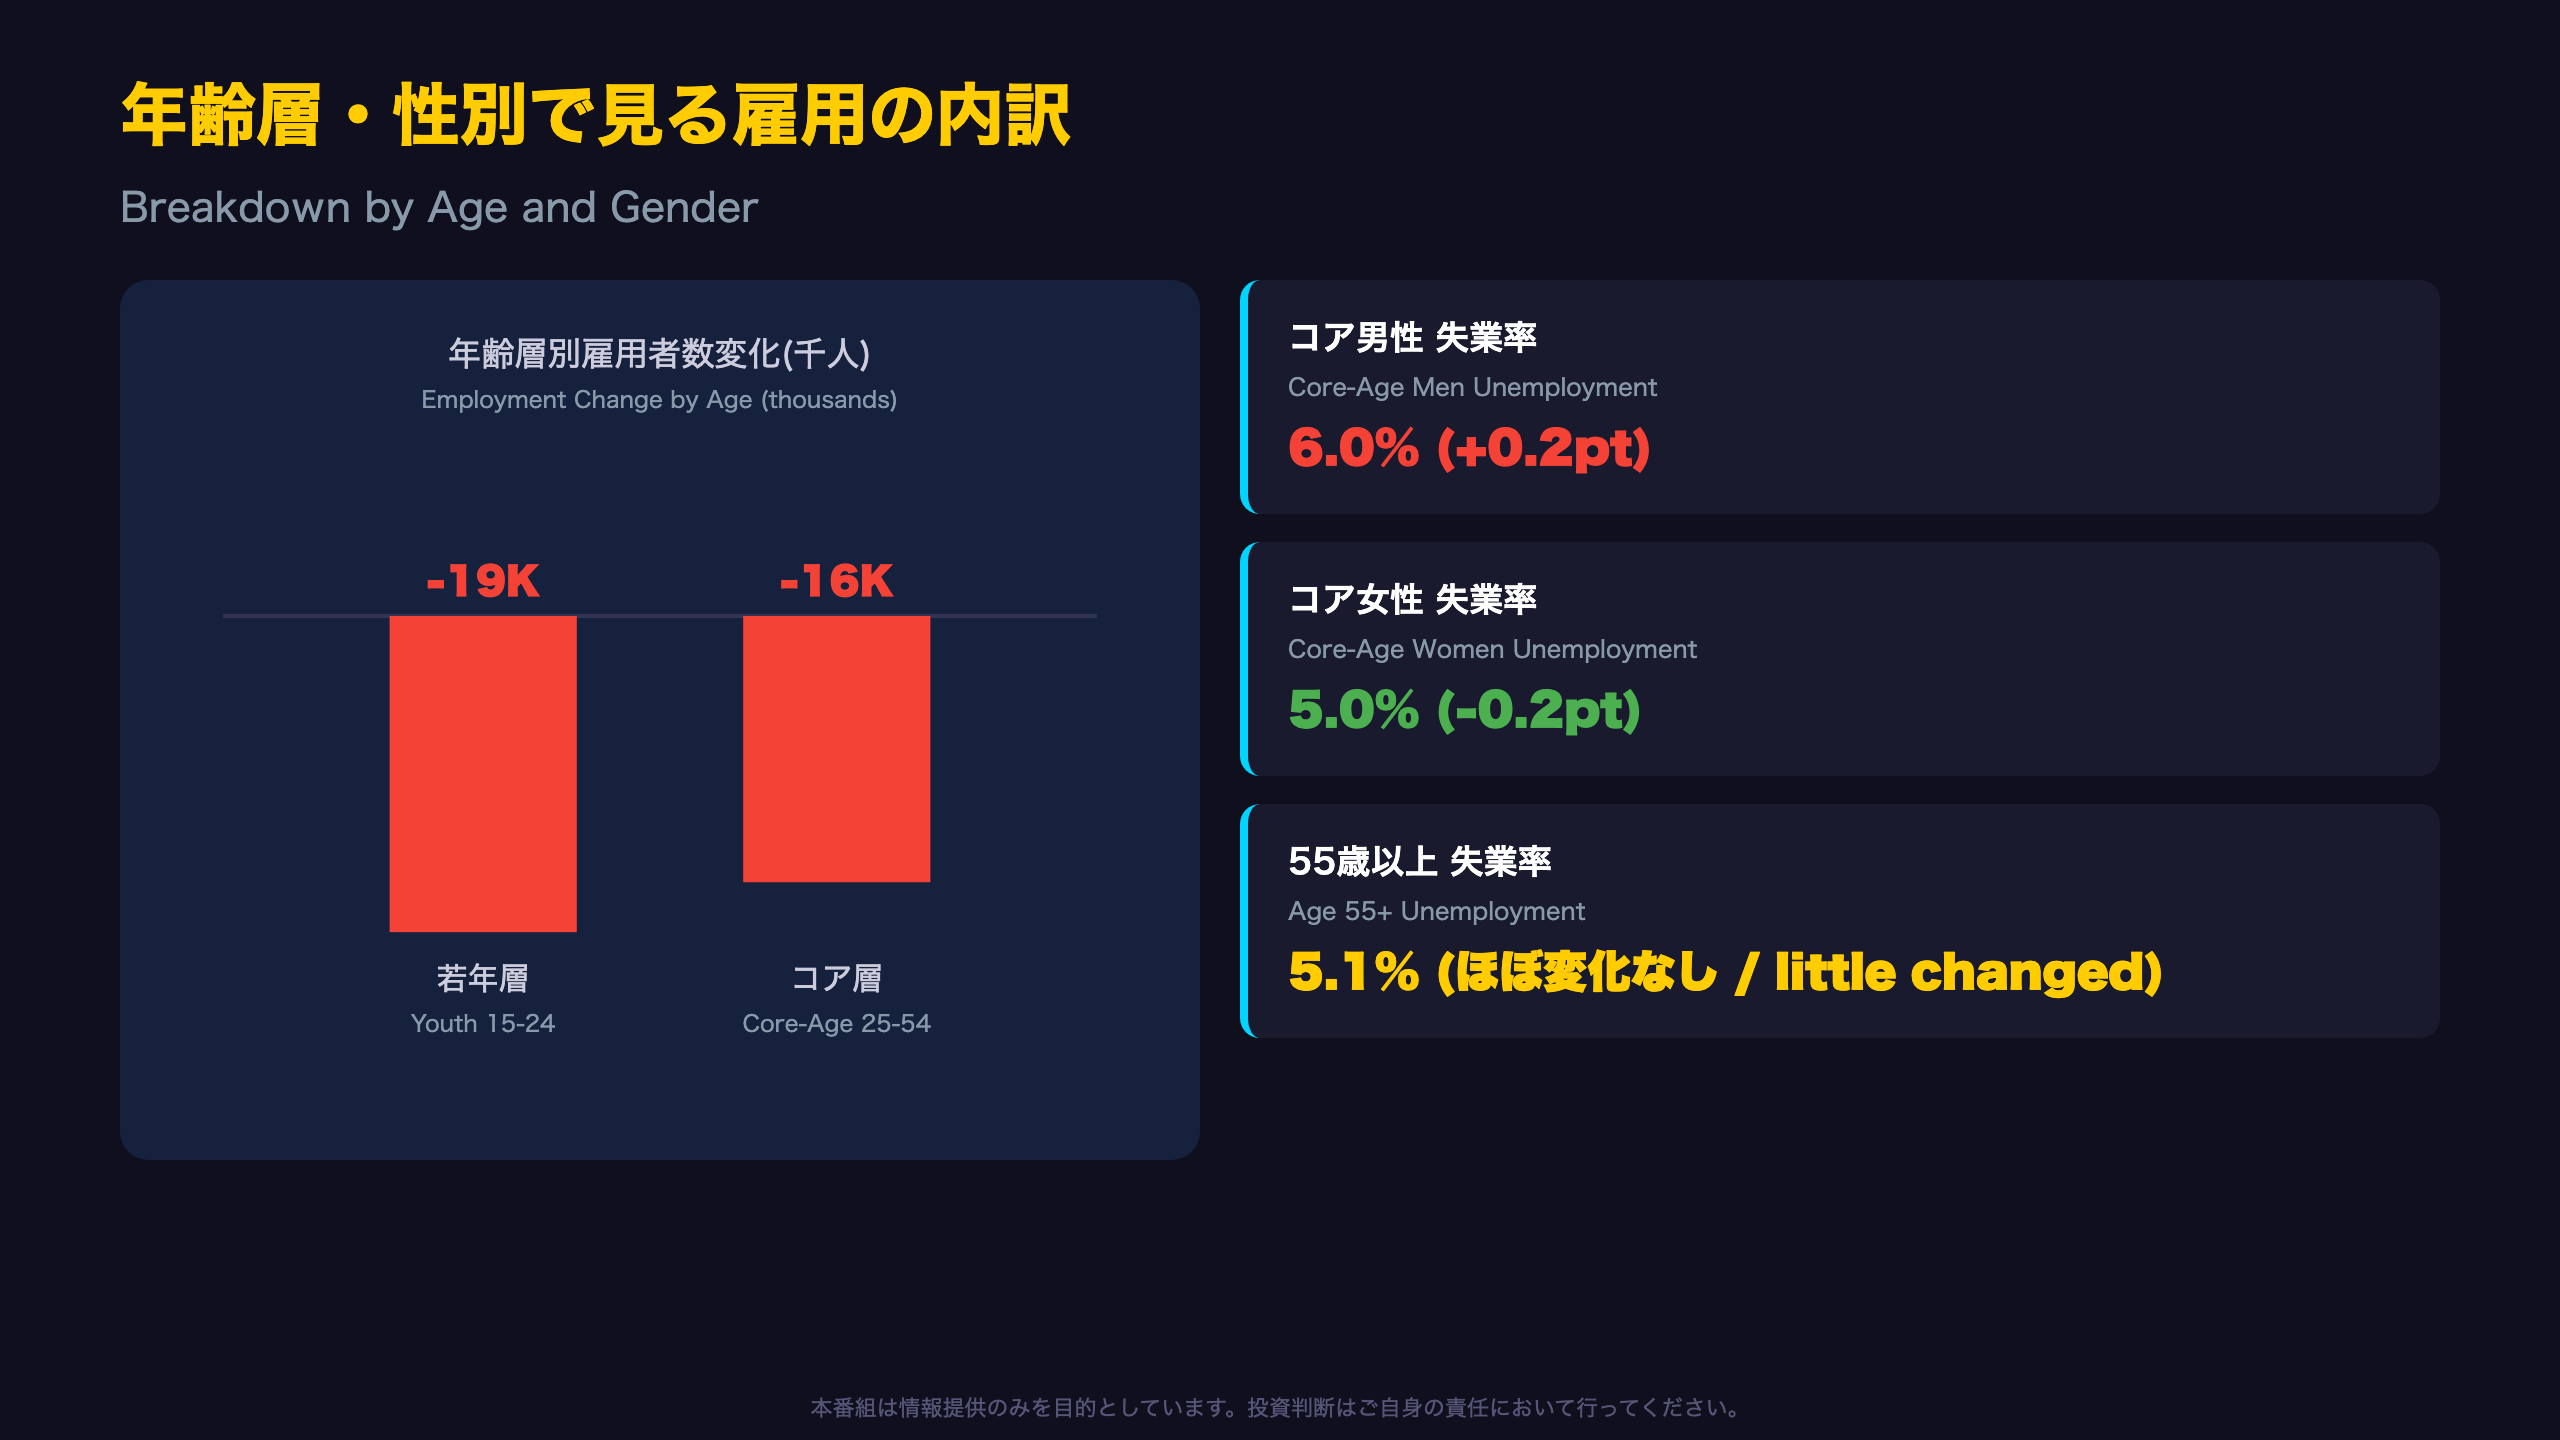
The standout detail this month is the split between core-age (25-54) men and women. Men’s unemployment rate rose 0.2 points to 6.0% as StatCan explains “more men in this age group entered the labour market and searched for work” — arguably a sign of rising labour force engagement, not necessarily weakness.
For core-age women, the unemployment rate fell 0.2 points to 5.0%, but this was driven by a 31,000 (-0.4%) contraction in the female labour force, alongside a 17,000 (-0.3%) drop in employment. The employment rate for this group fell 0.3 points to 80.9%.
Two Ways to Read This
Bearish read: A falling labour force among core-age women could signal discouraged-worker dynamics.
Bullish read: Their employment rate remains 1.5 points above a year ago and still above the 2017-2019 pre-pandemic average of 79.1% — a sign of structural strength that a single month shouldn’t erase.
For context, this age-group data feeds directly into how analysts assess labour market slack — a key input for the BOC’s inflation outlook, since core-age workers represent the bulk of Canada’s wage-earning population.
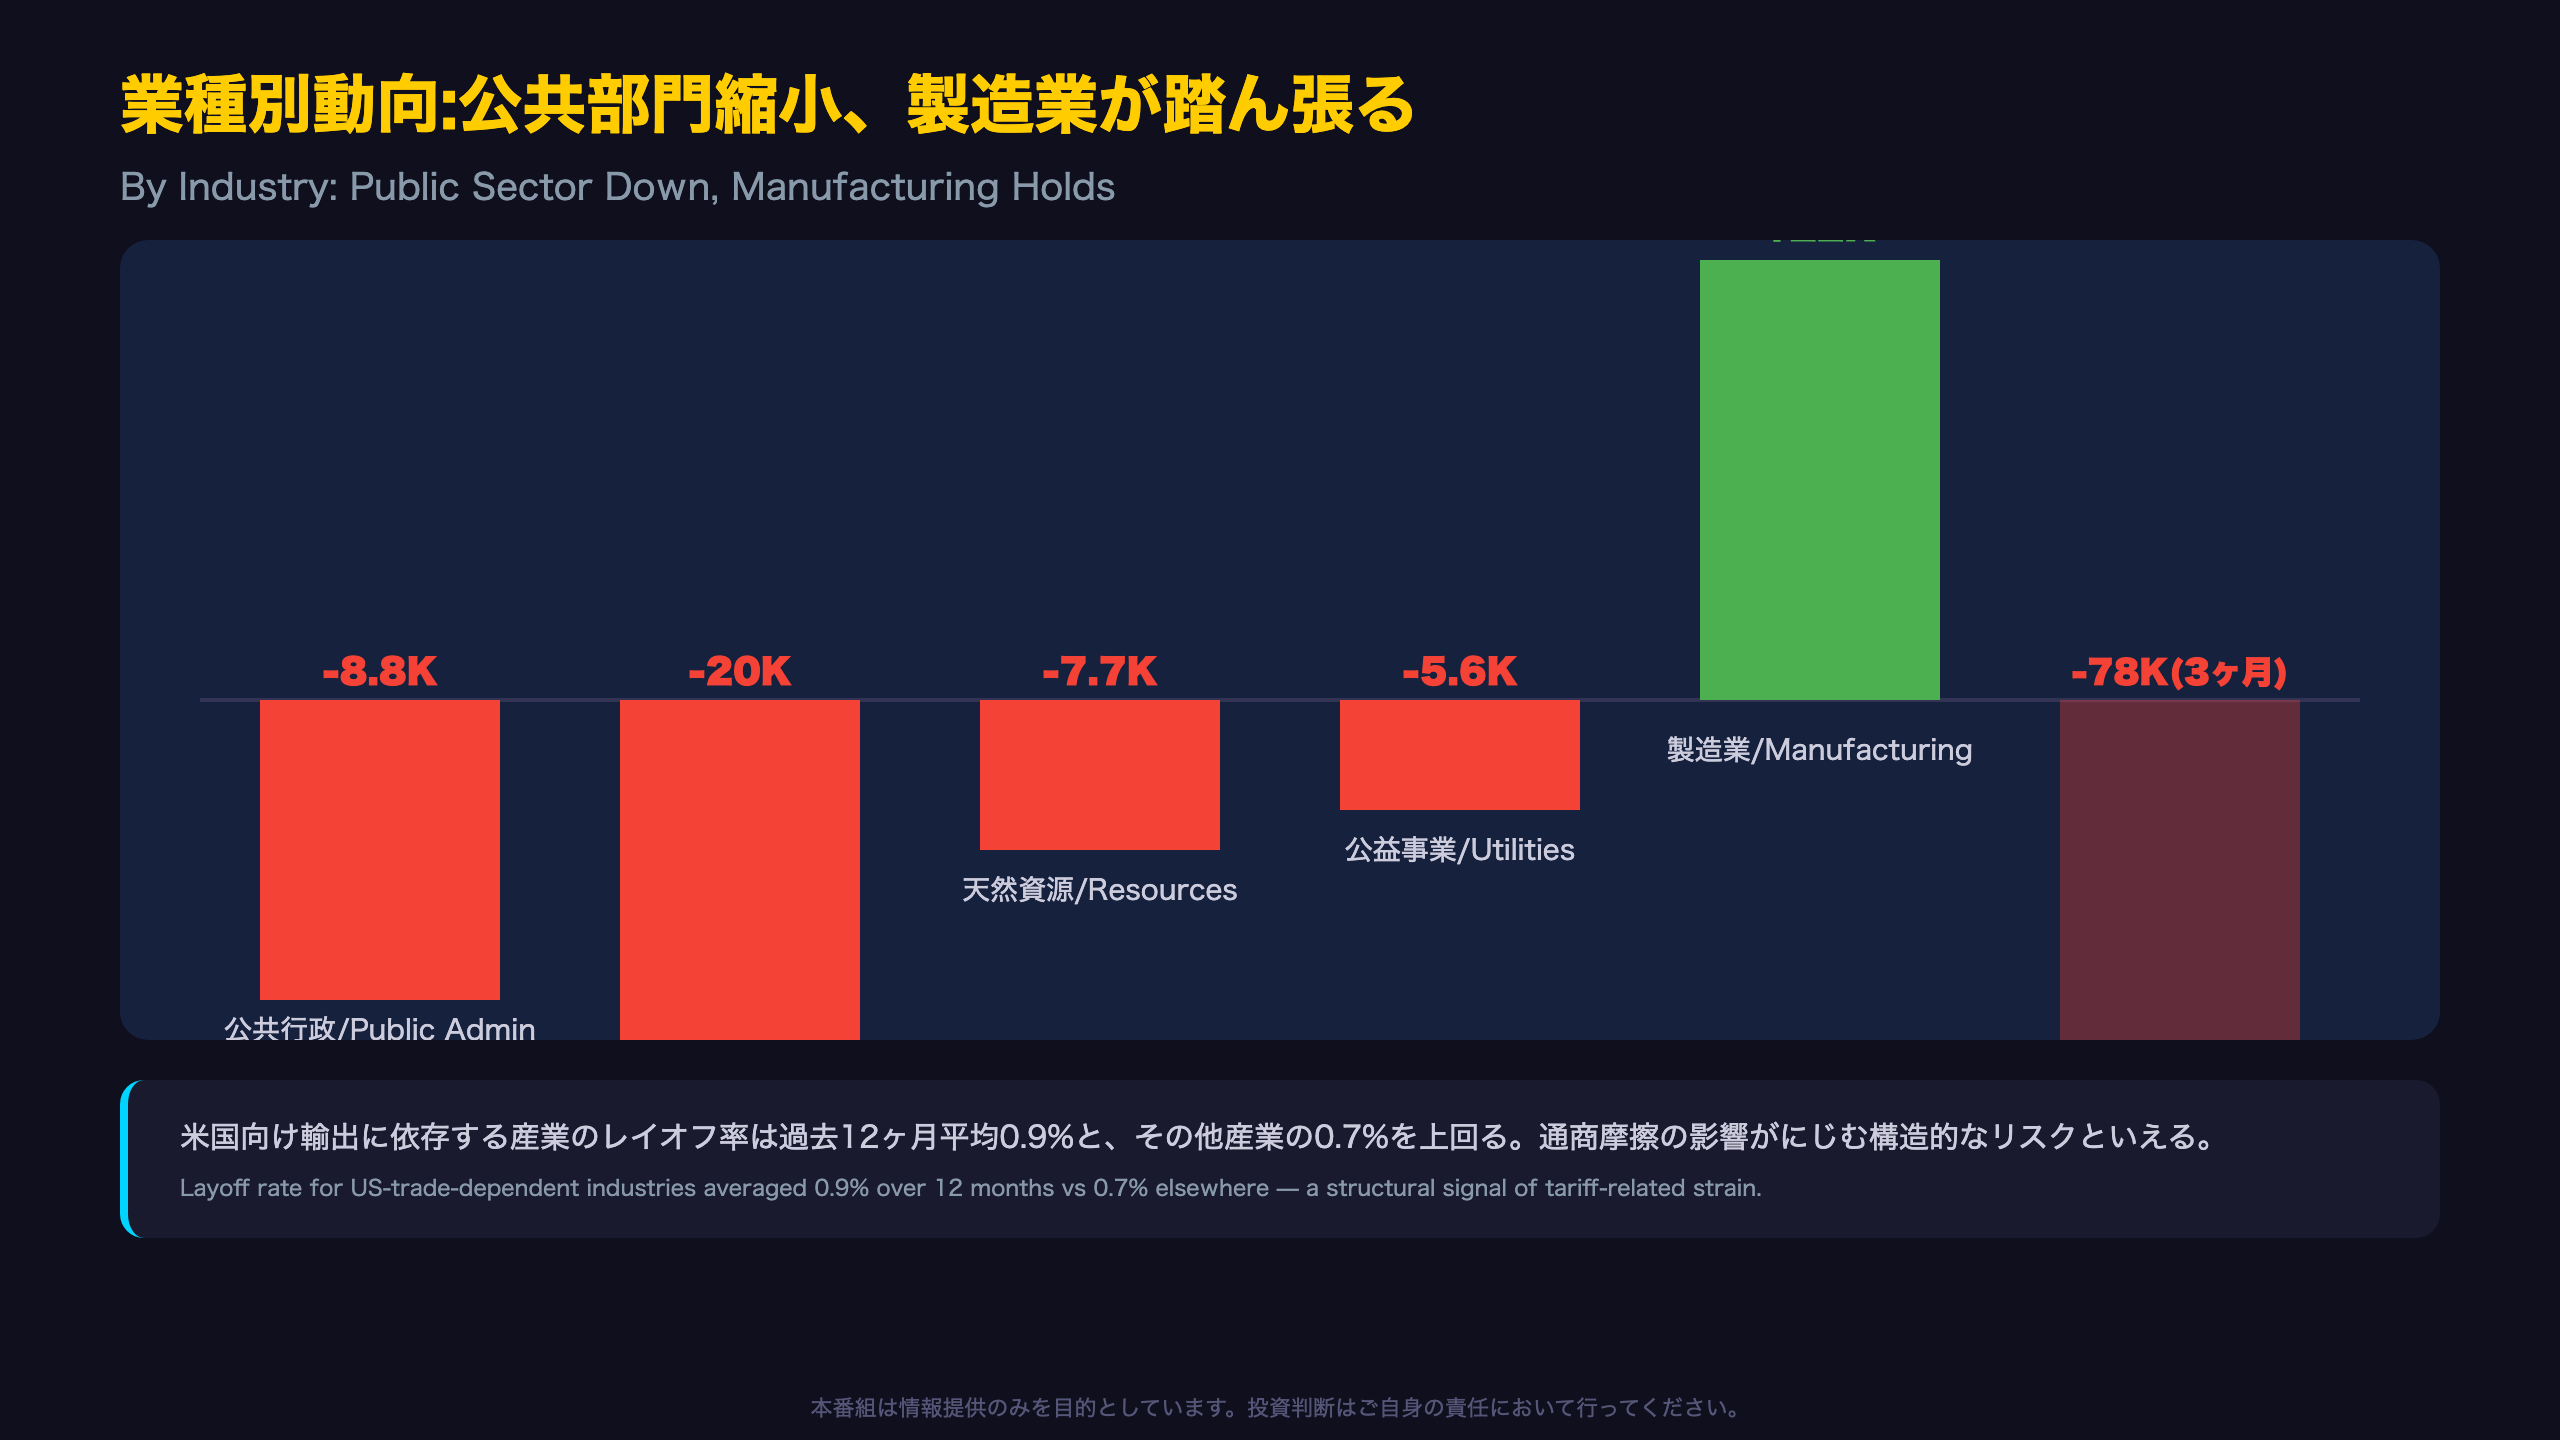
業種別動向:公共部門縮小と製造業の踏ん張り
The Annual Picture Behind the Monthly Noise
Looking beyond August’s monthly swings, the 12-month trend reveals a clearer industry story. According to StatCan, health care and social assistance led growth with +129,000 jobs (+4.5%), followed by information, culture and recreation (+49,000; +5.9%) and transportation and warehousing (+47,000; +4.4%). On the downside, wholesale and retail trade posted the largest annual decline of any industry, down 55,000 (-1.8%).
Public Sector: A Three-Month Slide, But Not Yet a Trend Break
Public sector employment has fallen for three consecutive months (-78,000 since May), yet StatCan notes it was “little changed compared with a year earlier” — meaning the recent slide hasn’t yet reshaped the annual trajectory.
An Unusually Direct Reference to US Tariffs
Notably, StatCan explicitly links labour dynamics to trade policy: “Industries dependent on US demand for exports continue to face an uncertain economic context, compounded by the recent imposition of new US tariffs on Canadian exports.” This shows up quantitatively in layoff rates — 0.9% for US-trade-dependent industries versus 0.7% for others over the trailing 12 months.
Market Implication
For USD/CAD watchers, this tariff-sensitivity detail matters: it suggests trade-exposed manufacturing and resource sectors remain a structural — not just cyclical — source of labour market fragility, which could keep the BOC attentive to downside risks even as headline manufacturing employment (+22,000 in August) looks resilient. Private-sector employment overall was little changed in August but up 156,000 (+1.1%) YoY, while self-employment rose 80,000 (+3.0%) YoY — both cushioning the public-sector pullback.
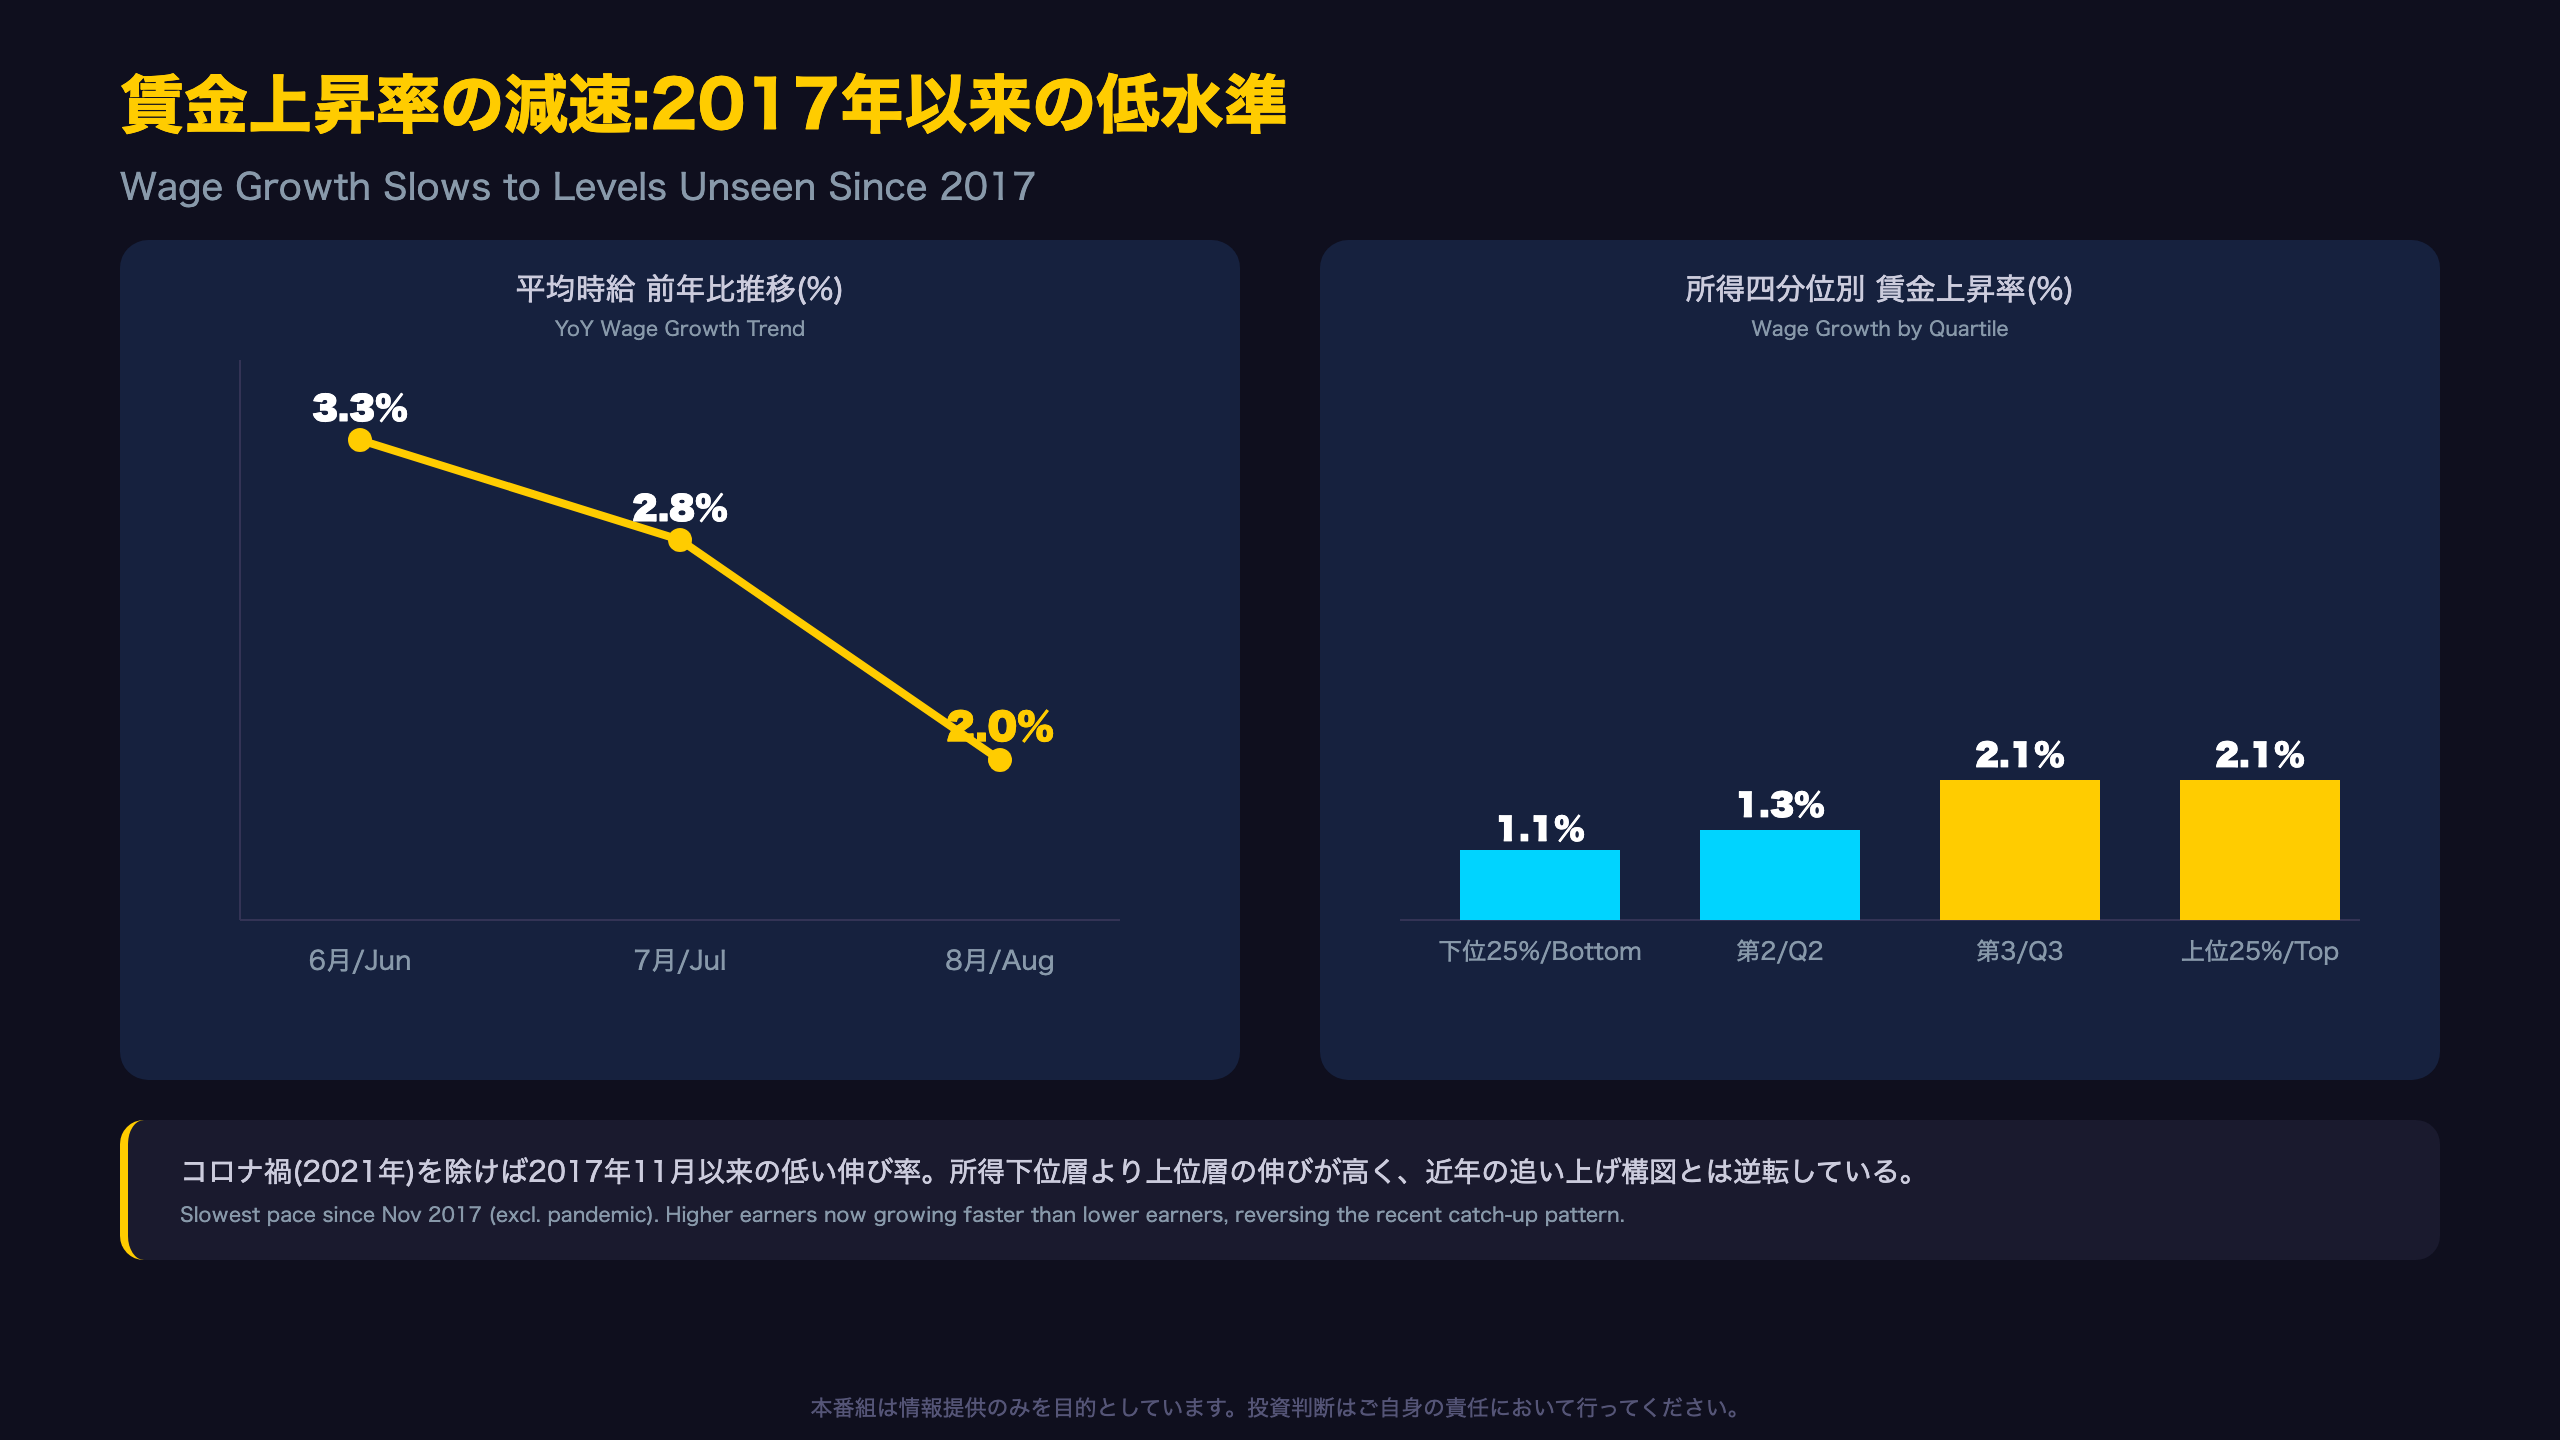
賃金上昇率の減速:2017年以来の低水準
Is This a One-Off or a Structural Shift?
August’s 2.0% wage growth caps a two-month deceleration from 3.3% in June to 2.8% in July. Three consecutive prints moving in the same direction is harder to dismiss as noise. StatCan explicitly notes this is “the slowest [pace] since November 2017 (when it was also 2.0%), excluding the year 2021” — a level-shift worth taking seriously rather than a single-month blip.
Background: Why Wage Data Matters to the BOC
Unlike the US Federal Reserve, which watches average hourly earnings alongside core PCE, the Bank of Canada places similar weight on LFS wage growth alongside core CPI when assessing whether inflation pressures are demand-driven or cost-push. A cooling to 2.0% — close to the BOC’s 2% inflation target — reduces the urgency for hawkish action on wage-driven inflation concerns.
The Quartile Reversal
A notable and less-discussed detail: the bottom 25% of earners saw wages rise just 1.1% (to $18.66), and the second-lowest quartile rose 1.3% (to $26.61), while the third quartile (+2.1% to $37.99) and top quartile (+2.1% to $65.15) grew faster. This reverses the low-wage catch-up dynamic common in recent years and may hint at a changing composition of wage pressure — though this is a single unadjusted monthly reading, not a confirmed multi-month trend.
Market Implication
For CAD traders, decelerating wage growth combined with a paused unemployment downtrend adds to the case for continued or renewed BOC dovishness, though a single data point rarely moves policy alone. Watch the October 9 release for confirmation of whether 2.0% represents a floor or a continuing slide.
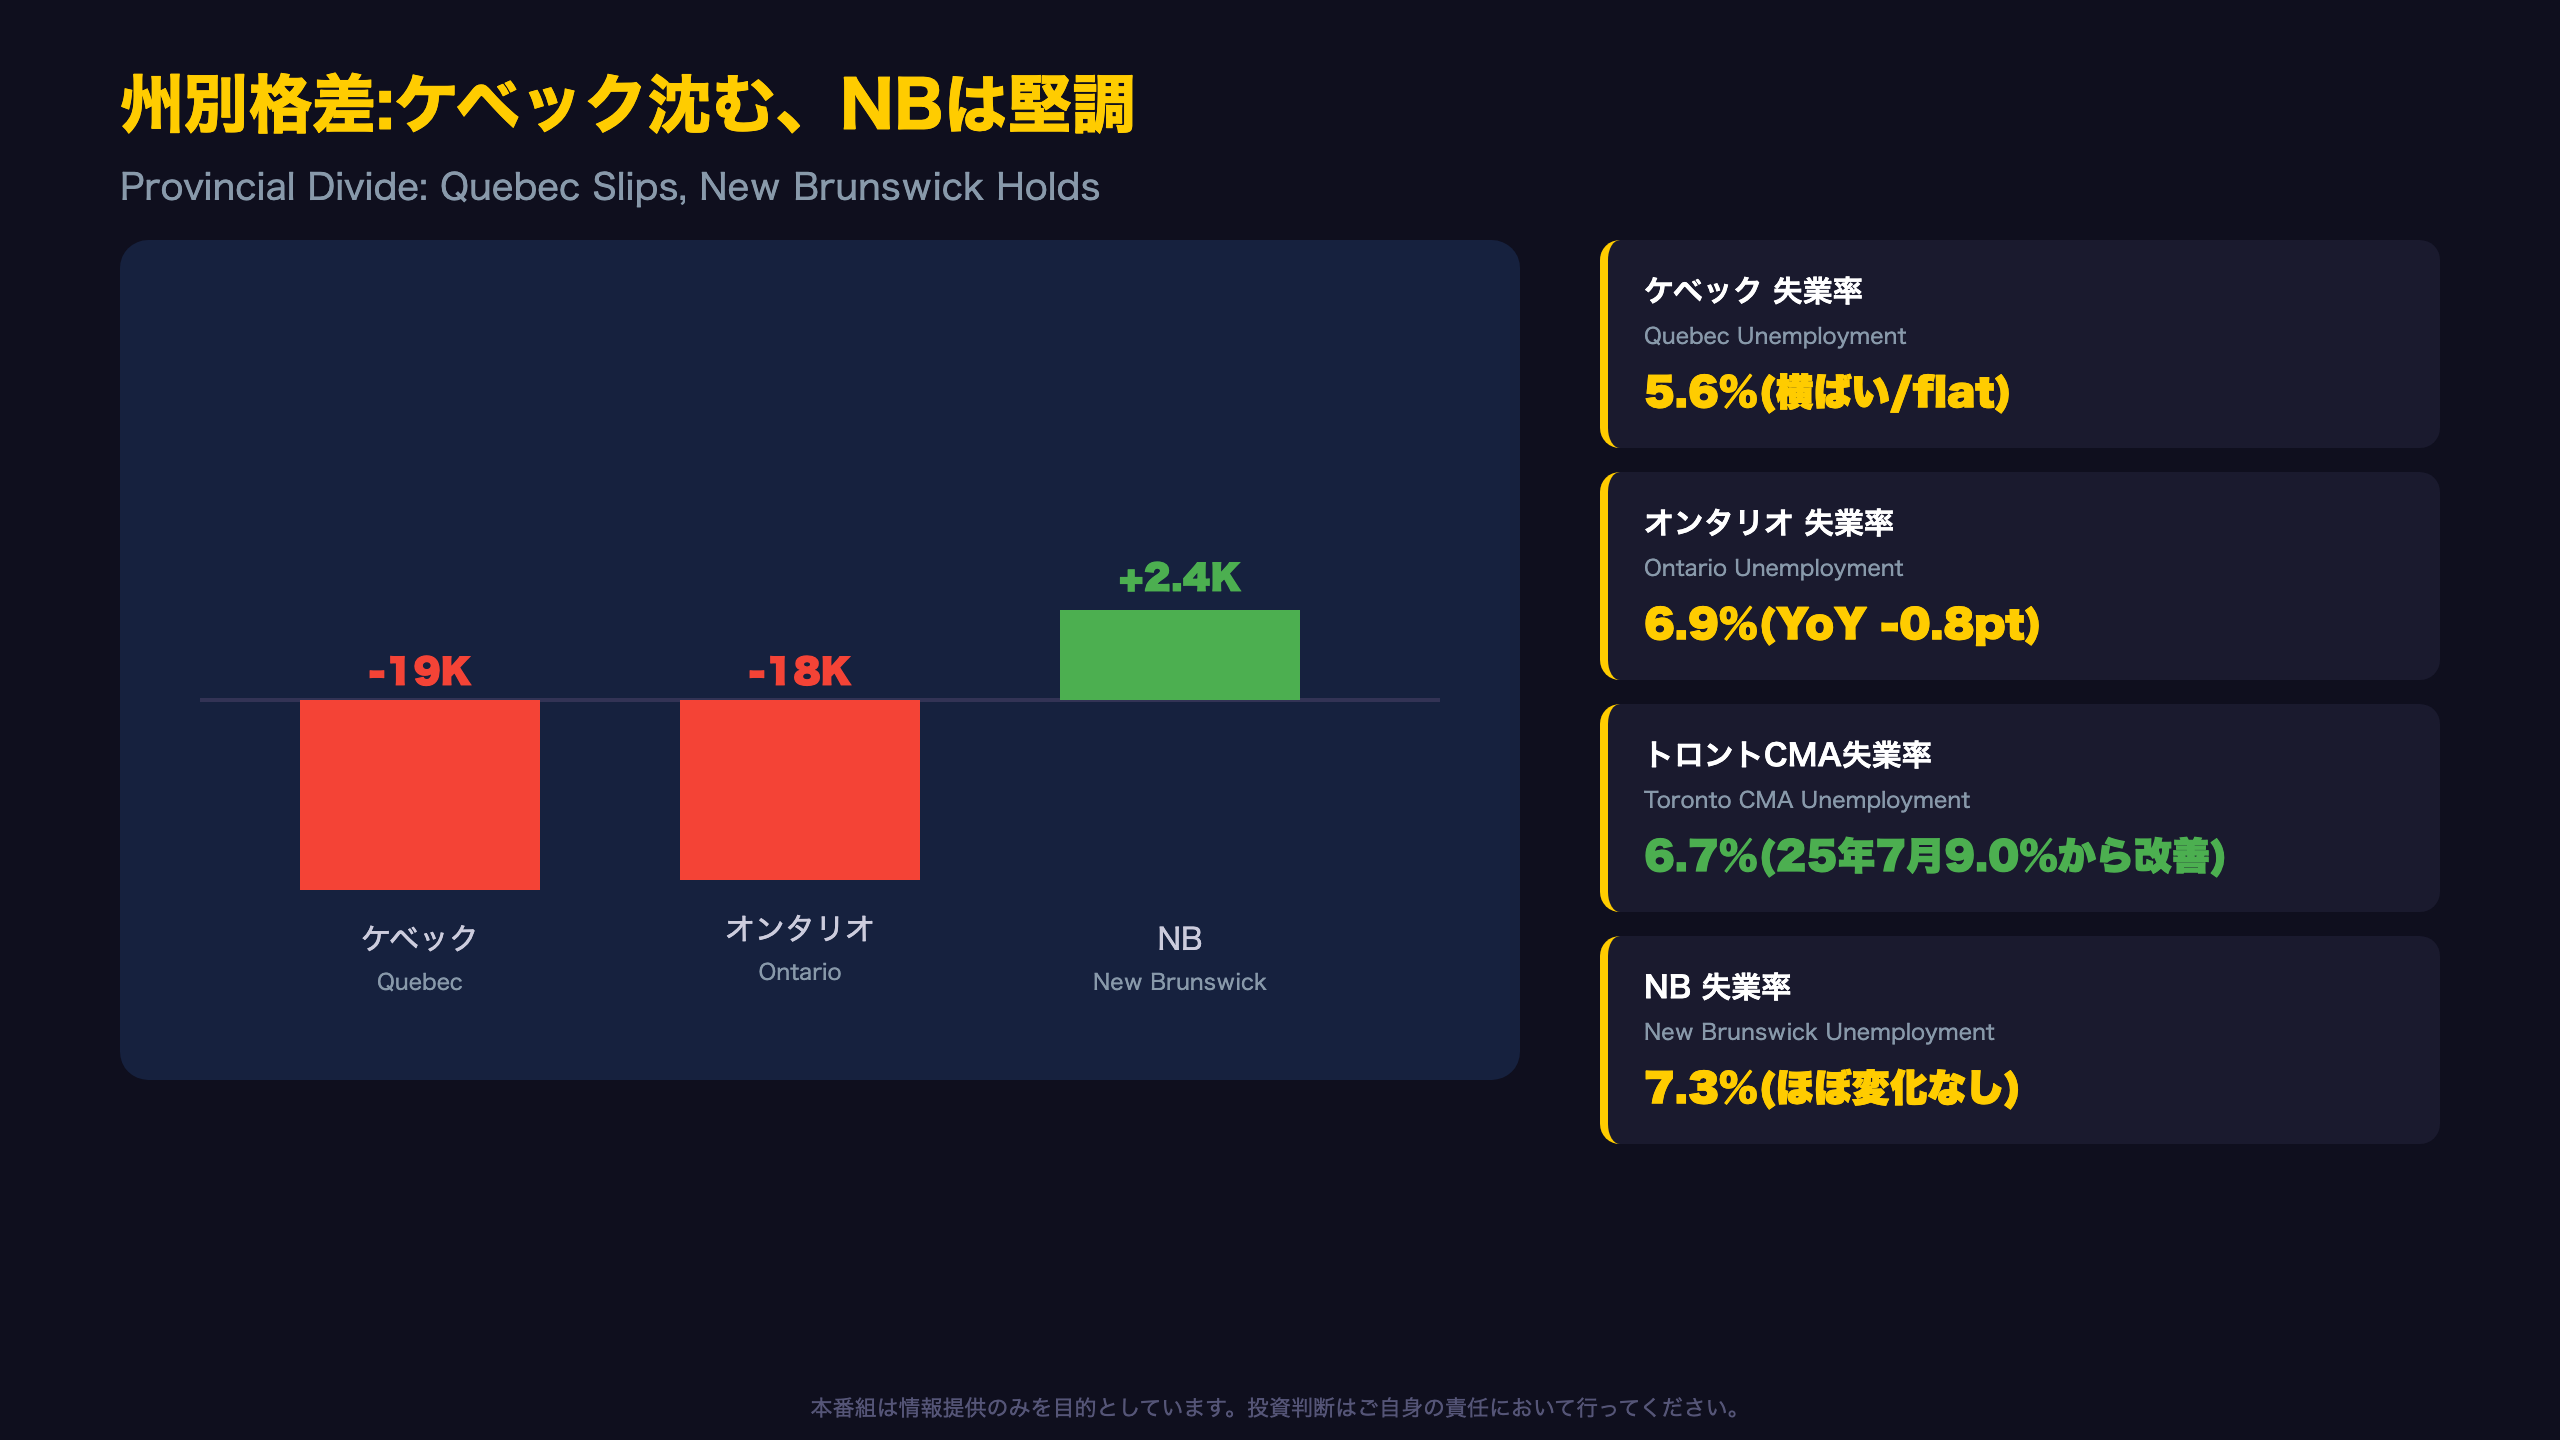
州別格差:ケベック沈む、オンタリオ反落、NB堅調
Toronto vs. Montreal: Diverging Unemployment Paths
A closer look at metro-level data reveals an interesting contrast. The Toronto CMA’s unemployment rate held at 6.7%, but StatCan notes this is “down from a recent high of 9.0% observed in July 2025” — a substantial year-over-year improvement. Montreal’s CMA unemployment rate, meanwhile, sits at 6.5% and has been “little changed” both monthly and annually.
Quebec’s Outlier Status
StatCan explicitly identifies Quebec as “the only province to record a year-over-year decline in employment” (-54,000, -1.2%). Yet its unemployment rate held steady at 5.6% — suggesting the employment decline may partly reflect labour force composition shifts (e.g., aging, retirements) rather than a straightforward deterioration in job availability. This is a useful nuance for readers used to US state-level labour data, where employment and unemployment moves tend to track more tightly together.
Ontario’s Underlying Resilience
Ontario’s August pullback (-18,000) looks largely like payback after a +119,000 surge from March to July. Its unemployment rate of 6.9% was little changed month-over-month but down 0.8 points year-over-year — evidence the province’s improving trend remains intact. Notably, Ontario captured most of August’s manufacturing gain (+14,000), partially offsetting weakness elsewhere in the provincial economy.
Market Implication
For CAD-sensitive investors, Quebec’s isolated YoY decline is a regional data point worth monitoring but is not yet broad-based enough to be read as a national trend — 9 of 10 provinces were either flat or improving. Watch whether Quebec’s softness persists in the October 9 release.
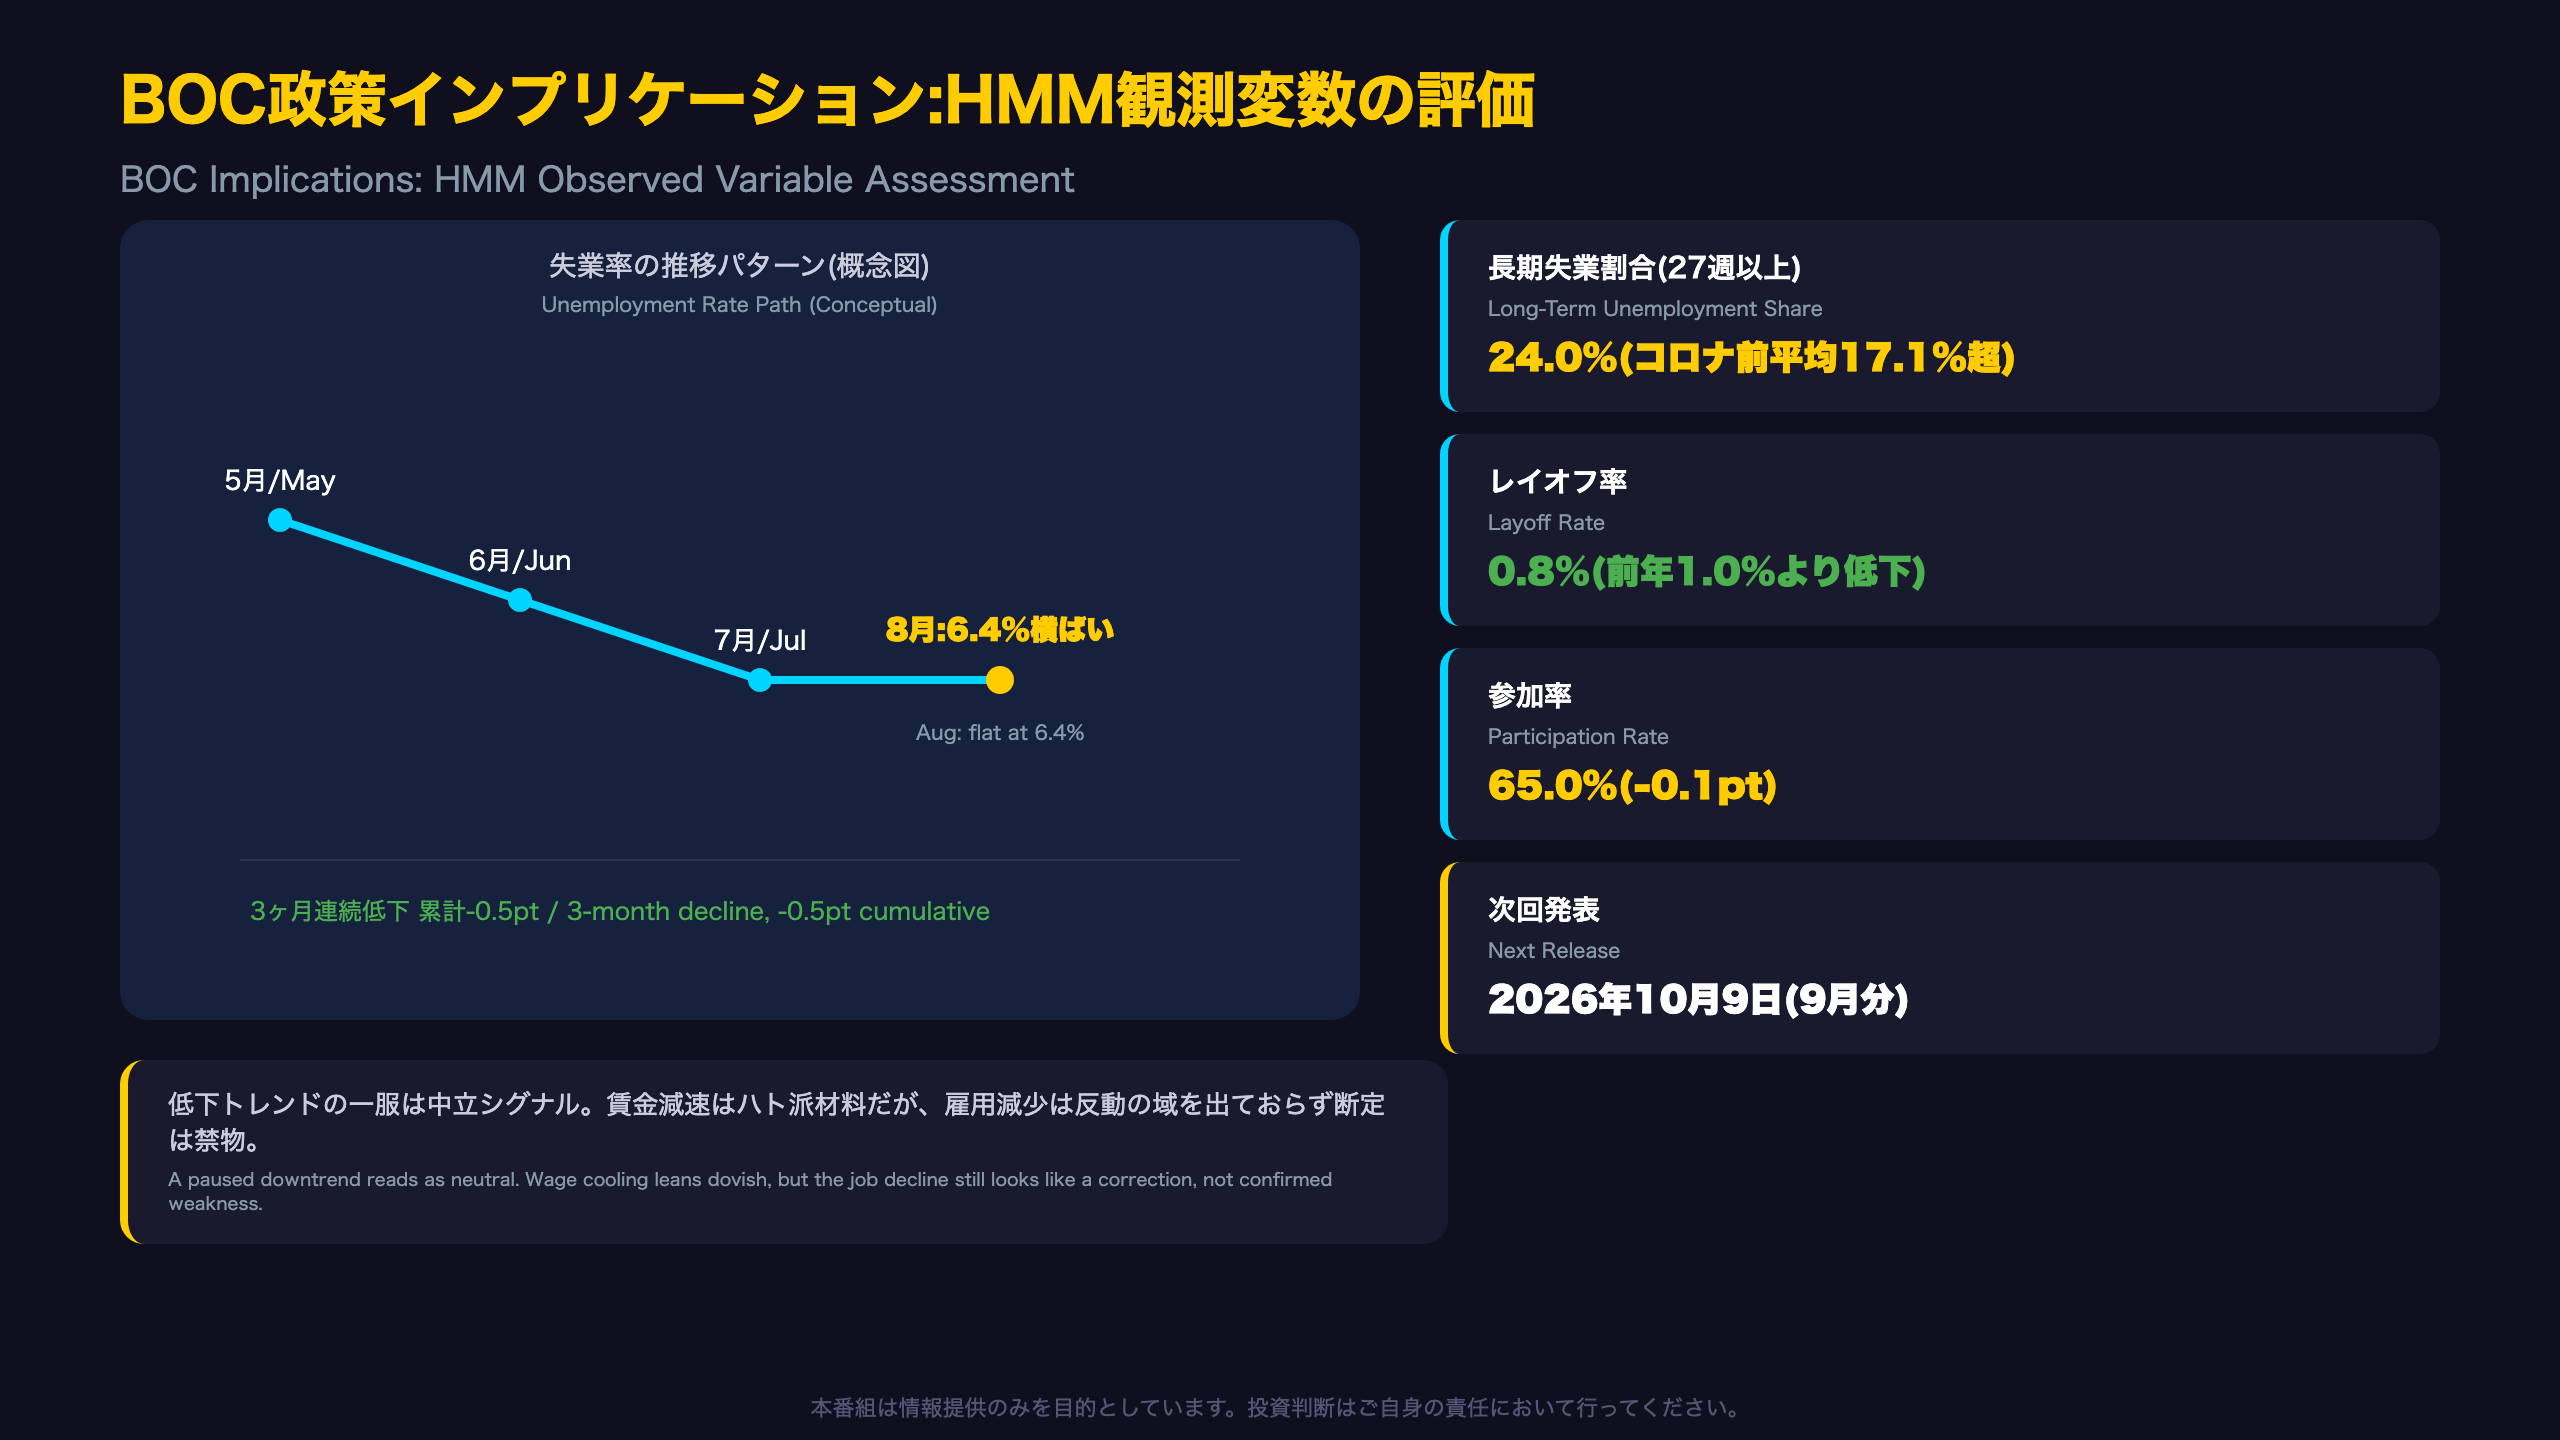
BOC政策インプリケーション:HMM観測変数としての評価
Positioning This Report Within an HMM Regime Framework
A hidden Markov model (HMM) is a statistical framework that infers a latent, unobserved economic “regime” (e.g., expansion, contraction, transition) from observable variables — in this case, primarily the unemployment rate. For readers unfamiliar with the concept: it is similar in spirit to how the NBER dates US recessions using multiple indicators, except an HMM does so probabilistically and continuously rather than via a committee judgment.
The key observation this month: unemployment fell for “three consecutive monthly declines in May, June and July totalling 0.5 percentage points” before holding flat at 6.4% in August. This reads as a pause in an improving trend, not a reversal — an important distinction for regime-classification purposes.
Long-Term Unemployment vs. Layoffs: A Mixed Signal
Two supporting indicators tell different stories. The long-term unemployment share (24.0%) remains above the 2017-2019 pre-pandemic average of 17.1%, suggesting some structural stickiness in how long it takes displaced workers to find new jobs. Yet the layoff rate (0.8%) is actually below year-ago levels (1.0%) and roughly in line with the pre-pandemic norm (0.9%) — meaning new job losses aren’t accelerating, even if existing unemployment spells are lasting longer.
Two Readings, Both Legitimate
Bearish: Slowing wages, falling employment, and a dip in participation together could signal softening labour demand.
Bullish: The unemployment rate has held its ground, and both employment and wages remain in positive territory on a 12-month basis.
What Would Change the Picture
For Bank of Canada watchers and CAD traders, the critical threshold is whether September’s unemployment rate (due October 9) stays near 6.4% or climbs above 6.5%. A move above that level would likely tilt the HMM’s regime read from “expansion” toward “transition,” reinforcing a dovish policy tilt. The next LFS release, covering the reference week of September 13-19, will be the first real test of whether August’s pause was a blip or the start of a new phase.
Disclaimer: This article is for informational purposes only. All investment decisions are made solely at your own risk.