📺 Watch the Full Video Analysis
This article was automatically generated by the NFC Market Live AI analysis system. (Updated: 2026-08-31 23:47 JST)
📄 Primary Source
Reserve Bank of Australia
https://www.rba.gov.au/statistics/frequency/fin-agg/2026/fin-agg-0726.html
Deep dive into the RBA’s latest Financial Aggregates release (Table D3) 📊
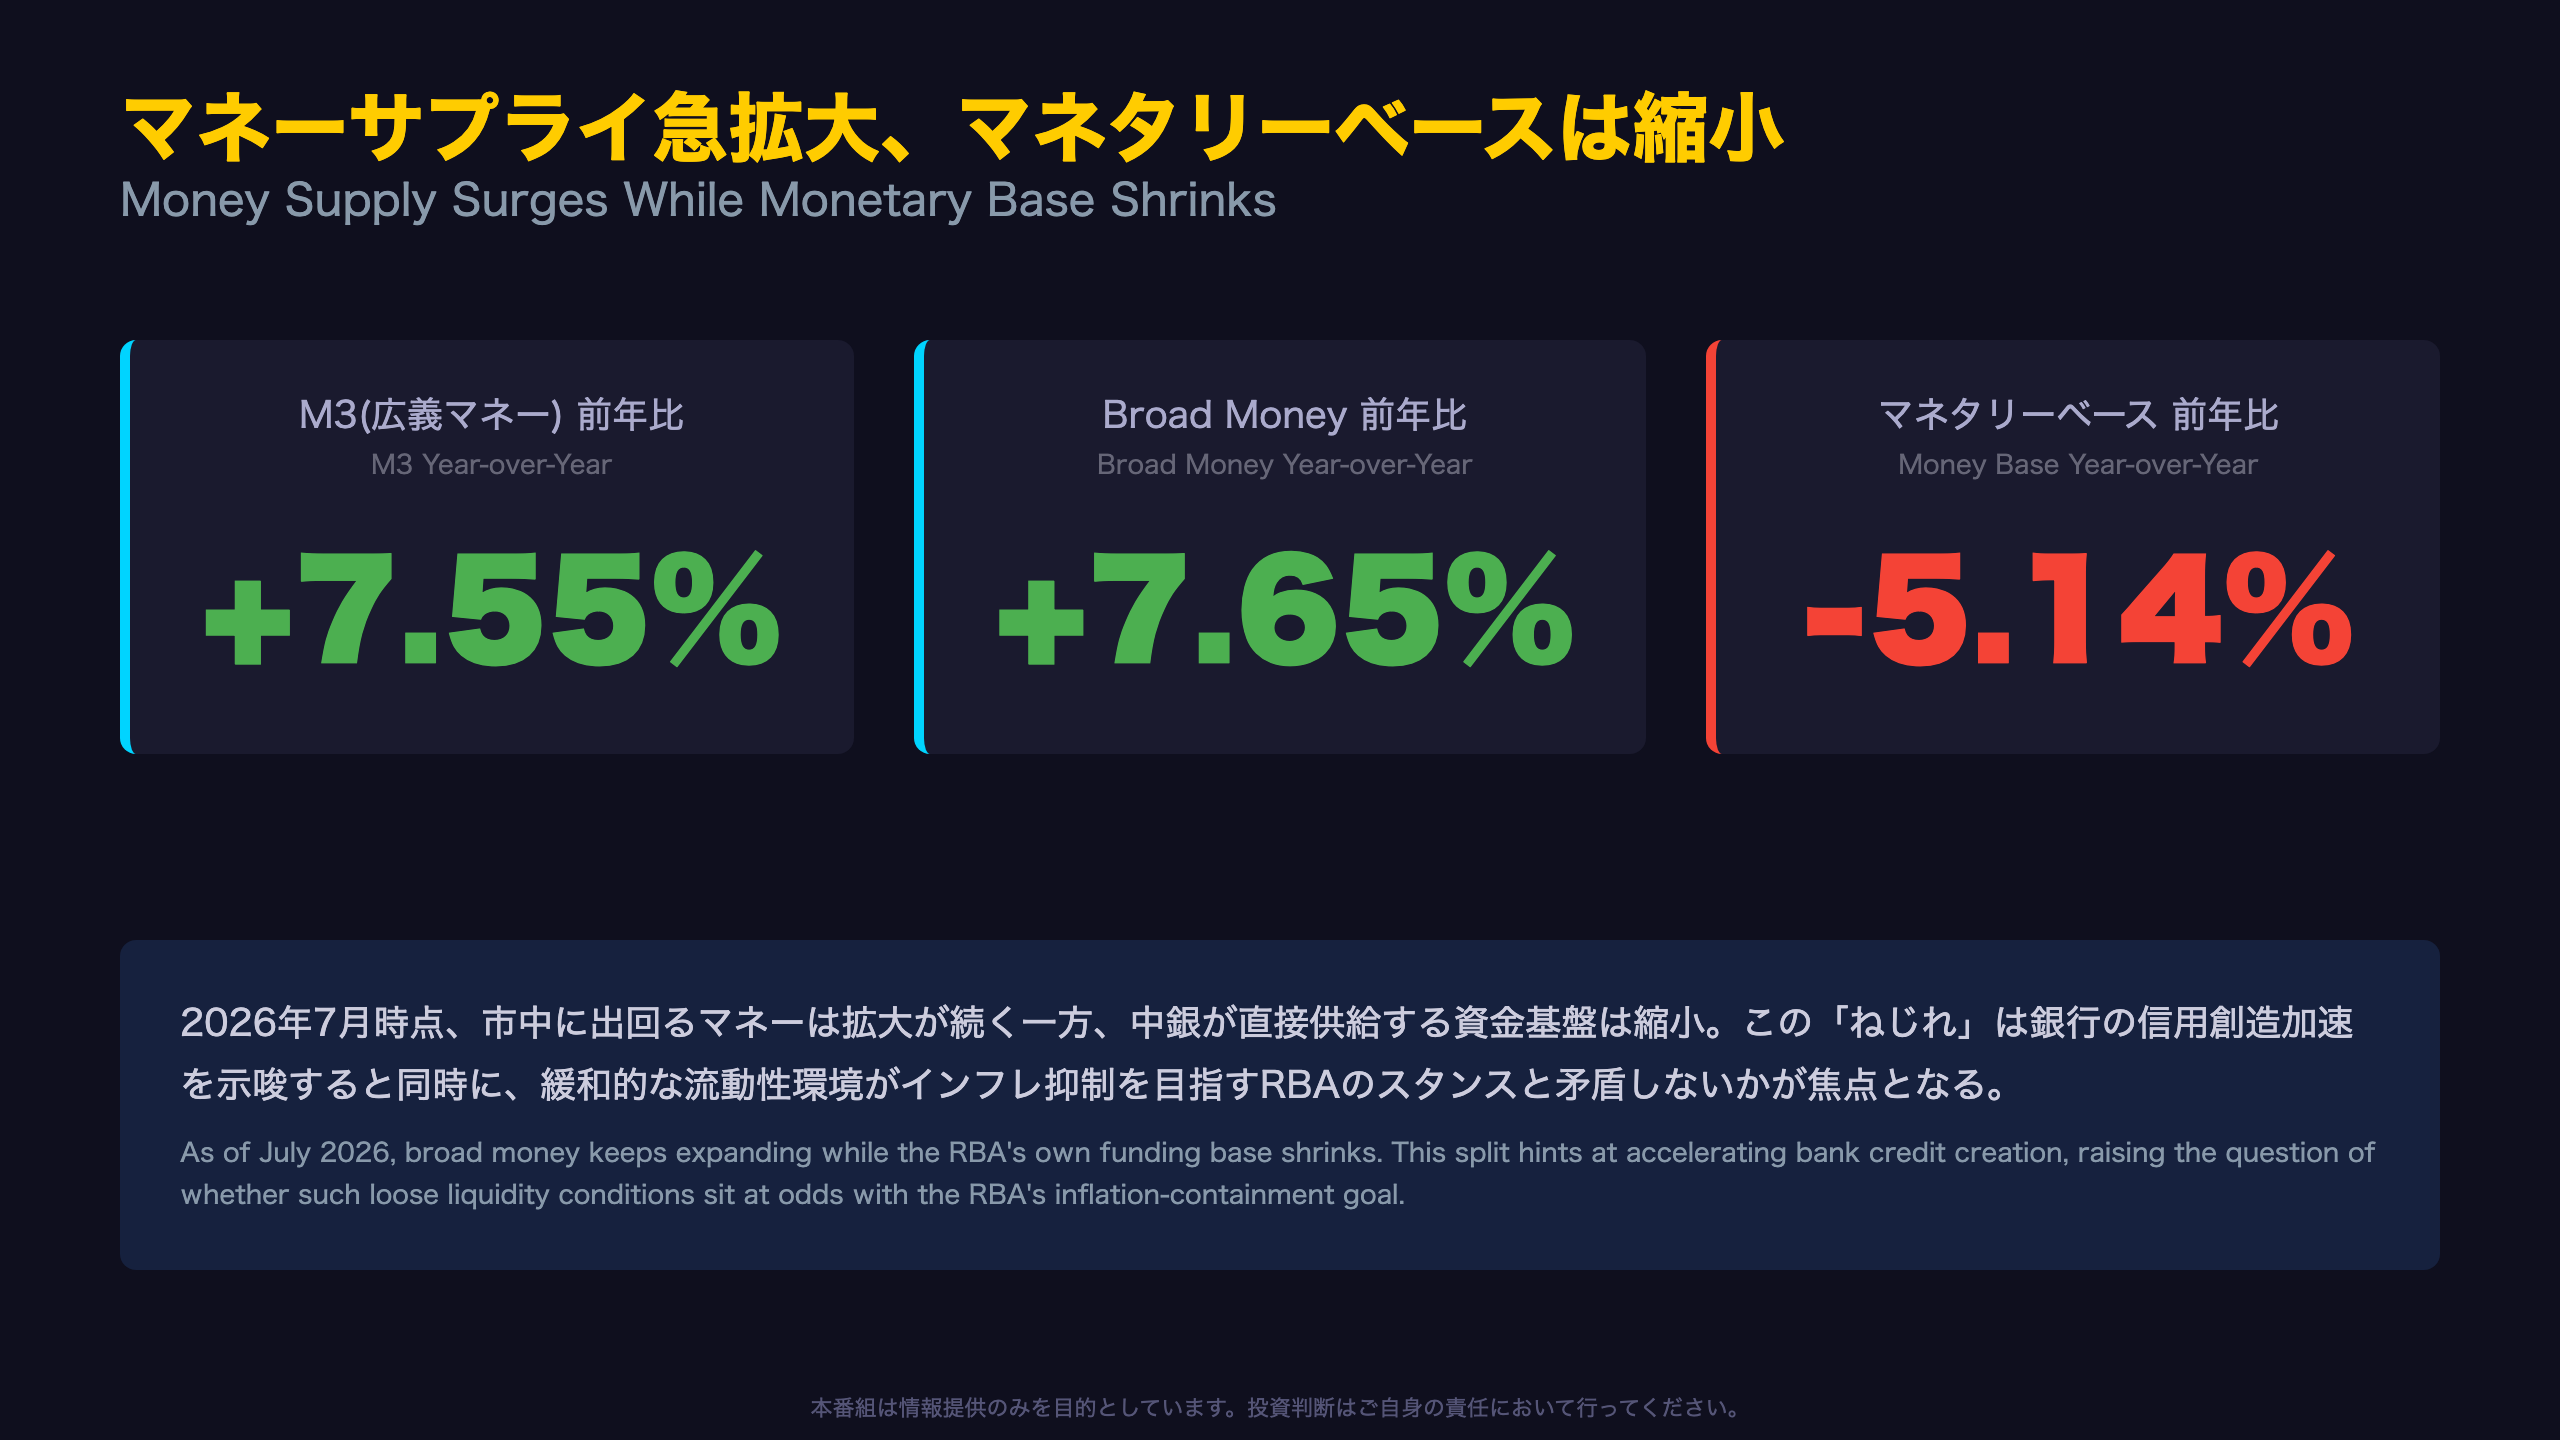
As of July 2026, Australia’s M3 grew +7.55% YoY and Broad Money +7.65% YoY — both holding near multi-year highs. Meanwhile the Money Base contracted -5.14% YoY 📉
💡The money multiplier (M3 ÷ Money Base) climbed from 8.91x in Aug 2024 to 11.36x — signaling bank credit creation is outpacing central bank liquidity supply.
⚠️Does this expanding liquidity environment sit at odds with the RBA’s inflation-fighting stance? We break down the implications for the Australian dollar and markets, with balanced bull/bear analysis.
The Ultimate Summary:拡大するマネー、縮小するベース
The Big Picture: Two Diverging Money Trends in Australia
The RBA’s monthly Financial Aggregates release (Table D3) shows that as of July 2026, M3 — the broad money supply measure — grew 7.55% year-over-year (seasonally adjusted) to AUD 3,497.16 billion. Broad Money grew even faster at +7.65% YoY, reaching AUD 3,511.39 billion.
For readers unfamiliar with Australian monetary statistics: M3 broadly captures currency, bank deposits, and CDs held by the private non-bank sector — conceptually adjacent to how US and European M2/M3 aggregates are used, though definitions and coverage differ across central banks.
Strikingly, the Money Base — the RBA’s own direct liability, akin to the US “monetary base” — contracted -5.14% YoY over the same period. This divergence between expanding broad money and a shrinking monetary base is the standout feature of this release.
Note: the RBA’s monetary base series is known for high month-to-month volatility driven by government deposit flows and payment-system timing effects, so a single month’s reading should not be over-interpreted as a policy signal.
This split suggests private bank credit creation — not central bank liquidity injection — is the primary engine behind Australia’s expanding money supply, a theme explored further via the money multiplier in Slide 4. Importantly, this is not a one-month surprise: the acceleration has been building gradually since late 2024 (Slide 3), which matters for how much weight investors should assign to it.
2026年7月分:各指標の詳細
July 2026 in Detail: What the Breakdown Reveals
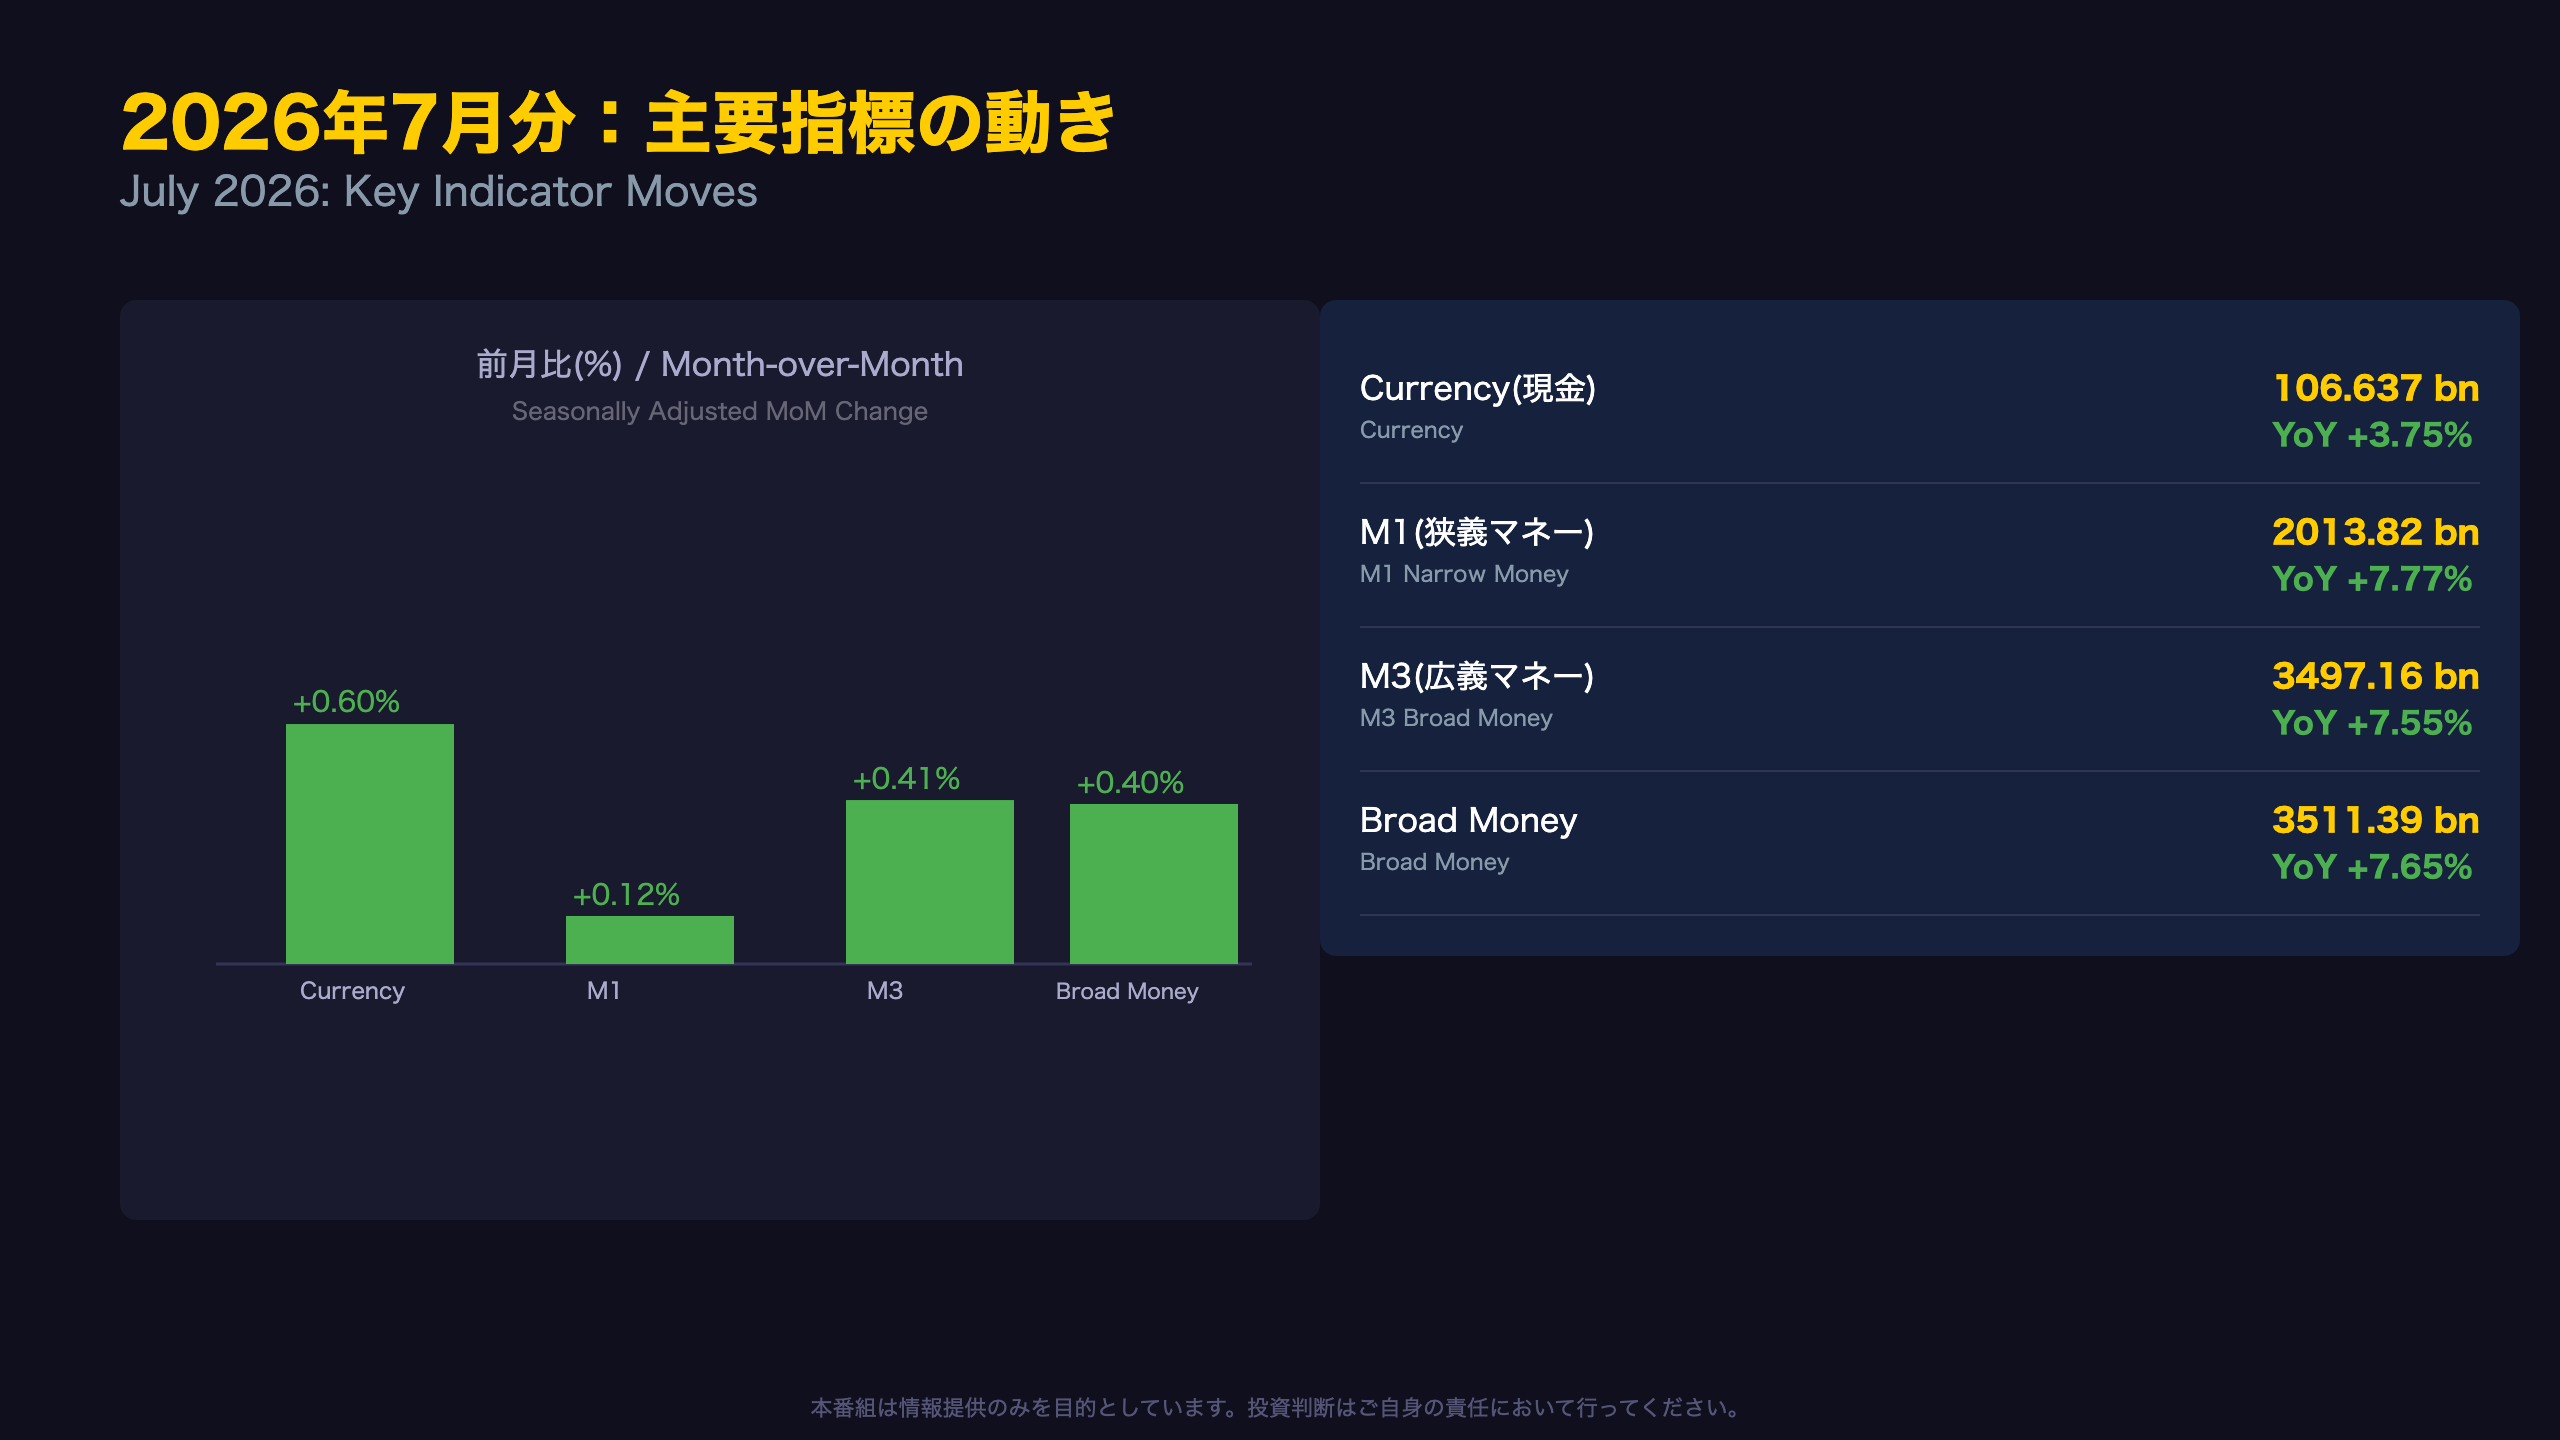
Comparing the newly released July 2026 figures against June:
| Indicator | Level (AUD bn) | MoM | YoY |
|---|---|---|---|
| Currency | 106.637 | +0.60% | +3.75% |
| M1 (narrow money) | 2,013.82 | +0.12% | +7.77% |
| M3 (broad money) | 3,497.16 | +0.41% | +7.55% |
| Broad Money | 3,511.39 | +0.40% | +7.65% |
Note for international readers: Australia’s M1 includes currency plus current (checking) deposits — comparable in spirit to the US Fed’s M1, though the RBA’s methodology and deposit-institution coverage differ.
M1’s month-over-month growth (+0.12%) notably lagged M3 (+0.41%) and Broad Money (+0.40%), suggesting a possible easing in demand for the most liquid, immediately-spendable balances (a single-month observation, so caution is warranted before calling it a trend shift).
That said, on a year-over-year basis M1 still outpaces M3 at +7.77%, so it would be premature to read a single month’s deceleration as a change in underlying momentum.
Meanwhile, currency growth of just +3.75% YoY — notably slower than deposit-based aggregates — likely reflects Australia’s ongoing shift toward cashless transactions and a household/corporate preference for interest-bearing deposit assets over physical cash. The next slide examines where this growth rate sits within the broader multi-year trend.
構造的加速トレンド:2024年5%台から2026年7-8%台へ
The Acceleration Path: 24 Months of Data
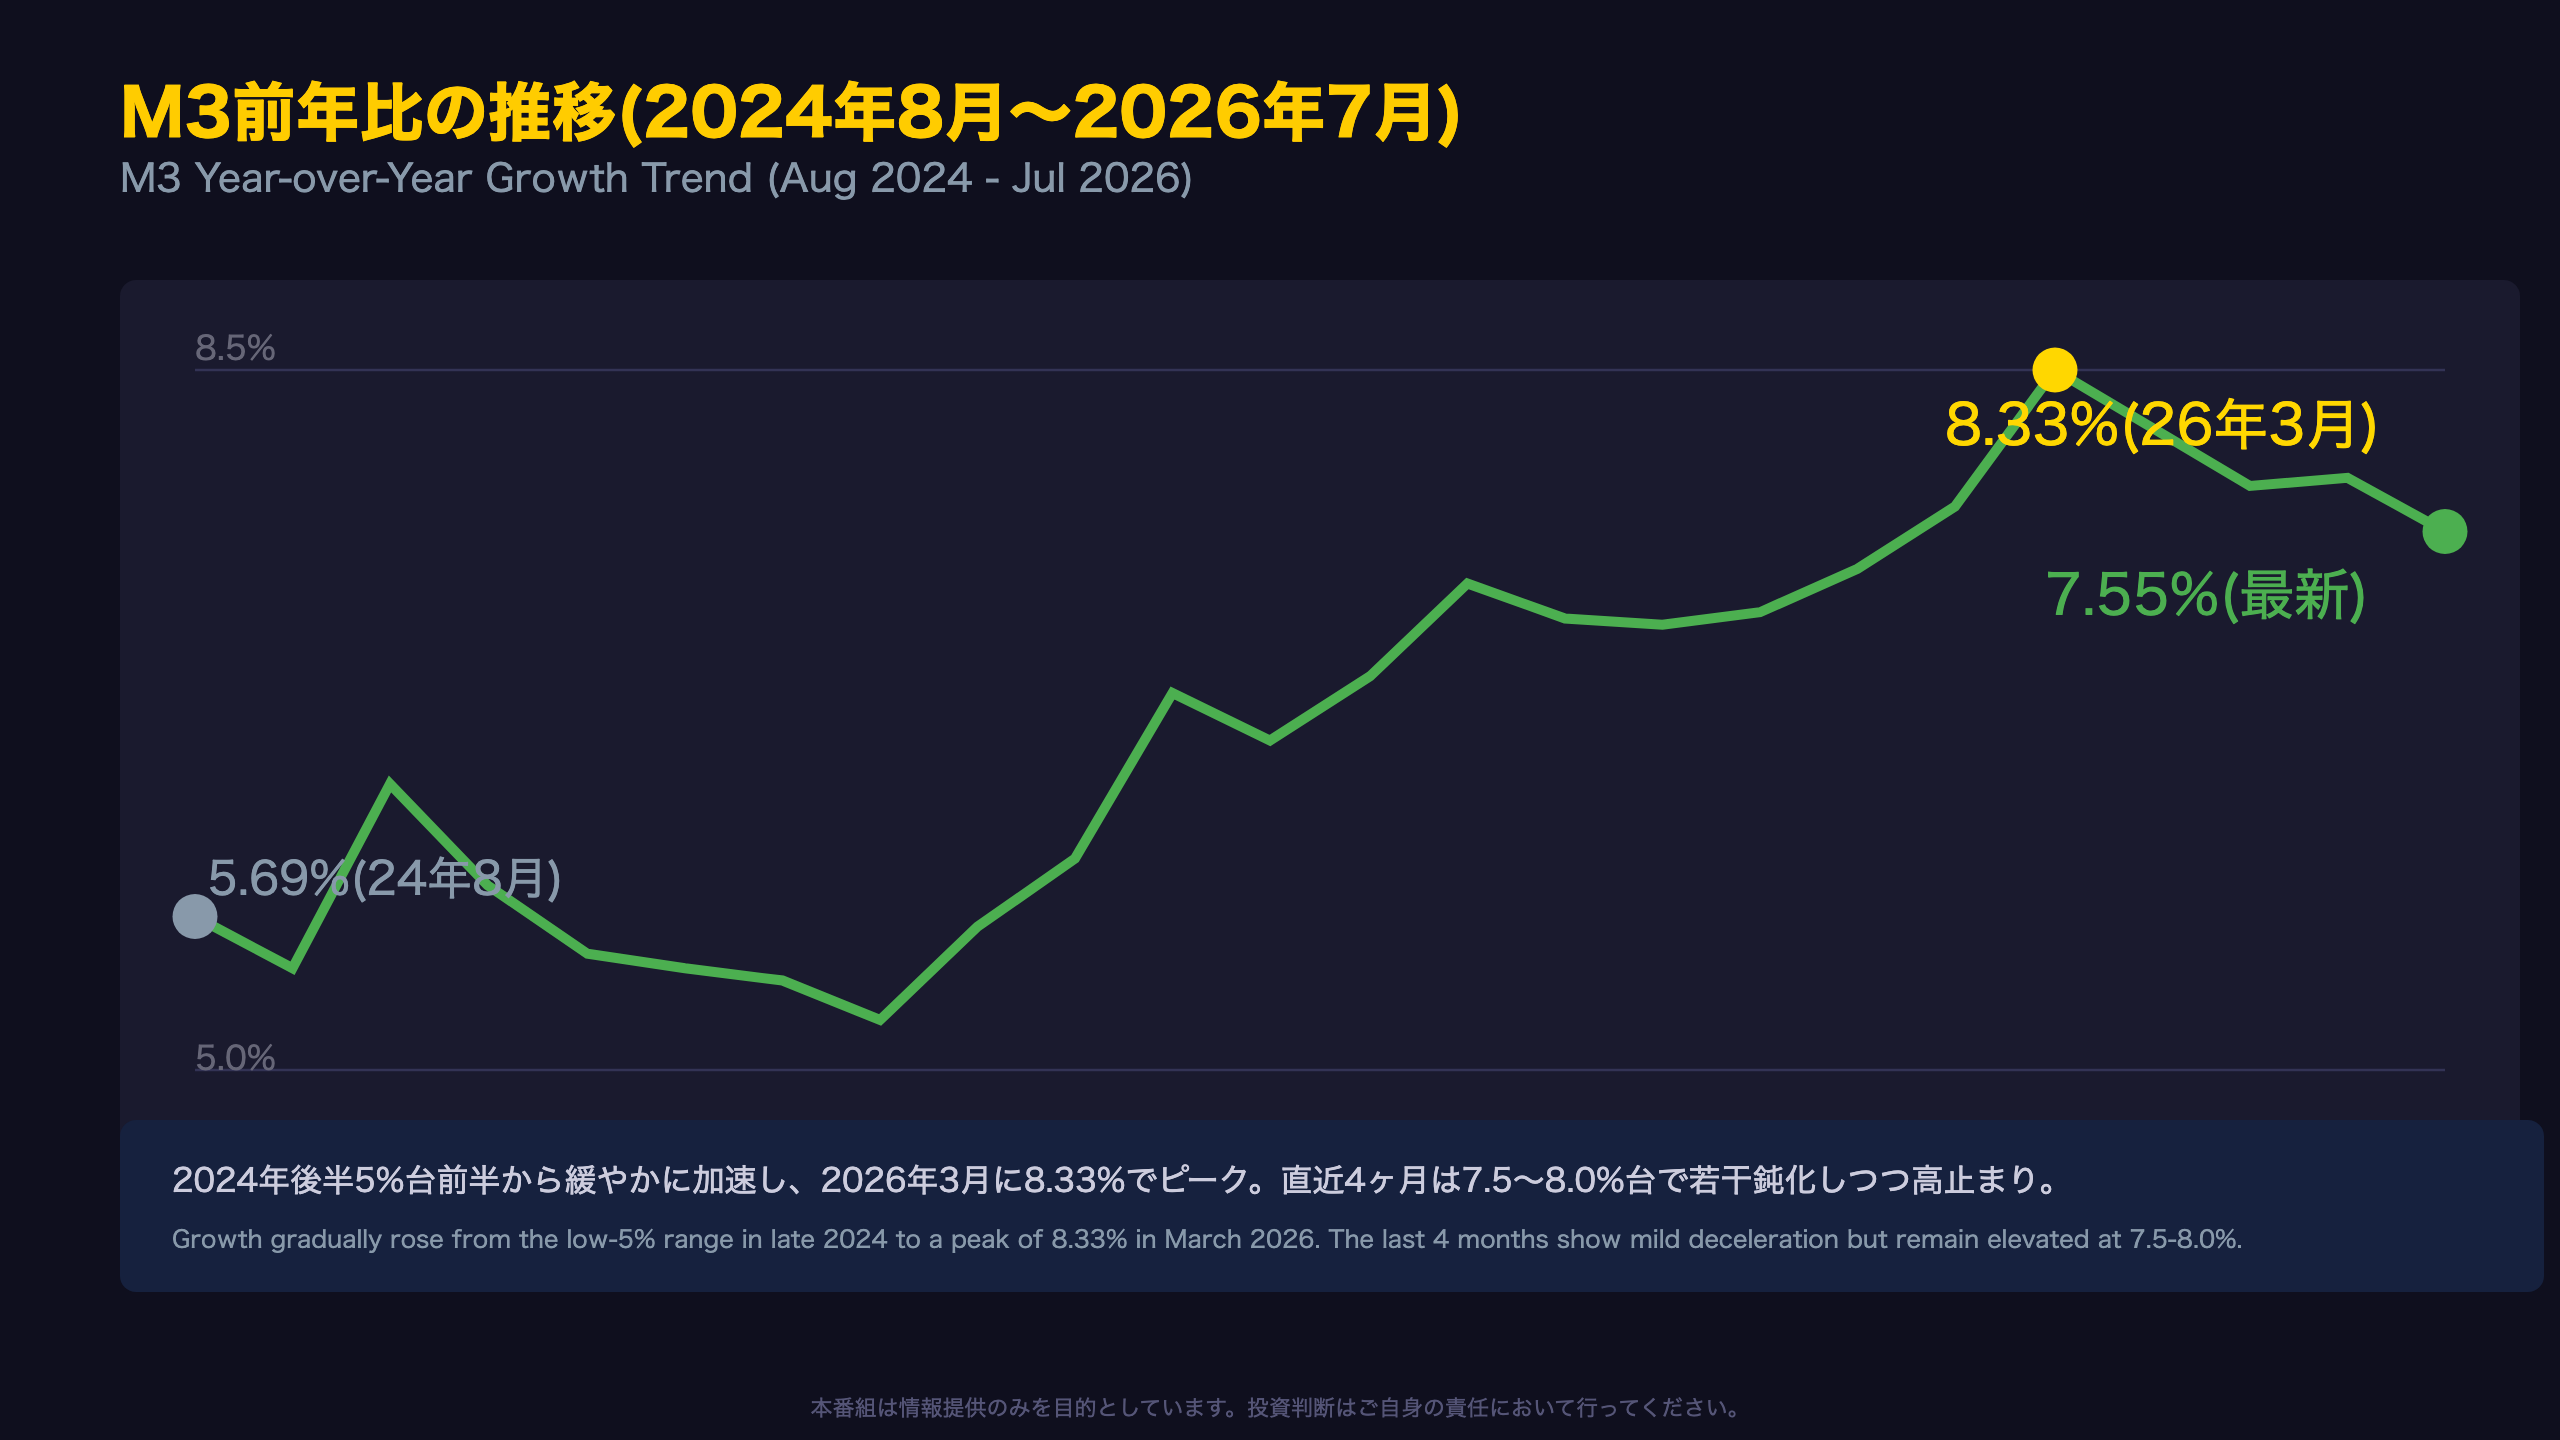
Tracking M3’s (seasonally adjusted) year-over-year growth rate month by month reveals a clear, staged acceleration:
- Aug-Dec 2024: Growth held in the 5.4%-5.7% range
- Jan-Jun 2025: Range of 5.2%-6.8%, marking a gradual inflection upward
- Jul-Dec 2025: Accelerated further to 6.5%-7.3%
- Jan-Jul 2026: Elevated at 7.4%-8.3%, peaking in March
From +5.69% in August 2024 to +8.33% in March 2026, the growth rate roughly increased 1.5x over about a year and a half. This pattern — a sustained, gradual build rather than a sudden spike — is more consistent with a structural shift in system liquidity than a short-lived cyclical blip (a moderate-confidence inference given multiple consecutive months point the same direction).
However, since the March 2026 peak, growth has eased: +8.05% in April, +7.77% in May, +7.81% in June, and +7.55% in July. Whether this marks the start of a genuine peak-out or simply monthly noise will require another two to three months of data to confirm.
A deceleration following a year-plus acceleration phase often signals a cyclical plateau, but it would be premature to declare a definitive trend reversal based on just a few months of softer readings.
マネタリーベースとの乖離:貨幣乗数の上昇
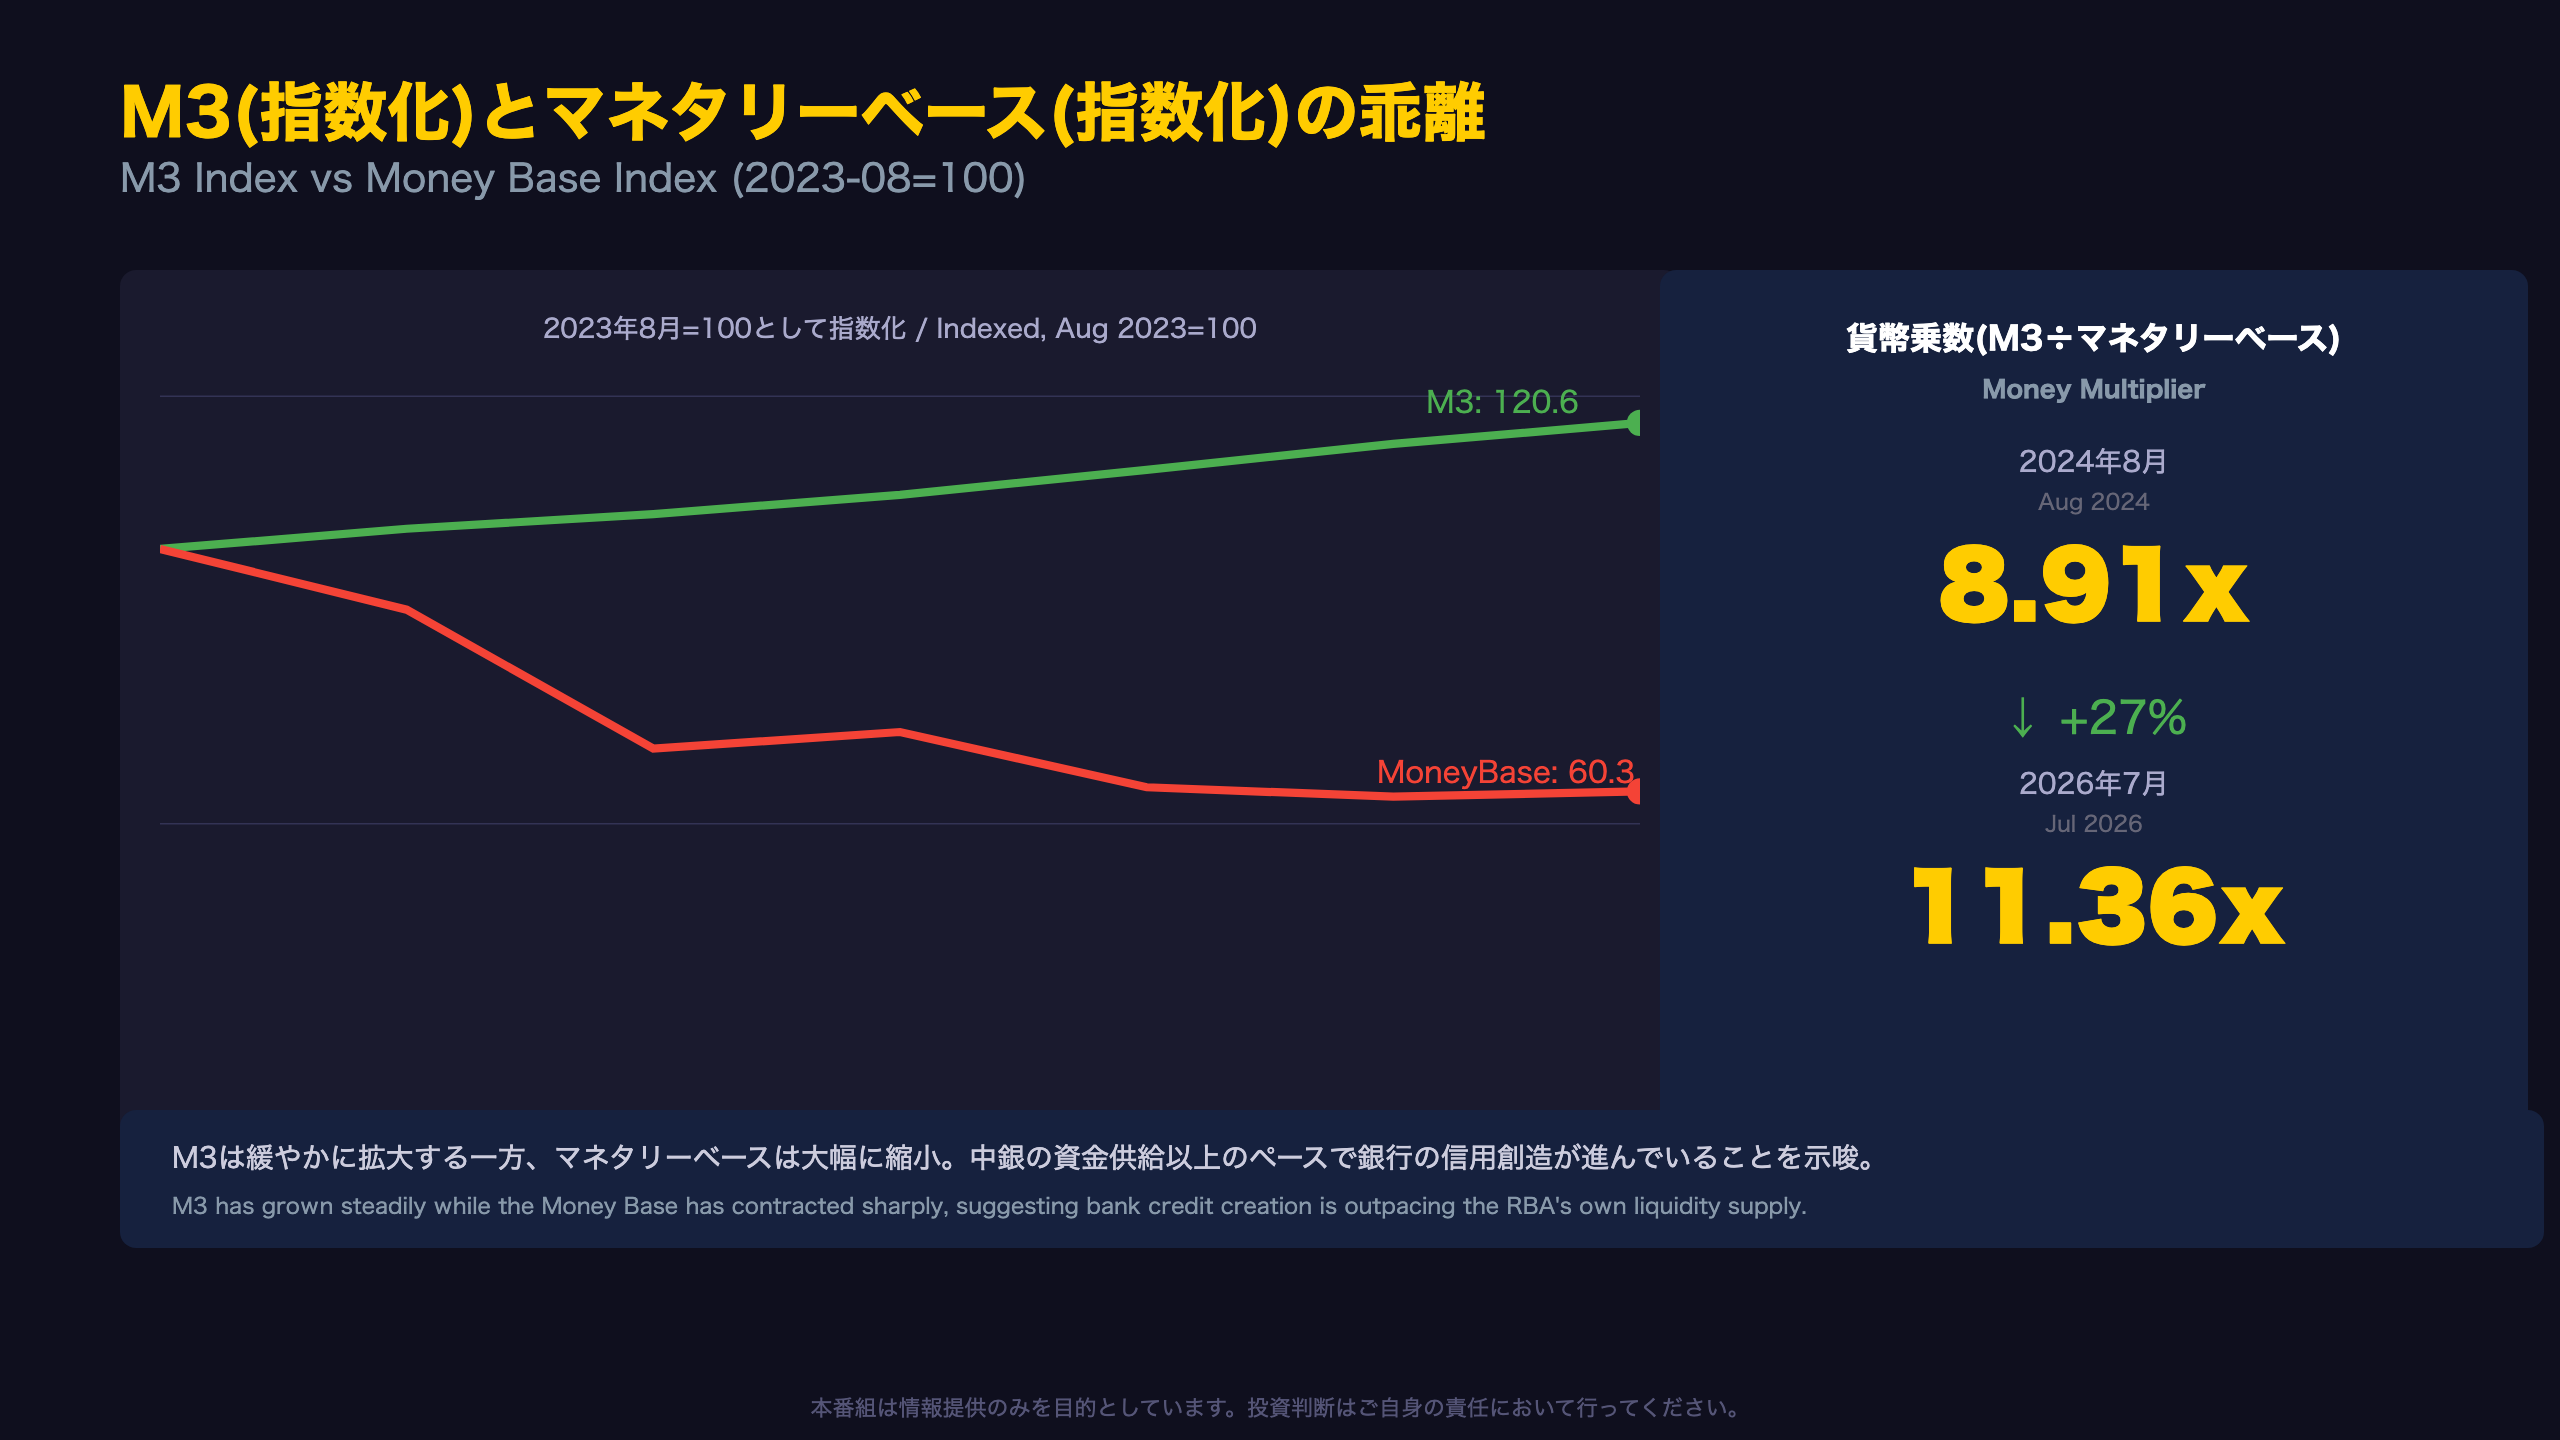
Decoding the Split: What the Money Multiplier Tells Us
Australia’s Money Base (DMAMMB, not seasonally adjusted) contracted more than 30% year-over-year in mid-2024, briefly narrowed to around -5% by mid-2025, widened back toward -10% to -15%, and has now returned to -5.14% as of July 2026. High month-to-month volatility is a defining characteristic of this series.
Context for readers: in RBA statistics, the Money Base is heavily influenced by technical flows in government and bank reserve deposits, so sharp single-month swings should not be read as deliberate policy signals.
What matters more is what happens when you overlay the money multiplier — M3 divided by the Money Base — on top of this volatile base series:
| Date | Money Multiplier |
|---|---|
| Aug 2024 | 8.91x |
| Aug 2025 | 10.51x |
| Jul 2026 | 11.36x |
The multiplier rose roughly 27% over about two years, from 8.91x to 11.36x. This means each unit of reserve money supplied by the RBA is now supporting a larger volume of bank deposits and lending — a pattern consistent with strengthening private credit creation (a moderate-confidence read based on a consistent multi-period trend, not a single data point).
Separately, M1 (+7.77% YoY) growing marginally faster than M3 (+7.55% YoY) could reflect households and businesses favoring highly liquid, on-demand deposits over longer-term savings instruments — though this remains a tentative, single-metric observation worth monitoring rather than a confirmed structural shift.
RBAとAUDへのインプリケーション
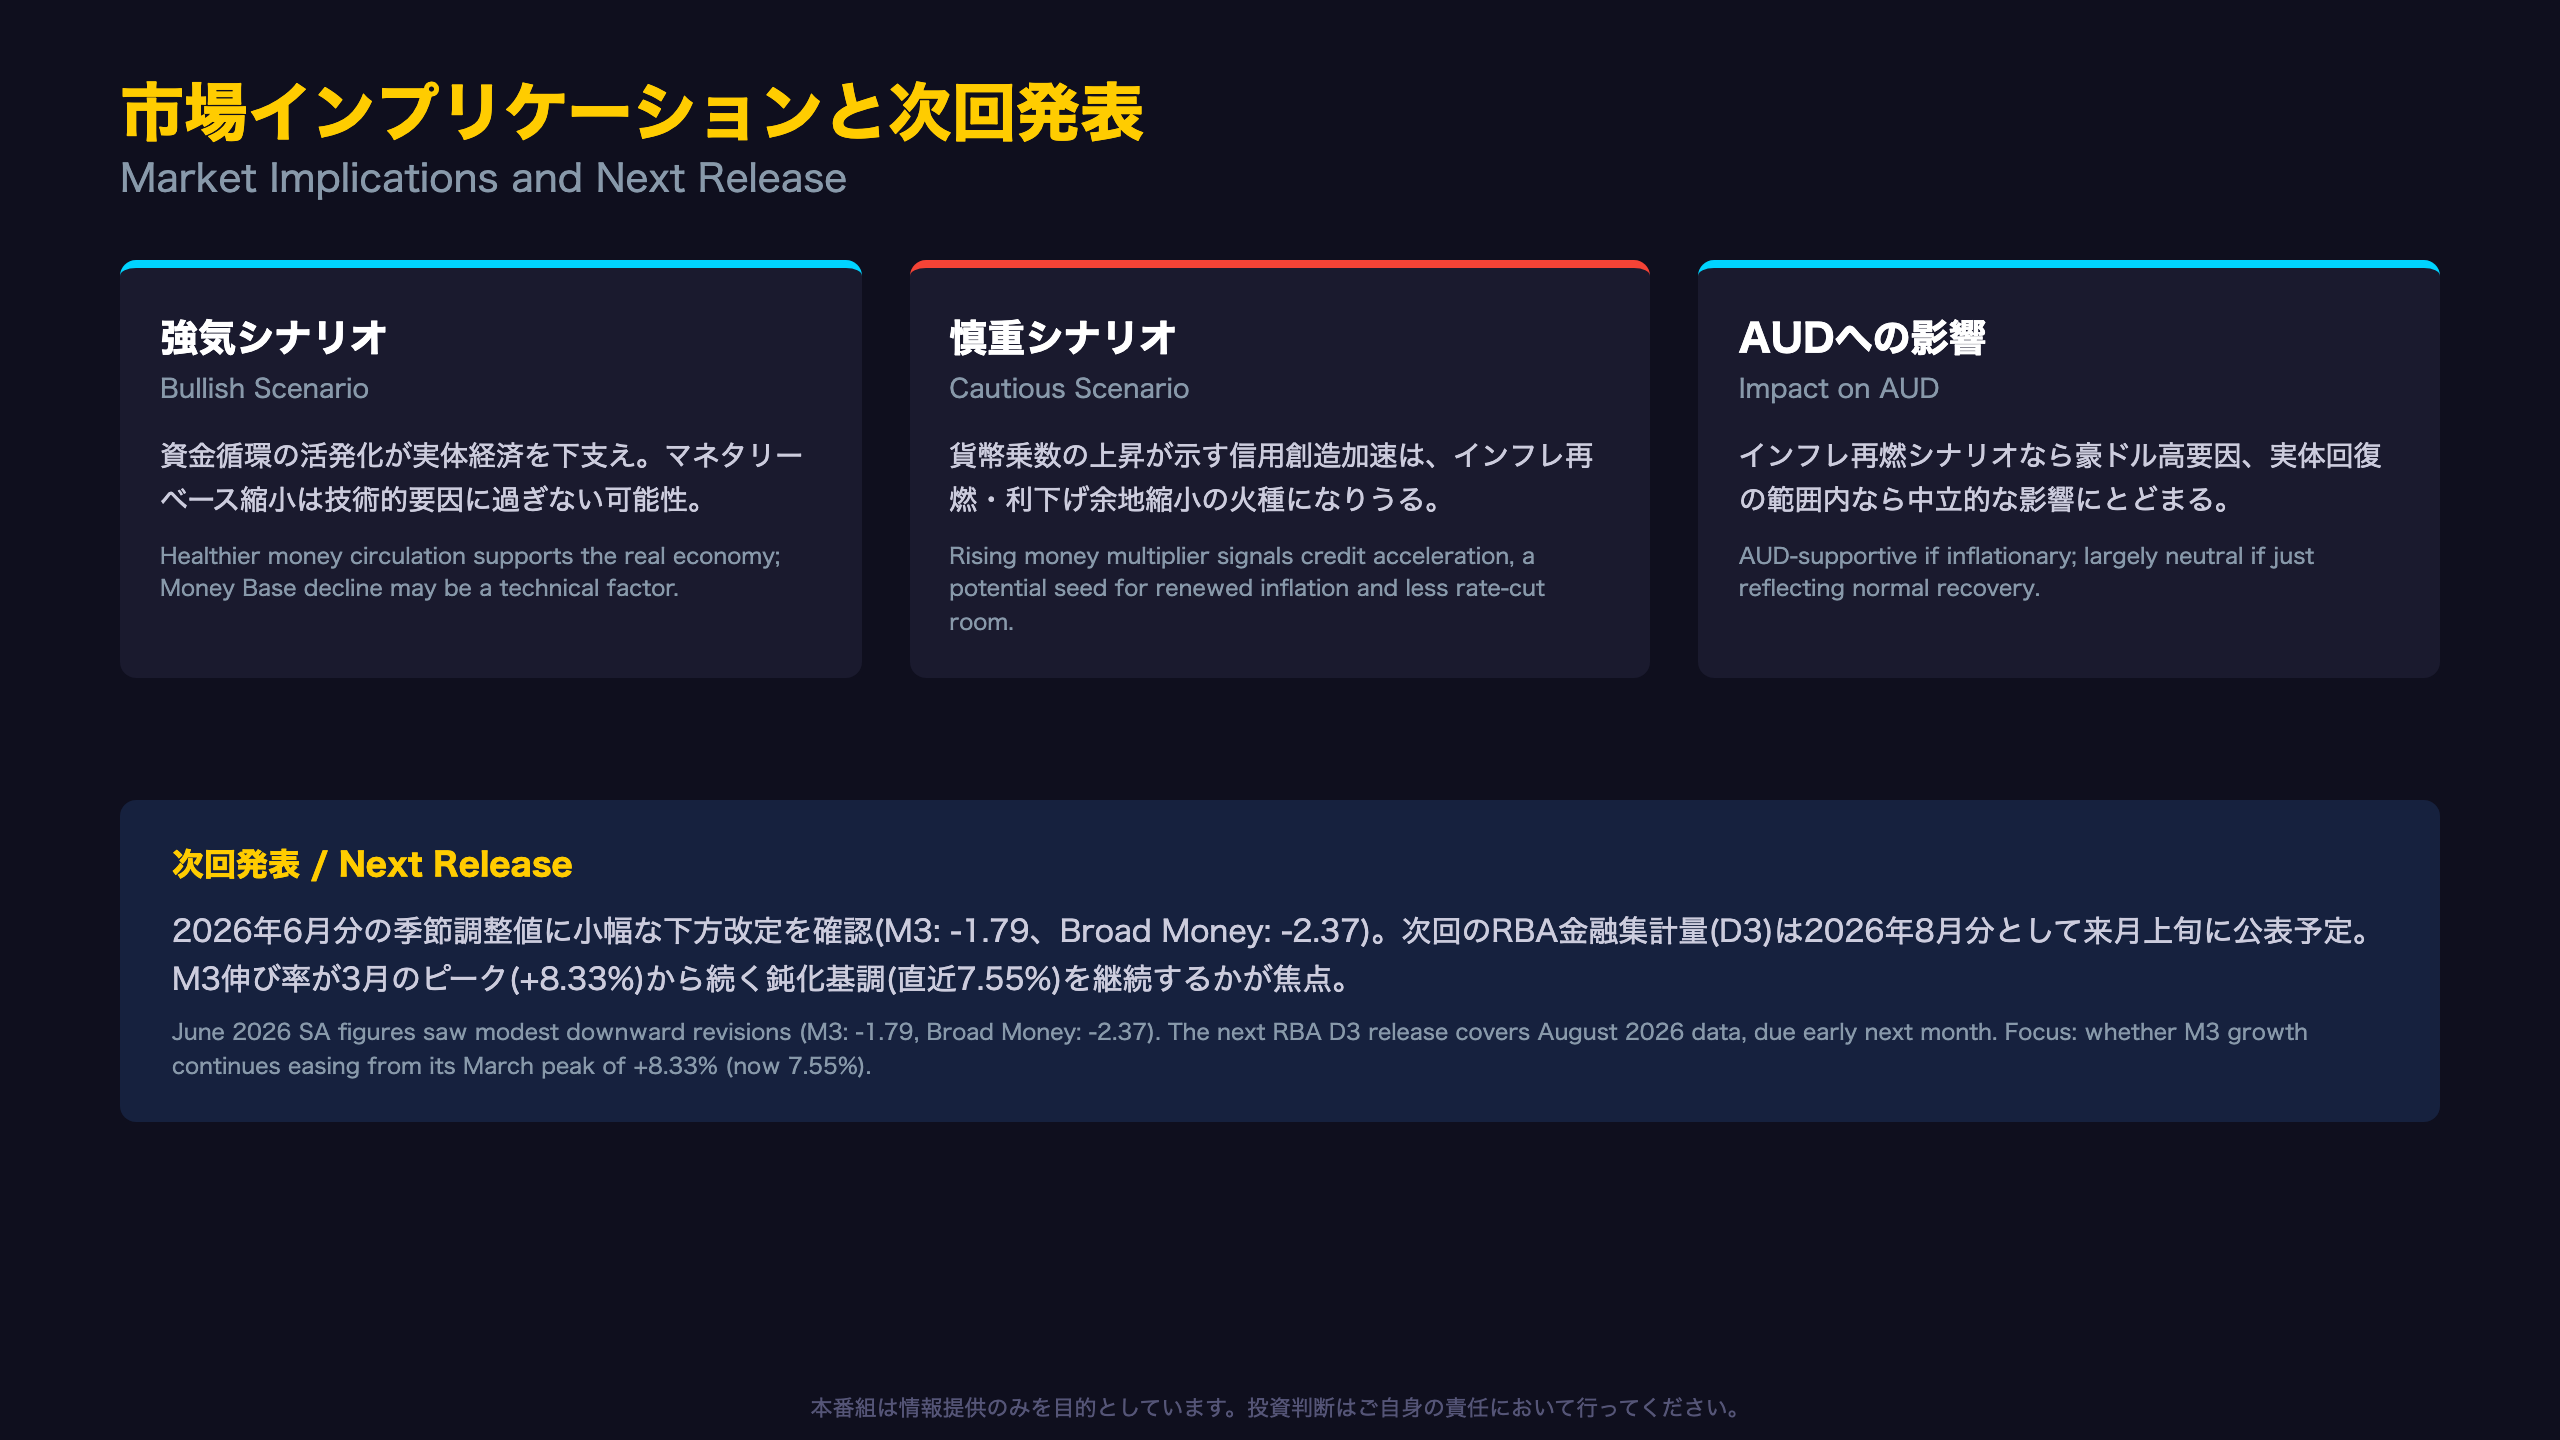
Bull and Bear Cases: Two Ways to Read This Data
How one interprets this release depends heavily on perspective.
The bullish read (liquidity as a growth signal): Expanding M3 and Broad Money could reflect healthier money circulation in the real economy, supporting business investment and household consumption. The Money Base’s contraction may simply reflect technical central bank operations — such as swings in government deposit balances — rather than any deliberate tightening signal.
The cautious read (inflation re-acceleration risk): On the other hand, the sustained rise in the money multiplier — a sign of accelerating credit creation — could plant the seeds of demand-driven price pressure. For an RBA weighing its policy path, persistently elevated money supply growth could reinforce a case for pausing or ending rate cuts rather than continuing to ease.
On Data Revisions
Comparing this release to the prior month’s preliminary figures, June 2026’s seasonally adjusted values were revised modestly lower: M3 (SA) from 3,484.54 to 3,482.75 (-1.79), and Broad Money (SA) from 3,499.89 to 3,497.52 (-2.37) — both revisions under 0.1%. This reflects routine seasonal-adjustment-factor recalculation rather than any meaningful trend change, and is typical for this type of statistical series.
Looking Ahead
The RBA’s next Financial Aggregates (D3) release, covering August 2026, is expected in early September. The key question is whether M3’s year-over-year growth — which peaked at +8.33% in March 2026 and has eased to the 7.55%-8.05% range over the past four months — continues to soften, or reaccelerates. A further slowdown into the low-7% range would support the view that the liquidity expansion phase has run its course.
Disclaimer: This article is for informational purposes only. All investment decisions are made solely at your own risk.