📺 Watch the Full Video Analysis
This article was automatically generated by the NFC Market Live AI analysis system. (Updated: 2026-10-09 23:10 JST)
📄 Primary Source
University of Michigan
http://www.sca.isr.umich.edu/
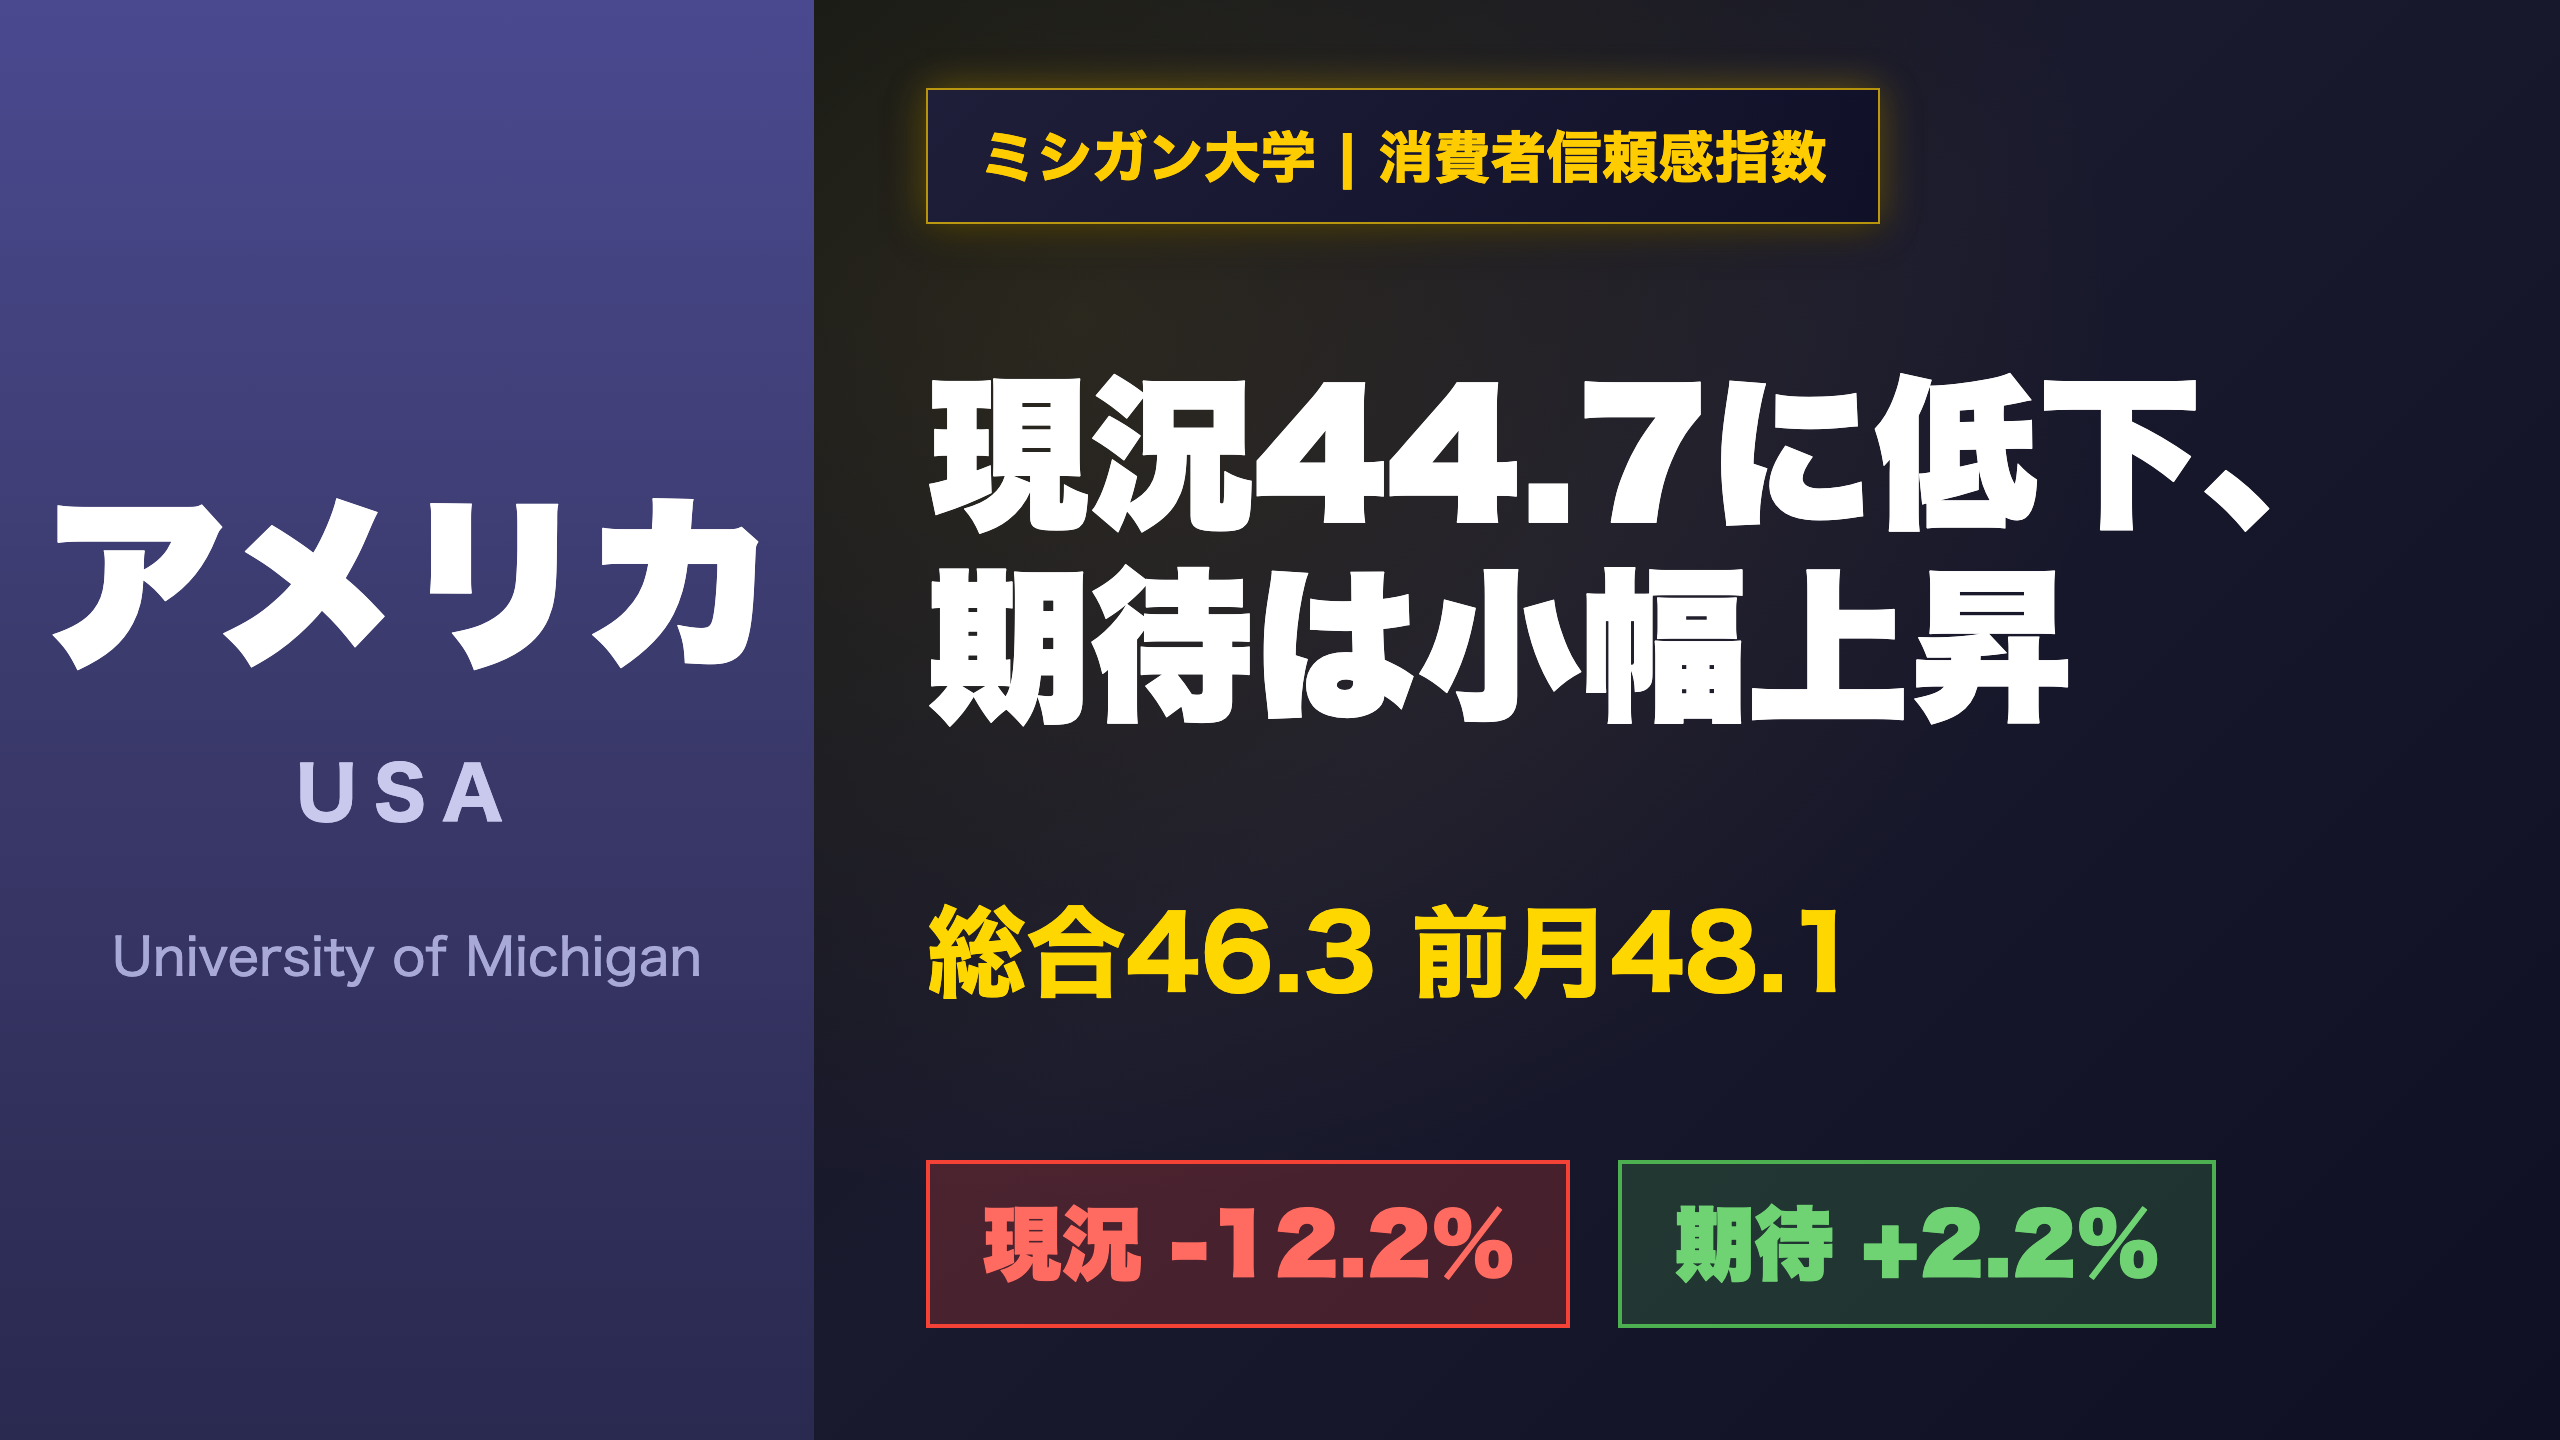
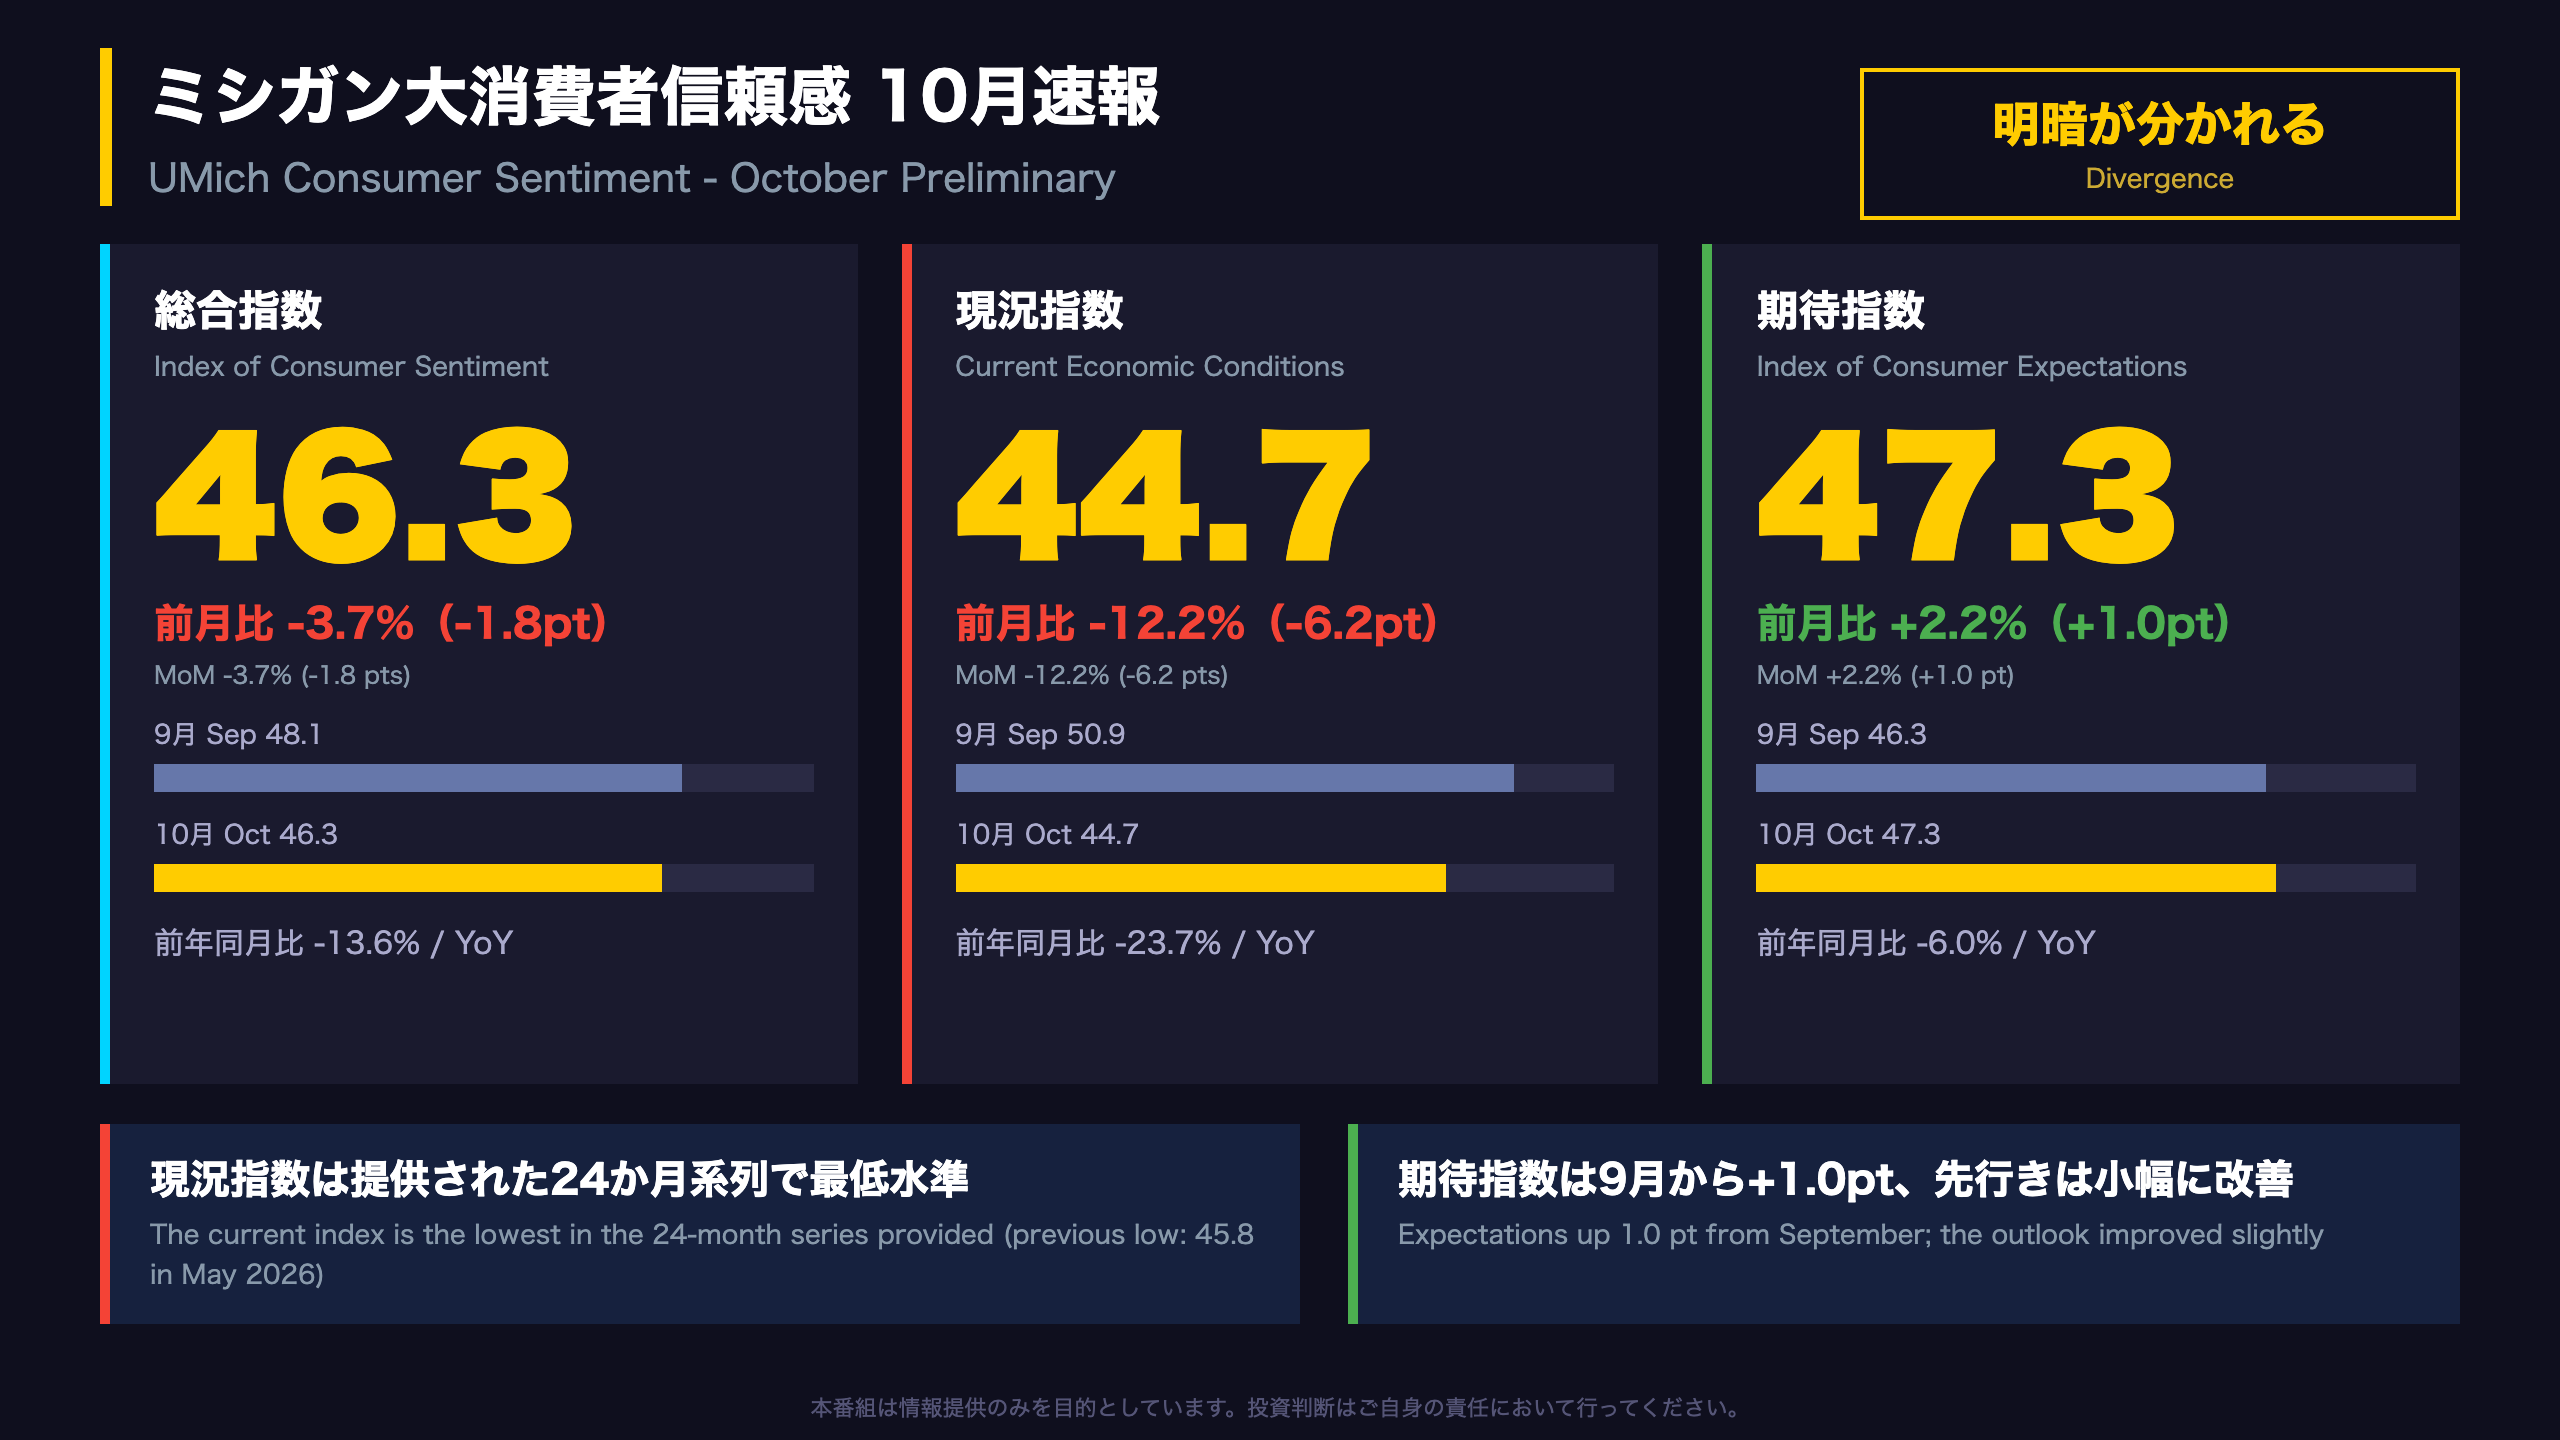
📊 The University of Michigan’s October 2026 preliminary sentiment index fell to 46.3 from 48.1.
📉 Current conditions dropped 12.2% to 44.7, the lowest in the 24-month series provided.
📈 Expectations edged up to 47.3 from 46.3, and year-ahead views of personal finances and business conditions improved slightly.
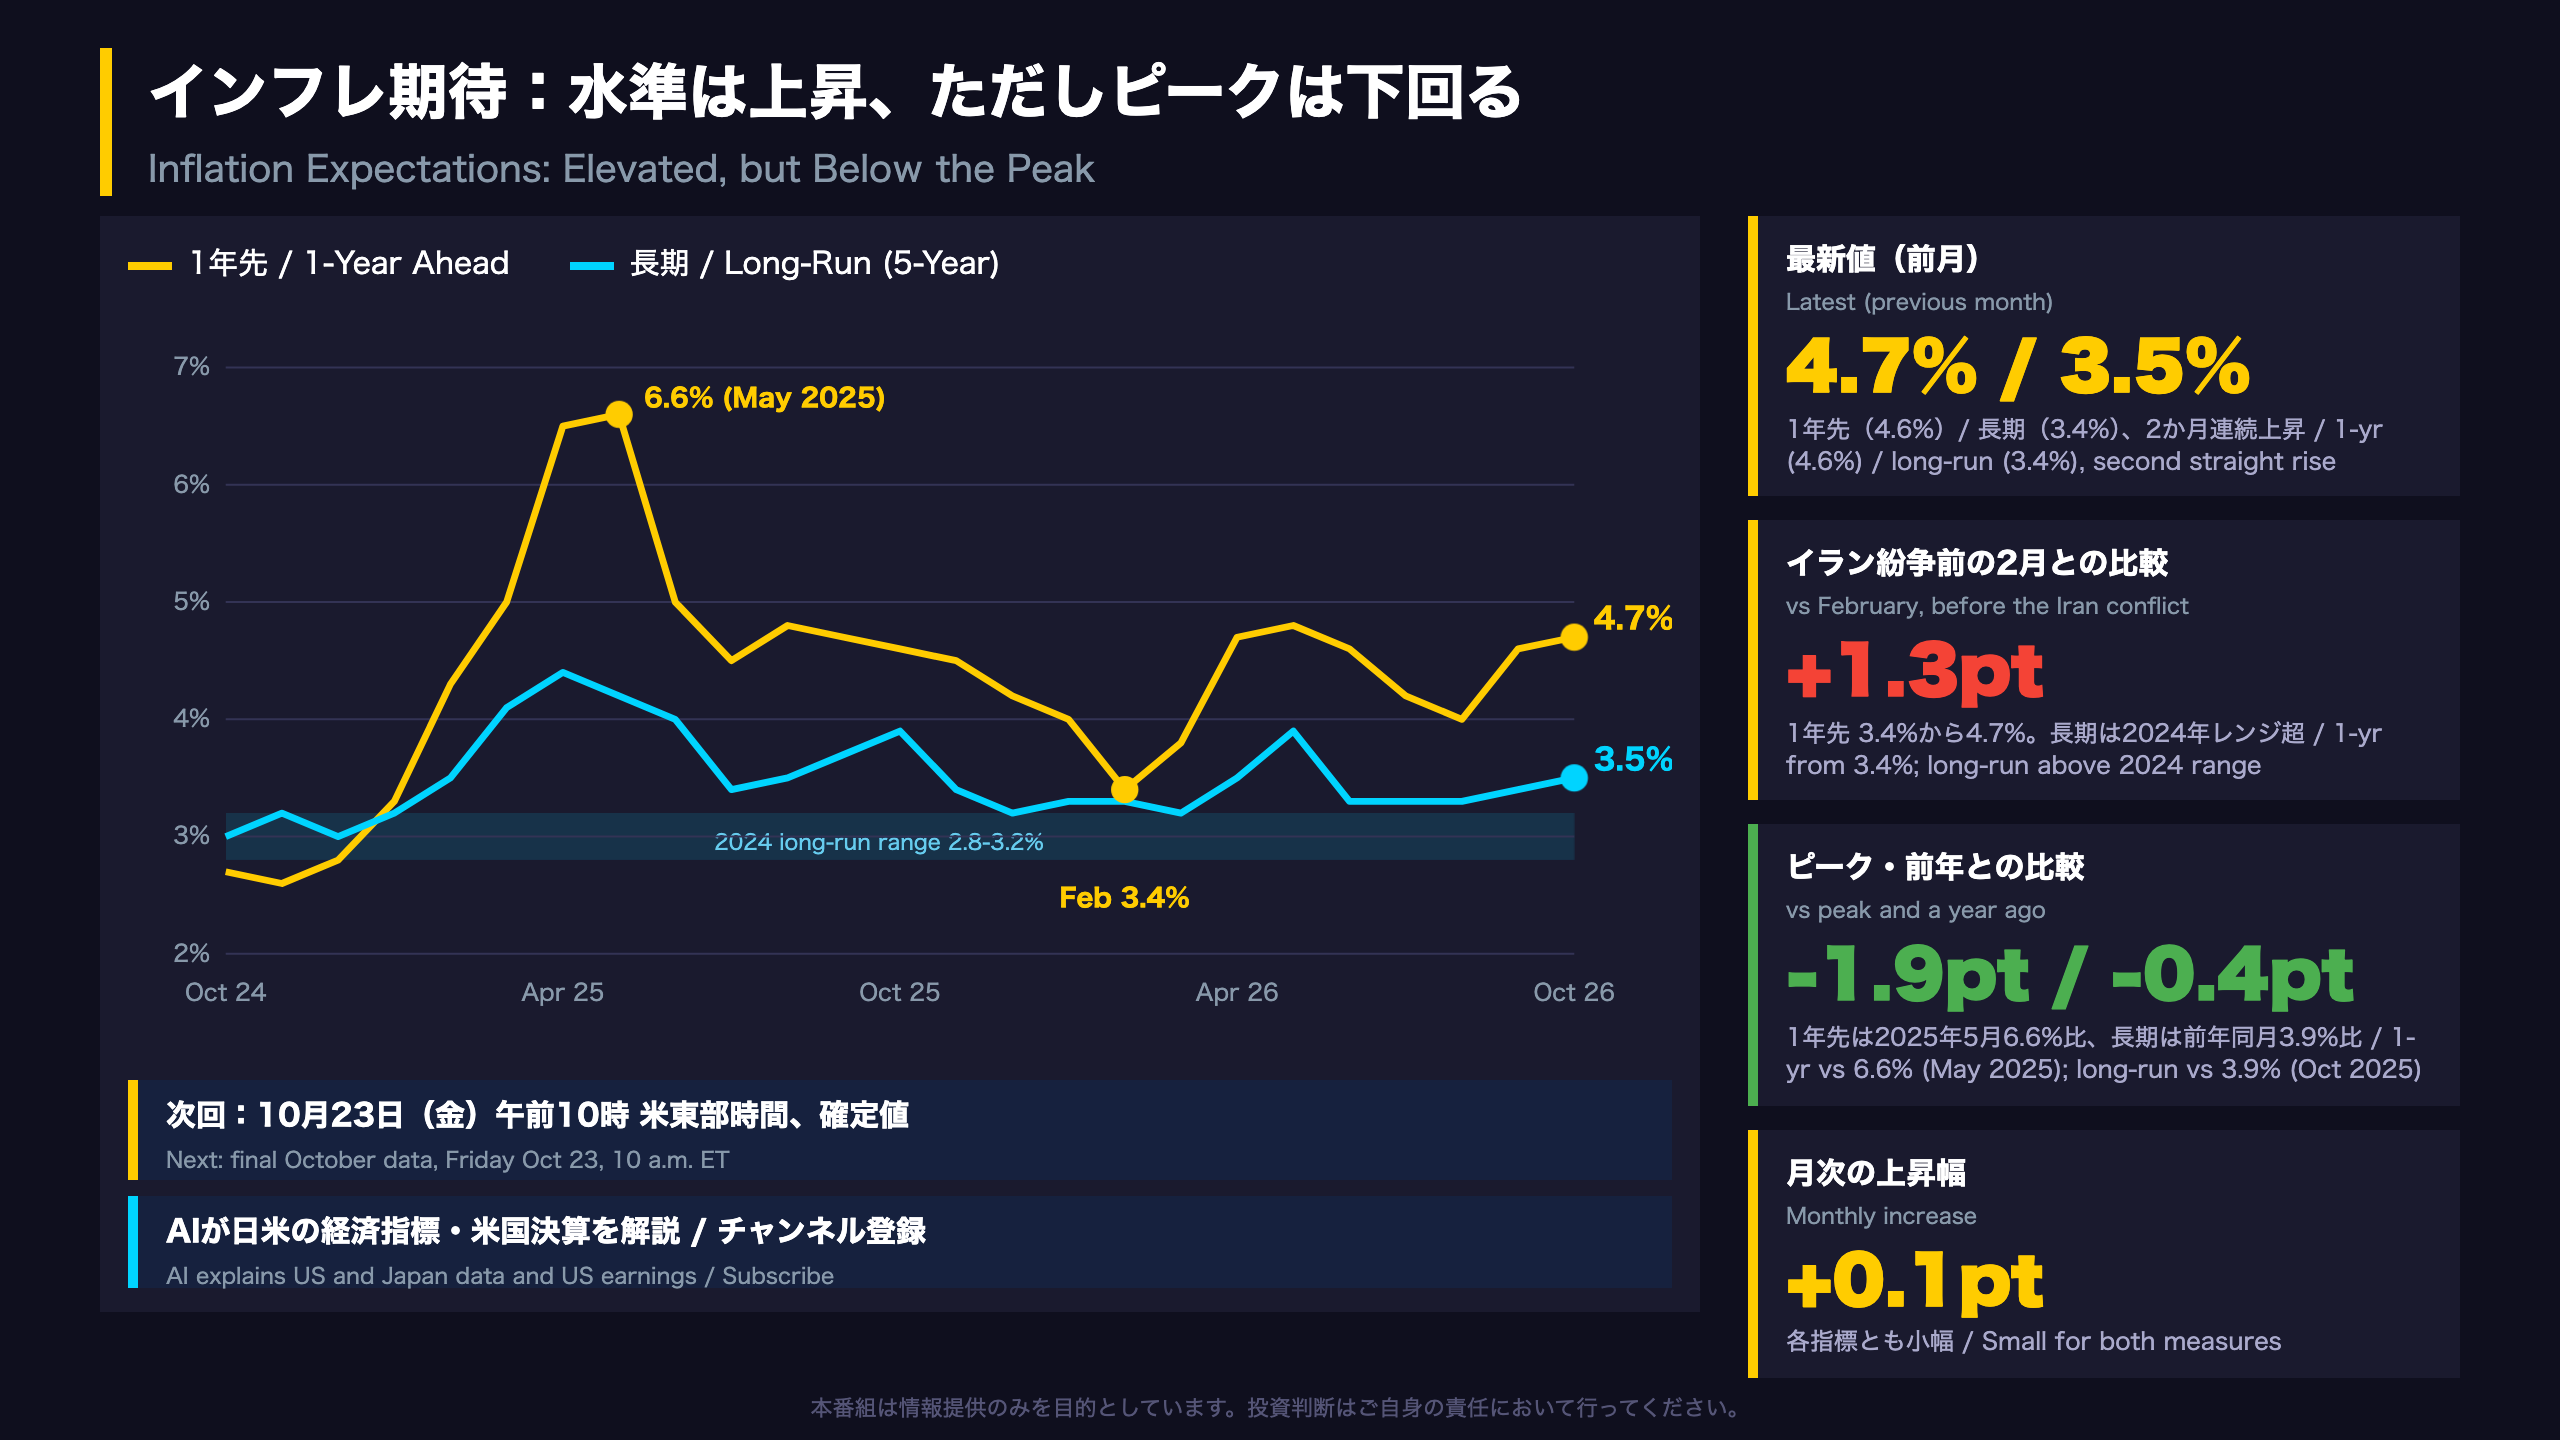
⚠️ Year-ahead inflation expectations rose to 4.7% and long-run to 3.5%, both up for a second month and the highest since May, yet the 1-year reading remains below the May 2025 peak of 6.6%.
💡 Final October data arrives on October 23.
The Ultimate Summary:現況44.7に低下、期待47.3に上昇
Reading the October Preliminary Print
The University of Michigan’s Surveys of Consumers is a monthly household survey that US investors watch as an early read on consumer mood. It is a different survey from the Conference Board’s confidence index, with its own methodology. The October preliminary figures will be updated when final data are published on Friday, October 23 at 10 a.m. ET; the size of past revisions is not stated in the source.
Key numbers
- Sentiment: 46.3 (Sep 48.1; Oct 2025 53.6)
- Current conditions: 44.7 (Sep 50.9; Oct 2025 58.6)
- Expectations: 47.3 (Sep 46.3; Oct 2025 50.3)
Context
Current conditions are the lowest value in the 24-month history supplied with the report, edging below the 45.8 posted in May 2026. Expectations remain 3.2 points above their May 2026 trough of 44.1 and roughly 30 points below the November 2024 high of 76.9.
Two readings
- Resilience view: the headline fell only 1.8 points, and the survey director described sentiment as ‘little changed’.
- Risk view: the headline masks a 12.2% monthly drop in current conditions and a 23.7% year-over-year decline.
What to watch
The final October data on Oct 23. The sub-indexes on current conditions and expectations, and the inflation expectations covered in the later slides, are the pieces to compare against the preliminary print.
現況と期待の乖離:過去2年の推移
Divergence Between Present and Future
Two series, two paths
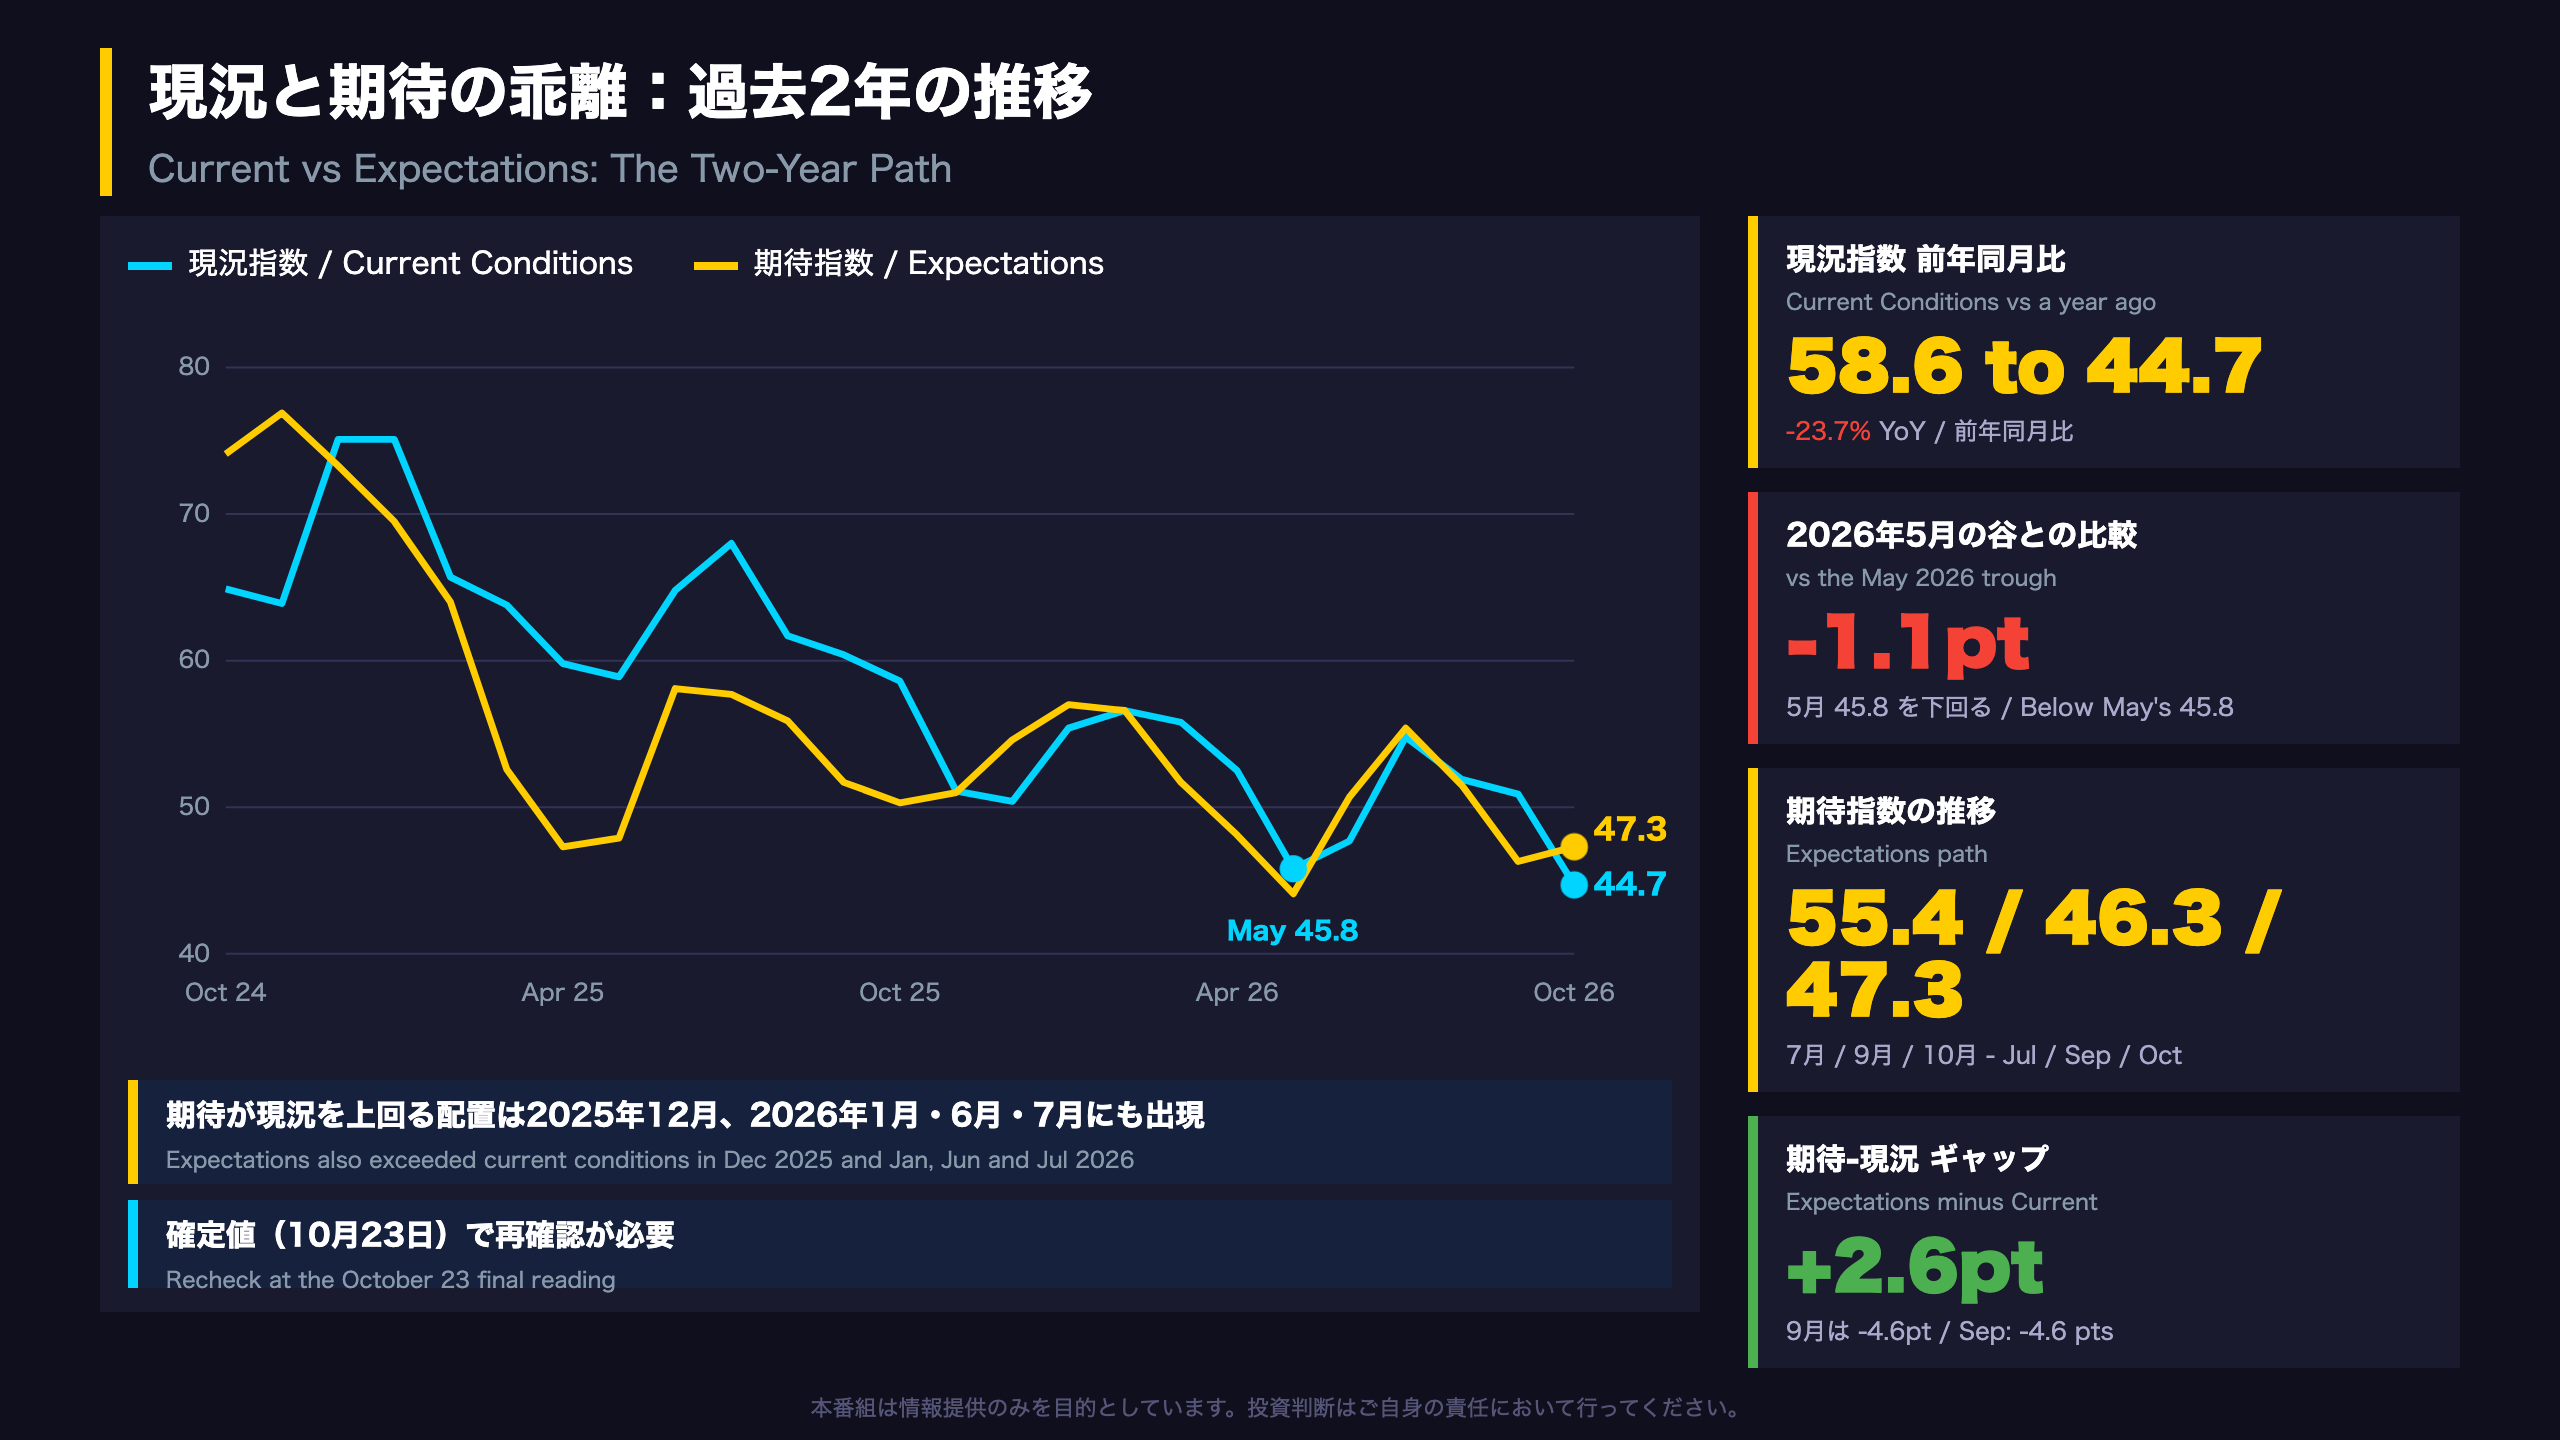
The current conditions index peaked at 75.1 in December 2024 and January 2025, fell to 51.1 by November 2025, and has since oscillated between the mid-40s and mid-50s. October’s 44.7 is a new low for the 24-month series provided. The expectations index fell from 76.9 in November 2024 to 47.3 in April 2025, troughed at 44.1 in May 2026, rebounded to 55.4 in July, and was back at 46.3 in September before October’s 47.3.
| May 2026 | Jul 2026 | Sep 2026 | Oct 2026 | |
|---|---|---|---|---|
| Current | 45.8 | 54.8 | 50.9 | 44.7 |
| Expectations | 44.1 | 55.4 | 46.3 | 47.3 |
Why a 2.6-point gap is not a regime change
Expectations sit above current conditions this month, but the same ordering occurred in December 2025 and in January, June and July 2026. A single-month crossover is weak evidence. Neither the sampling error nor confidence intervals are given in the source.
Constructive and cautious reads
- Constructive: after the May 2026 trough, both indexes rose by roughly 9 to 11 points within two months. That is a historical fact in the series, not a forecast.
- Cautious: the current index has now broken below that trough, so households’ assessment of present conditions is weaker than at the May low.
International comparison
The Conference Board publishes a separate US confidence gauge, and the two surveys can diverge because of differences in design. This report does not compare them, so no conclusion is drawn here.
Next check
The final reading on October 23 will show whether the gap between expectations and current conditions holds.
サブ項目の強弱:底堅さとリスクの綱引き
Who Is Feeling the Squeeze?
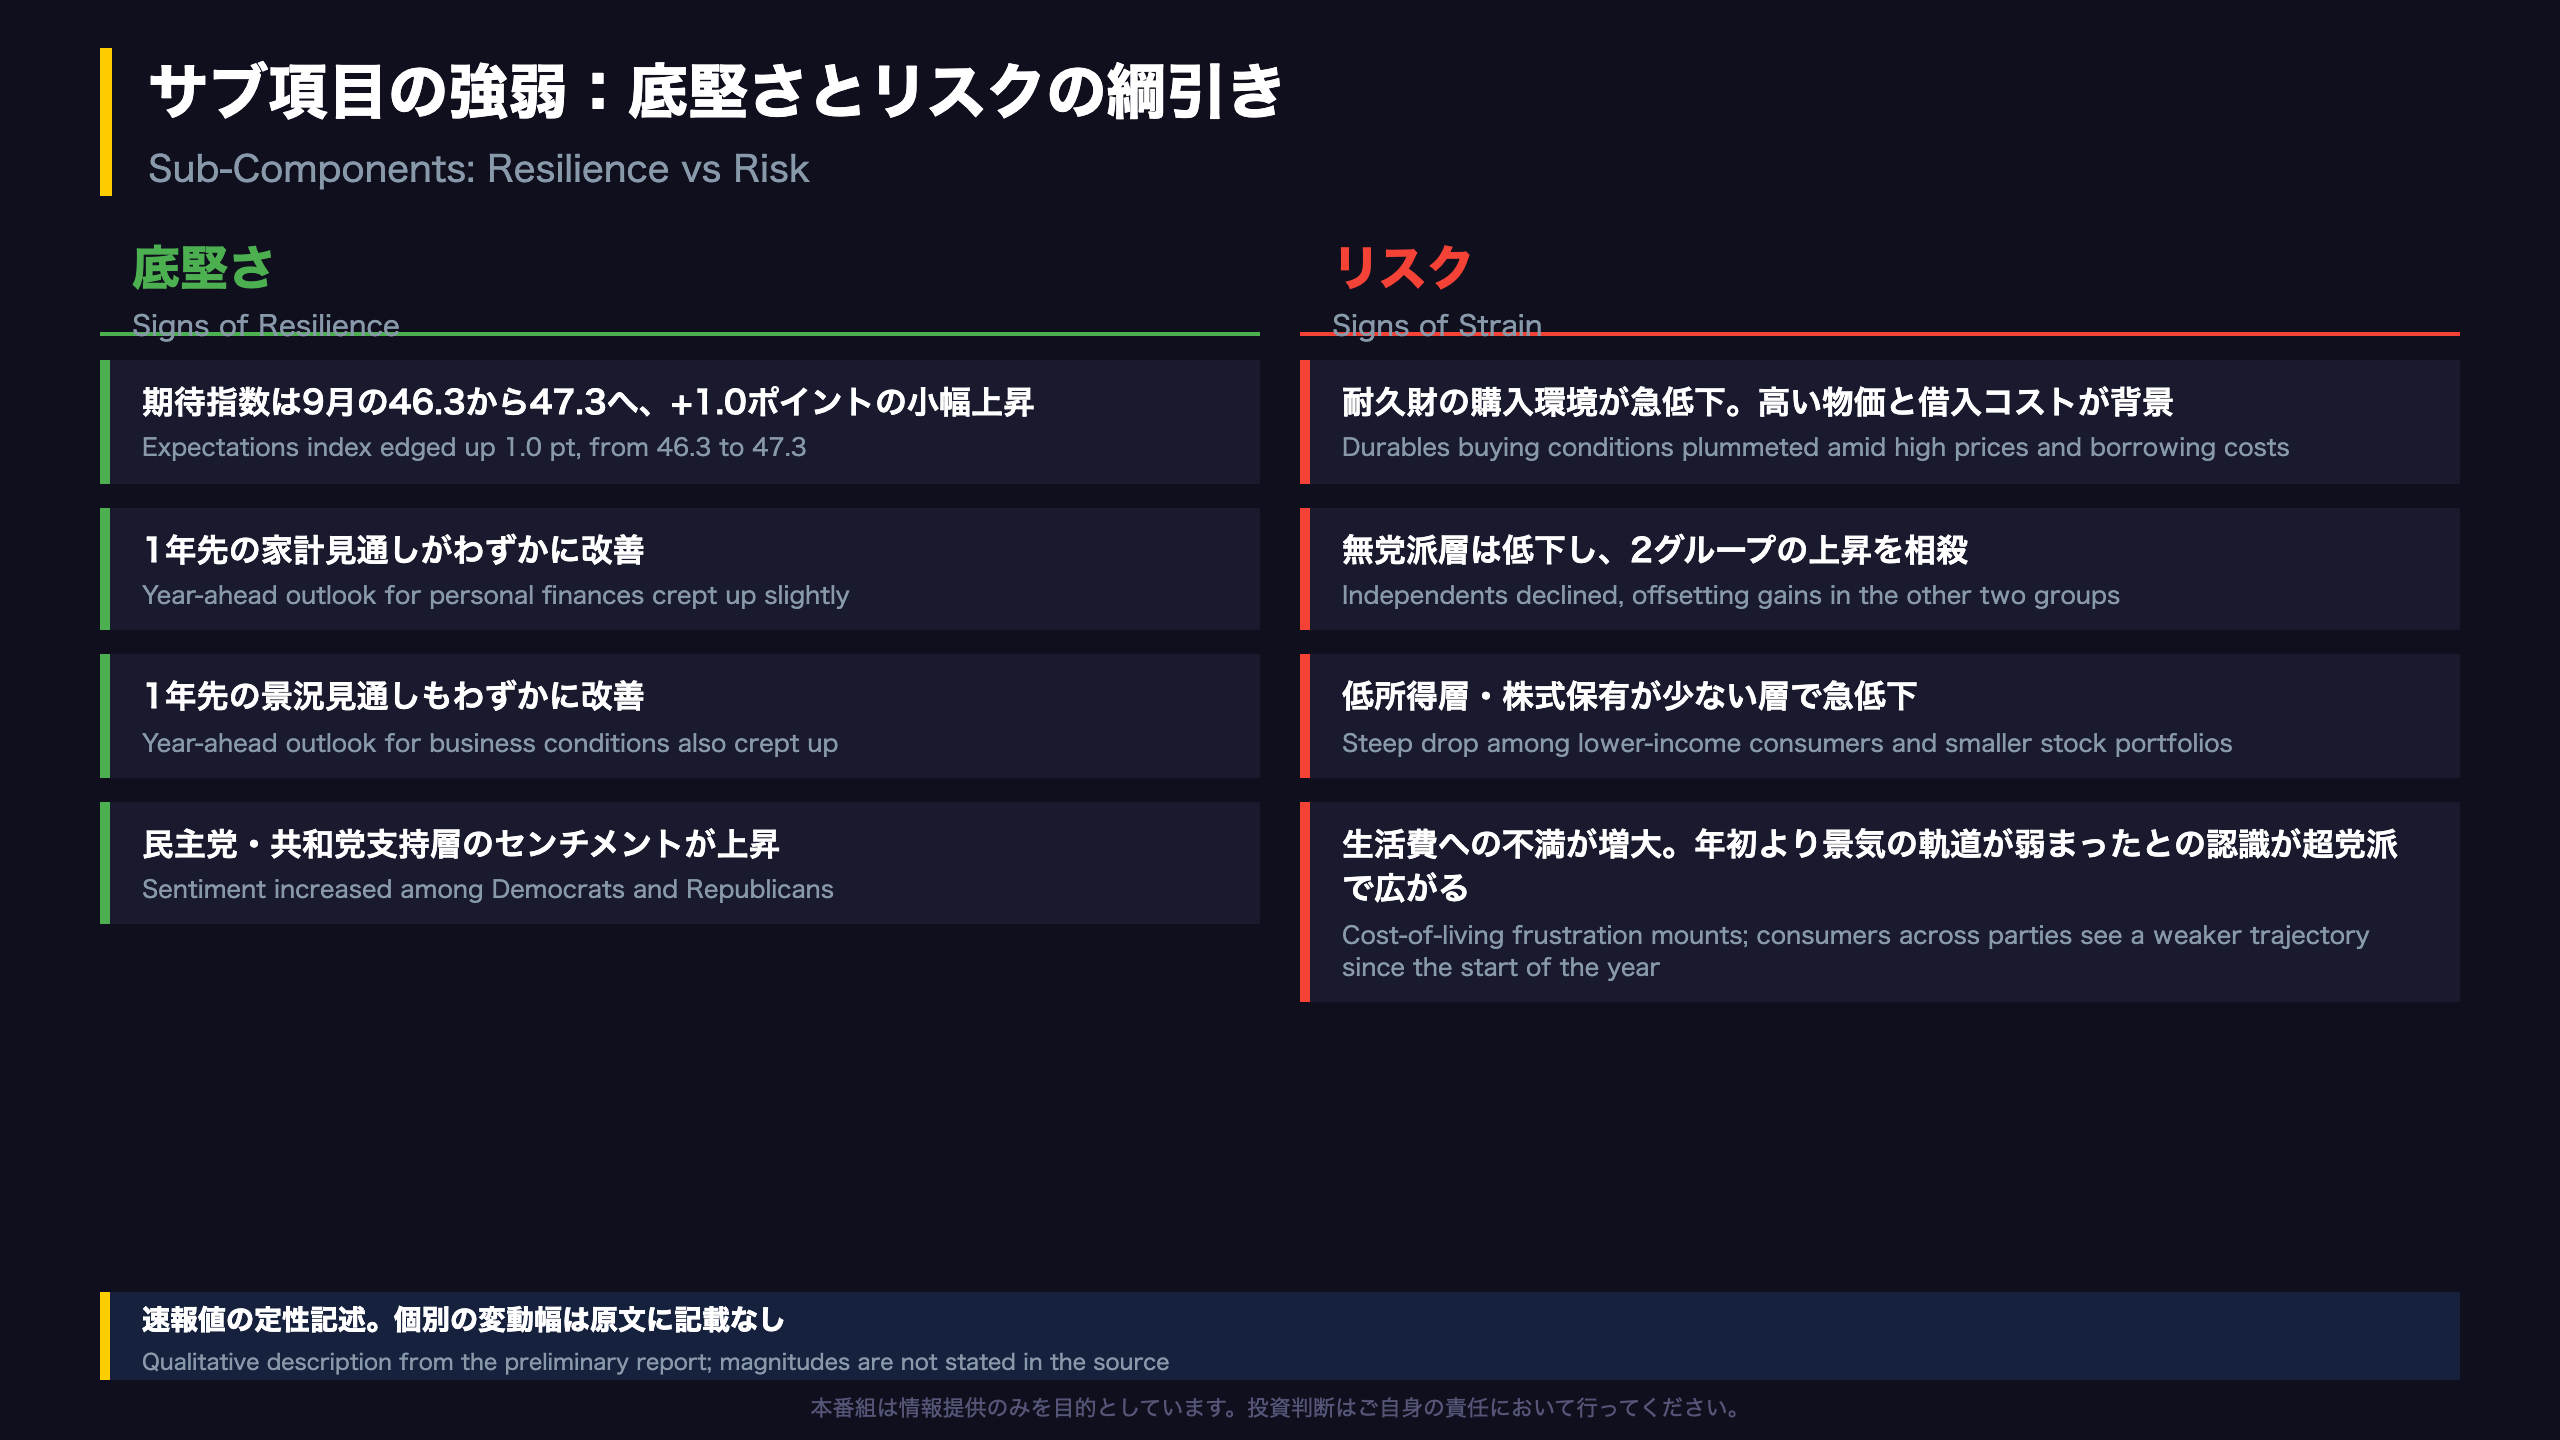
The report is descriptive rather than numeric at the sub-index level, so the useful facts are directional.
Signs of resilience
- Year-ahead expectations for personal finances and business conditions ‘crept up slightly’.
- Sentiment rose among both Democrats and Republicans.
Signs of strain
- Buying conditions for durable goods ‘plummeted’, which the report links to high prices and borrowing costs.
- Independents declined, offsetting the gains in the other two groups.
- Lower-income consumers and those with smaller stock portfolios fell steeply, groups with fewer resources to absorb higher prices.
Consumers across the political spectrum believe the trajectory of the economy has weakened since the beginning of the year.
Institutional context
The Surveys of Consumers is run by the University of Michigan and is typically split into a current-conditions index and an expectations index. The current index is generally built from views of present household finances and durable-goods buying conditions, so the durables drop may have contributed to this month’s decline. That is an inference from a single month, and the source does not detail the index construction.
Reading the evidence
- Constructive: the forward-looking items edged higher and two of the three political groupings improved, so the survey is not uniformly negative.
- Cautious: the pressure is concentrated in groups with fewer financial buffers, and the cost-of-living frustration is described as still building.
Limits of the data
Group-level magnitudes are not provided in the text, so the size of each move cannot be compared. The October 9 special report ‘Gasoline Prices and Expected Consumer Spending’ is listed by the survey; its contents are not in the provided text.
インフレ期待:水準は上昇、ただしピークは下回る
Inflation Expectations: Elevated but Below the Peak
Why these numbers matter
The Michigan survey asks households about expected price increases one year ahead and over a longer horizon. The long-run figure is closely watched because it indicates how firmly the public’s inflation views are anchored. Unlike the US CPI, which measures realized prices, these are survey-based expectations. Japan’s CPI, by comparison, is a realized-price series, so the two should not be compared directly.
| Oct 2026 | Sep 2026 | Oct 2025 | Peak in table | |
|---|---|---|---|---|
| 1-year | 4.7% | 4.6% | 4.6% | 6.6% (May 2025) |
| Long-run | 3.5% | 3.4% | 3.9% | 4.4% (Apr 2025) |
Timeline
- The 1-year reading bottomed at 3.4% in February 2026, before the Iran conflict began according to the report, then climbed to 4.8% by May, dipped to 4.0% in August and returned to 4.7%.
- The long-run reading held at 3.3% from June to August before rising to 3.4% and then 3.5%.
- The report notes the long-run level is notably above its 2024 range of 2.8% to 3.2%.
Two readings
- Cautious: both horizons rose for a second straight month to their highest since May, and the 1-year reading is 1.3 points above its February level.
- Calmer: the 1-year reading is 1.9 points below its May 2025 peak, the long-run is 0.4 below a year ago, and monthly increases were only 0.1 point each.
What to watch
Final October data on Friday, October 23 at 10 a.m. ET. The question is whether the two-month rise extends to a third. How the Federal Reserve weighs these figures is not covered in the source, so no policy conclusion is drawn here.
Disclaimer: This article is for informational purposes only. All investment decisions are made solely at your own risk.







