
📺 Watch the Full Video Analysis
This article was automatically generated by the NFC Market Live AI analysis system. (Updated: 2026-10-24 07:16 JST)
📄 Primary Source
米国労働省(DOL)— 新規失業保険申請件数
https://www.dol.gov/newsroom/releases/eta/eta20261022
米国エネルギー情報局(EIA)— 週間石油状況レポート
https://www.eia.gov/petroleum/supply/weekly/pdf/highlights.pdf
連邦準備制度理事会(FRB)— H.4.1 バランスシート
https://www.federalreserve.gov/releases/h41/current/h41.htm
📊 A one-stop review of this week’s three US macro releases.
📈 Labor: Initial jobless claims were 194,000 (-6,000 WoW). The 4-week average of 197,750 sits below 227,750 a year ago.
⚠️ Energy: WTI crude was $108.21 vs $98.73 a week earlier and $58.30 a year ago, while gasoline demand is in line with last year.
💡 Liquidity: Reserve balances averaged $2.96T (-$59.5B WoW) as the Treasury General Account rose $68.6B.
Strengths and cautions coexist; one week cannot confirm a trend, so the next updates matter.
今週のアルティメット・サマリー
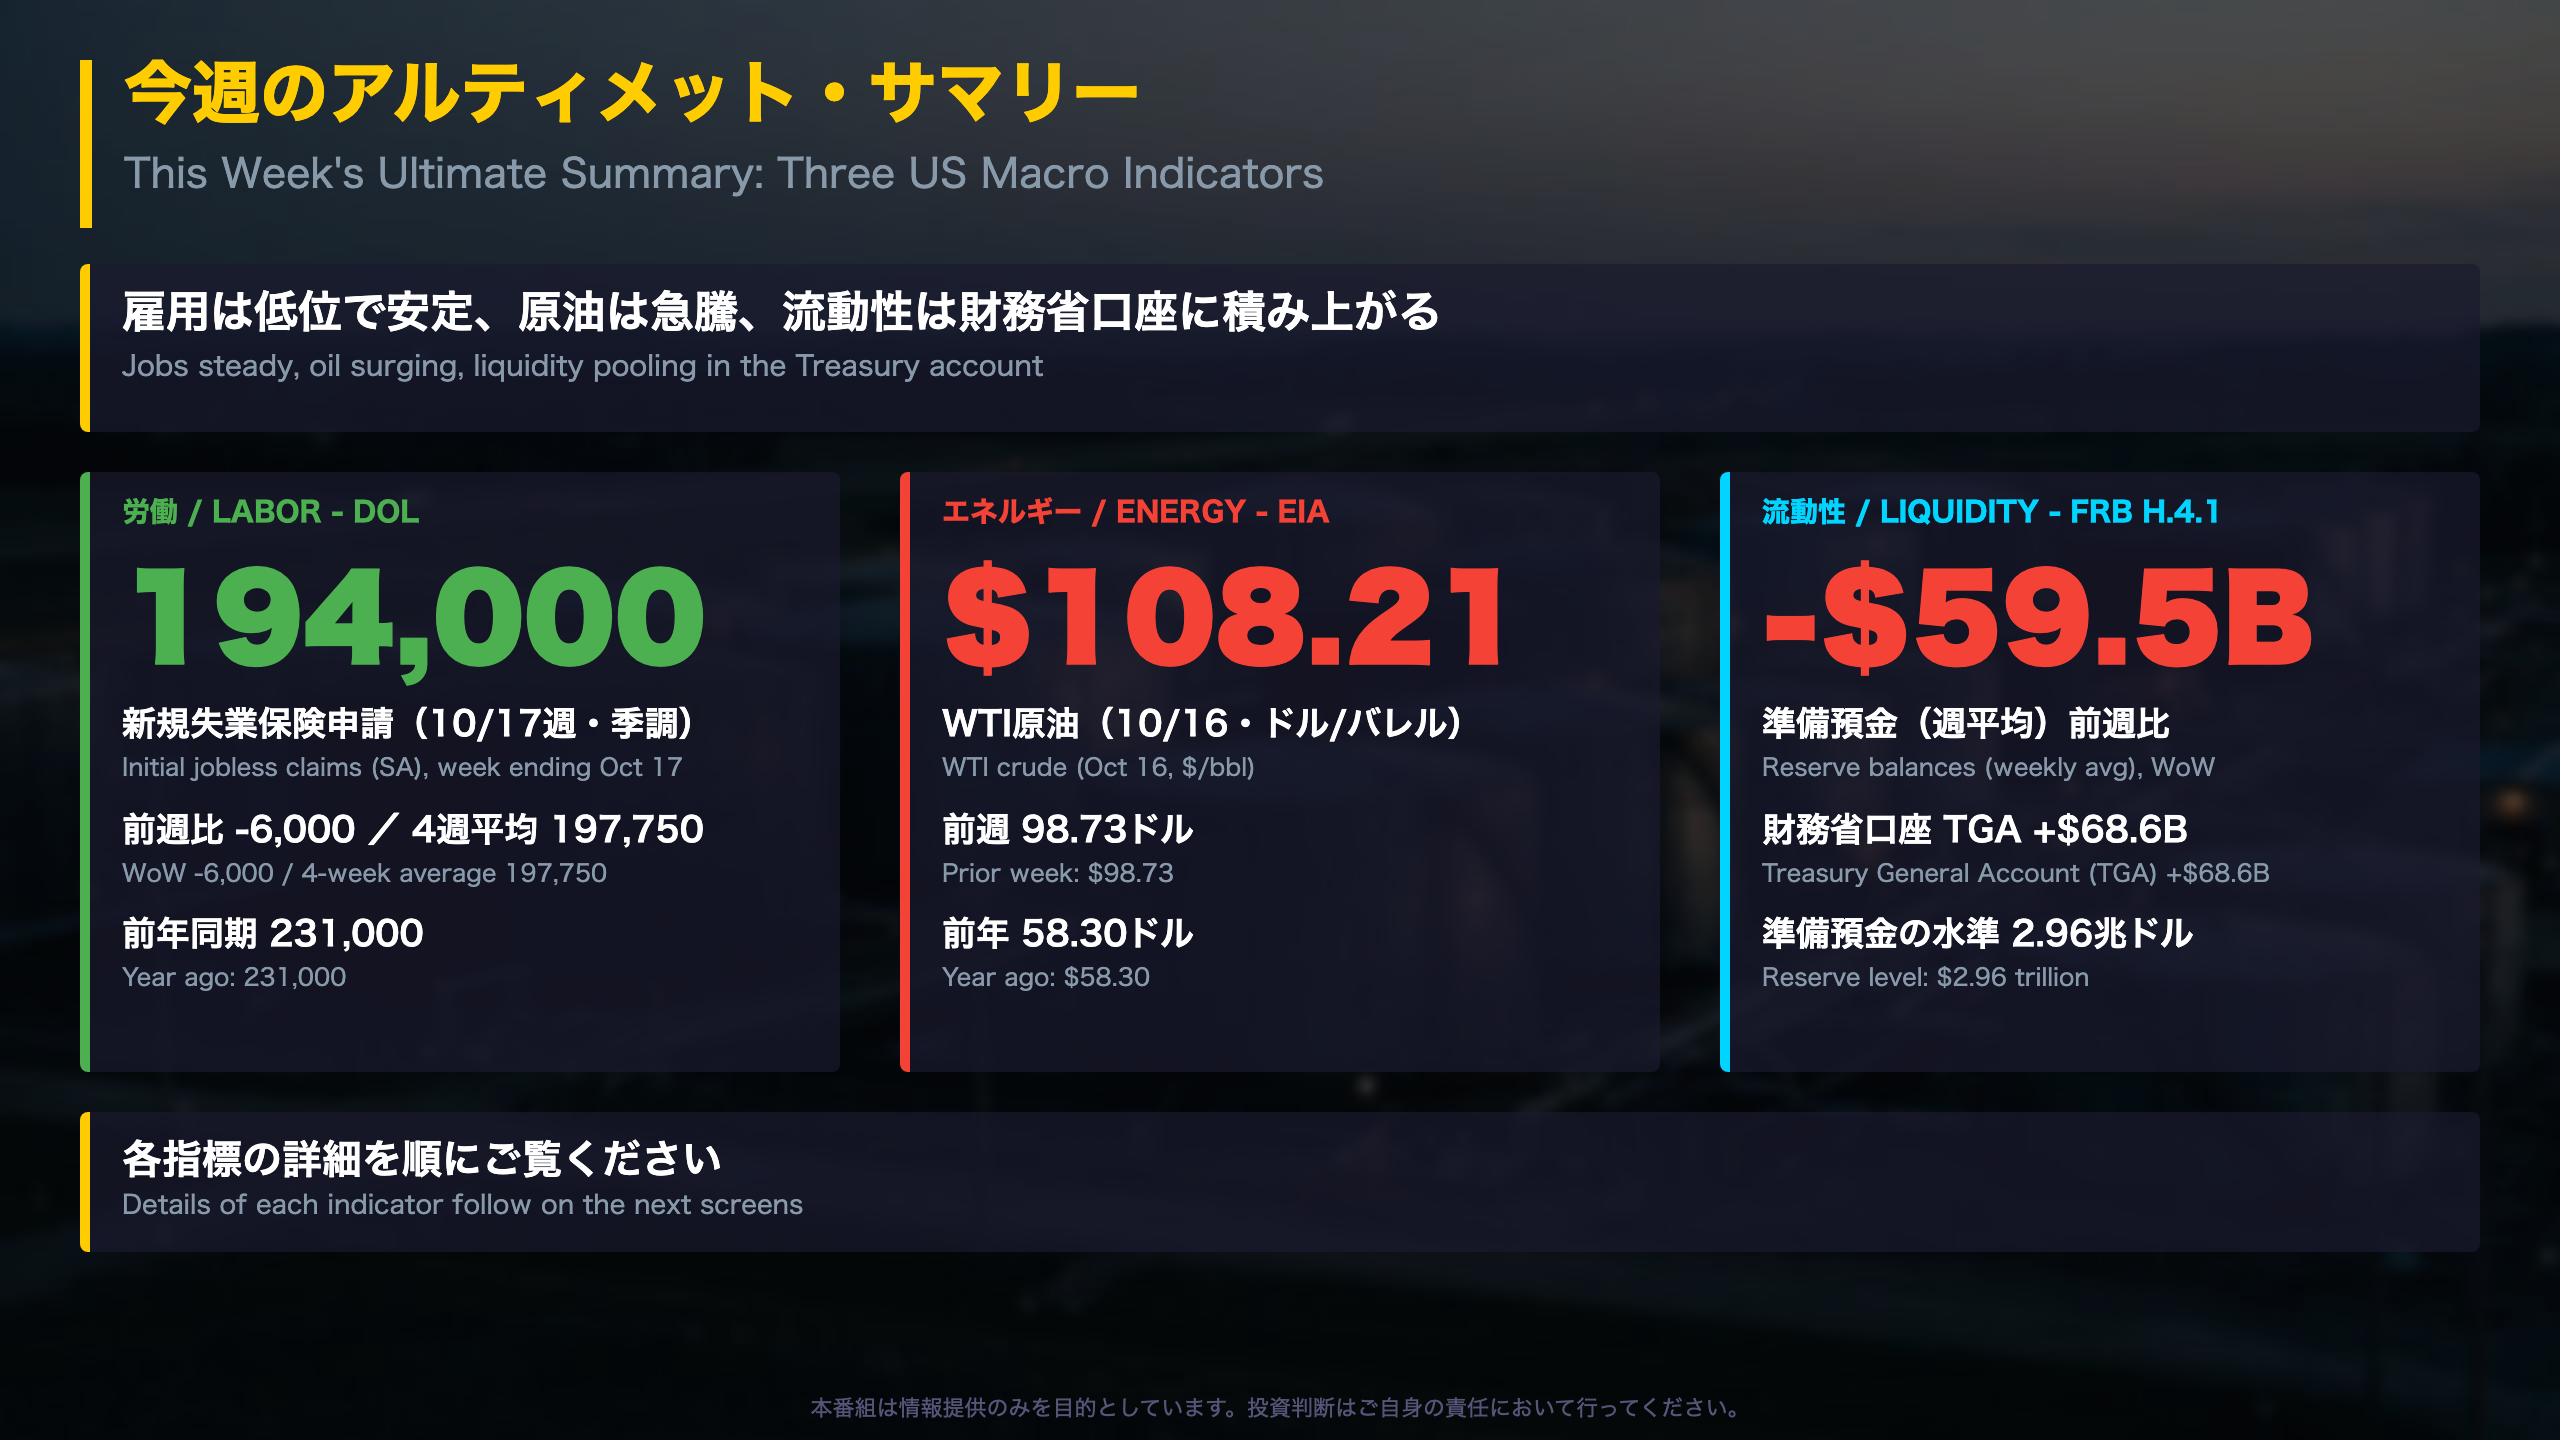
The Week in Three Data Sets
Three US weekly releases landed together: the Department of Labor’s (DOL) unemployment insurance claims, the Energy Information Administration’s (EIA) Weekly Petroleum Status Report, and the Federal Reserve’s H.4.1 balance sheet statement. Each does a different job. Claims gauge layoffs in near real time, EIA tracks physical energy supply, demand and prices, and the H.4.1 shows how much cash sits in the banking system.
Snapshot
- Labor: Initial claims were 194,000 (seasonally adjusted, week ending Oct 17), down 6,000. The 4-week average of 197,750 compares with 227,750 a year earlier.
- Energy: WTI closed at $108.21 on Oct 16 versus $98.73 a week earlier and $58.30 a year ago.
- Liquidity: Reserve balances averaged $2.96 trillion, down $59.5 billion on the week, while the Treasury General Account (TGA) rose $68.6 billion.
Why the mix matters
The three readings do not point the same way. Low claims describe a labor market with few layoffs. The energy price level is a cost headwind. The TGA-reserves swap is a plumbing effect inside the Fed’s balance sheet rather than a statement about the monetary policy stance. Our weekly regime model (a hidden Markov model, or HMM) still places the backdrop in regime R0 with 99.9% probability, though TGA is flagged as an outlier (Z=2.52). The model’s last observation date (Oct 30) differs from the release dates used here.
No single week should be read as a trend change. The follow-up releases are the real test.
労働市場の現在地(DOL 新規失業保険申請)
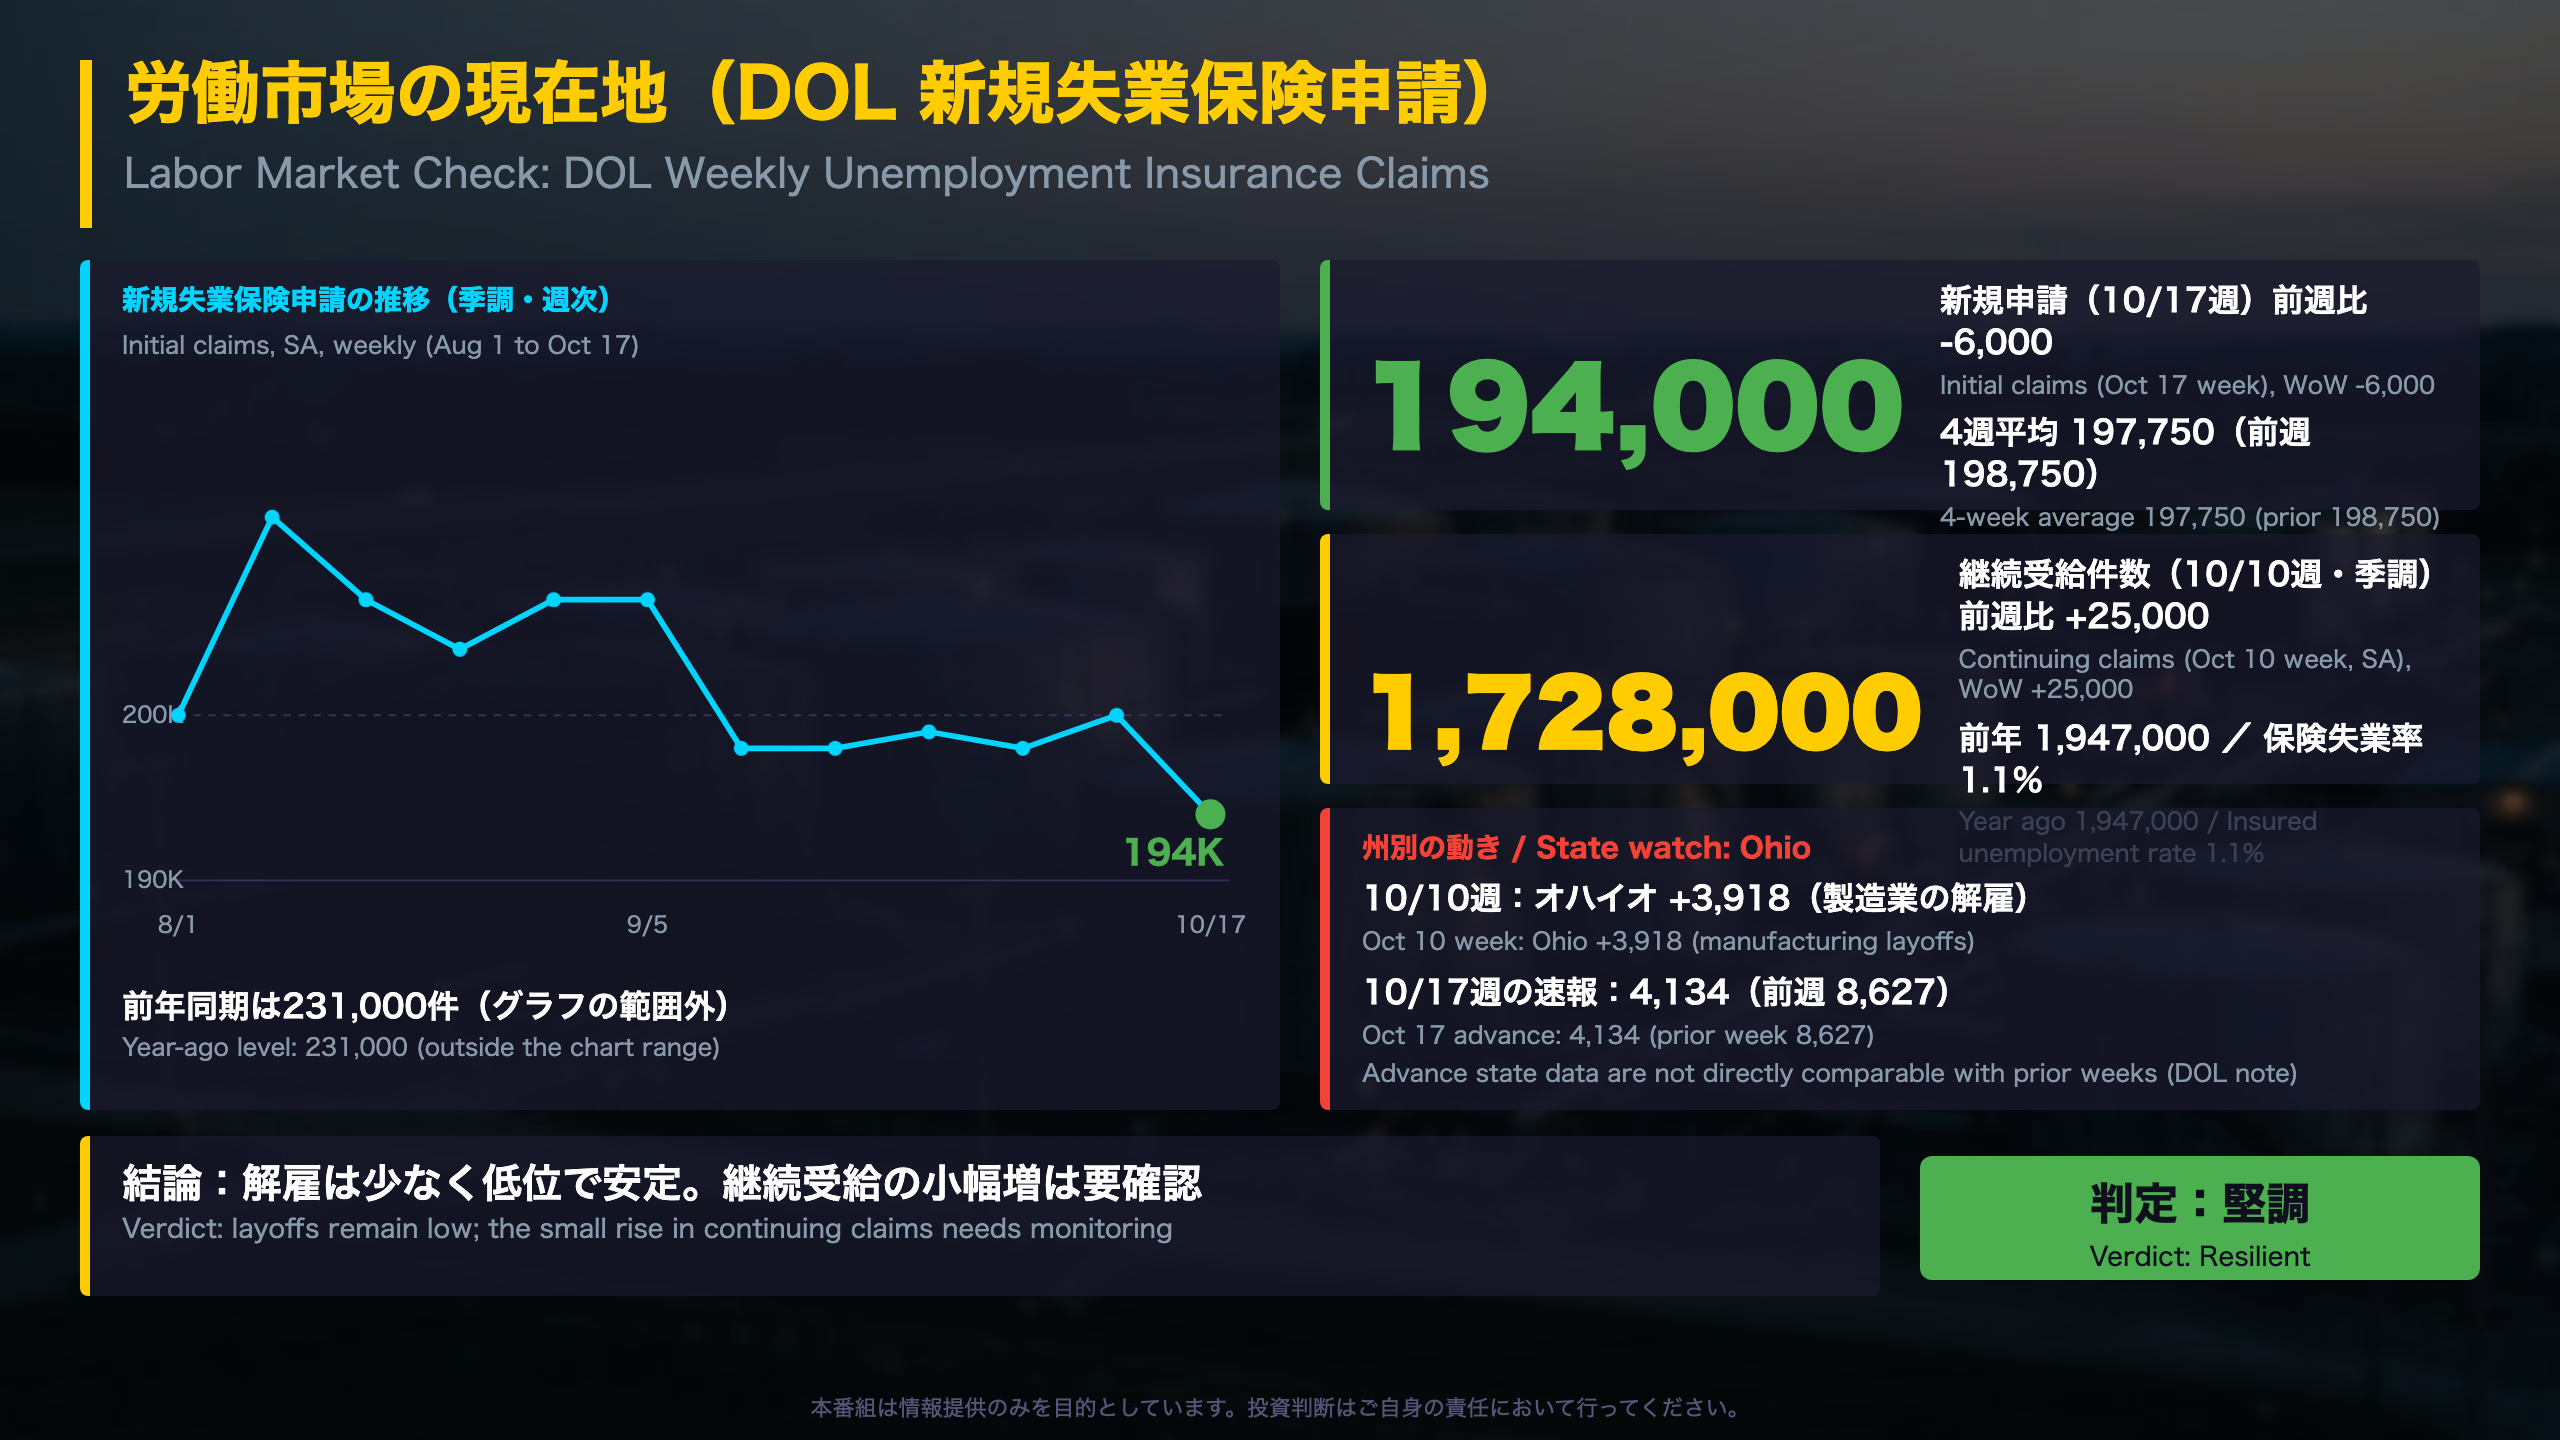
Reading the DOL Weekly Claims Report
What the report is
The Department of Labor’s Employment and Training Administration publishes weekly counts of new filings for state unemployment insurance (initial claims) and of people still receiving benefits (continued claims). DOL itself calls initial claims “a leading economic indicator” and describes continued claims as confirming evidence that roughly coincides with cycle peaks and lags at troughs.
The numbers
- Initial claims: 194,000 (seasonally adjusted), 6,000 below the revised prior week of 200,000. The 4-week average of 197,750 is the lowest in the one-year table published in the release and compares with 227,750 a year ago.
- Insured unemployment (week ending Oct 10): 1,728,000, up 25,000, versus 1,947,000 a year earlier. The insured unemployment rate is 1.1% versus 1.3%.
- Not seasonally adjusted initial claims fell 10.1% against a 7.4% drop that seasonal factors had expected.
State detail
Ohio (+3,918) and Tennessee (+3,477) led increases in the Oct 10 week, with states citing manufacturing layoffs. DOL cautions that advance state figures are not directly comparable with prior-week data, so Ohio’s apparent reversal in the Oct 17 advance should be treated carefully.
Context for global readers
US weekly claims are far more timely than Japan’s monthly unemployment rate or euro-area quarterly labor data, which is why they are read alongside the monthly payrolls report. Low claims with a slightly rising continuing-claims count are consistent with a low-hire, low-fire pattern, but a single week cannot confirm it. The series is noisy by DOL’s own technical note.
エネルギー需給の現在地(EIA 週間石油状況)
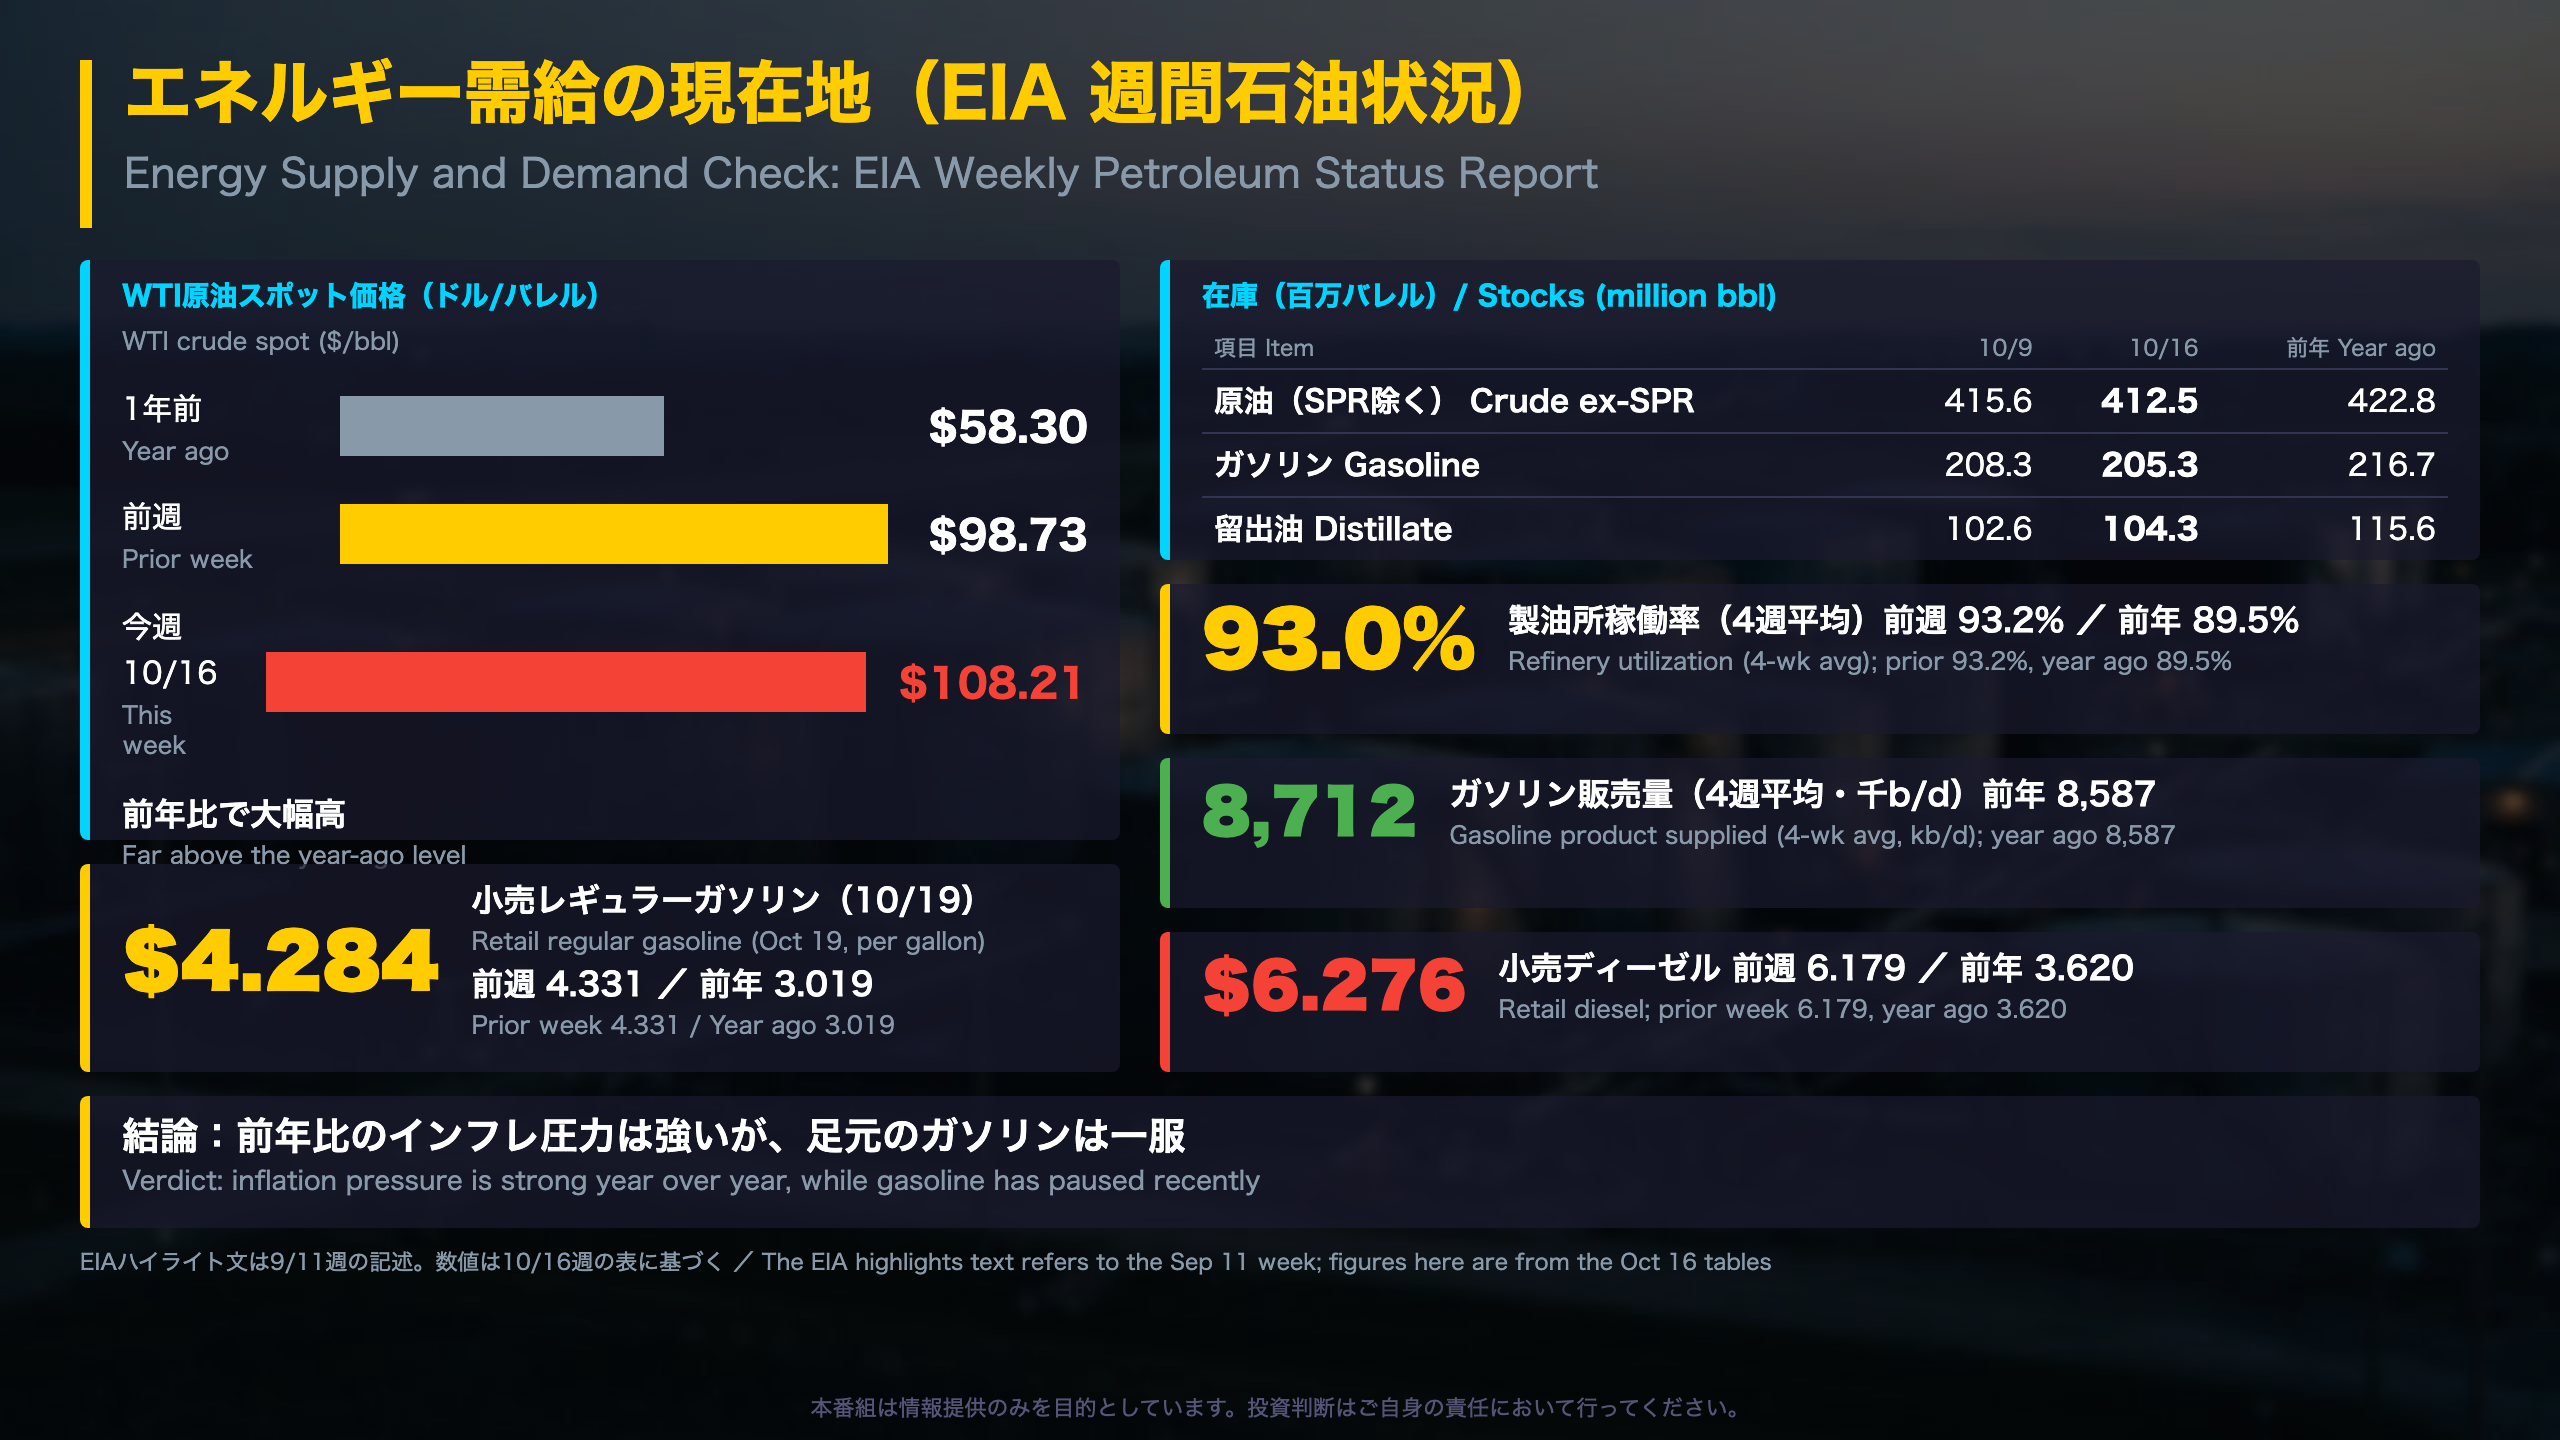
Reading EIA’s Weekly Petroleum Status Report
What it is
The US Energy Information Administration (EIA), part of the Department of Energy, publishes the Weekly Petroleum Status Report covering stocks, refinery activity, imports and implied demand (“product supplied”). It is similar in purpose to the monthly oil statistics released by Japan’s METI, but far more frequent.
Key readings (4-week figures for Oct 16 unless noted)
- WTI spot: $108.21 vs $98.73 a week earlier and $58.30 a year ago.
- Commercial crude stocks (ex-SPR): 412.5 million barrels vs 415.6 million. Gasoline 205.3 vs 208.3. Distillate 104.3 vs 102.6.
- Strategic Petroleum Reserve: 282.7 million barrels vs 408.6 million a year earlier.
- Refinery utilization: 93.0% vs 89.5% a year ago.
- Gasoline product supplied: 8.71 million b/d vs 8.59 million.
- Retail regular gasoline: $4.284 (Oct 19) vs $4.331 a week earlier and $3.019 a year ago. Retail diesel: $6.276 vs $3.620.
Data caveat
The headline text in the supplied report describes the week ending Sep 11, so this article relies on the tables dated Oct 16.
Why it matters beyond oil
Energy prices feed headline consumer price indexes quickly, and diesel costs feed freight and goods prices. The demand readings here show no sharp drop, so the price rise has not visibly choked consumption in this data. A lower strategic reserve than a year ago and falling commercial stocks leave less physical buffer. That is a description of current conditions, not a forecast, and a single week of prices should not be extrapolated.
FRB流動性の現在地(H.4.1 バランスシート)
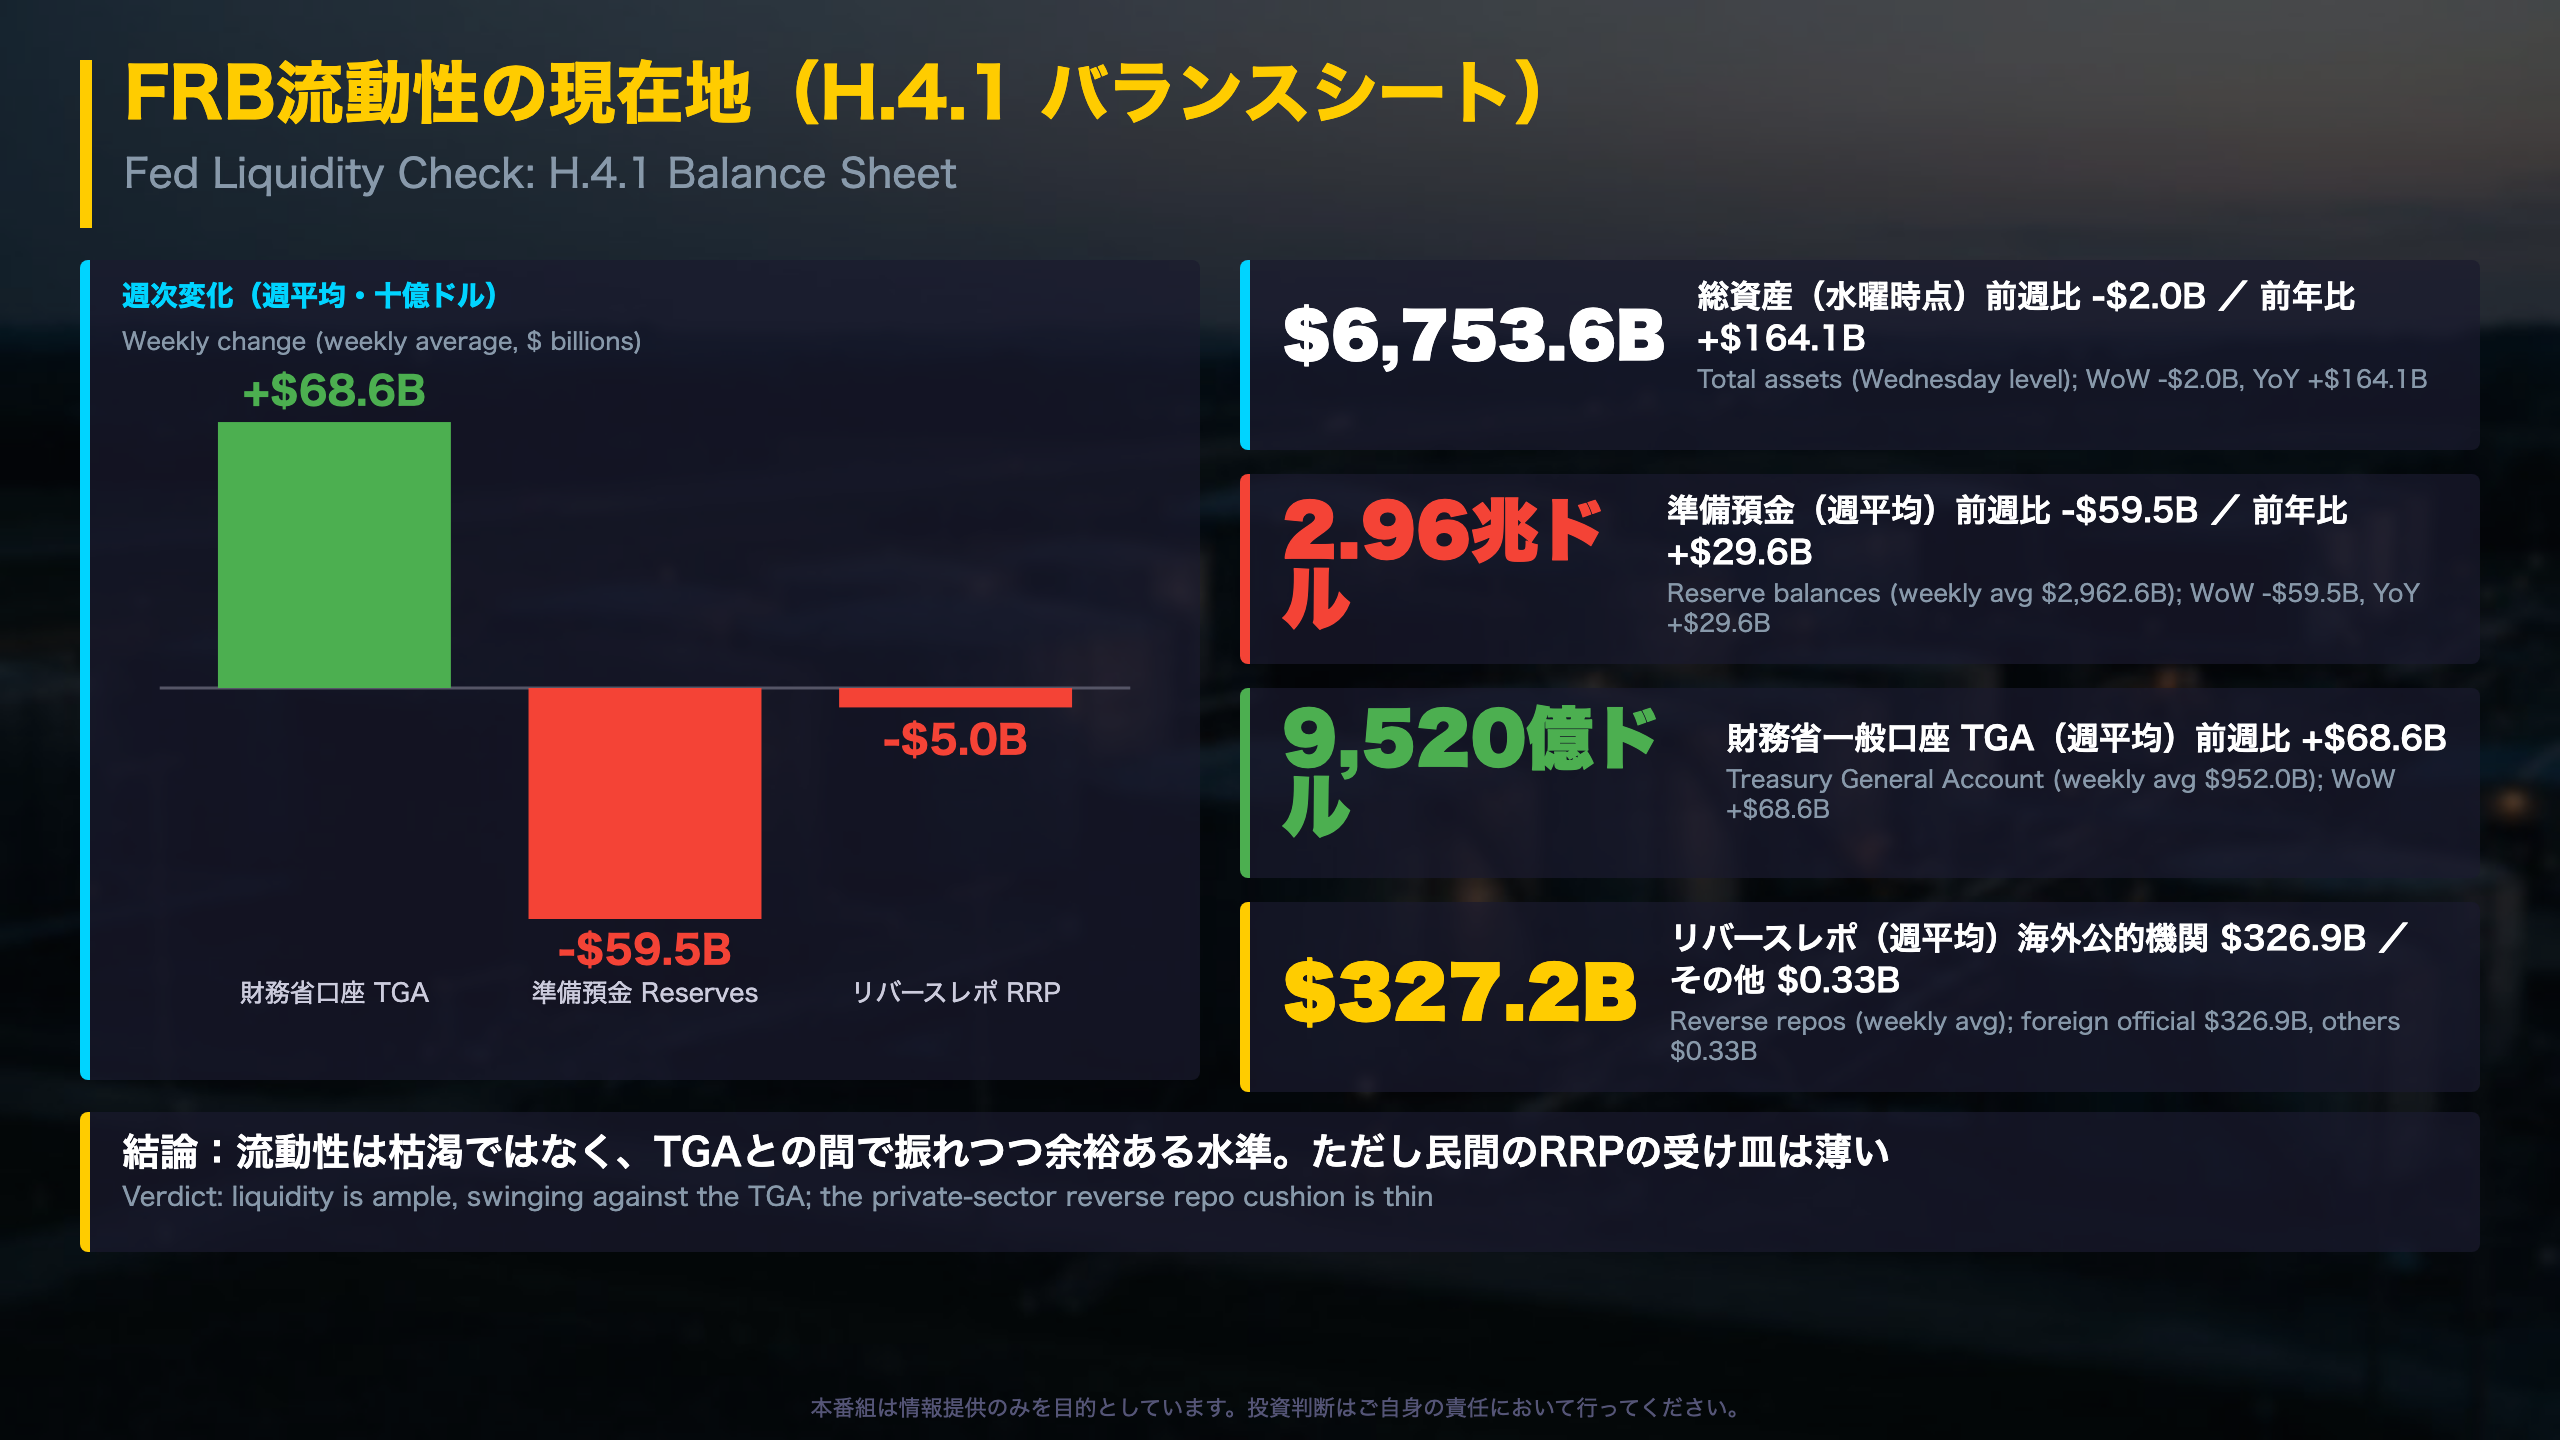
Reading the Fed’s H.4.1
What it shows
The H.4.1 is the Federal Reserve’s weekly balance sheet release, published on Thursdays at 4:30 p.m. ET. It lists what supplies reserves to banks (Fed assets) and what absorbs them (currency in circulation, the Treasury General Account, reverse repos). It is comparable to the Bank of Japan’s published current account balances, but reported weekly with full asset detail.
Key readings (week averages, $ millions, week ended Oct 21)
| Item | Level | WoW | YoY |
|---|---|---|---|
| Reserve Bank credit | 6,706,861 | -789 | +161,908 |
| Treasuries | 4,571,248 | +1,337 | +374,817 |
| MBS | 1,897,265 | -845 | -187,277 |
| Reverse repos | 327,238 | -4,953 | -21,735 |
| TGA | 952,002 | +68,629 | +44,001 |
| Reserve balances | 2,962,607 | -59,533 | +29,570 |
Composition matters
Treasury bills are up $371 billion year over year while agency MBS holdings are down $187 billion, so the asset mix has tilted toward short-dated government paper. Reverse repos of $327 billion are almost entirely foreign official accounts ($326.9 billion); other counterparties hold just $328 million.
Reading the TGA-reserves swap
The TGA is the government’s checking account at the Fed. When it rises, cash leaves bank reserves one-for-one, which is what the data show this week (+$68.6 billion versus -$59.5 billion). It is an accounting effect, not a policy signal. Reserves remain above a year ago.
Housekeeping
The release removed two Main Street Lending Program lines after the LLC wound down. This week’s report offers no commentary on policy intent, and no forecast is implied.
ストラテジスト総括:3指標の連関と来週の注目点

Connecting the Three Indicators
Direction matrix
| Area | This week’s facts | Assessment |
|---|---|---|
| Labor | Claims 194,000; 4-week average 197,750 vs 227,750 a year ago | Steady |
| Energy | WTI $108.21 vs $58.30 a year ago; gasoline demand in line with last year | Price is a drag, demand is holding |
| Liquidity | Reserves $2.96T; TGA $952B | Ample, but swinging against the TGA |
How the pieces fit
Claims and EIA data describe the real economy, while the H.4.1 describes financial plumbing. This week the real-economy side paired a firm jobs signal with a sharp oil price level, while the plumbing side showed the Treasury’s cash balance absorbing bank reserves. All three are single-week observations and none proves a structural shift.
Regime model note
Our weekly HMM keeps the backdrop in regime R0 for a fifth straight week (99.9% probability). The TGA is the most notable outlier (Z=2.52) and labor force participation is also low versus the regime centroid (Z=2.47). The model’s last observation is Oct 30, so its timing differs from the other sources.
Context for global readers
In Japan, the Bank of Japan and METI data come monthly. US weekly claims, EIA and H.4.1 give an unusually frequent read, so the right comparison is trend over several weeks, not one print. The FOMC meeting and the monthly jobs report are the larger scheduled events that will say whether this week’s pattern persists.
Two readings, same facts
The constructive reading cites low claims and reserves above a year ago. The cautious reading cites energy prices far above last year and a thin private-sector reverse repo cushion. Both rest on the data and neither is a forecast.
Disclaimer: This article is for informational purposes only. All investment decisions are made solely at your own risk.