This article was automatically generated by the NFC Market Live AI analysis system. (Updated: 2026-11-16 22:44 JST)
📄 Primary Source
NFC Market Live
https://www.newyorkfed.org/medialibrary/media/survey/empire/empire2026/2026_11_empire-state-manufacturing-survey.pdf
A deep dive into the latest NY Fed Empire State Manufacturing Survey, with the AI pulling out the sub-indexes and trend shifts that matter.
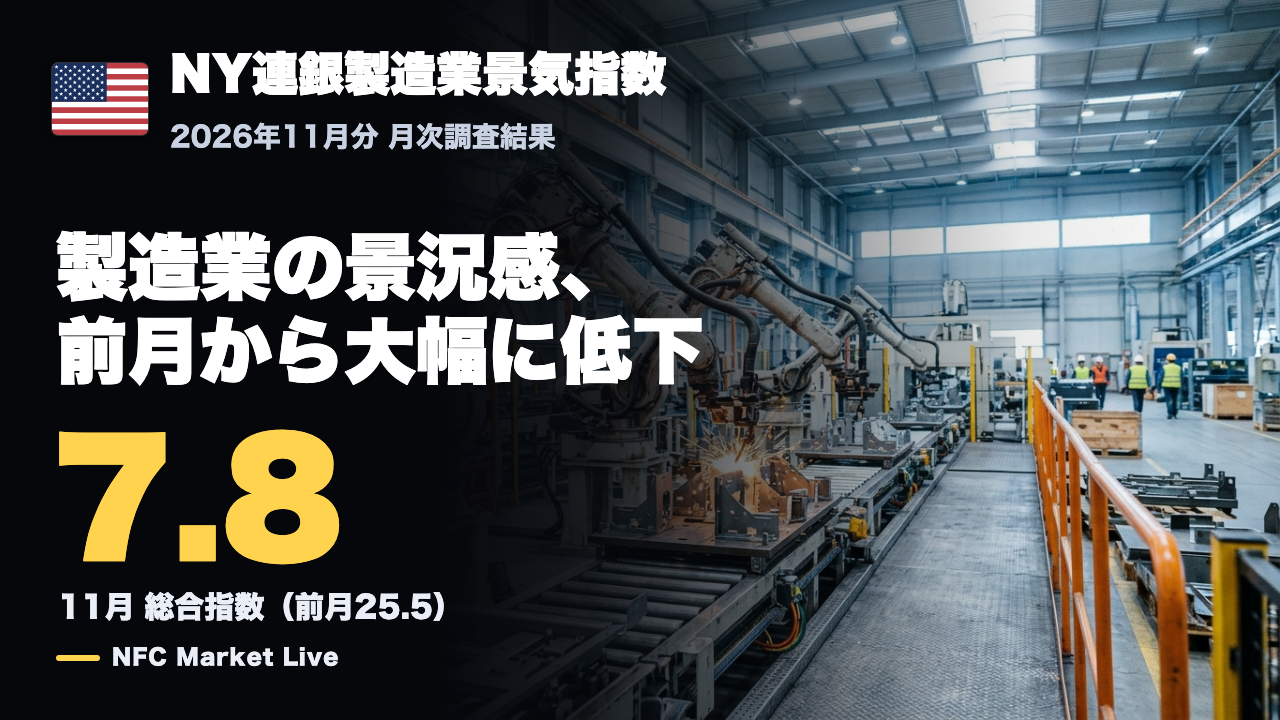
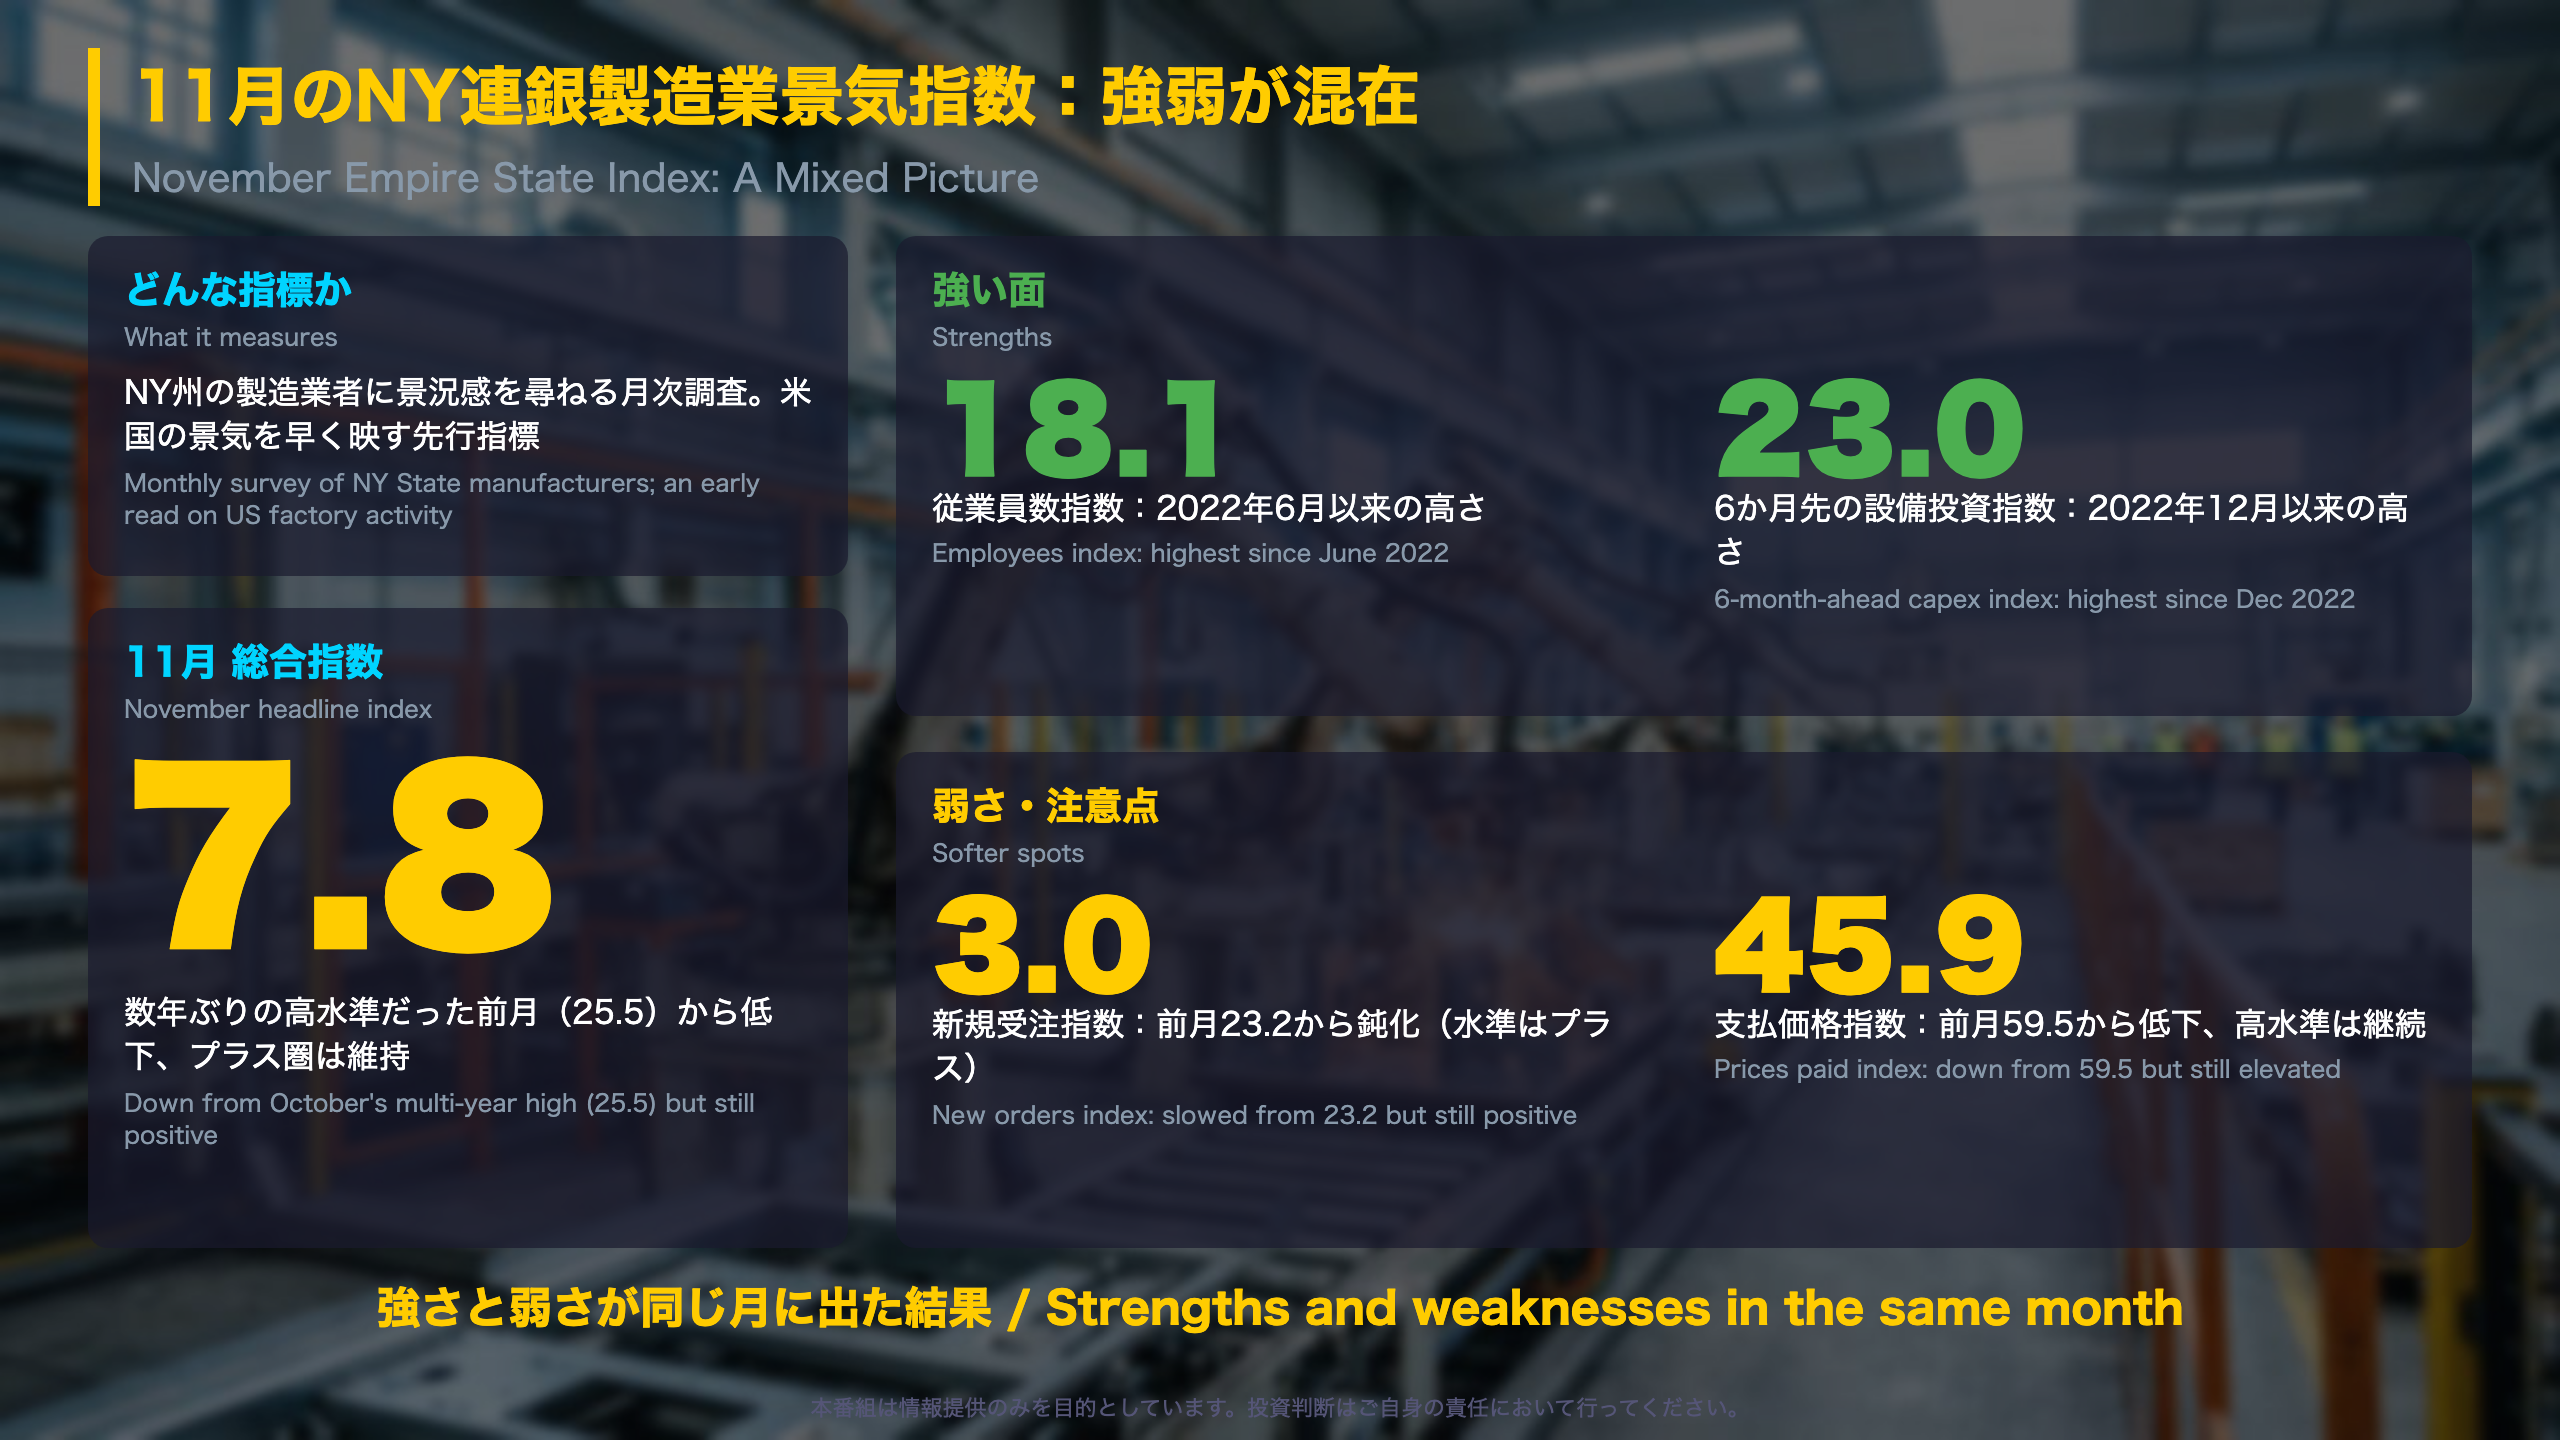
📊 The November headline index fell to 7.8 from October’s multi-year high of 25.5, but stayed positive.
📉 New orders cooled to 3.0 and shipments to 8.8.
📈 Employment rose to 18.1, the highest since June 2022, and six-month capex plans hit their highest since December 2022.
⚠️ Prices paid eased to 45.9 from 59.5 but remain elevated.
💡 A mixed month: cooling orders alongside stronger hiring and investment plans.
サマリー:総合指数は7.8に低下、強弱が混在
November Empire State Survey: The Big Picture
The Empire State Manufacturing Survey is a monthly poll of manufacturers in New York State conducted by the Federal Reserve Bank of New York. It is among the first regional Fed surveys published each month, which is why it is watched as an early read on US factory conditions, ahead of the national ISM manufacturing PMI and the Philadelphia Fed survey.
How to read the index
The headline is a diffusion index: the share of firms reporting better conditions minus the share reporting worse. In November, 31.0% reported improvement and 23.2% deterioration, giving 7.8. In October the split was 44.4% versus 18.9%, giving 25.5, which the report called a multi-year high.
What changed
- Headline: 25.5 to 7.8, still above zero
- New orders: 23.2 to 3.0
- Employment: 10.3 to 18.1, highest since June 2022
- Six-month-ahead capex: 14.0 to 23.0, highest since December 2022
Richard Deitz of the New York Fed summarized it as manufacturing activity growing modestly after strong growth in October.
Balanced reading
The positive case: the index stayed positive and hiring and investment plans improved. The cautious case: orders growth slowed sharply, and one month cannot tell us whether October was an outlier or momentum is genuinely fading.
Context for global investors
This is a regional survey, not a national statistic, and it is volatile month to month. It gives no direct reading on Fed policy; it is one input to be weighed alongside other data. Next up is the December survey.
深掘り1:受注の鈍化が総合指数を押し下げたか
Orders: Where the Headline Drop Came From
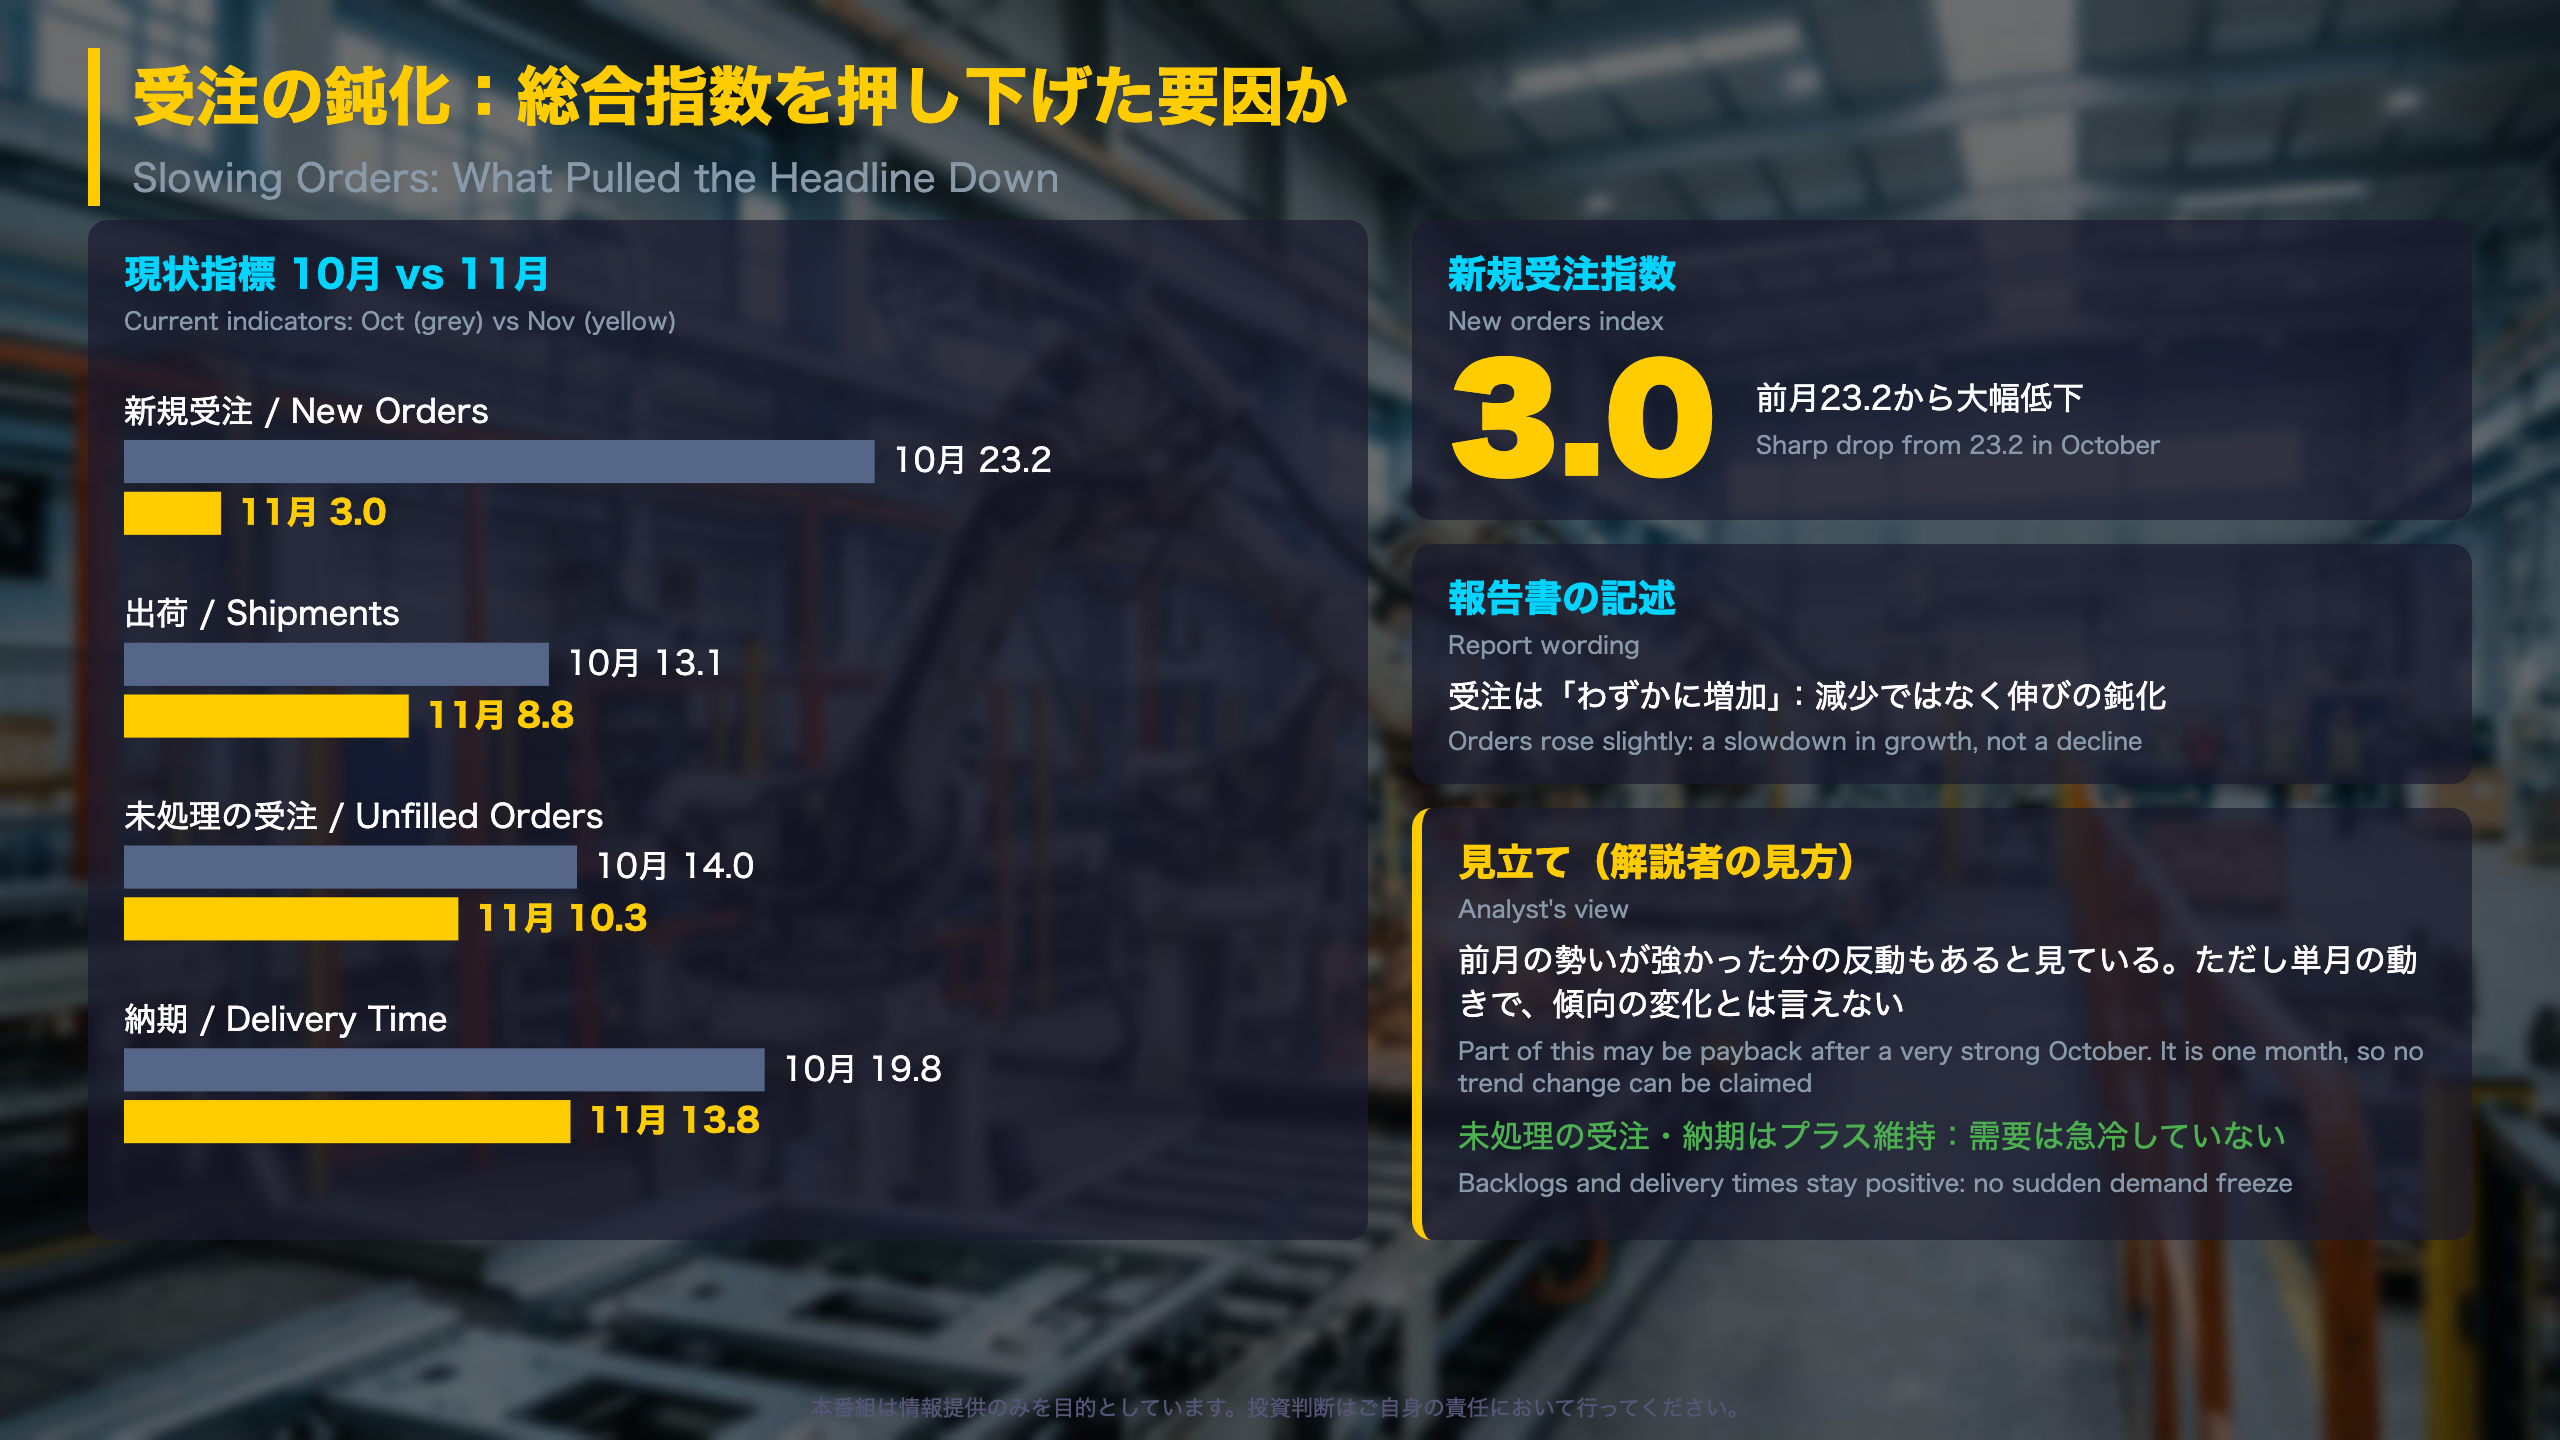
The single biggest contributor to the November decline in the headline index was new orders, which fell from 23.2 to 3.0, a 20.2-point drop. The Empire State survey is a diffusion index, so 3.0 means that slightly more firms reported higher orders than lower ones.
The distribution
- Firms reporting higher orders: 42.9% to 28.3%
- Firms reporting lower orders: 19.7% to 25.2%
The report itself describes a ‘slight increase in orders’, so this is a deceleration, not a contraction.
Other current indicators (Oct to Nov)
| Indicator | Oct | Nov |
|---|---|---|
| Shipments | 13.1 | 8.8 |
| Unfilled orders | 14.0 | 10.3 |
| Delivery times | 19.8 | 13.8 |
| Inventories | 11.6 | 9.2 |
| Supply availability | -15.1 | -9.2 |
All eased, but unfilled orders and delivery times remain positive, meaning backlogs are still growing and lead times still lengthening. Supply availability stayed negative but improved.
Looking ahead
Six-month-ahead new orders rose to 24.5 from 22.4, while expected unfilled orders dropped to 2.3 from 14.0.
Two readings
Mean reversion: October was a multi-year high and some payback is natural. Genuine cooling: orders, shipments and backlogs all fell together. One survey month cannot settle this. Compared with the Philadelphia Fed and ISM readings, which investors usually cross-check, the Empire survey covers only New York State and is noisy. The December survey is the next test.
深掘り2:雇用と設備投資計画は強まった
Labor Market and Investment Plans in Detail
Employment
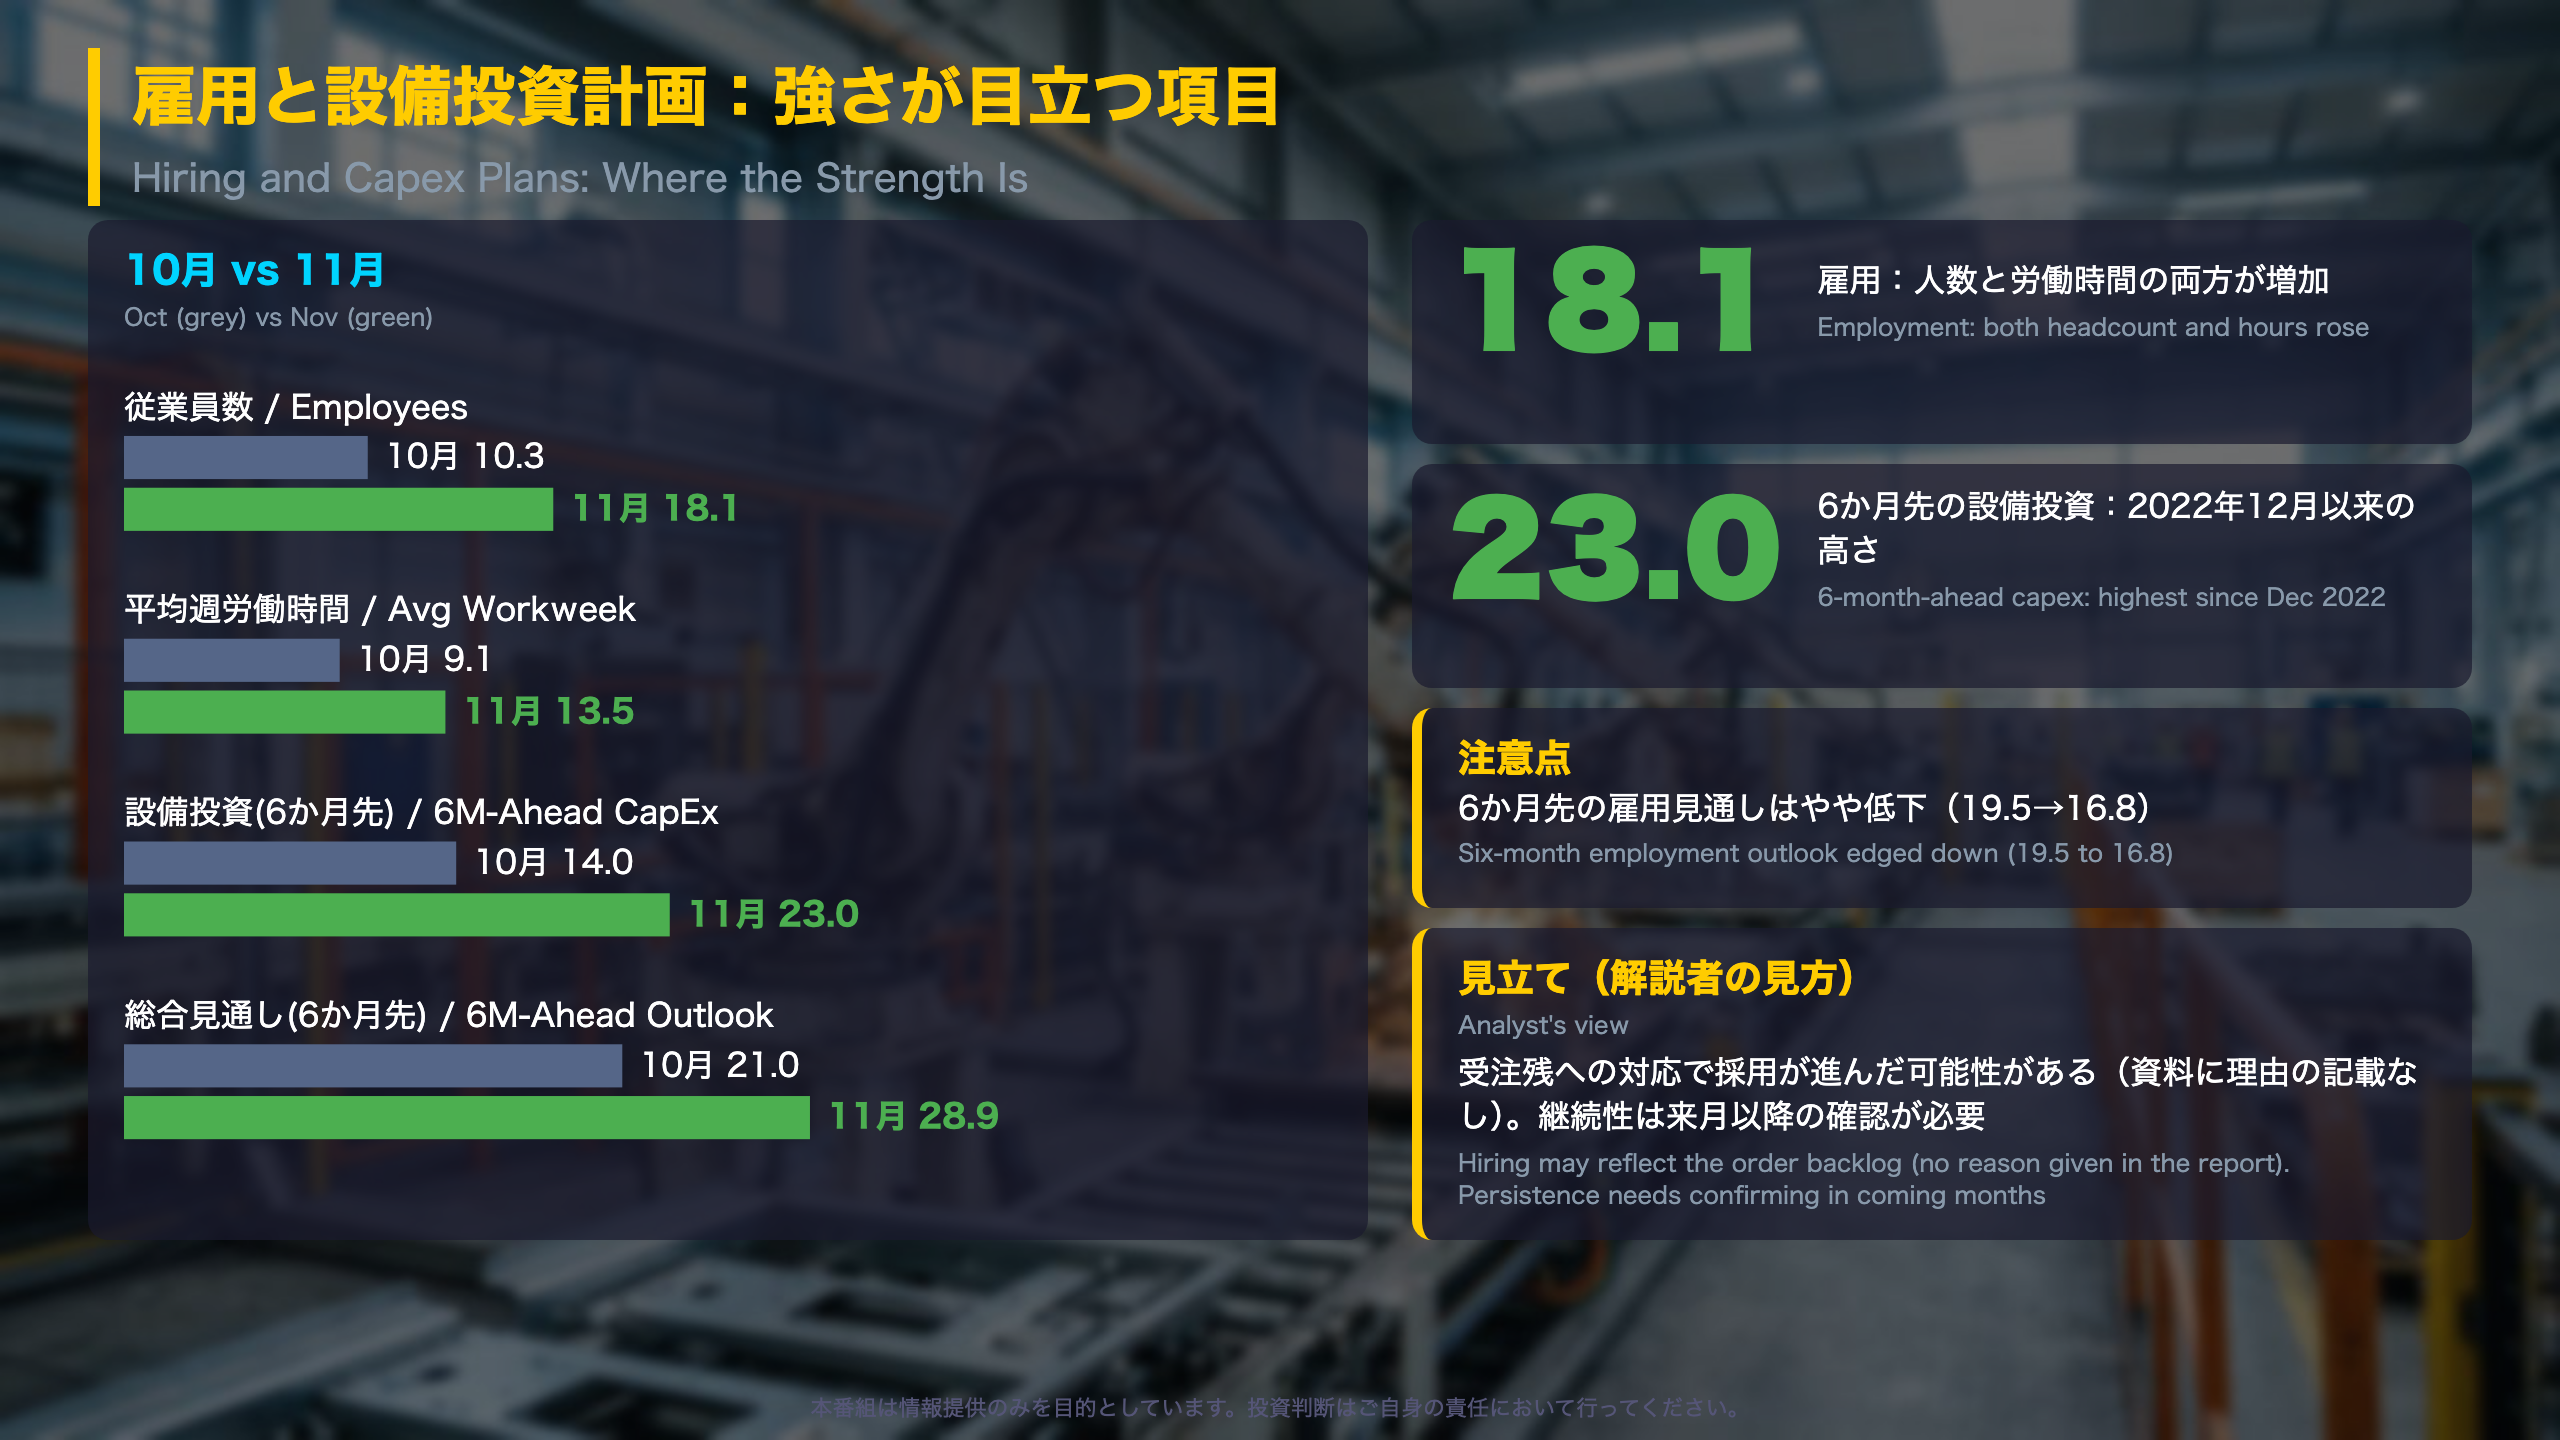
The employees index climbed from 10.3 to 18.1, the highest since June 2022. Looking under the hood, the share of firms reporting more staff edged up from 20.0% to 21.5%, while those reporting fewer staff fell from 9.8% to 3.4%. In other words, fewer layoffs, rather than much broader hiring, did most of the work. The average workweek index rose from 9.1 to 13.5.
Six-month expectations
| Indicator | Oct | Nov |
|---|---|---|
| General business conditions | 21.0 | 28.9 |
| Capital expenditures | 14.0 | 23.0 |
| Employment | 19.5 | 16.8 |
| Average workweek | -3.5 | 0.0 |
| Supply availability | -11.6 | -3.4 |
The New York Fed noted that the capex index rose nine points to its highest level since December 2022, and 47.1% of firms expect better conditions versus 18.2% expecting worse.
Two readings
Constructive: current hiring, investment plans and outlook are all improving together. Cautious: expected employment slipped and expected shipments were flat, so there is no guarantee the strength in current hiring persists.
The report does not explain why hiring rose while orders cooled. Our suggestion that firms may be staffing up for the order backlog is an interpretation, supported only by unfilled orders staying positive at 10.3.
Context
For readers used to US payrolls, remember this is a New York State manufacturing sample, not national employment data. The December survey will show whether the hiring strength holds.
質疑で深める:強弱混在と物価、次の注目点
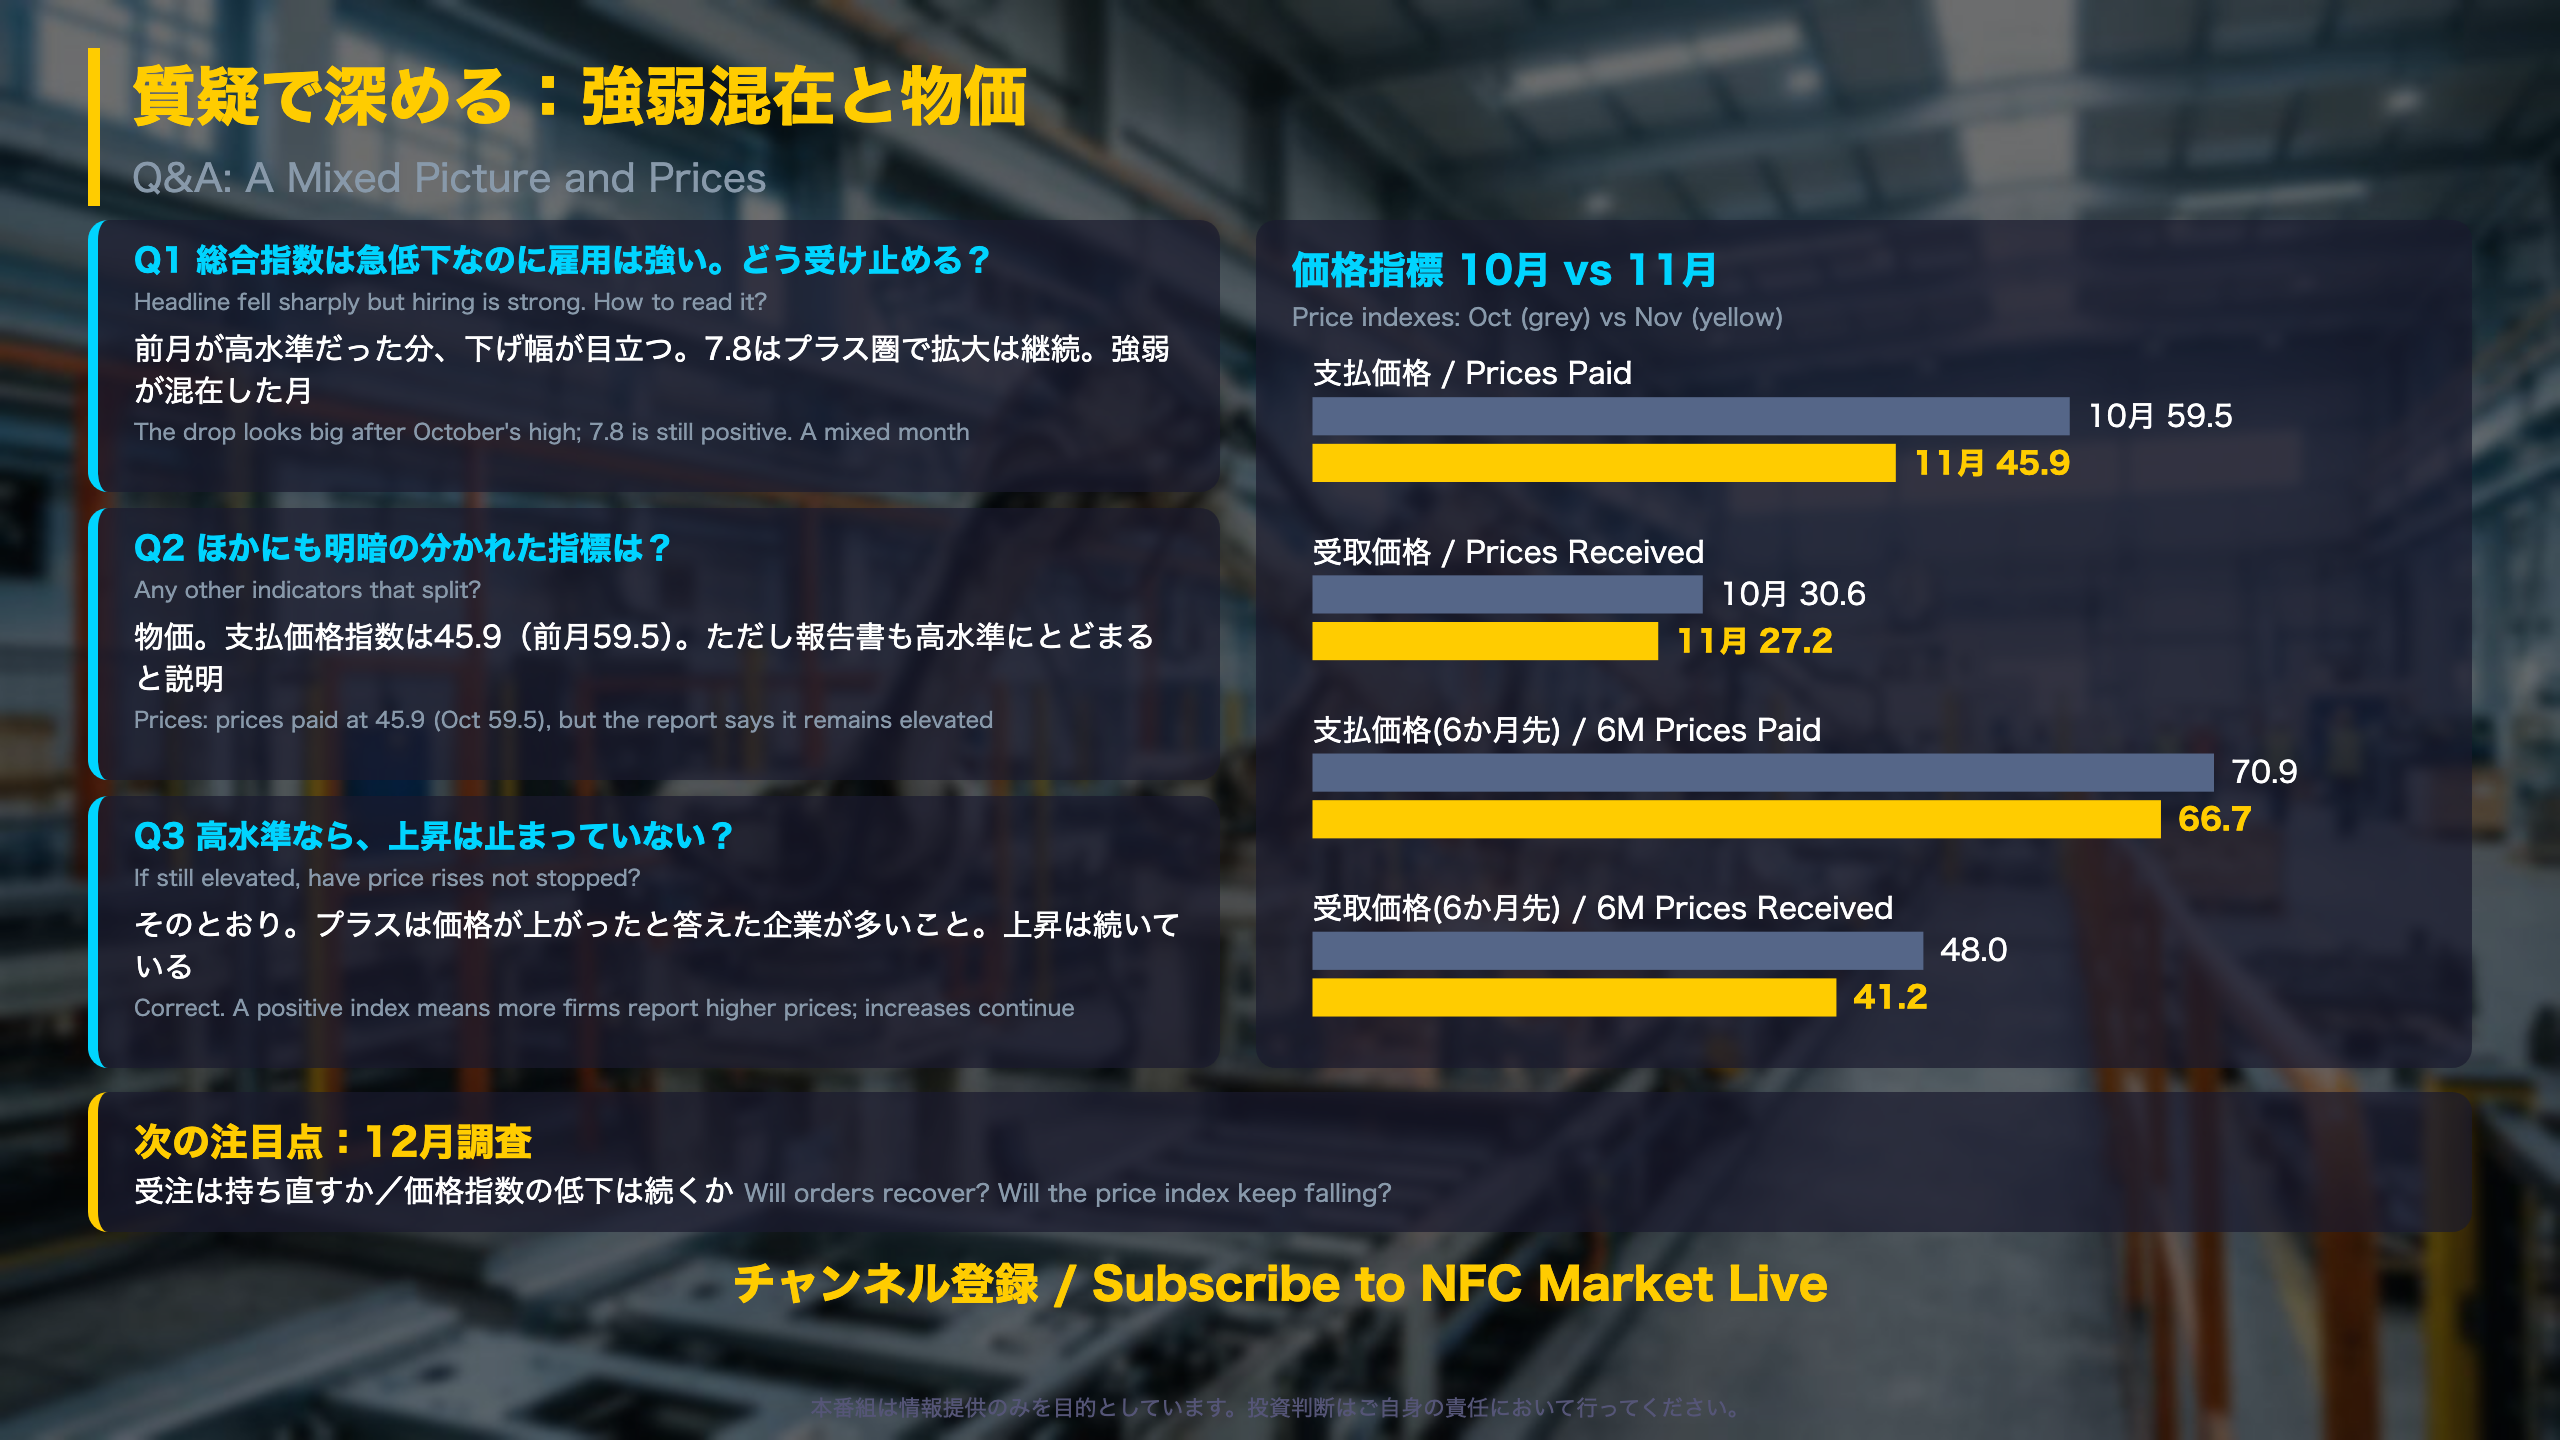
Prices, Supply and What to Watch Next
Price gauges (Oct to Nov)
| Indicator | Oct | Nov |
|---|---|---|
| Prices paid (current) | 59.5 | 45.9 |
| Prices received (current) | 30.6 | 27.2 |
| Prices paid (6M ahead) | 70.9 | 66.7 |
| Prices received (6M ahead) | 48.0 | 41.2 |
The share of firms reporting higher input prices fell from 60.5% to 45.9%, and none reported lower prices in November. The New York Fed described a significant moderation in input price increases, yet the pace of increases remained elevated.
Supply availability
The index improved from -15.1 to -9.2 but stayed negative, which the report reads as worsening availability, though less so than in recent months. Expected availability six months ahead rose to -3.4 from -11.6.
Two readings
Calmer: prices paid dropped nearly 14 points and the forward price indexes also eased. Cautious: levels remain high, and the six-month prices paid index of 66.7 still shows broad expectations of rising costs.
Context for global investors
A diffusion index above zero means more firms report increases than decreases. So 45.9 still signals rising input costs, just at a slower pace. This is a single regional survey, and the source material draws no conclusion about inflation or Fed policy; it is one data point to be weighed with others such as CPI and the national PMIs.
Next
The December survey will show whether orders recover, whether the price indexes keep easing, and whether hiring stays strong.
Disclaimer: This article is for informational purposes only. All investment decisions are made solely at your own risk.