This article was automatically generated by the NFC Market Live AI analysis system. (Updated: 2026-11-17 16:07 JST)
📄 Primary Source
Office for National Statistics
https://www.ons.gov.uk/employmentandlabourmarket/peopleinwork/employmentandemployeetypes/bulletins/uklabourmarket/latest
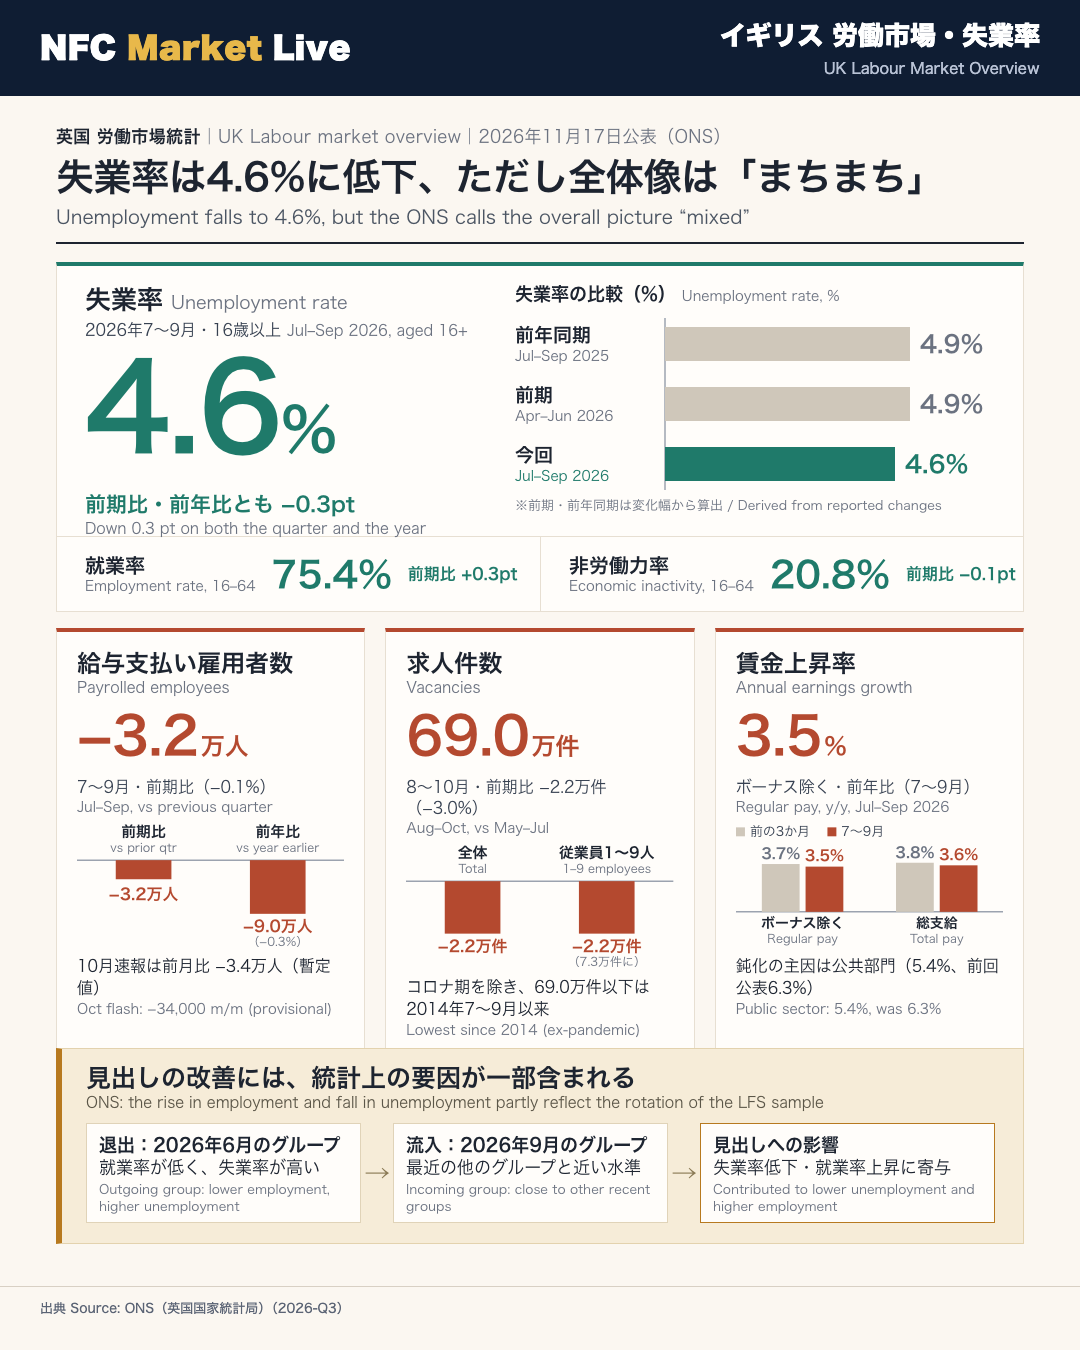
📊 The ONS published its UK labour market overview on 17 November 2026, calling the latest figures a mixed picture.
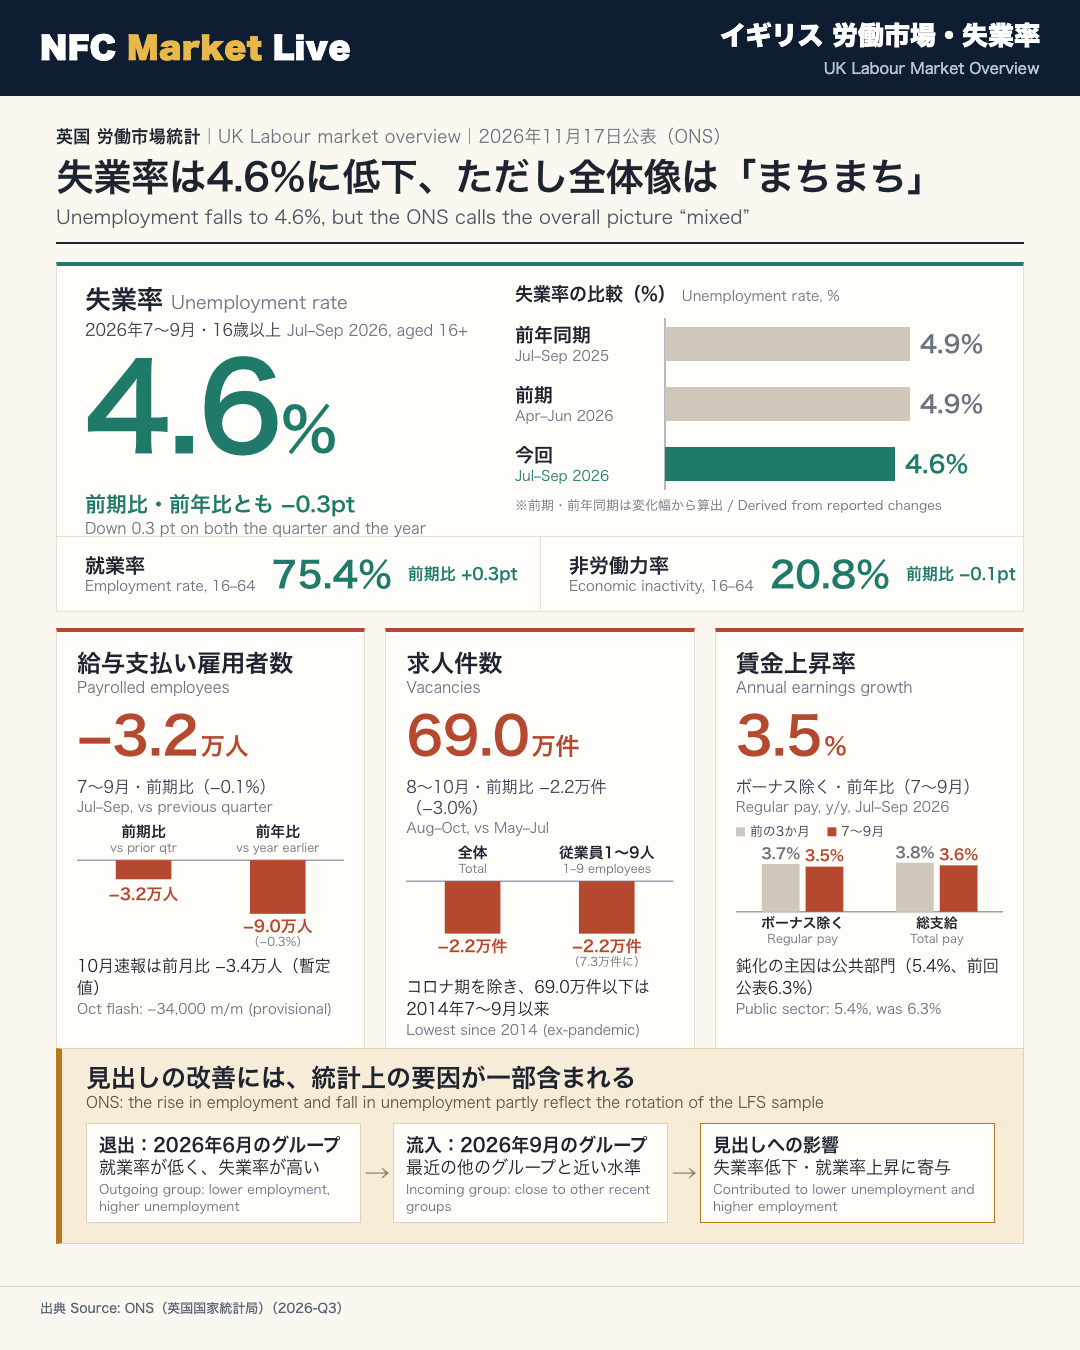
In the Labour Force Survey for July to September 2026, the unemployment rate was 4.6%, down 0.3 percentage points on both the quarter and the year. The employment rate was 75.4% and the inactivity rate 20.8%. The ONS says these moves partly reflect LFS sample rotation: the group leaving the survey had lower employment and higher unemployment than the group entering.
📉 HMRC payrolled employees fell by 32,000 on the quarter, and the provisional October estimate fell by 34,000 on the month to 30.2 million. Vacancies fell by 22,000 (3.0%) to 690,000 in August to October. Businesses with 1 to 9 employees saw vacancies drop by 22,000 to 73,000. The Claimant Count rose to 1.714 million in October.
💷 Regular pay growth slowed to 3.5% from 3.7%, and total pay growth to 3.6%. Public sector regular pay growth was 5.4% and private sector 3.1%, as the effect of pay award timing starts to fall away.
The next release is on 15 December 2026.
サマリー:失業率4.6%に低下、ただし「まちまちな姿」
What happened
The Office for National Statistics (ONS), the UK’s national statistics agency, published its monthly labour market overview on 17 November 2026. Its own summary: “The latest figures provide a mixed picture overall.”
Headline Labour Force Survey (LFS) numbers, July to September 2026
- Unemployment rate (16+): 4.6%, down 0.3 percentage points on both the quarter and the year
- Employment rate (16-64): 75.4%, up 0.3 points on the quarter and 0.4 points on the year
- Economic inactivity rate (16-64): 20.8%, down 0.1 point on both
The softer side
- HMRC payrolled employees fell by 32,000 (0.1%) on the quarter. The October flash estimate shows a 34,000 monthly fall to 30.2 million, and it is provisional.
- Vacancies: 690,000 in August to October, down 22,000 (3.0%) on the quarter.
- The Claimant Count, which counts people receiving unemployment-related benefits, rose to 1.714 million in October.
- Regular pay growth slowed to 3.5% from 3.7%, and total pay growth to 3.6%.
Why the headline needs care
The ONS says the LFS employment and unemployment moves partly reflect sample rotation. The group completing its final quarter in the survey had lower employment and higher unemployment than the group entering. The agency adds that the new group looks similar to other recent groups, so the move reflects the outgoing group more than an unusually strong incoming one.
Context for non-UK readers
The LFS is a household survey, while payrolled employees come from HMRC tax records covering the whole population. The two measure different things, which is why the ONS recommends reading them together with vacancies and the Claimant Count. The bulletin does not discuss Bank of England policy, so this note stays with the data.
Next release: 15 December 2026.
失業率低下の背景:LFS標本入れ替えの影響
The key caveat: sample rotation in the LFS
The Labour Force Survey (LFS) showed an employment rate of 75.4% and an unemployment rate of 4.6% for July to September 2026. The ONS states that these quarterly moves partly reflect the rotation of the survey sample.
How rotation works
The LFS is a household survey that follows the same addresses over five consecutive quarters. The group completing its fifth and final quarter (June 2026) had lower employment and higher unemployment than both the new group entering (September 2026) and other recent groups. When it left and was replaced, this contributed to the rise in the headline employment rate and the fall in the unemployment rate.
The ONS adds that the incoming group is “more closely aligned with other recent groups”, suggesting the latest movement partly reflects the outgoing group rather than an unusually strong incoming one.
Other data-quality notes
- The LFS dataset was 80,271 individuals, 1.1% smaller than in April to June. Response rates recovered after an operational issue earlier in 2026, but a second-wave effect from imputation rules slightly reduced dataset size.
- The ONS advises caution with short-term changes and granular breakdowns, and says users should focus on longer-term movements.
- A reweighting of LFS data back to 2011 using updated population estimates is under way, with the first revised estimates expected by March 2027.
Two readings
- Constructive: employment is up 0.4 points on the year and inactivity is down 0.1 point, so several measures point the same way.
- Cautious: payrolled employees are down 0.3% on the year over the same period. The two sources are not directly comparable, because the LFS employment rate includes the self-employed while payrolled employees come from HMRC administrative data.
The ONS recommends reading the LFS alongside payrolls, the Claimant Count and vacancies.
給与支払い雇用者数と求人:小規模企業で採用が減少
Payrolls: volatile monthly, lower on the year
Payrolled employees, drawn from HMRC’s PAYE Real Time Information system and covering the whole population, rose by 20,000 (0.1%) between August and September 2026. The flash estimate in the previous release was +13,000, so September was revised up. Over July to September, payrolls were down 32,000 (0.1%) on the quarter and 90,000 (0.3%) on the year. The October flash estimate shows a 34,000 (0.1%) monthly fall to 30.2 million, and it is provisional.
The annual decline, as published each month, was 111,000 for August, 67,000 for September and 95,000 for the October flash. This shows how much the series moves from one release to the next.
Vacancies: the smallest firms drive the fall
Vacancies were 690,000 in August to October, down 22,000 (3.0%) on the quarter and 37,000 (5.0%) on the year. The quarterly fall is the largest since May to July 2025 (33,000). Outside the pandemic, vacancies were last at or below 690,000 in July to September 2014 (686,000).
- Vacancies fell in 11 of 18 industry sectors. Administrative and support services, construction, and transport and storage each fell by 5,000.
- Three of five size bands fell. The largest drop was among businesses with 1 to 9 employees, down 22,000 to 73,000, the lowest for that band outside the pandemic since April to June 2012.
The fall in the smallest firms (22,000) equals the total net fall (22,000), so movements in other size bands offset one another. The ONS Vacancy Survey suggests smaller firms “may not be recruiting because of labour costs and other economic conditions”. The previous release cited labour costs only.
Two readings
- Resilience: the September monthly payroll change was positive, and LFS inactivity fell.
- Softness: vacancies are at a level last seen in 2014 (excluding the pandemic), and the Claimant Count rose to 1.714 million.
The ONS explanation goes no further than costs and economic conditions for small firms.
賃金:公共部門の伸びが低下し、実質賃金の伸びは縮小
Pay growth slows
Annual growth in average regular earnings (excluding bonuses) was 3.5% in July to September 2026, down from 3.7% in the previous three-month period. Total pay growth (including bonuses) was 3.6%, down from 3.8%, and the lowest since August to October 2020 (2.8%). The previous release had shown total pay growth of 3.7% for June to August.
Public versus private sector
| Sector (regular pay) | This release (Jul-Sep) | Previous release (Jun-Aug) |
|---|---|---|
| Public | 5.4% | 6.3% |
| Private | 3.1% | 3.0% |
The ONS says the slowdown is driven by public sector pay growth, as the effect of pay award timing starts to drop out of the numbers: “this base effect is reducing”. Private sector growth edged up, so the data do not show a sudden private-sector slowdown.
Real pay
- Adjusted with CPIH (CPI including owner occupiers’ housing costs): 0.2% for regular pay, 0.3% for total pay
- Adjusted with CPI: 0.4% for regular pay, 0.6% for total pay
The previous release showed 0.6% and 0.7% on CPIH, and 0.8% and 0.9% on CPI. Real pay growth remains positive but has narrowed.
Reading it both ways
- Positive: real wages stay in positive territory and private sector pay growth is steady.
- Negative: nominal growth has slowed, and inflation-adjusted growth is smaller than a month ago.
Context for international readers
Average weekly earnings (AWE) come from a business survey covering Great Britain and also reflect changes in workforce composition. More high-paid jobs would push up the growth rate. Public sector pay awards in the UK are settled on an annual cycle, so their timing can distort year-on-year comparisons for several months.
次回に向けた確認点と統計上の注意
What to check next
The next release is on 15 December 2026. Based on the ONS bulletin, these are the items to follow.
1. Does the rotation effect persist?
The ONS says the rise in employment and fall in unemployment partly reflect sample rotation. The incoming group is described as similar to other recent groups, so the next LFS readings will show where the survey settles after the outgoing group has left. The ONS advises users to focus on longer-term movements rather than single quarters.
2. Revision to the October flash estimate
October payrolled employees fell by 34,000 on the month to 30.2 million, on a provisional basis. The September flash estimate was revised from +13,000 to +20,000, and the ONS notes that flash figures are likely to be revised when more data arrive.
3. Claimant Count revisions
The October figure of 1.714 million is provisional (the previous release showed 1.701 million for September). The ONS notes that revisions in recent months have tended to be downward.
4. Scheduled methodological changes
- Workforce jobs revisions are still planned for the December 2026 release. The main planned adjustment, benchmarking private sector employee jobs to the Business Register and Employment Survey (BRES), is no longer planned because BRES results were postponed for further quality assurance.
- The outcome of the seasonal adjustment review has not been implemented, and December will stay on the current basis.
- The first revised LFS estimates, from a reweighting exercise back to 2011, are expected by March 2027.
5. Pay: public versus private
Public sector regular pay growth was 5.4% and private sector 3.1%. How this gap evolves as the base effect from pay award timing fades is the pay item to watch.
Note
The ONS recommends using the LFS alongside payrolls, the Claimant Count and vacancies. This note summarises the bulletin and does not offer forecasts or policy judgements.
Disclaimer: This article is for informational purposes only. All investment decisions are made solely at your own risk.