📺 Watch the Full Video Analysis
This article was automatically generated by the NFC Market Live AI analysis system. (Updated: 2026-07-22 22:46 JST)
📄 Primary Source
Office for National Statistics
https://www.ons.gov.uk/economy/inflationandpriceindices/bulletins/consumerpriceinflation/june2026
📊 UK headline CPI eased from 2.8% to 2.6% in June, tying its lowest level since December 2024.
⚠️ But dig into the details and core CPI held flat at 2.6% for a third straight month, with services inflation stuck at an elevated 3.6%.
📉 The slowdown was driven almost entirely by a temporary drop in transport and fuel prices, while housing cost contributions turned upward for the first time in 16 months.
💡 Is the market getting ahead of itself on BoE rate cuts? We break down what this means for GBP and UK gilts.
The Ultimate Summary:鈍化ヘッドラインの裏に潜む”コアの膠着”
Headline vs. Underlying Reality
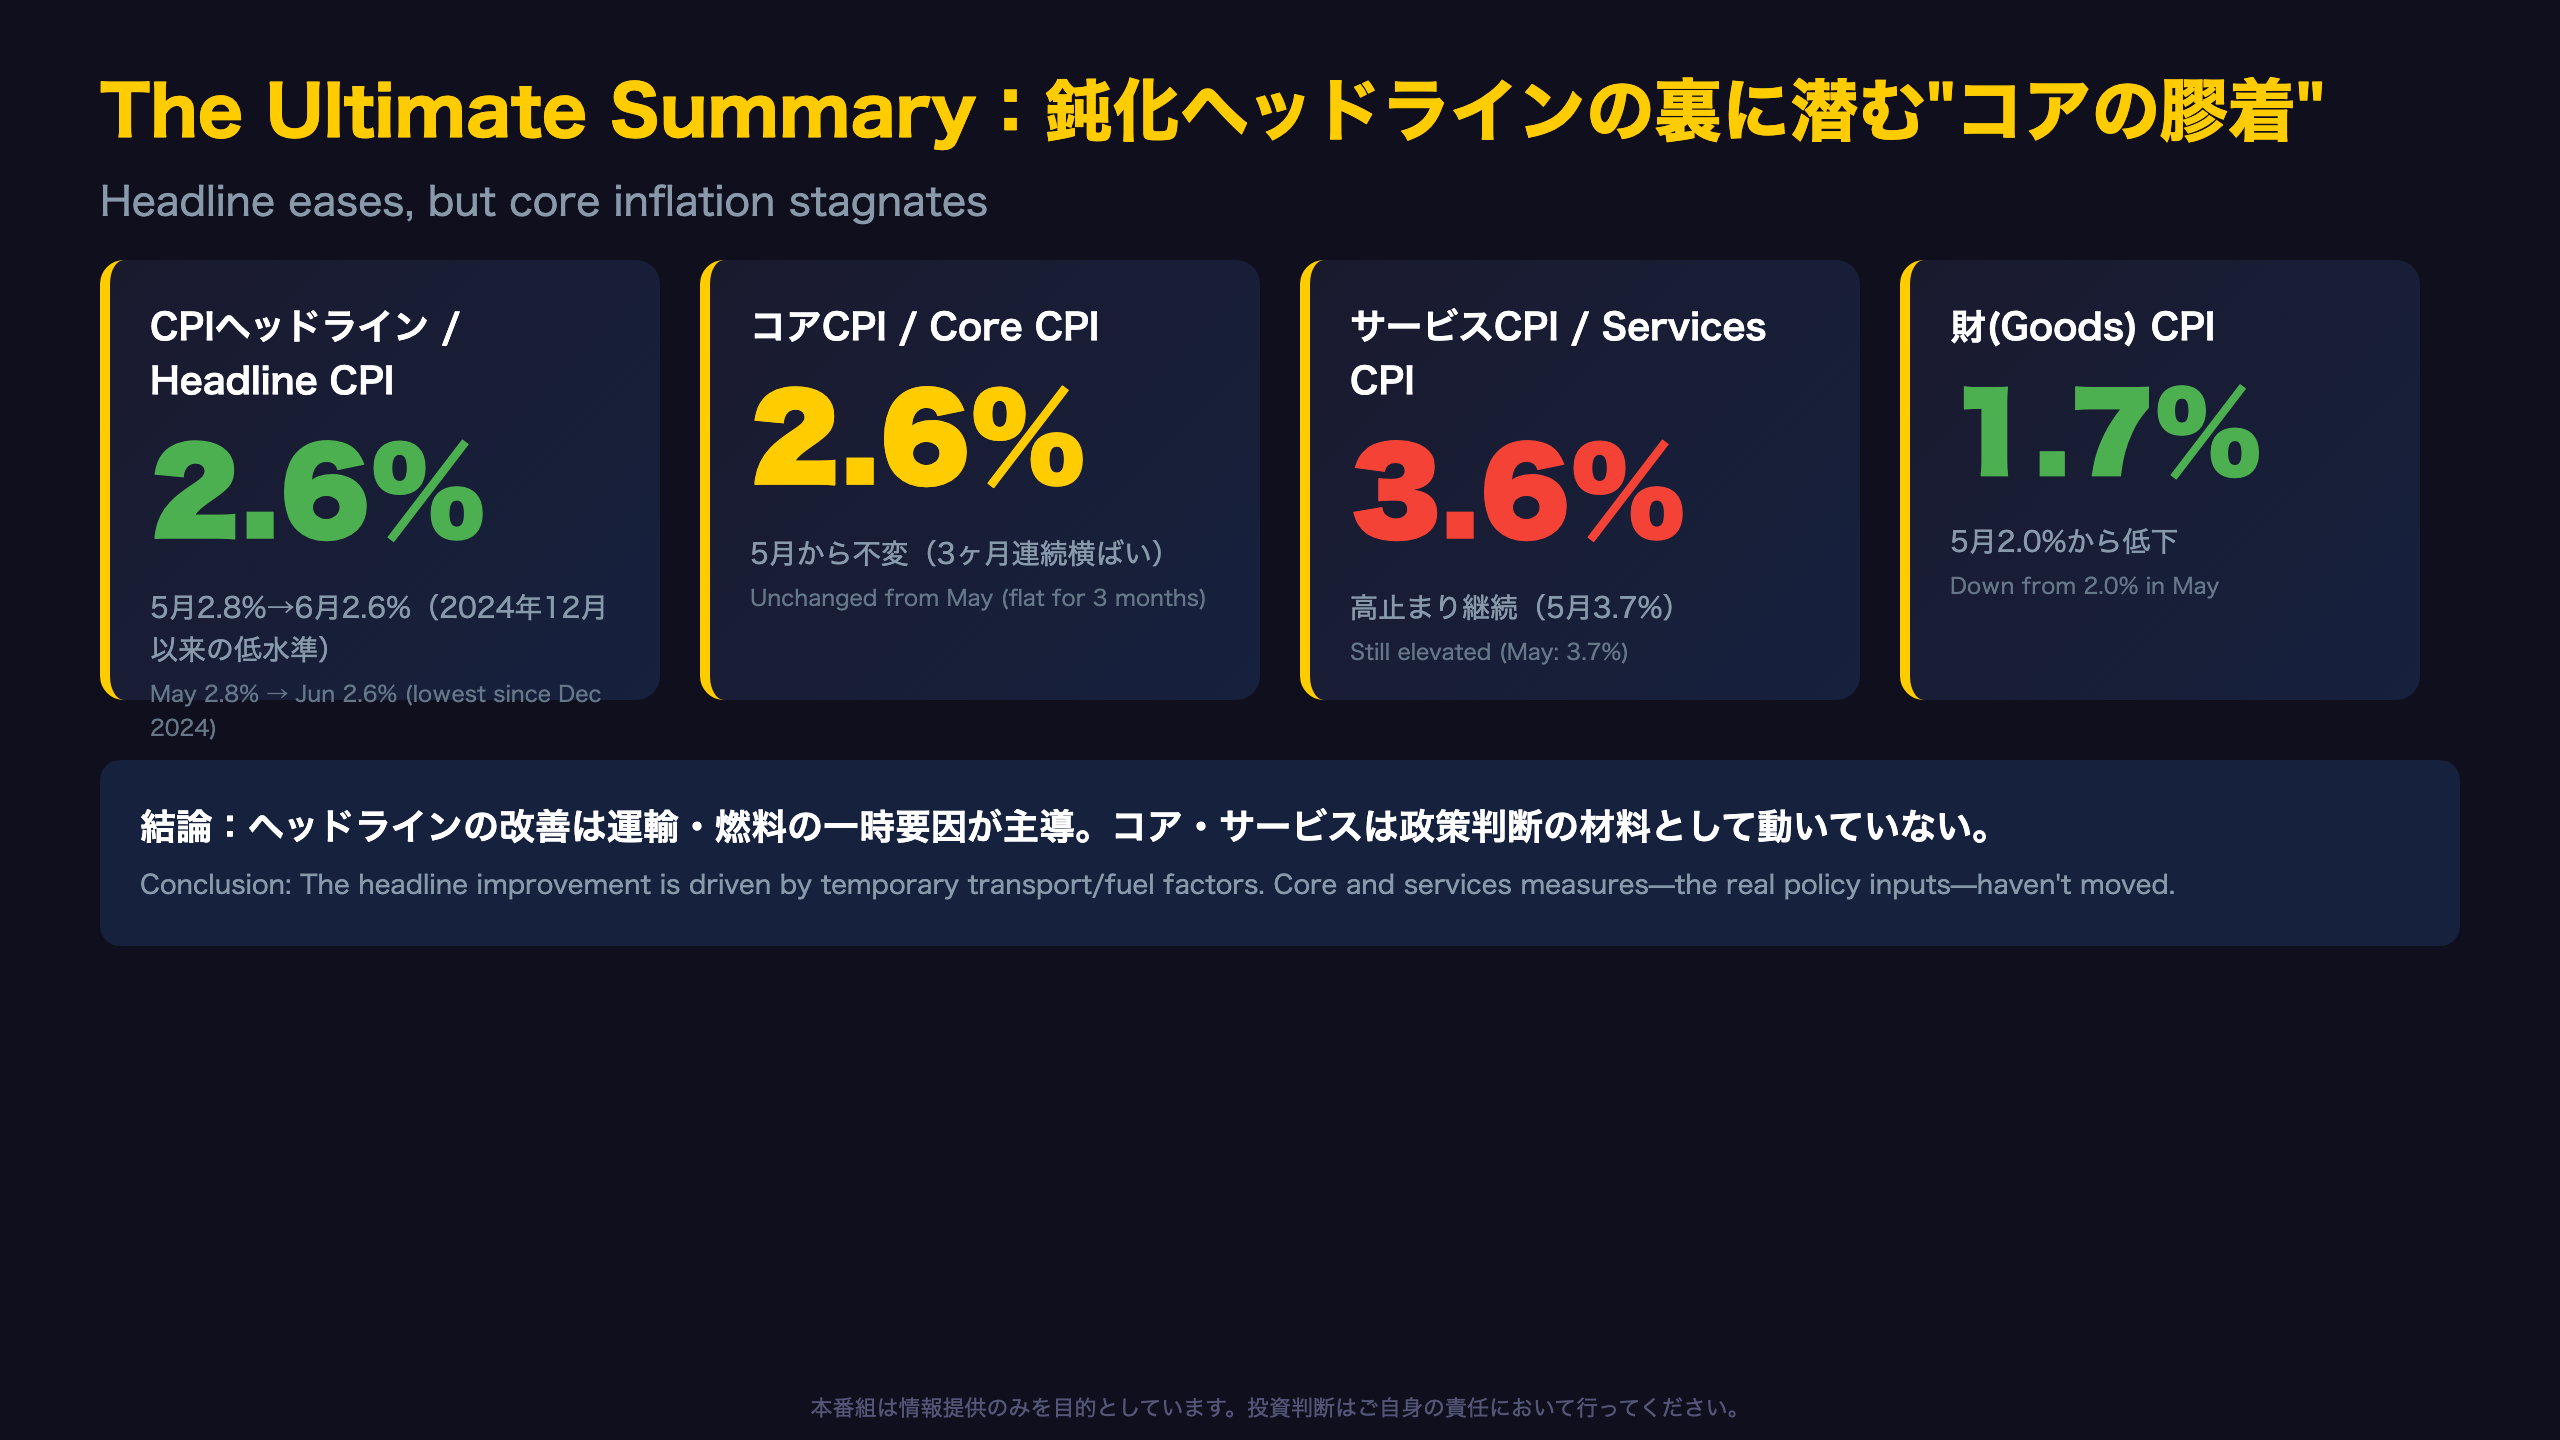
UK CPI reads several things at once: the headline rate eased to +2.6% y/y in June (from +2.8% in May), and CPIH slowed to +2.8% (from +3.0%). Monthly CPI rose just +0.1%, versus +0.3% a year earlier.
For readers unfamiliar with UK terminology: CPIH (Consumer Prices Index including owner occupiers’ housing costs) is the ONS’s preferred headline measure because it captures housing costs for homeowners; CPI excludes those costs but is the measure the Bank of England actually targets at 2%, following the EU’s harmonised HICP methodology for international comparability.
“Transport, and food and non-alcoholic beverages made the largest downward contributions to the monthly change in both CPIH and CPI annual rates,” the ONS noted.
What the headline obscures
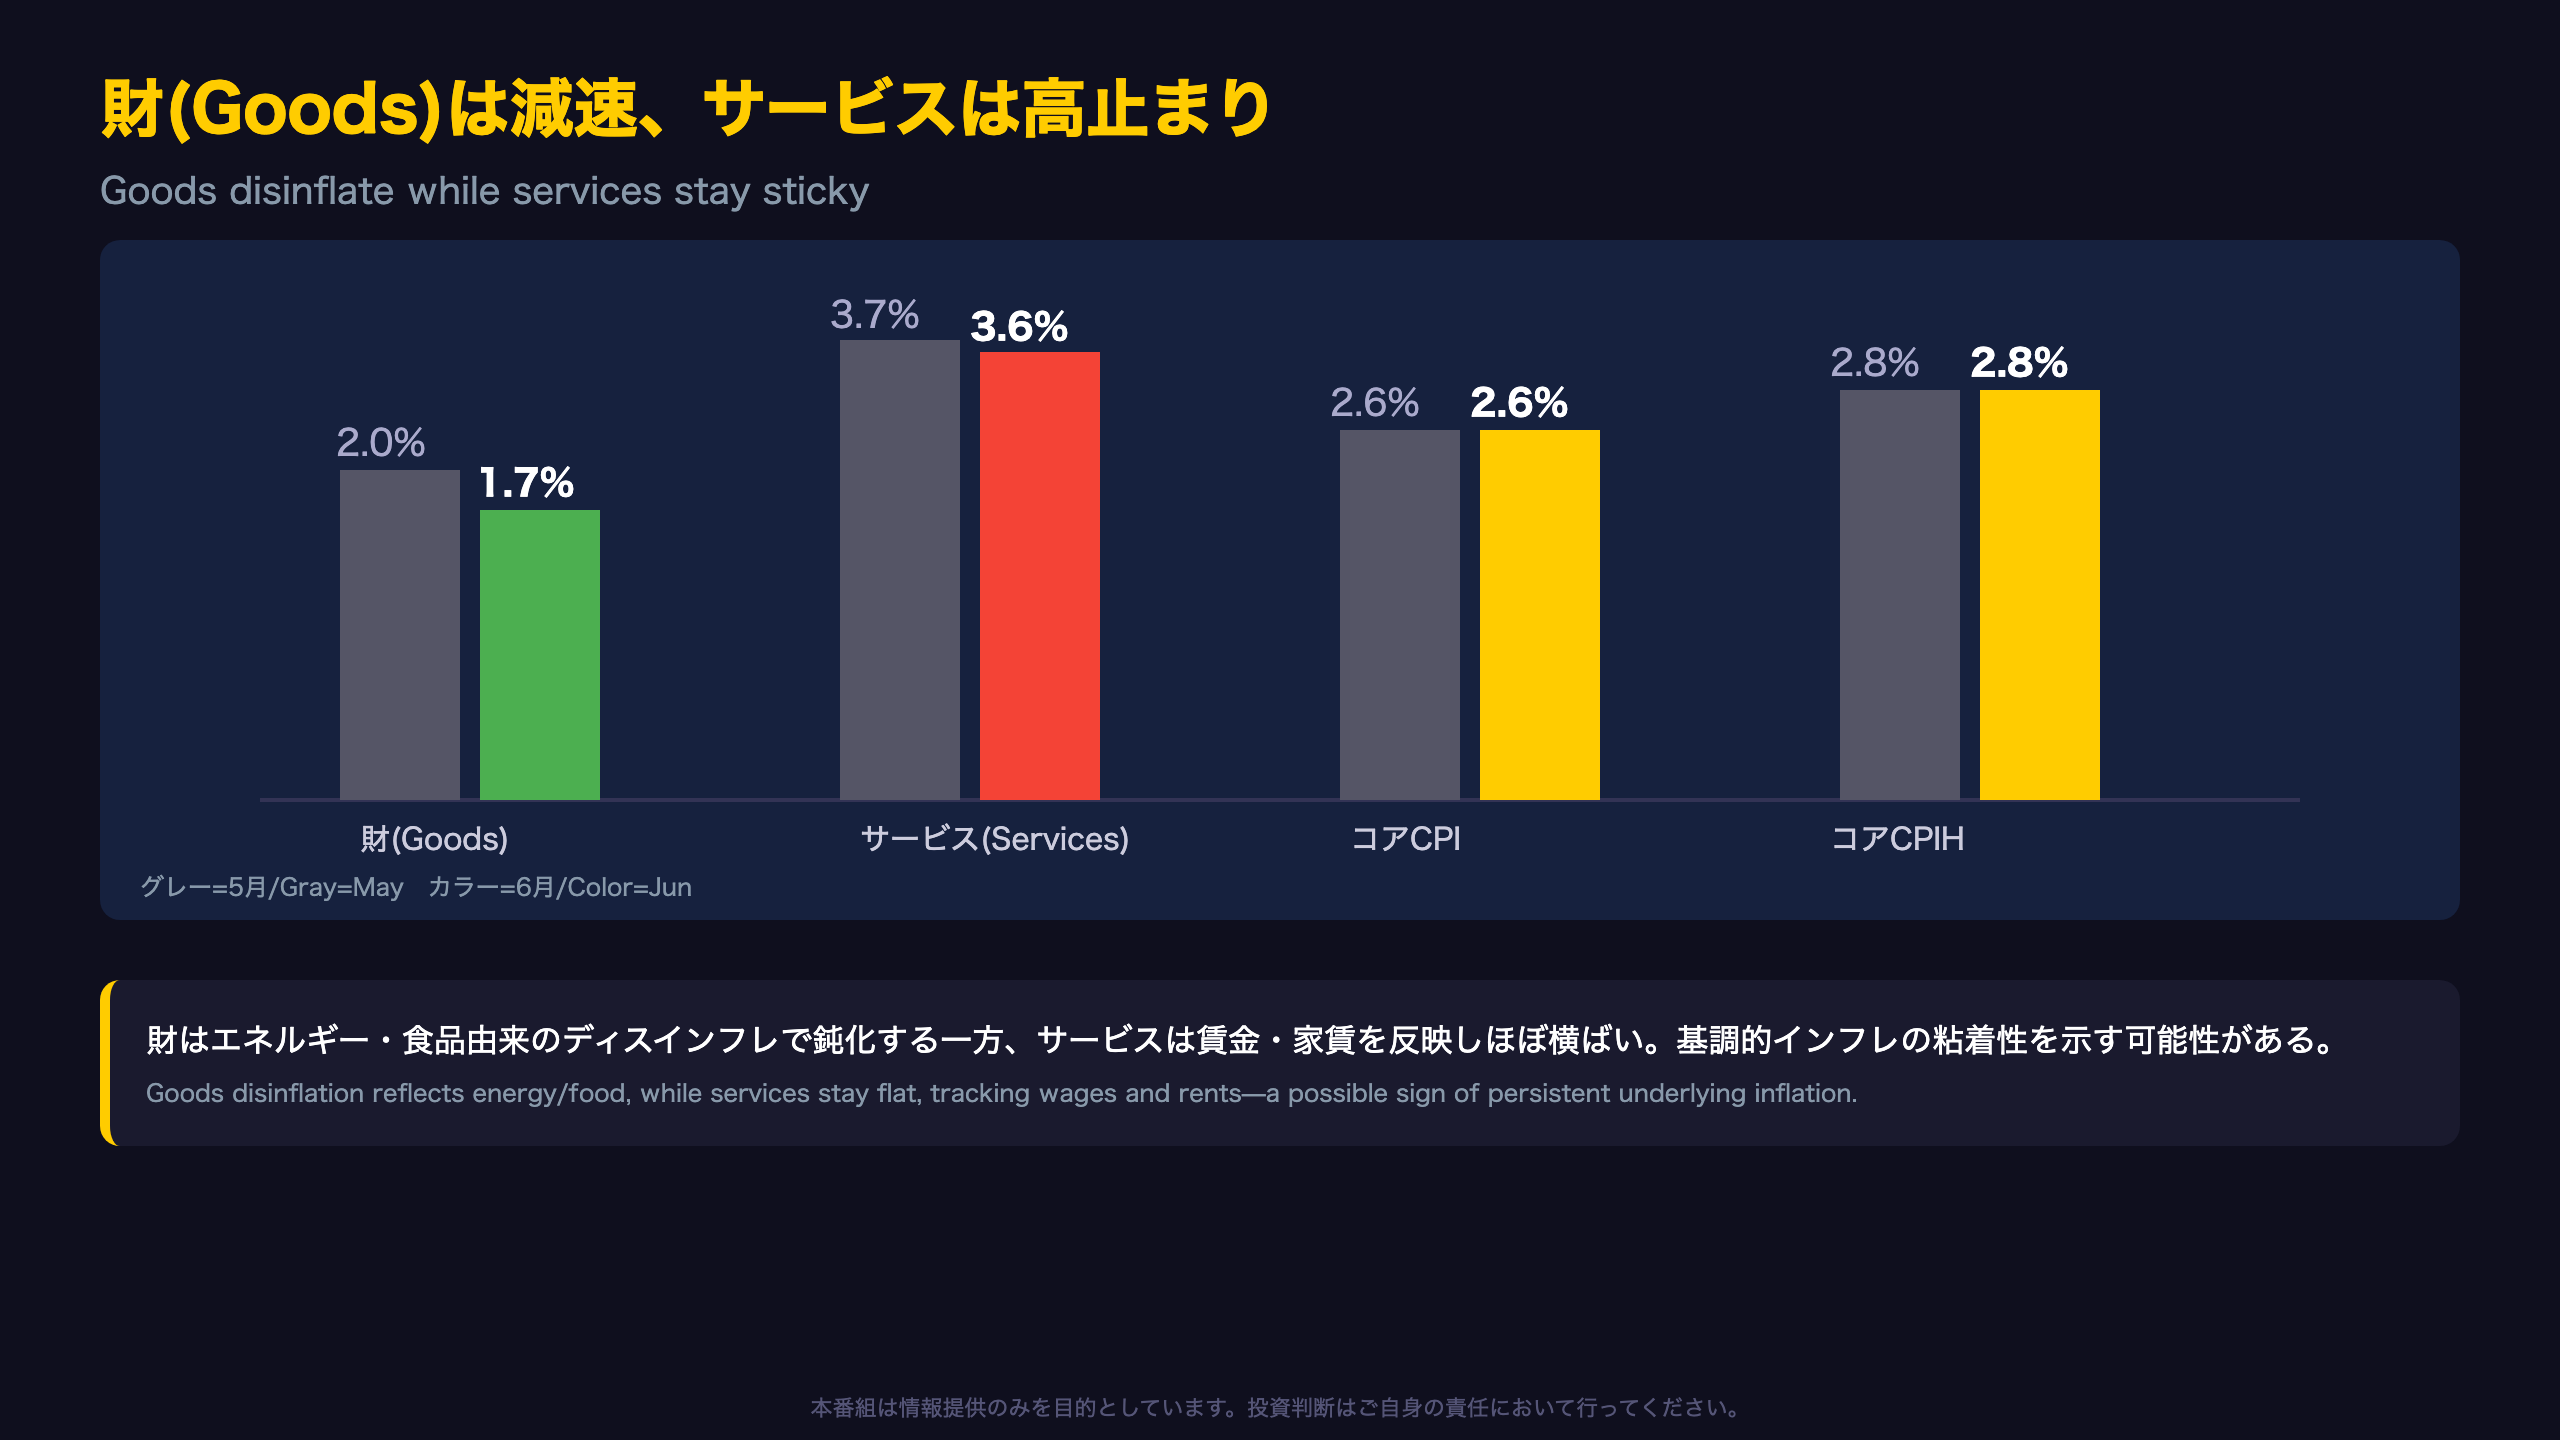
- Core CPI (ex food, energy, alcohol, tobacco): 2.6%, unchanged from May
- Core CPIH: 2.8%, unchanged for a third straight month—tied for the lowest since September 2021, but not improving further
- Services CPI: 3.6% (CPI eased slightly from 3.7%; CPIH was flat)
- Goods CPI: 1.7%, down from 2.0%
This is a textbook goods/services bifurcation. Goods disinflation—driven by energy and food base effects—is doing all the work on the headline, while services, the component central banks watch most closely as a proxy for domestically-generated inflation, simply isn’t moving.
Bull vs. bear read
Bulls will point to the headline matching its lowest level since December 2024 and core CPIH tying its best reading since September 2021 as reasons for the BoE to keep cutting. Bears will note that core and services inflation have now gone essentially unchanged for multiple consecutive readings—a sign of embedded persistence that argues for caution. The next release, due August 19, will be the key test of whether core and services can actually move lower.
運輸・燃料価格の反落が牽引 ― ヘッドライン低下の”真犯人”
The Anatomy of the Fuel Price Reversal
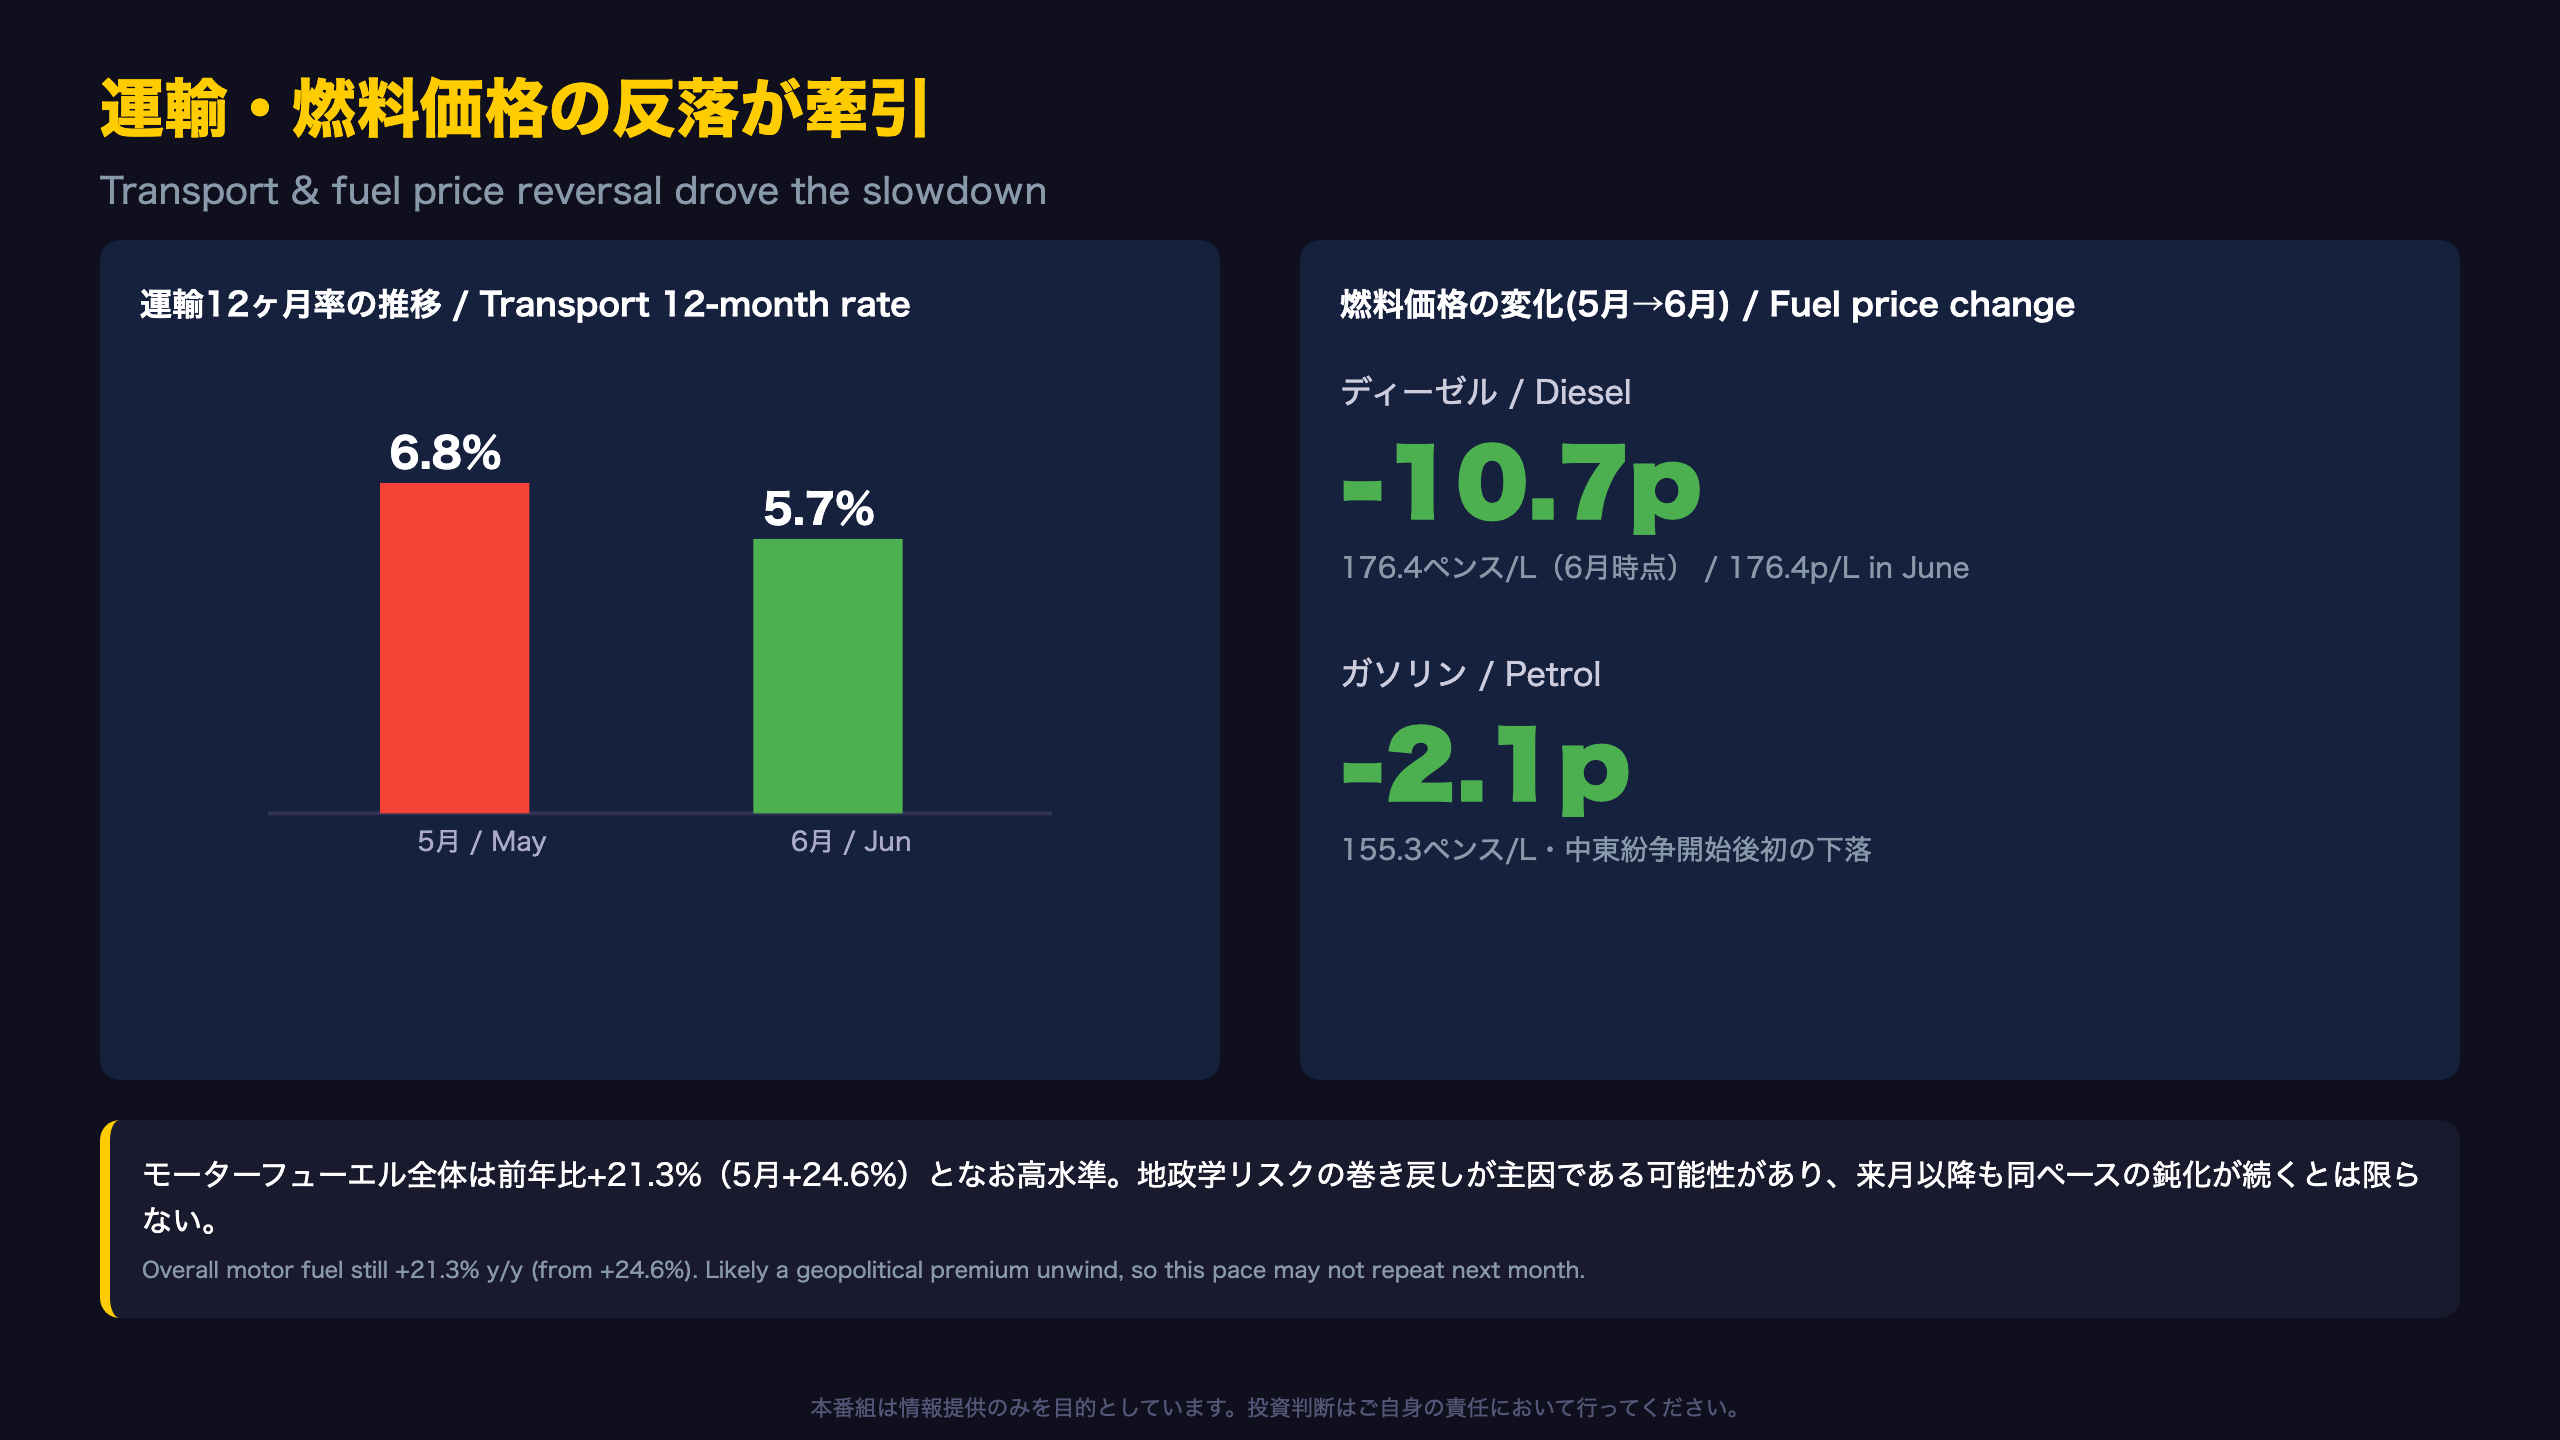
Transport inflation slowed sharply to 5.7% in June from 6.8% in May, the single largest downward contributor to both the CPIH and CPI deceleration. On a monthly basis, transport prices actually fell 0.3%, versus a 0.7% rise a year earlier.
Price moves at the pump
| Fuel | May→June change | June level |
|---|---|---|
| Diesel | -10.7p/litre | 176.4p/litre |
| Petrol | -2.1p/litre | 155.3p/litre |
Notably, the ONS states this was “the first time petrol prices have eased since the start of the conflict in the Middle East, on 28 February 2026″—a strong hint that this month’s fuel disinflation reflects a partial unwind of a geopolitical risk premium rather than a demand-side cooling.
For US and European readers: this dynamic parallels how Brent crude spikes tied to Middle East supply disruptions have fed through into retail pump prices worldwide since early 2026; the UK print is one of the clearer domestic confirmations of that premium beginning to fade.
Crucially, overall motor fuel prices are still up 21.3% year-on-year (down only from May’s 24.6%, itself the highest since September 2022)—so the level of fuel costs remains elevated even as the rate of increase decelerates. A smaller downward push also came from vehicle maintenance and repair (-0.2% vs +2.0% a year ago), tied to roadside recovery service pricing—a volatile, low-weight category rather than a structural signal.
Given the driver here is a geopolitical price unwind rather than demand destruction, this pace of transport disinflation may not repeat mechanically next month.
財(Goods)は減速、サービスは高止まり ― 二極化するインフレ構造
Goods vs. Services: A Widening Split
The most analytically significant feature of this release is the sharp asymmetry between goods and services inflation.
- All-goods CPIH: 1.7% (down from 2.0% in May)
- All-services CPIH: 3.6% (unchanged)
- Core CPI: 2.6% (unchanged)
- Core CPIH: 2.8% (matching April and May, tied for the lowest since September 2021)
The ONS bulletin states core CPIH “was 2.8% in June 2026, the same rate as in April and May. These are the joint lowest rates since September 2021.” Note the phrasing: it’s a tie, not a new low—progress has stalled for three straight readings.
Why services matter more than goods here
For readers used to US Fed or ECB frameworks: services inflation is widely viewed by central banks as a cleaner read on domestically generated inflation, since it’s less exposed to imported goods prices and exchange-rate pass-through, and more tied to wage growth and rent/housing cost cycles. A services rate stuck at 3.6% is consistent with continued pass-through from wage settlements and housing costs (a level-B inference, since multiple sub-indicators point the same direction—but not certain from a single month’s data).
The counter-argument
To be fair, CPI services did edge down from 3.7% to 3.6%, so the direction of travel is arguably still downward, just at a much slower pace than goods. Reading a single month’s 0.1 percentage point move as a turning point would be premature; several more prints are needed before concluding services disinflation is durably underway.
見過ごされた”反転”の兆し ― 住宅費とホスピタリティが反転
Two Quiet Reversals Buried in the Contribution Data
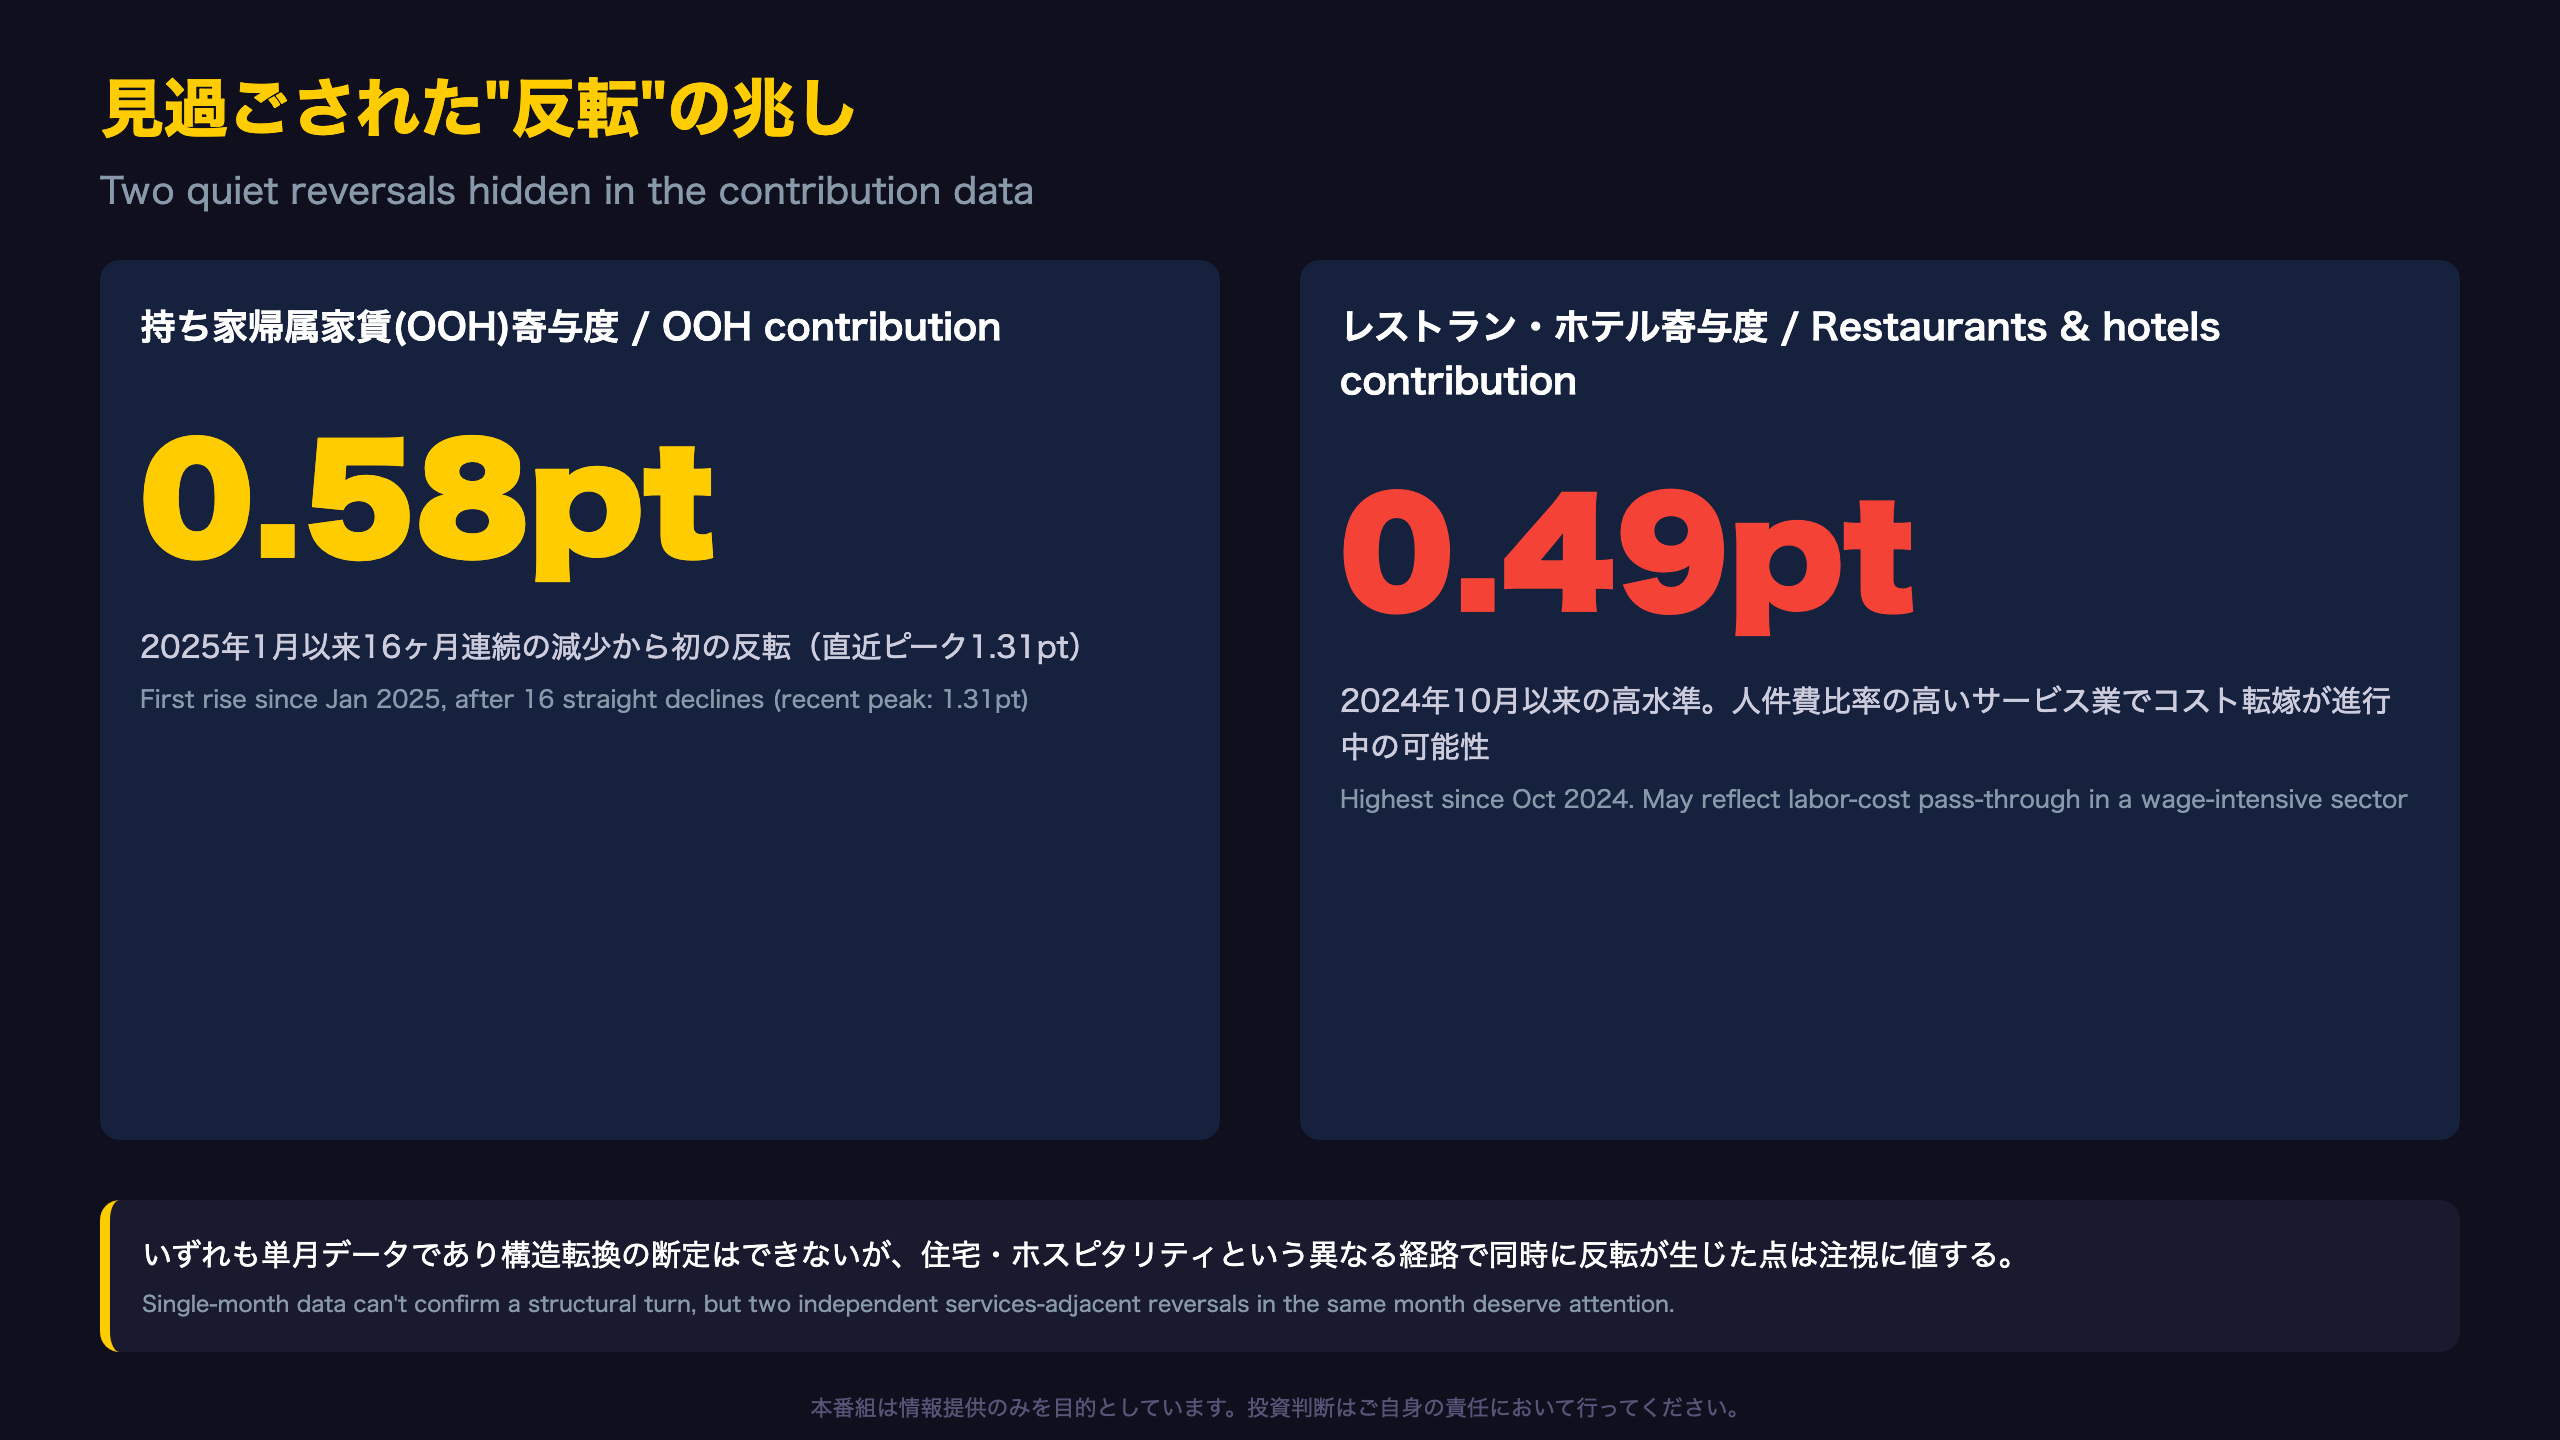
Figures 6 and 7 in the ONS release break down which categories drive the annual CPIH rate—and two subtle turning points emerge that the headline commentary doesn’t emphasize.
1. Owner Occupiers’ Housing (OOH) costs turn up
“The annual contribution from OOH costs rose slightly, to 0.58 percentage points, in June 2026. This was the first rise between months since January 2025 and followed 16 consecutive decreases,” the ONS states.
For international readers: OOH is a UK/CPIH-specific concept (roughly analogous to the US CPI’s owners’ equivalent rent), estimated using a rental-equivalence approach, and makes up about 18% of the CPIH basket—the single largest structural driver of the CPIH/CPI gap. Its 16-month streak of declining contributions has been one of the main pillars supporting the broader disinflation narrative. That streak just broke.
2. Restaurants and hotels re-accelerate
The contribution from restaurants and hotels rose to 0.49 percentage points, the highest since October 2024. This is a labor-intensive services category, making it sensitive to wage cost pass-through—directly relevant to the services-stickiness theme discussed elsewhere in this report.
A necessary caveat
Both data points are single-month observations. Under a disciplined inference framework, this qualifies only as a possible early signal, not a confirmed trend reversal. That said, seeing two independent services-adjacent channels turn upward in the same month, against a backdrop of already-flat core and services inflation, is a coincidence worth monitoring rather than dismissing outright.
国際比較:英国はEU平均より低く、独仏より高い
Where the UK Sits Among Peers
| Region | CPI/HICP y/y (June 2026) |
|---|---|
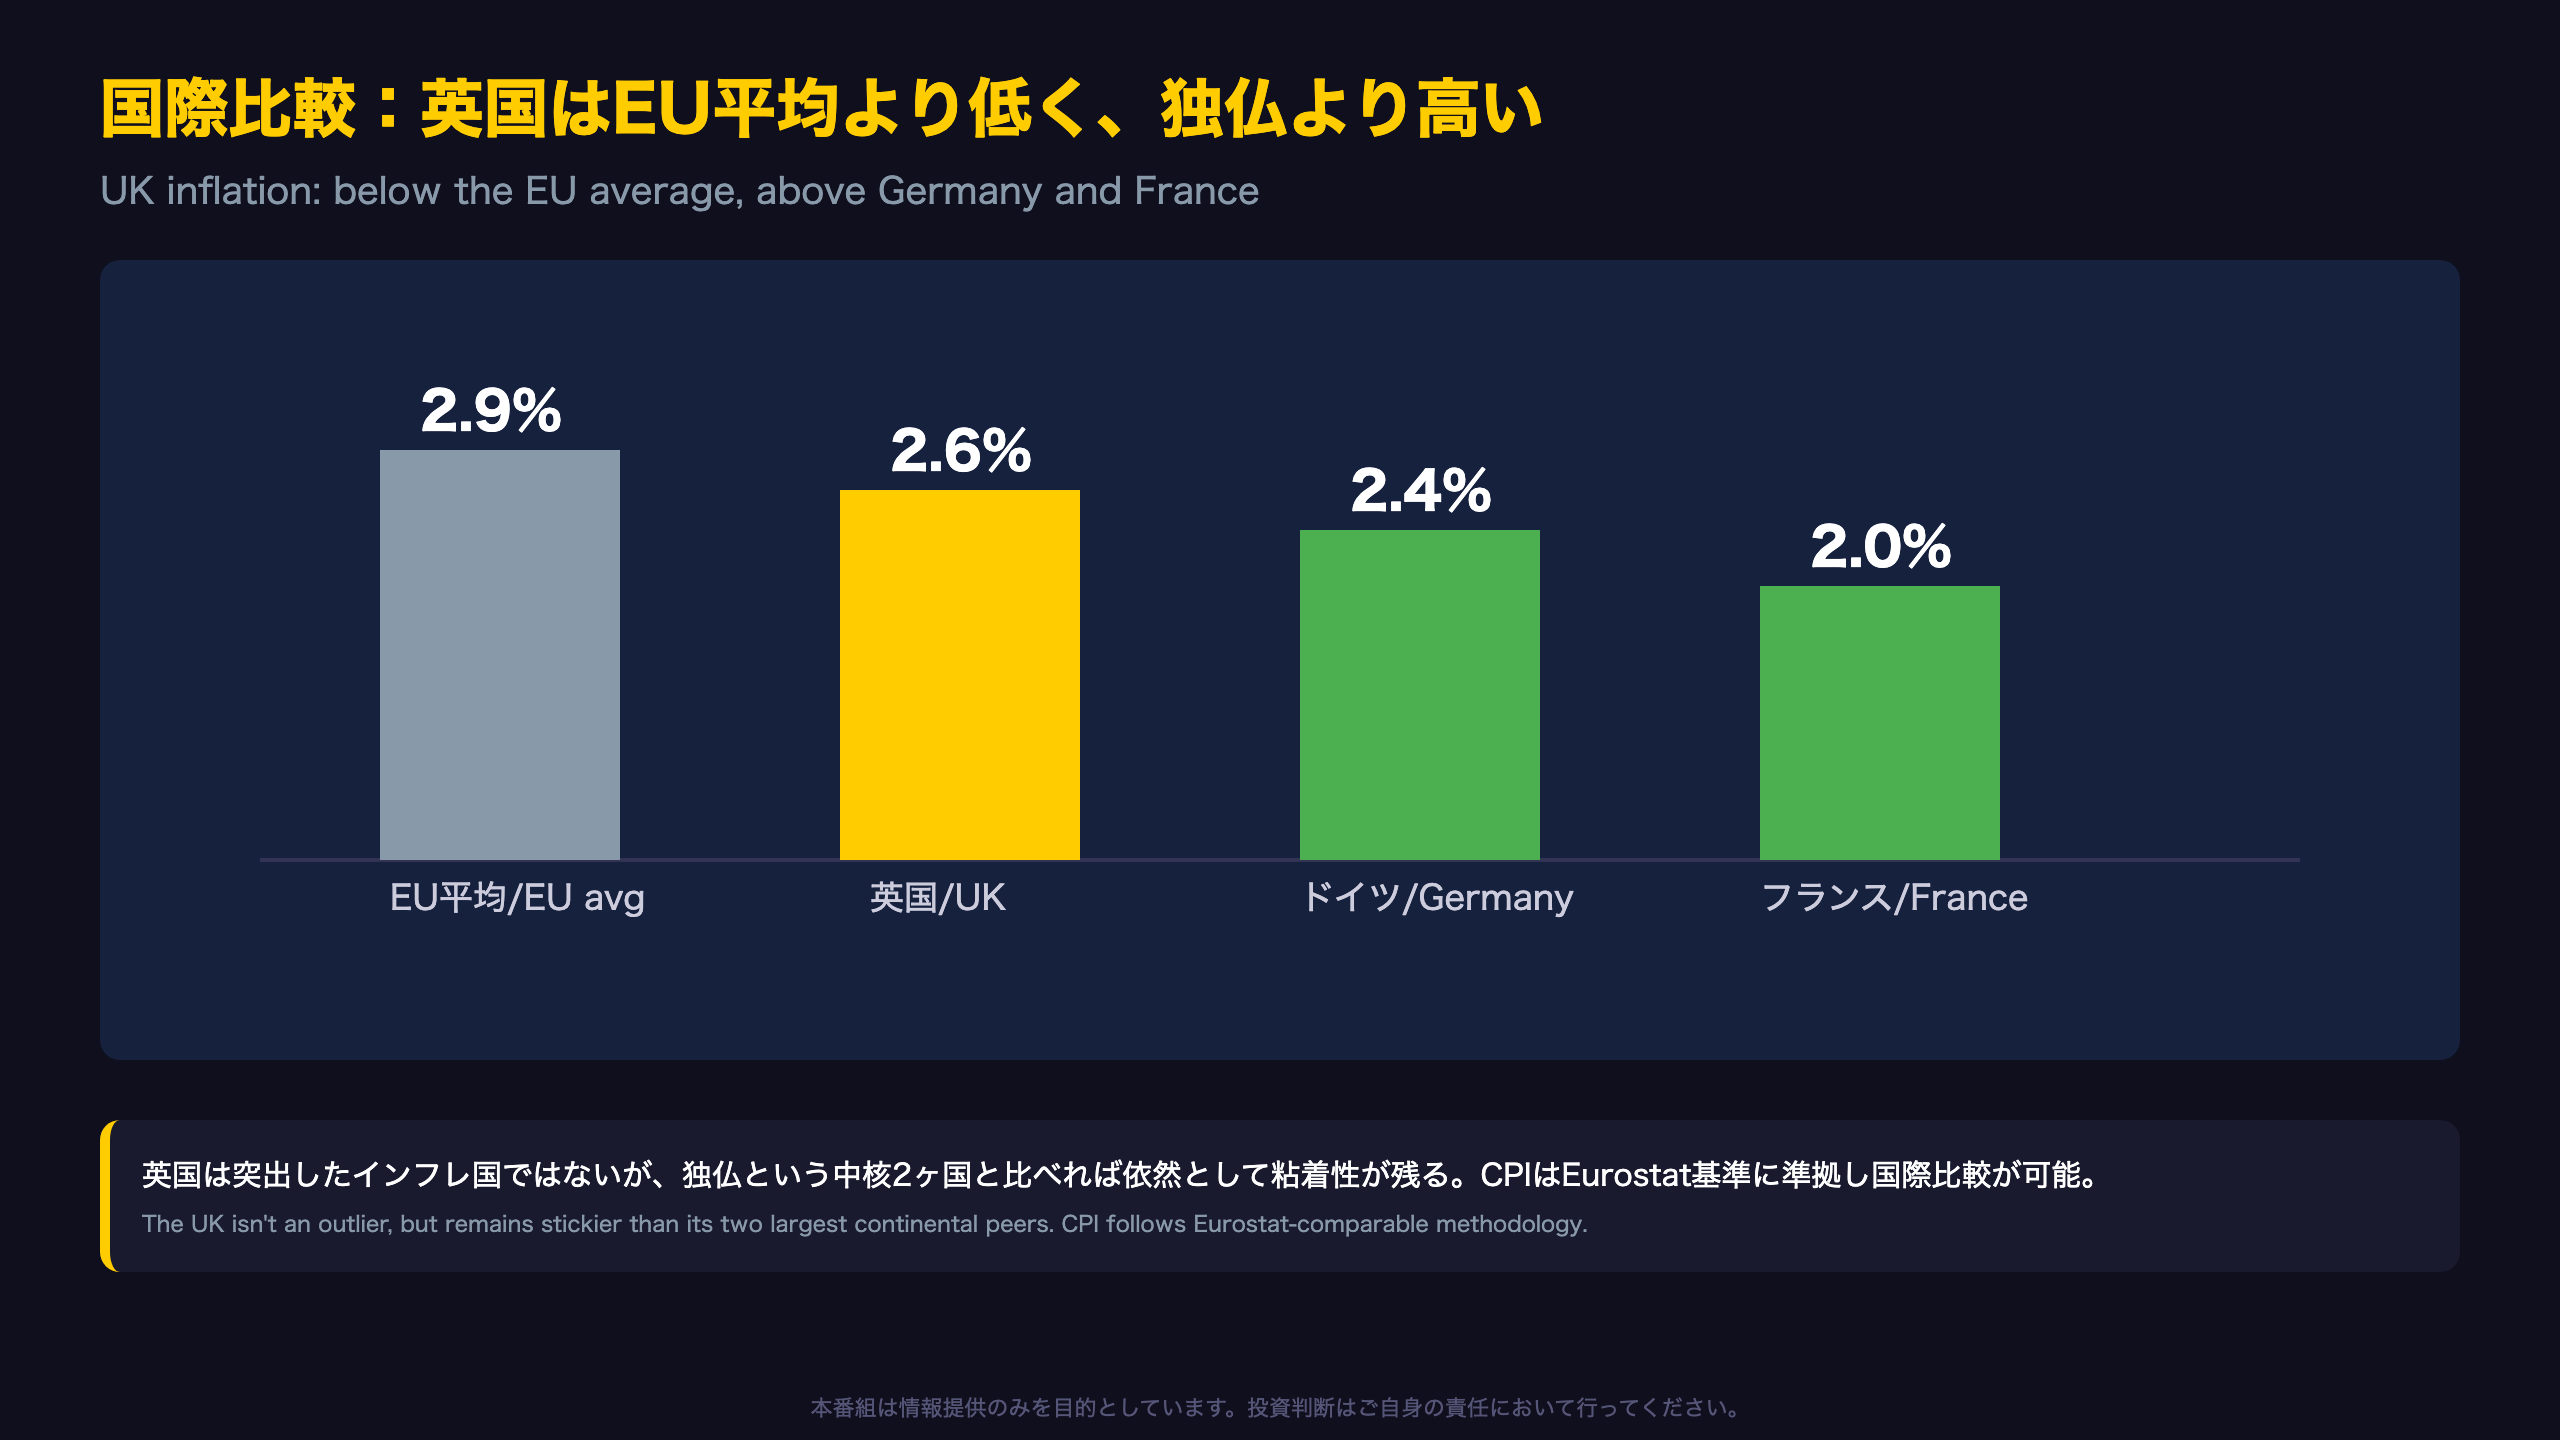
| EU average | 2.9% |
| UK | 2.6% |
| Germany | 2.4% |
| France | 2.0% |
The UK’s CPI is deliberately constructed to be comparable with the EU’s Harmonised Index of Consumer Prices (HICP)—this cross-country comparability is one of the primary reasons the CPI, rather than CPIH, is used as the UK’s official inflation target measure. The ONS notes the UK’s 2.6% rate is “lower than the EU rate (2.9%) but higher than that for France (2.0%) and Germany (2.4%).”
One caveat for readers benchmarking against the US: the US Harmonised Index (R-HICP) referenced in the ONS chart is only current through December 2024, due to differences in how the US produces this series, so a like-for-like US comparison isn’t fully current.
What this positioning implies
The UK isn’t an inflation outlier within Europe, but relative to its two largest continental peers—Germany and France—its inflation profile remains comparatively sticky. This is circumstantial corroborating evidence for the idea that UK-specific services and wage-driven inflation pressures may be running somewhat hotter than in core continental Europe, reinforcing the case for BoE caution rather than urgency.
インプリケーション:市場は”コアの膠着”を織り込めるか
Reading the Market Implications Through the Chain of Evidence
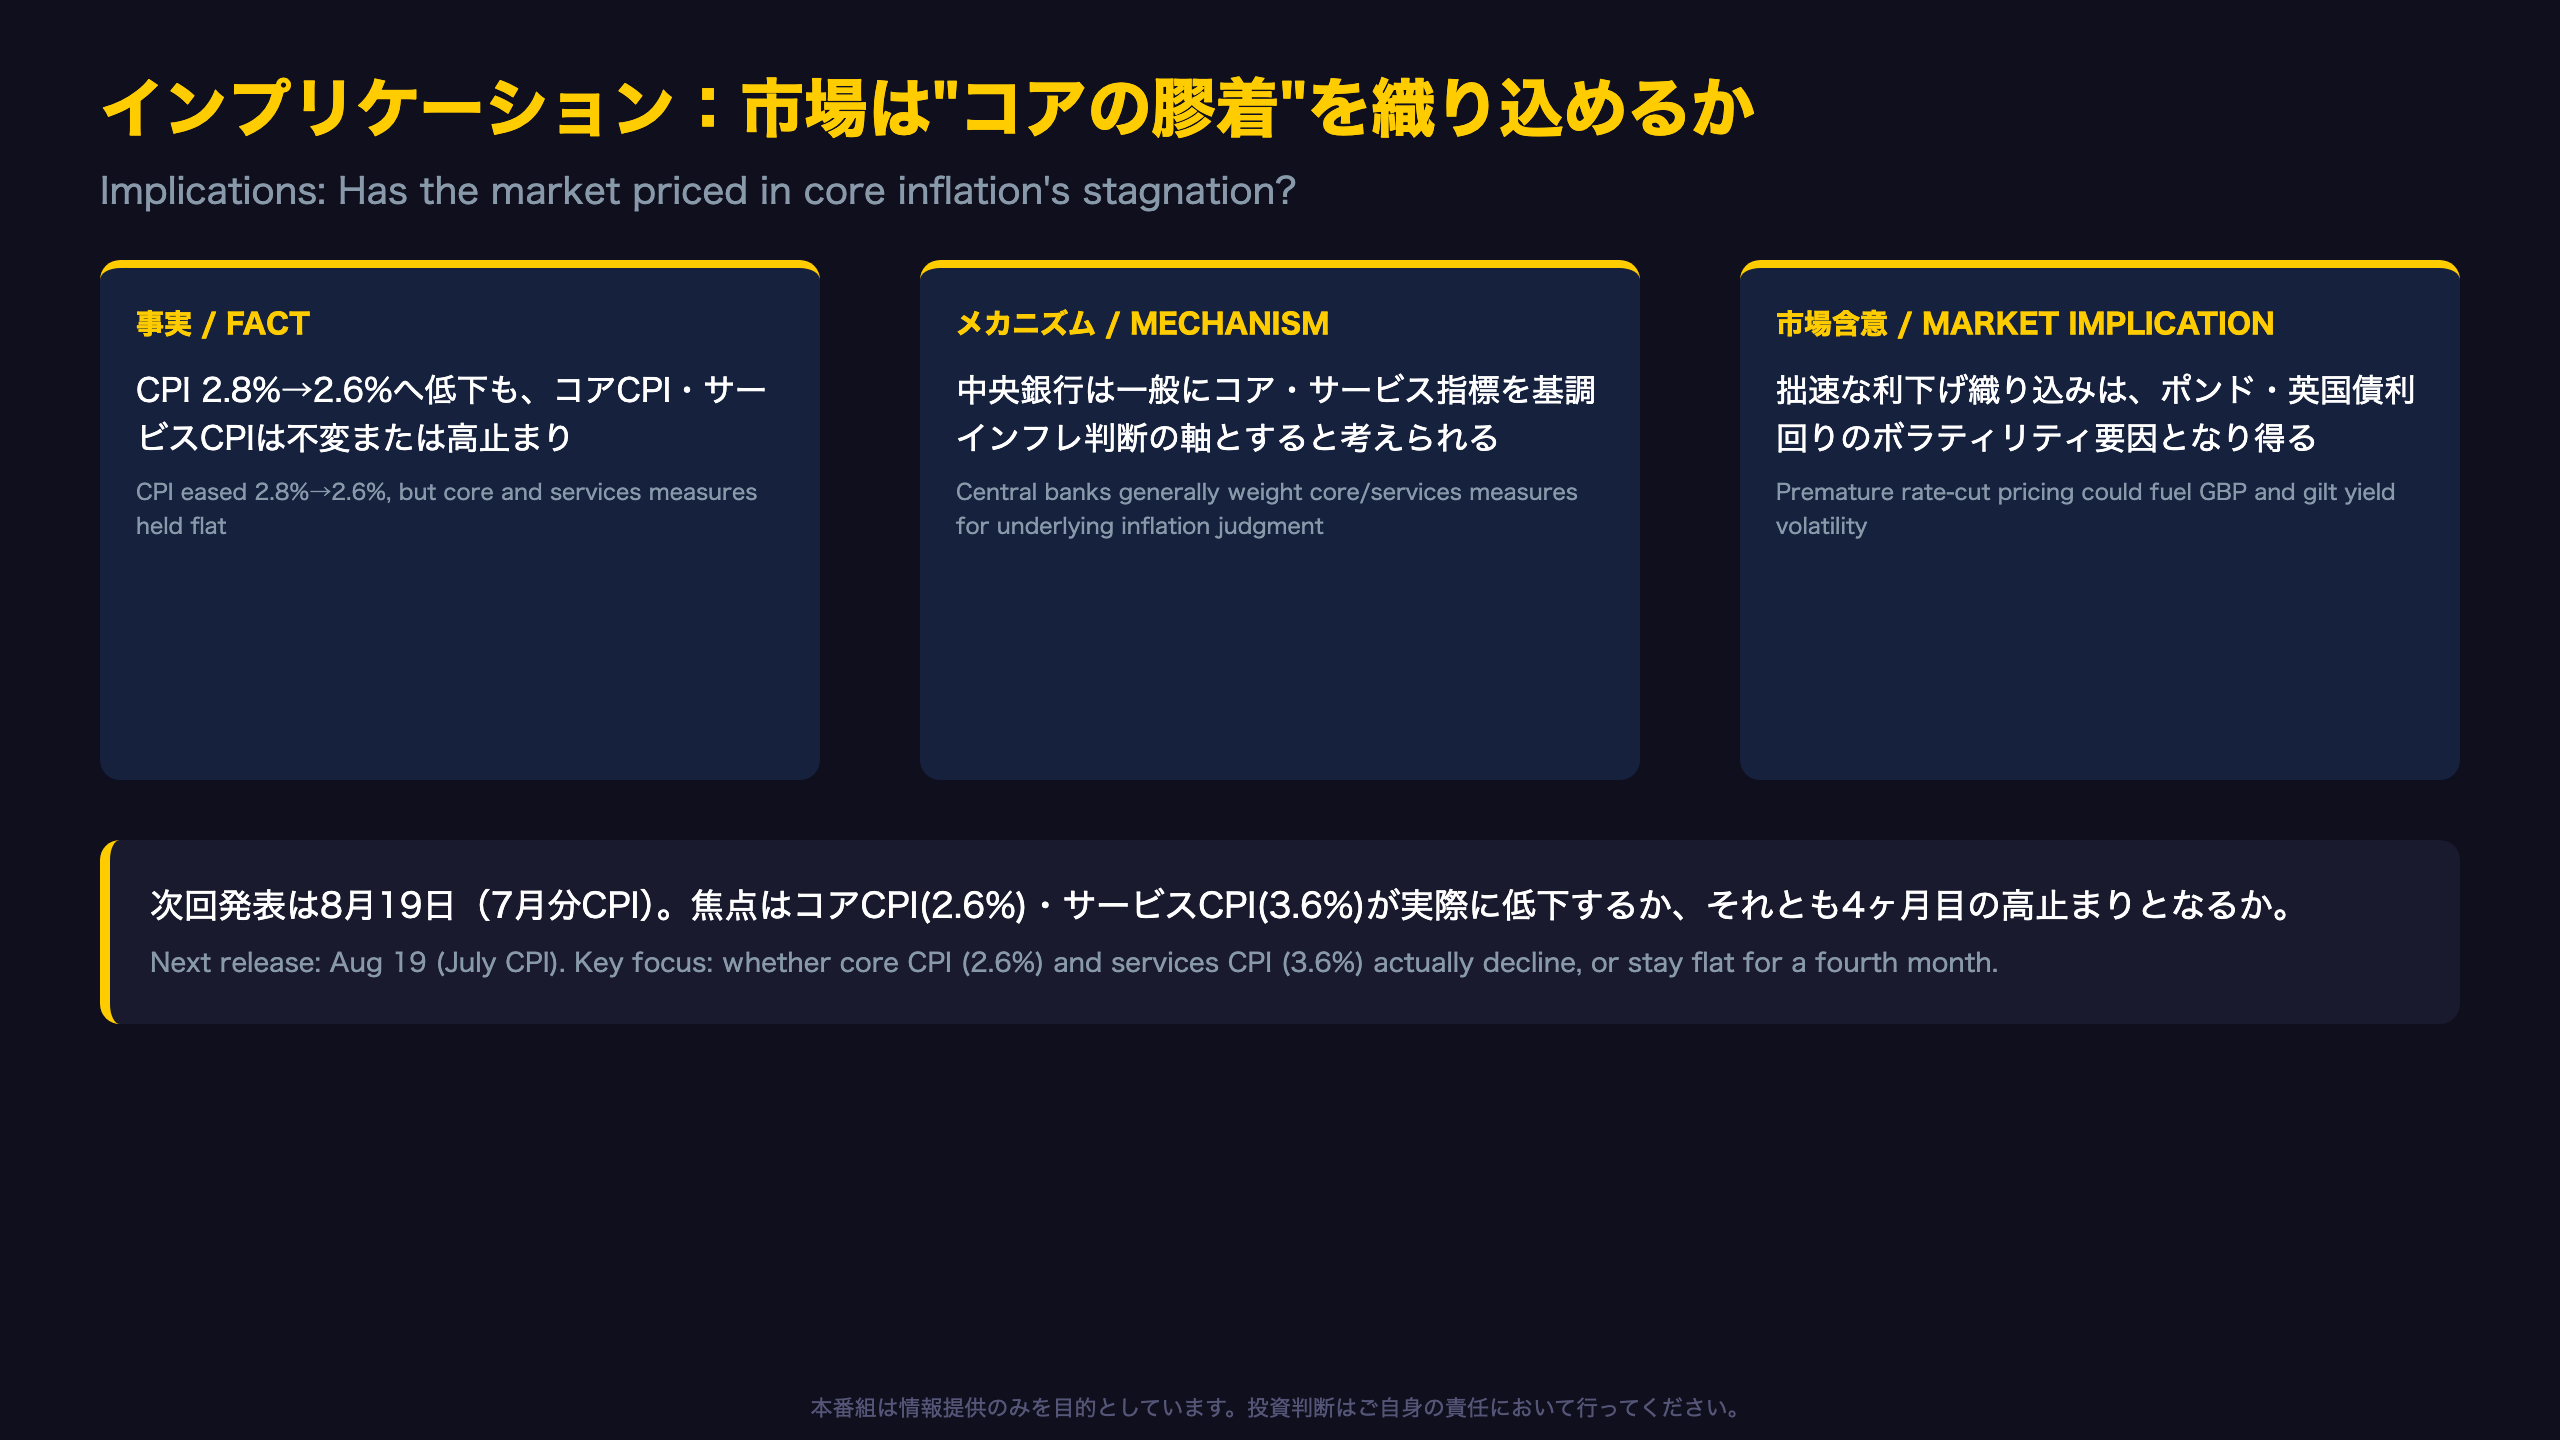
[Fact] Headline CPI eased from 2.8% to 2.6% (tying its lowest level since December 2024), while core CPI (2.6%) and core CPIH (2.8%) stayed unchanged from May, and services CPI remained elevated at 3.6%.
[Mechanism] Central banks are generally understood to weight core inflation measures—and services prices in particular, given their sensitivity to wage growth—heavily when judging underlying inflation persistence. This month’s headline improvement was driven almost entirely by a temporary, geopolitically-linked reversal in transport and fuel prices, without any accompanying move in core or services measures.
[Market implication] If markets extrapolate the headline improvement into more aggressive rate-cut pricing, a later repricing—once the gap with sticky core/services inflation becomes evident again—could inject volatility into GBP and UK gilt yields. That said, this single data release cannot pin down exactly how the Bank of England’s reaction function will respond; that requires monitoring the Monetary Policy Committee’s actual commentary at its next meeting.
What to watch next
- Next release: August 19, 2026 (July CPI)
- Key threshold: whether core CPI (2.6%) and services CPI (3.6%) actually move lower, versus simply holding at current levels for a fourth straight month
- Risk to the disinflation narrative: since June’s fuel-driven relief reflects a geopolitical price unwind rather than demand destruction, the pace of headline deceleration may not repeat mechanically in July
For GBP and gilt traders, the asymmetry matters: further core/services stagnation would argue against front-loading BoE rate cuts, even if the headline print continues to look encouraging on the surface.
Disclaimer: This article is for informational purposes only. All investment decisions are made solely at your own risk.