📺 Watch the Full Video Analysis
This article was automatically generated by the NFC Market Live AI analysis system. (Updated: 2026-07-15 15:48 JST)
📄 Primary Source
Statistics Norway
https://www.ssb.no/en/priser-og-prisindekser/konsumpriser/statistikk/konsumprisindeksen
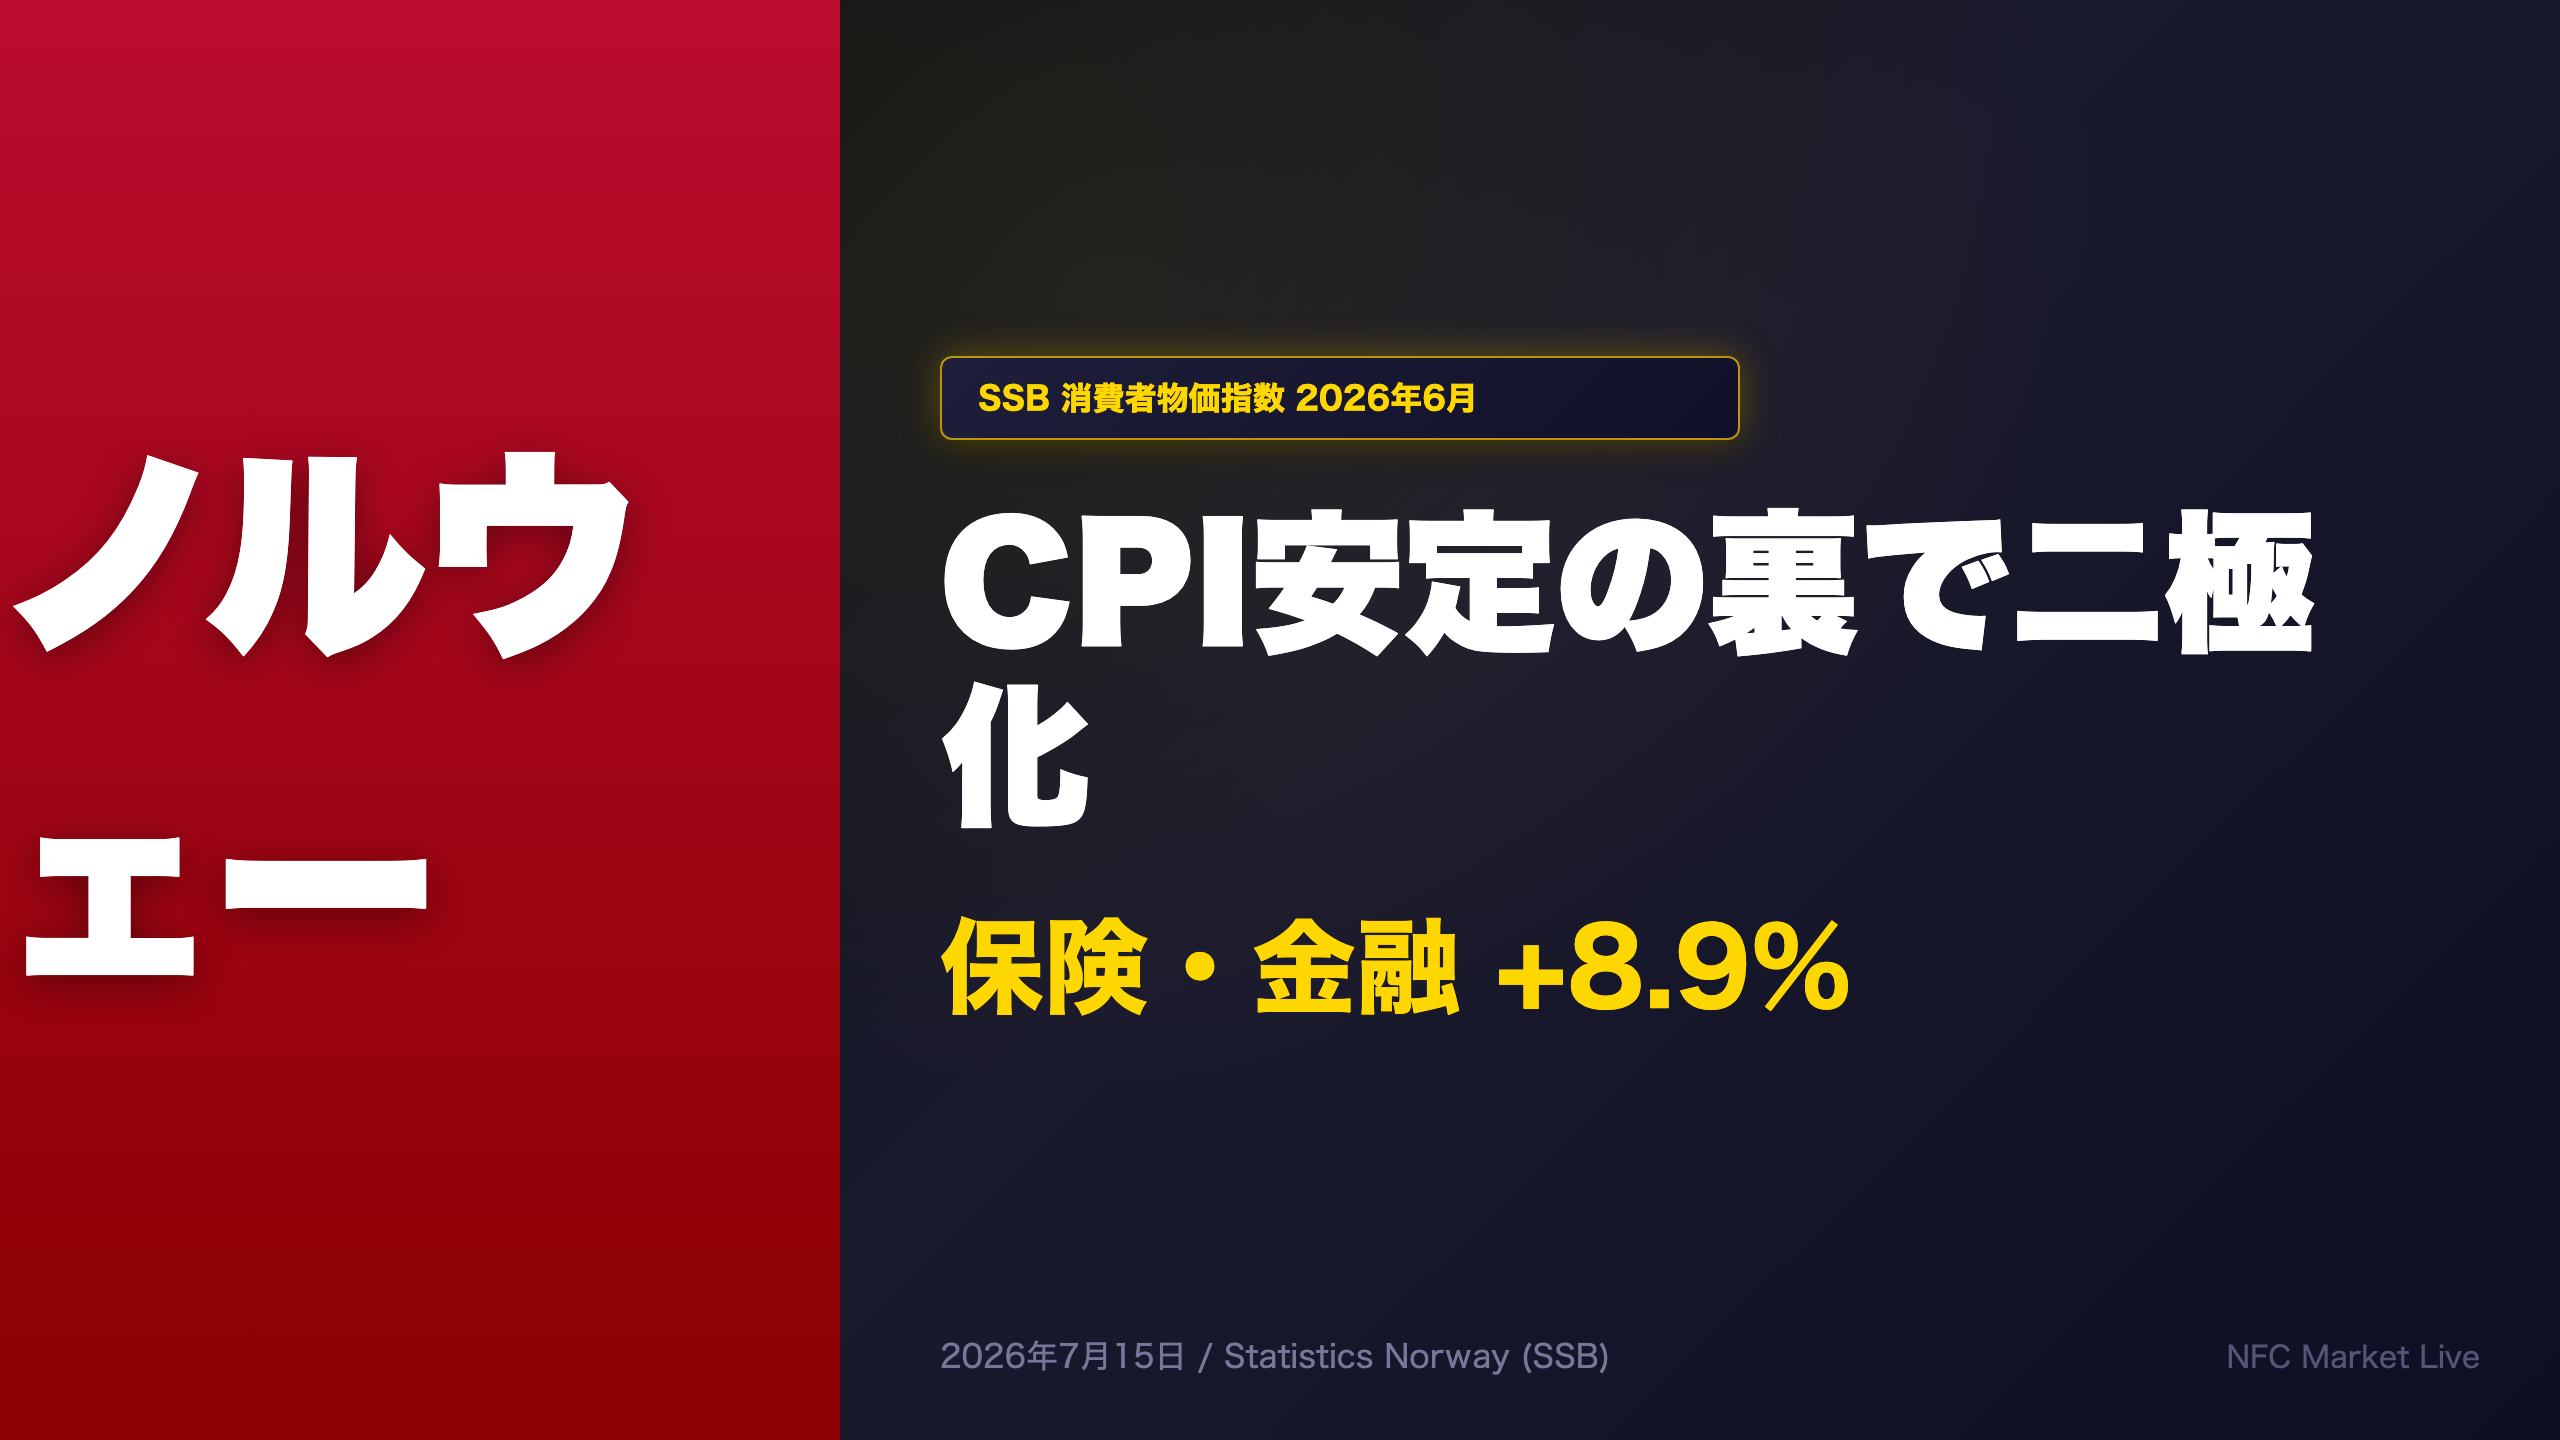
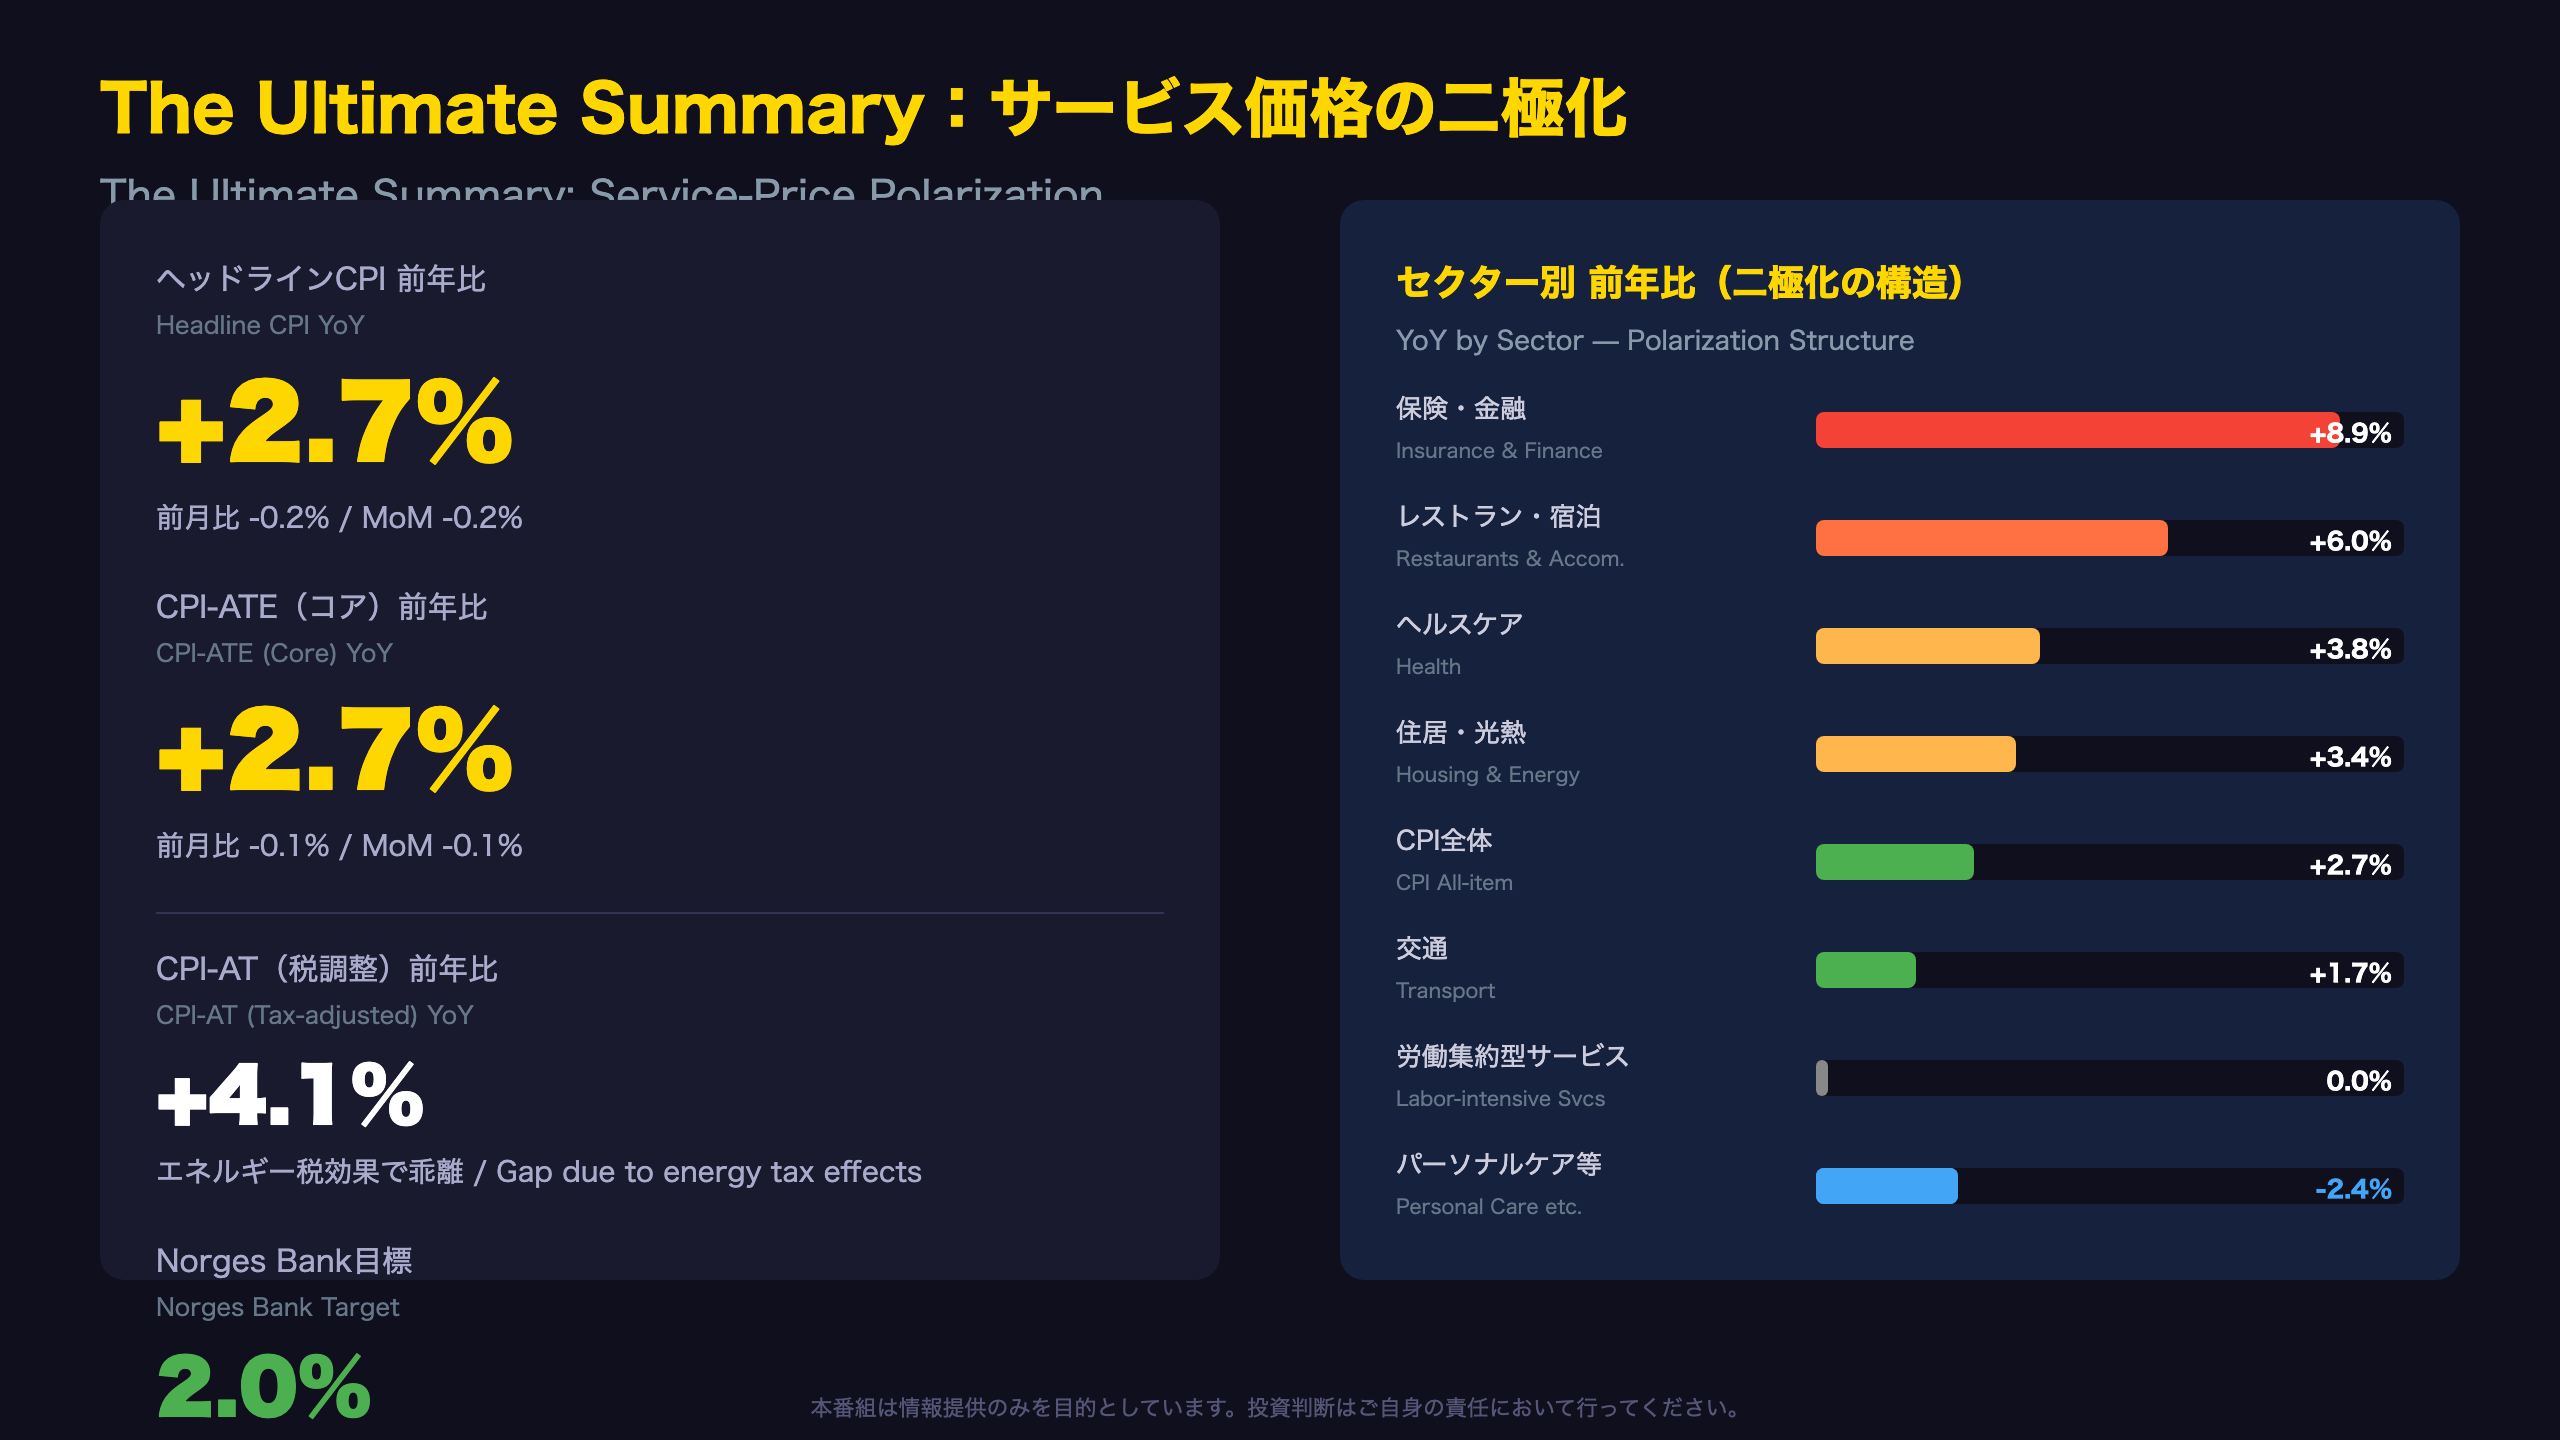
📊 Norway June CPI: +2.7% YoY, CPI-ATE (tax-adjusted ex-energy) also +2.7%\n\n📈 Key highlights:\n• Insurance & financial services surged +8.9% YoY\n• Restaurants & accommodation at +6.0%\n• Labor-intensive services (incl. administered prices) flat at 0.0% YoY\n\n💡 Insight:\nHeadline CPI sits just above Norges Bank’s 2% target, but the composition reveals extreme polarization — financial services and hospitality running hot while labor-dominated services show zero growth.\n\n⚠️ Market implication:\nThis dual structure complicates the rate-cut path. NOK likely stays supported as Norges Bank maintains caution despite benign headline prints.
The Ultimate Summary:ヘッドライン安定の裏に潜むサービス価格の二極化
Context: What Is Norway’s CPI and Why Does It Matter?
Norway’s Consumer Price Index (CPI) is published monthly by Statistics Norway (Statistisk sentralbyra, or SSB). It is the primary inflation gauge used by Norges Bank, Norway’s central bank, which targets 2% annual inflation. The CPI-ATE — adjusted for tax changes and excluding energy — serves as the preferred core measure for monetary policy decisions, analogous to the Fed’s core PCE or the ECB’s HICP excluding energy and food.
June 2026 Data: Headline and Core Both at +2.7% YoY
The all-item CPI index stood at 102.8 (base 2025=100), down 0.2% month-on-month but up 2.7% year-on-year. CPI-ATE also printed +2.7% YoY with a marginal -0.1% MoM decline. This marks a continuation of the deceleration trend observed since early 2026.
Monthly Index Path (2015=100 base)
| Month | Index |
|---|---|
| Jan 2026 | 101.6 |
| Feb | 102.2 |
| Mar | 102.4 |
| Apr | 102.8 |
| May | 103.0 |
| Jun | 102.8 |
The index has plateaued since April, suggesting momentum exhaustion.
CPI-AT Gap: Tax Effects Still Significant
CPI-AT (tax-adjusted but including energy) printed +4.1% YoY versus headline’s +2.7%. The 1.4 percentage point gap implies energy-related tax changes are materially suppressing the headline figure. International investors should note this when comparing Norway’s inflation to eurozone HICP.
Comparison With Peers
- Eurozone HICP (May 2026): approximately 2.1% — Norway’s headline is modestly higher
- Sweden CPI (recent): running near 1.5-2.0% — Norway’s inflation is stickier
- Norges Bank target: 2.0% — current print is 70bp above target
This positions Norway as having slightly above-target but non-alarming inflation, similar to the Bank of England’s situation in early 2025.
Deep Dive 1:保険・金融サービス+8.9%の構造分析
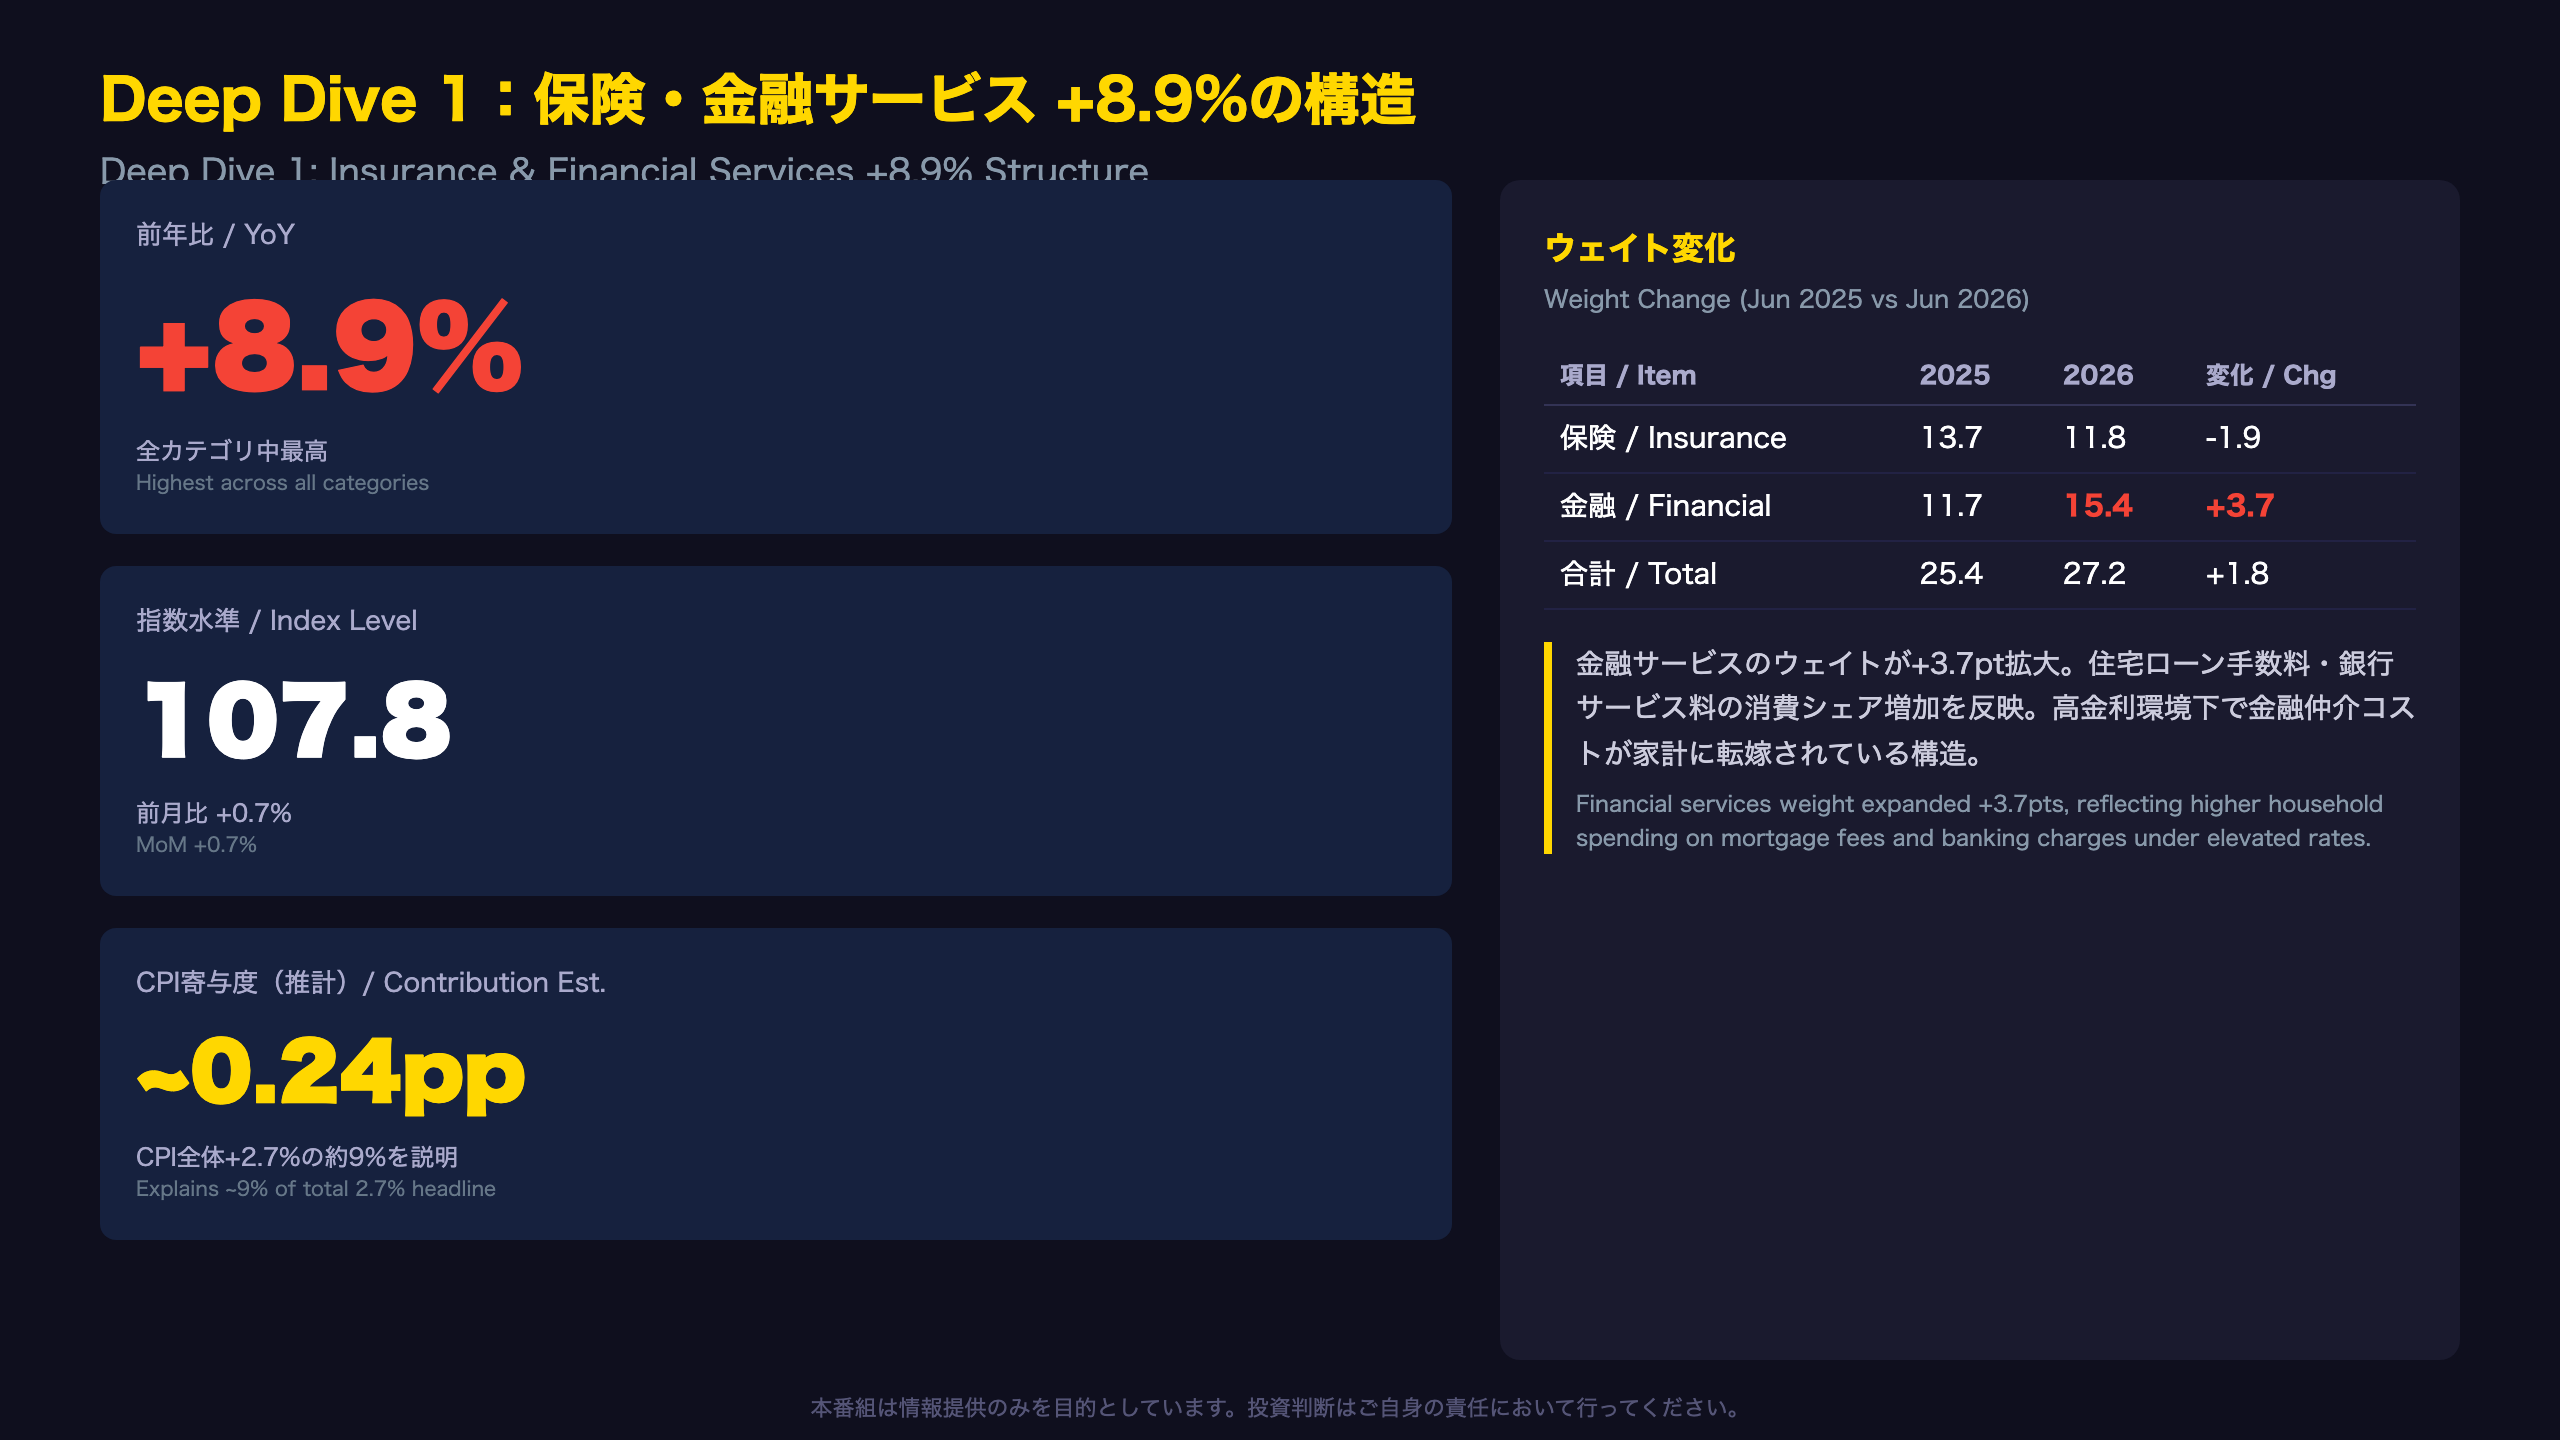
Why Insurance & Financial Services Matter for Norway’s Inflation
Weight Shift: Financial Services Surging
| Component | Jun 2025 Weight | Jun 2026 Weight | Change |
|---|---|---|---|
| Insurance | 13.7 | 11.8 | -1.9 |
| Financial services | 11.7 | 15.4 | +3.7 |
| Total | 25.4 | 27.2 | +1.8 |
The financial services weight jumped by 3.7 points year-on-year, the largest single-category weight increase in the entire CPI basket. This reflects Norwegian households spending proportionally more on mortgage-related fees and banking charges as Norges Bank’s policy rate remains elevated.
Contribution Estimate
Weight 27.2 multiplied by +8.9% YoY yields an approximate contribution of +0.24 percentage points to headline CPI. This single category explains roughly 9% of the total 2.7% annual inflation rate.
International Context
Financial services inflation is a phenomenon observed across several high-rate economies. In the UK, financial services CPI has similarly run above headline. The mechanism is straightforward: when central banks hold rates high, banks and insurers pass through higher intermediation costs. This creates a paradox where tight monetary policy itself generates measured inflation in financial services.
Key Question for Norges Bank
If Norges Bank cuts rates, financial services inflation should mechanically decline. But if they hold rates to fight this very inflation, they perpetuate the cost-push. This circular dynamic is a genuine policy dilemma that the August Monetary Policy Report will likely address.
Next Data Point
July CPI (August 10 release) will reveal whether the +8.9% figure accelerates further or begins to moderate via base effects.
Deep Dive 2:労働集約型サービスの停滞とウェイト構造の大変動
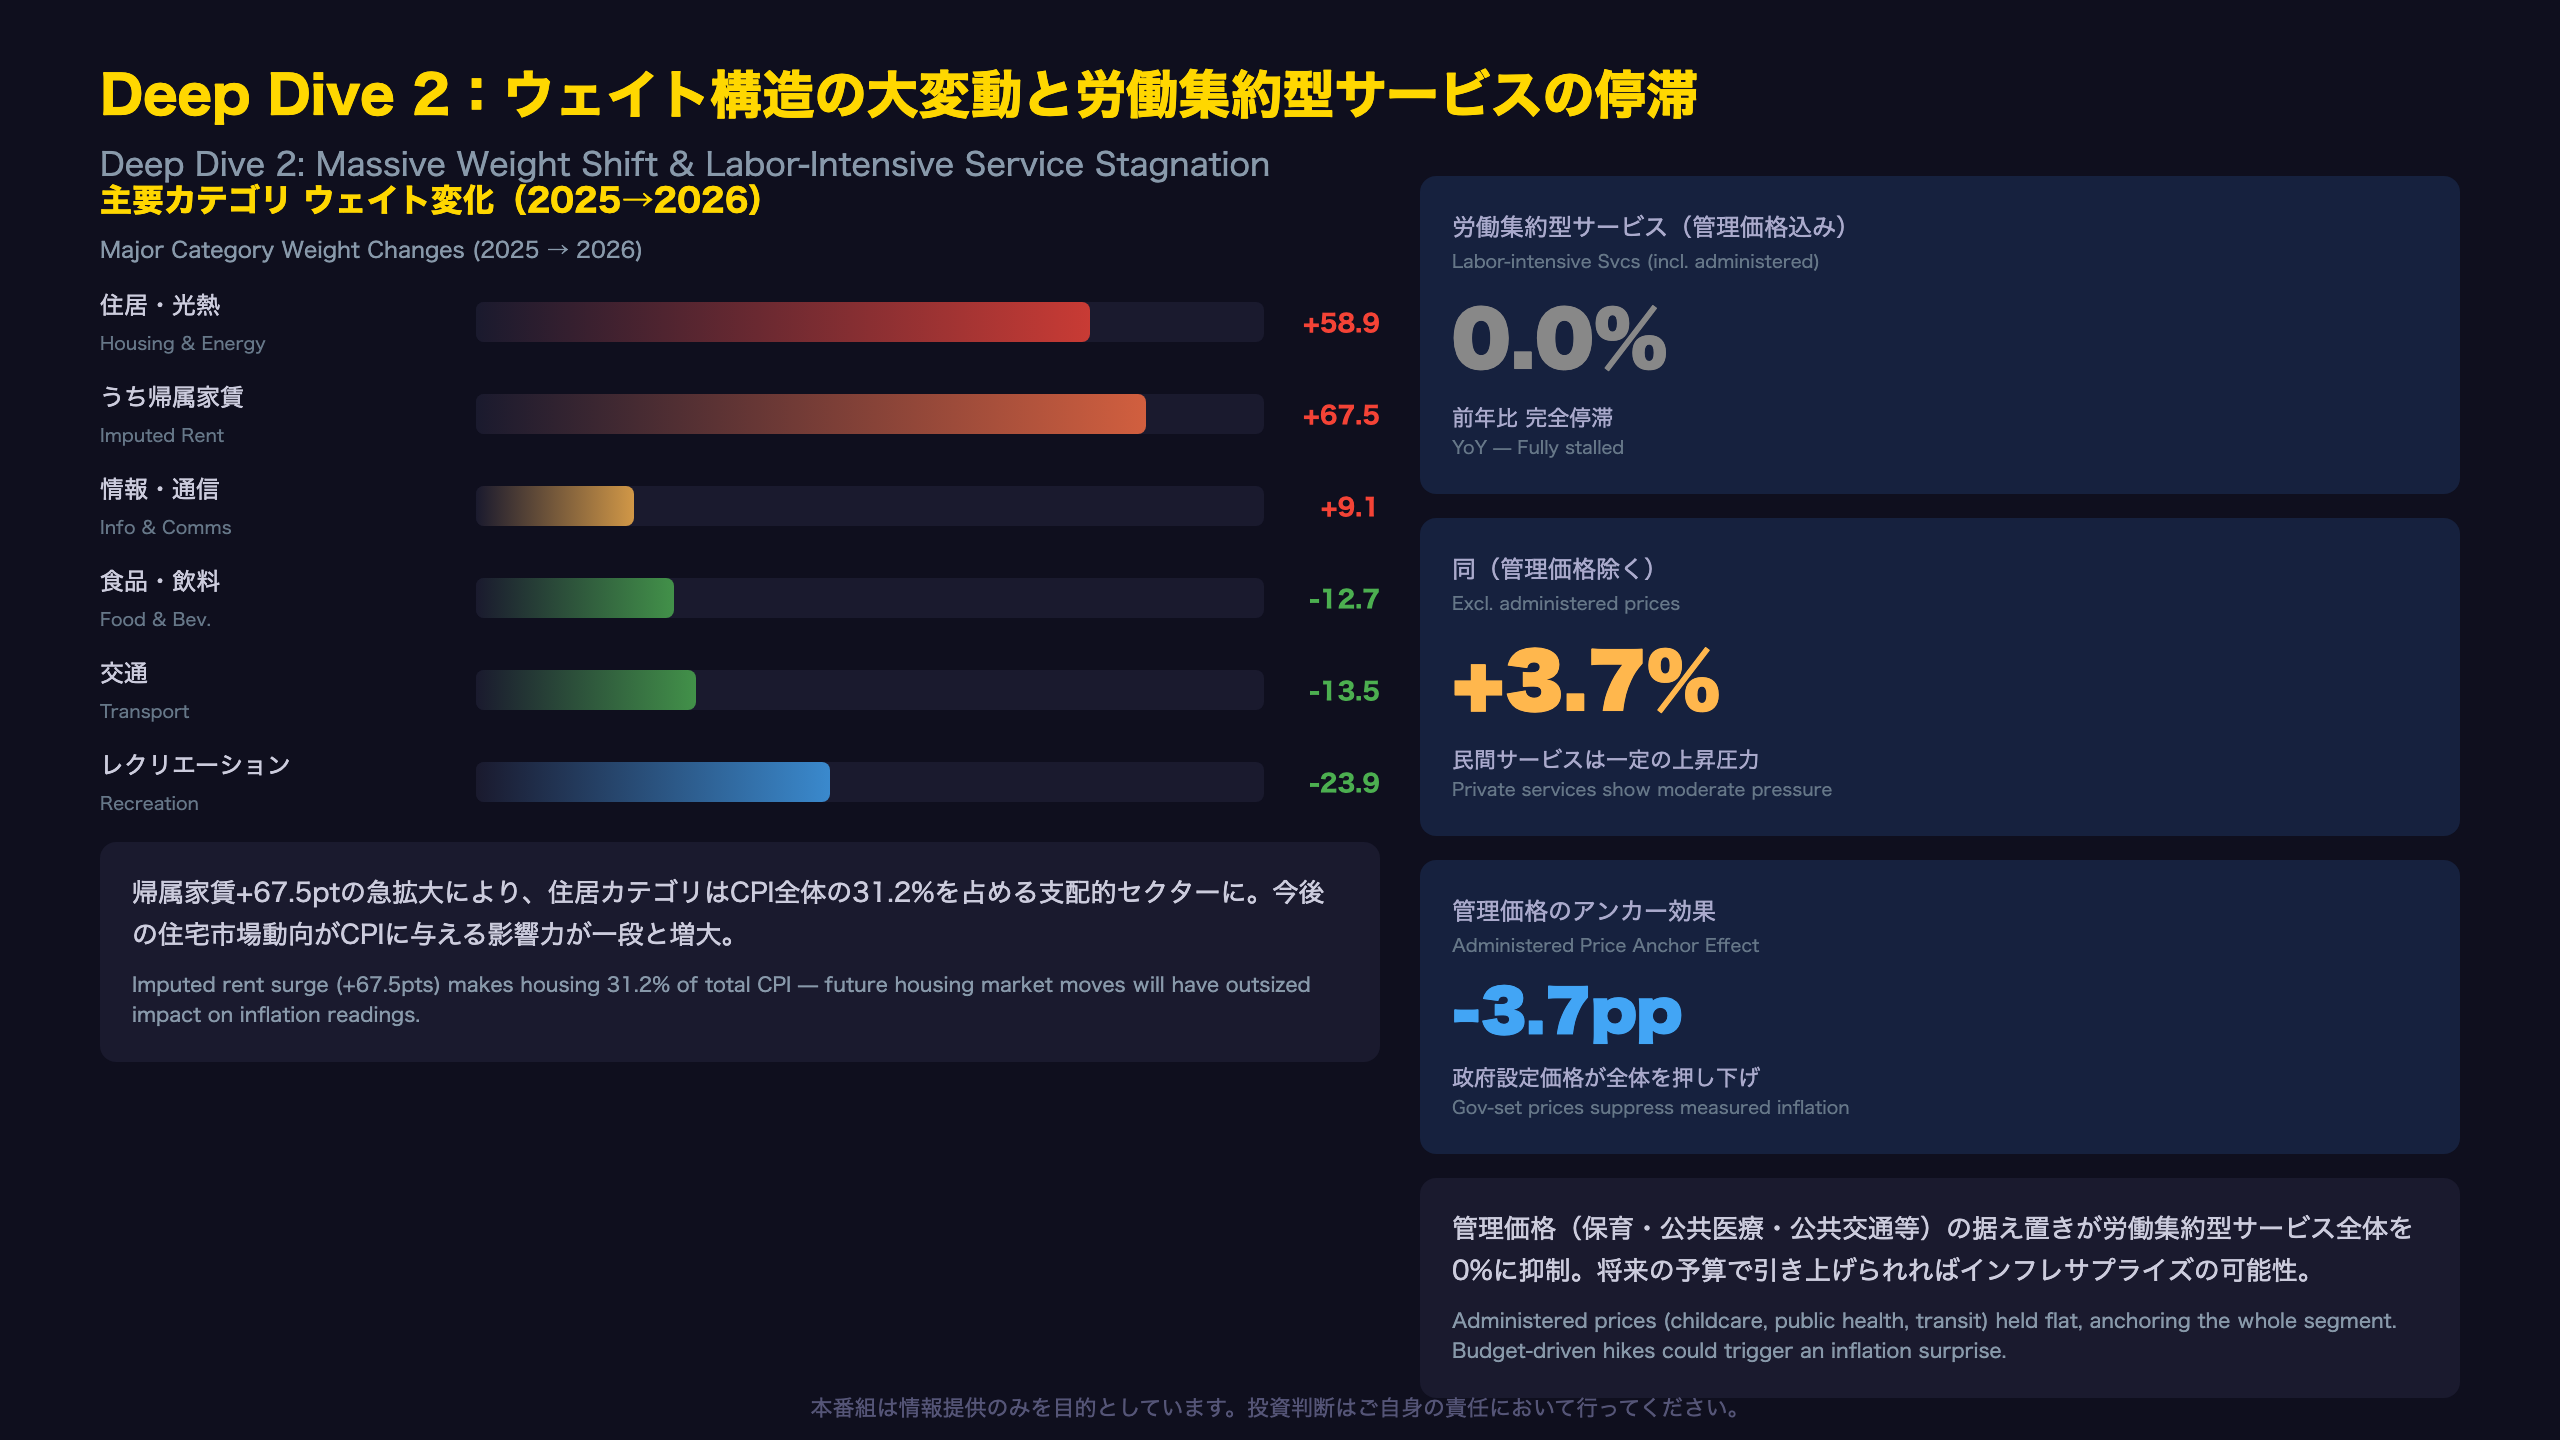
Structural Weight Shift: Housing Now Dominates Norway’s CPI
Major Category Weight Changes
| Category | Jun 2025 | Jun 2026 | Change |
|---|---|---|---|
| Housing, energy | 253.4 | 312.3 | +58.9 |
| — Imputed rent | 138.5 | 206.0 | +67.5 |
| — Actual rent | 46.4 | 49.1 | +2.7 |
| — Electricity/gas | 46.8 | 36.9 | -9.9 |
| Transport | 151.6 | 138.1 | -13.5 |
| Recreation & culture | 108.4 | 84.5 | -23.9 |
| Food & non-alc. bev. | 117.4 | 104.7 | -12.7 |
What Is Imputed Rent?
For international readers: imputed rent is a conceptual measure of what owner-occupiers would pay if they rented their own home. It is included in Norway’s CPI (unlike the eurozone HICP, which excludes owner-occupied housing costs). The +67.5 point weight increase means Norwegian house prices have risen enough to dramatically expand this component’s share of household consumption.
Implication: Housing Is Now 31% of Norway’s CPI
With a weight of 312.3 out of 1000, housing alone accounts for 31.2% of the entire CPI basket. This is significantly higher than most European peers. Any softening in Norwegian house prices or rents will have an outsized disinflationary effect on headline CPI.
Labor-Intensive Services: The Administered Price Anchor
Labor-intensive services (including administered prices) at 0.0% YoY is striking. Excluding administered prices, the figure rises to +3.7%. This gap reveals that government-set prices (childcare, public healthcare, public transport) are acting as a powerful anchor, suppressing measured inflation in this segment. If the government adjusts these administered prices upward in future budgets, it could create an inflation surprise.
Comparison With Eurozone
The eurozone HICP does not include imputed rent (OOH costs are excluded). This means Norway’s CPI structurally runs higher than eurozone HICP when house prices rise. Investors comparing Norwegian inflation to ECB metrics should adjust for this methodological difference.
Deep Dive 3:前月比の季節パターンと情報通信の急落
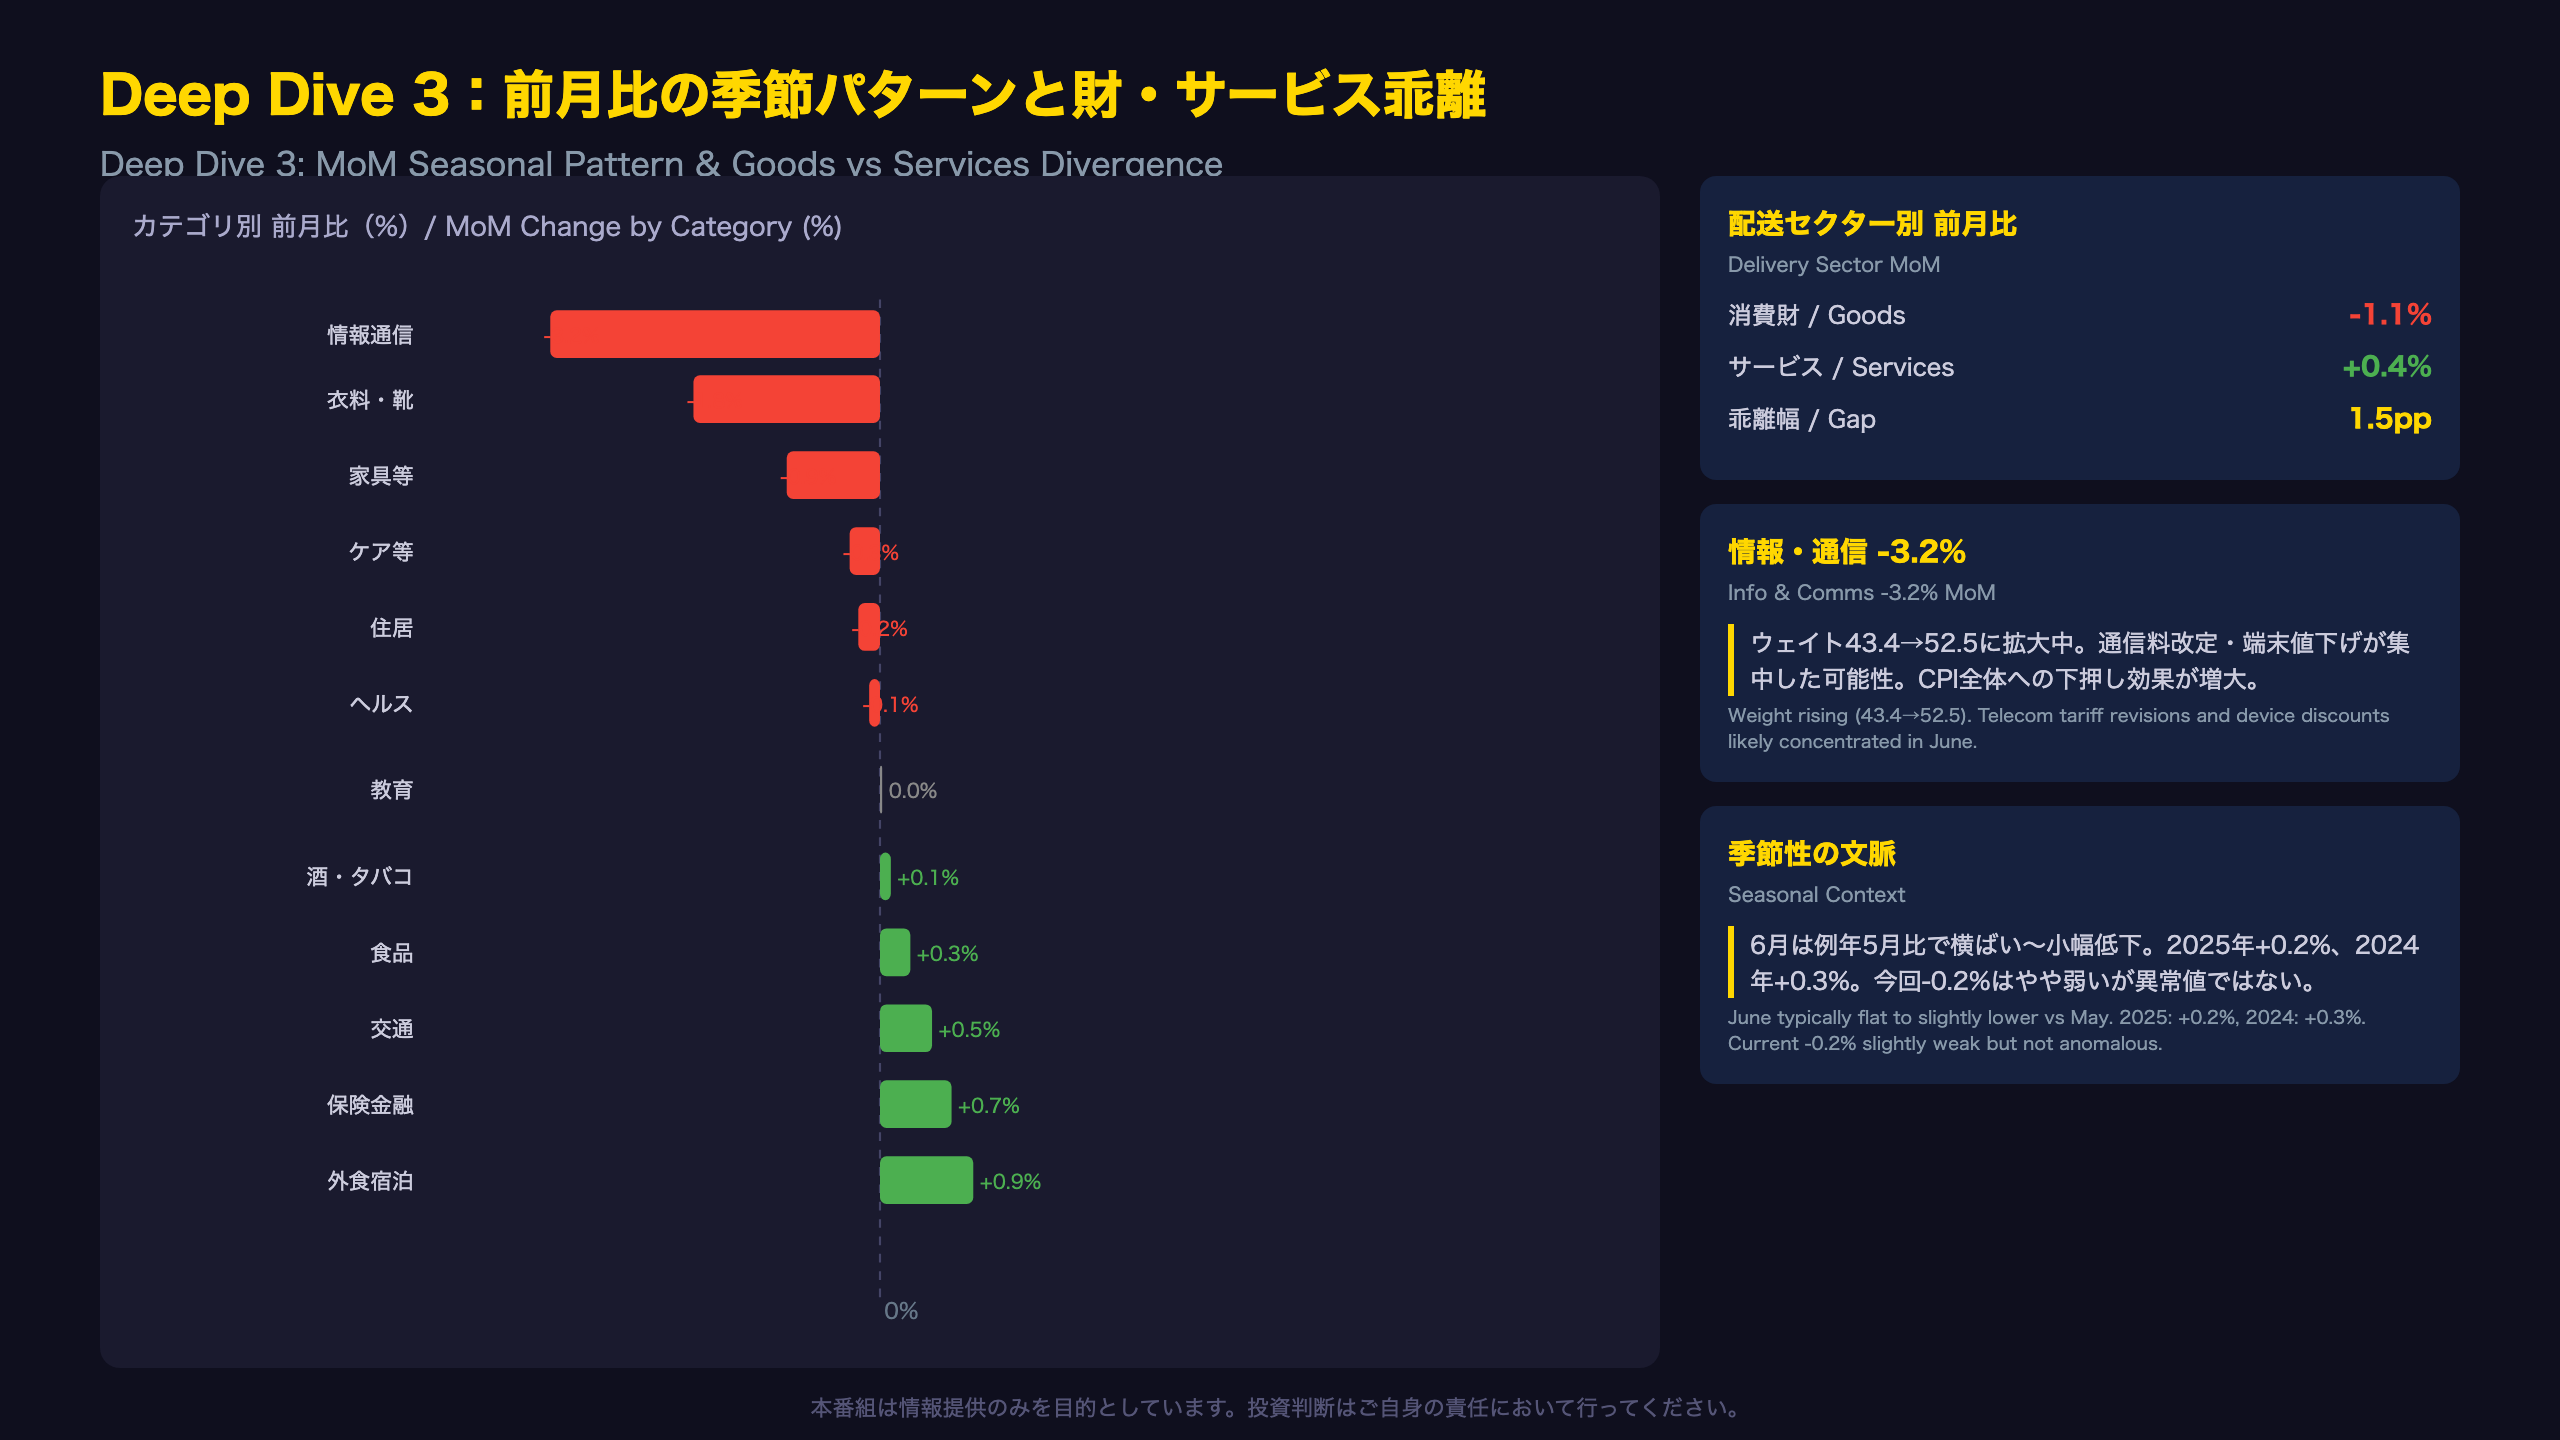
Monthly Dynamics: Goods Deflation vs Services Inflation
MoM Changes by Category (May → June 2026)
| Category | MoM |
|---|---|
| Information & communication | -3.2% |
| Clothing & footwear | -1.8% |
| Furnishings & household | -0.9% |
| Personal care etc. | -0.3% |
| Housing & energy | -0.2% |
| Health | -0.1% |
| Recreation | -0.1% |
| Education | 0.0% |
| Alcohol & tobacco | +0.1% |
| Food & beverages | +0.3% |
| Transport | +0.5% |
| Insurance & finance | +0.7% |
| Restaurants & accommodation | +0.9% |
The -3.2% in Information & Communication
This is the largest single monthly decline across all categories. Norway’s telecom market is competitive, with annual tariff adjustments often concentrated in June. Additionally, consumer electronics (smartphones, tablets) tend to see mid-year price reductions. The weight of this category increased from 43.4 to 52.5, amplifying its impact on headline CPI.
Delivery Sector Split: Two-Speed Economy
| Sector | MoM | YoY |
|---|---|---|
| Consumer goods | -1.1% | +2.7% |
| Services | +0.4% | +2.6% |
Year-on-year rates are nearly identical (+2.7% vs +2.6%), but monthly momentum diverges sharply. Goods are deflating while services continue to inflate — a pattern seen across developed economies but particularly pronounced in Norway.
Seasonal Context
Historically, Norway’s CPI tends to be flat or slightly lower in June versus May. In 2025, the June reading was +0.2% MoM; in 2024, +0.3% MoM. The current -0.2% is slightly weaker than recent years but not anomalous. The seasonal pattern reflects summer sales in clothing and electronics.
Implication for Norges Bank
The monthly data reinforces the narrative that goods disinflation is doing the heavy lifting in keeping headline CPI contained, while services inflation remains sticky. For monetary policy, this means headline CPI could surprise to the upside if goods deflation fades while services maintain their current trajectory.
インプリケーション:Norges Bankの利下げパスとNOKへの示唆
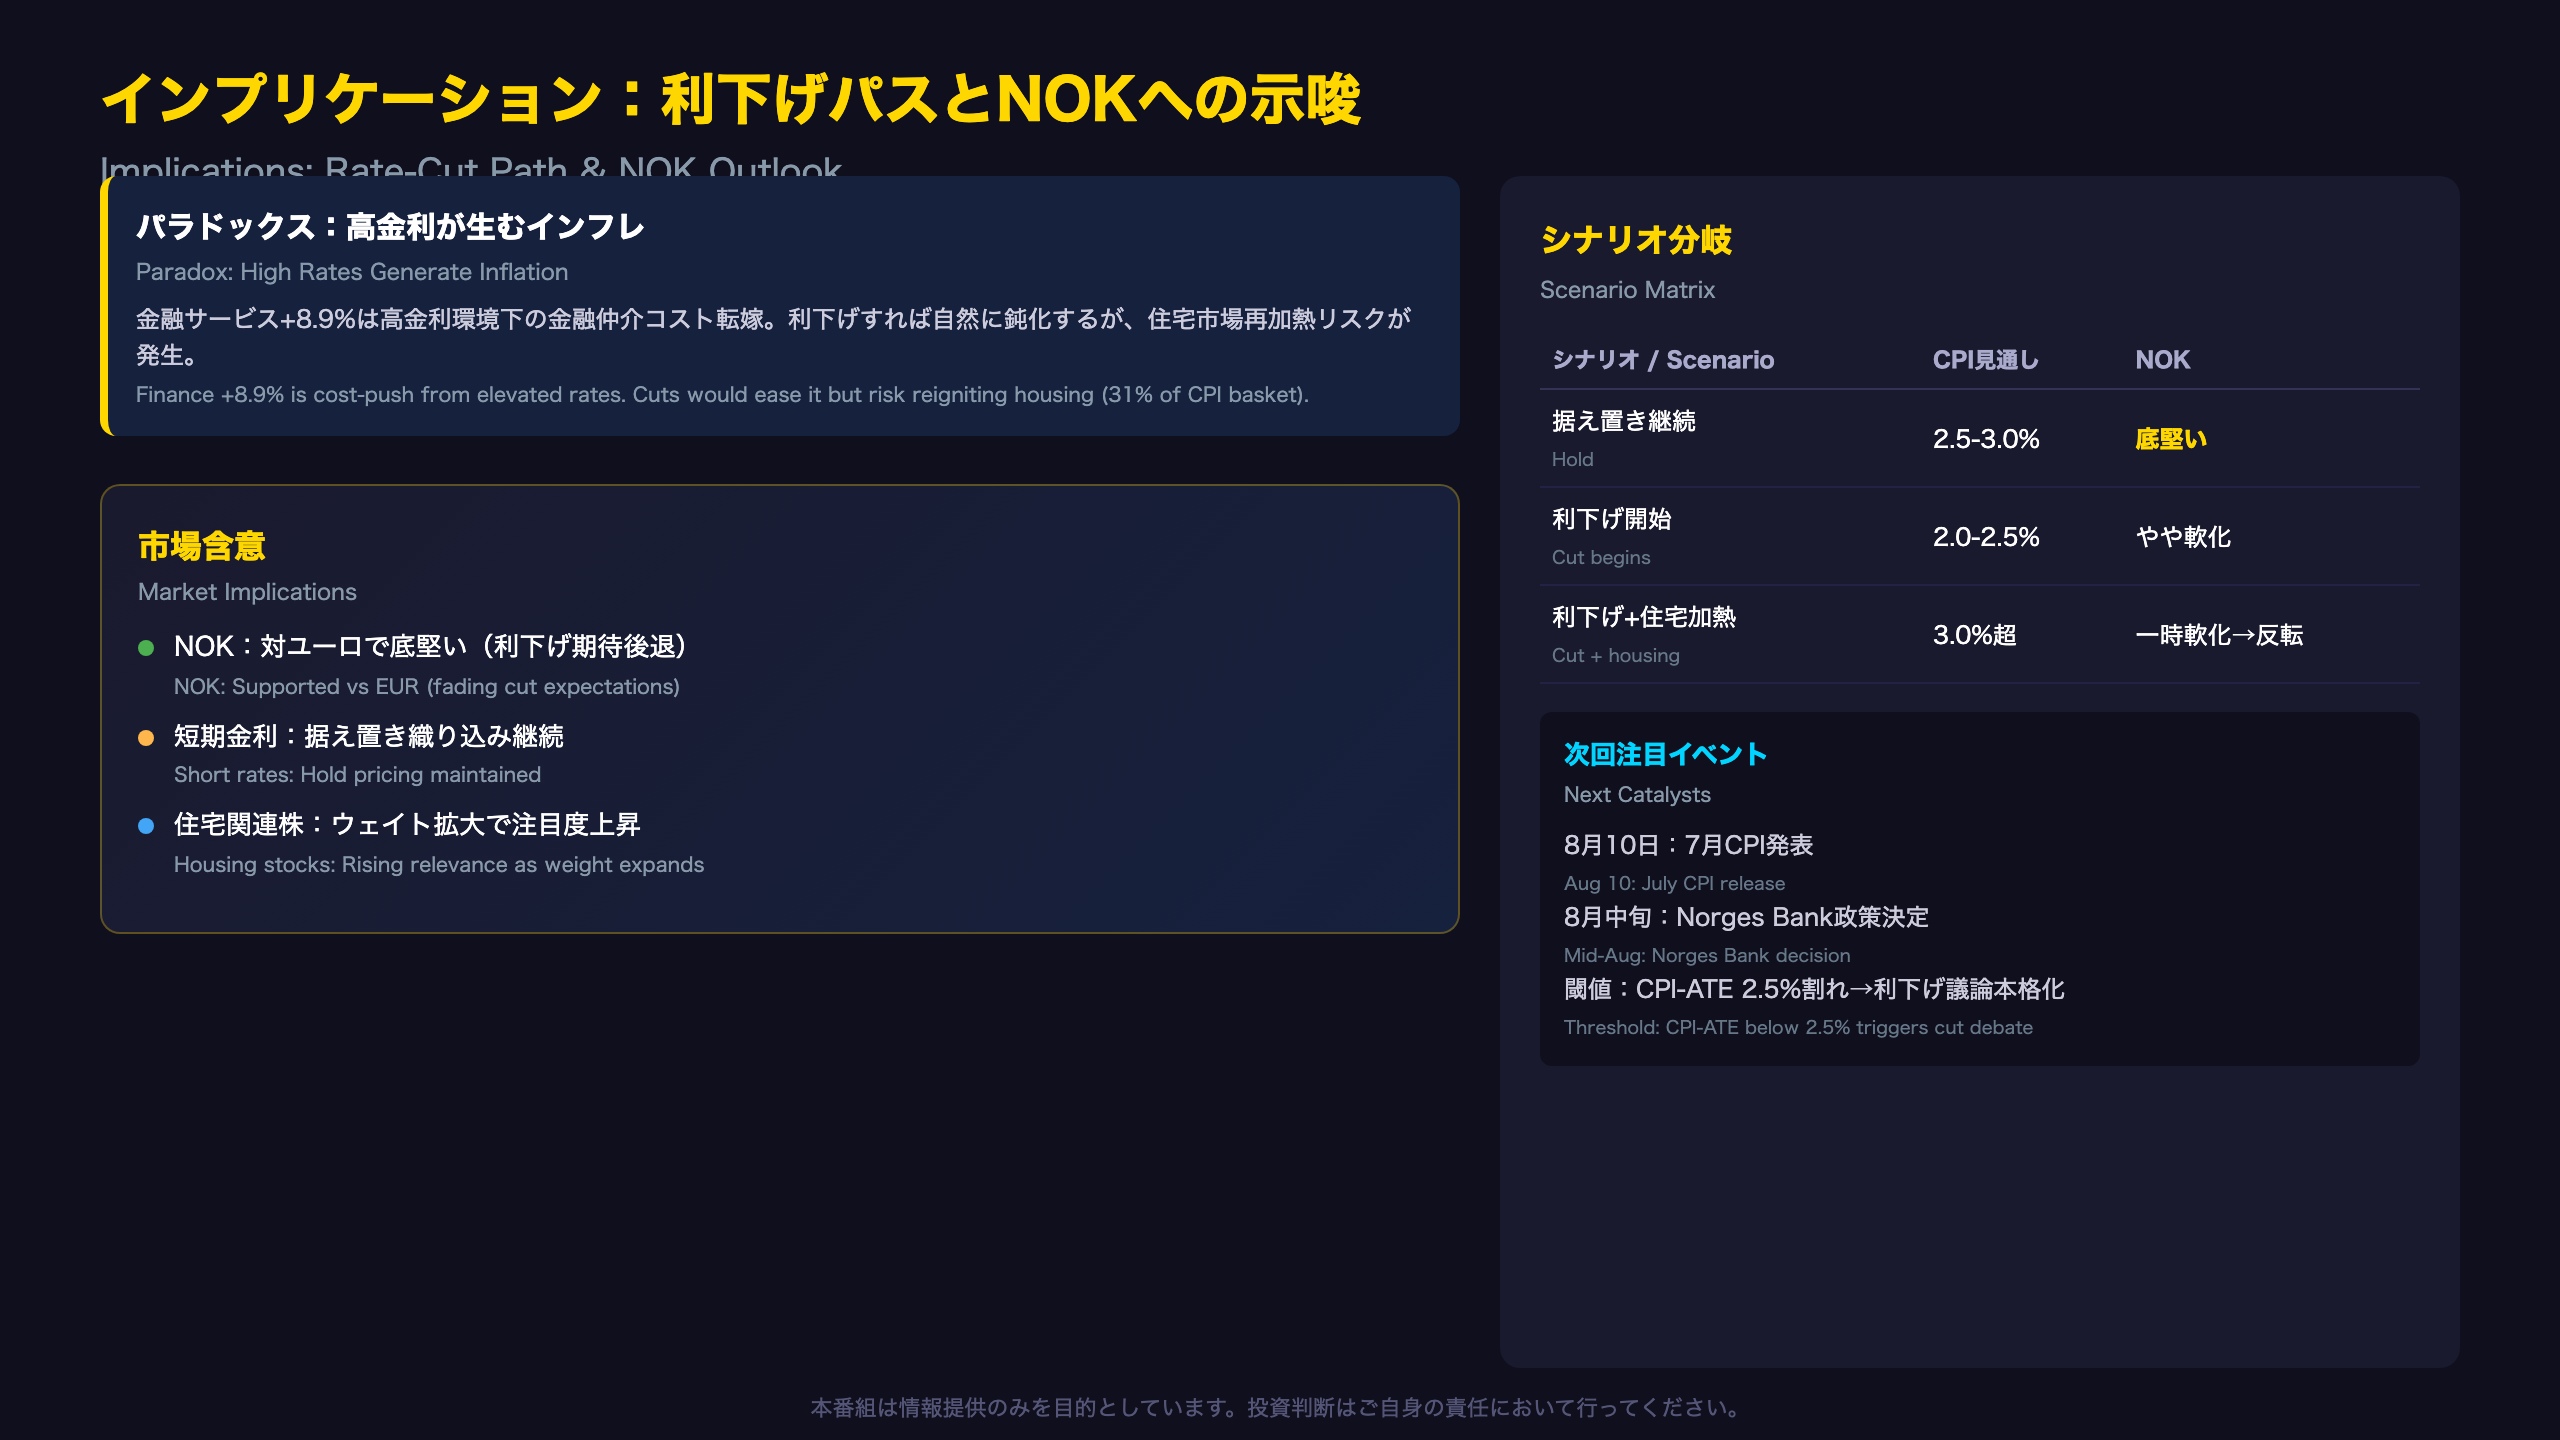
Norges Bank’s Policy Dilemma: The Rate-Inflation Paradox
How High Rates Generate Their Own Inflation
The +8.9% surge in insurance and financial services is not demand-driven inflation in the traditional sense. It is a cost-push phenomenon where elevated policy rates increase financial intermediation costs, which are then passed to households. This creates a paradox: keeping rates high to fight inflation actually generates inflation in one specific sector.
Scenario Analysis
| Scenario | Condition | CPI Outlook | NOK Outlook |
|---|---|---|---|
| Hold rates | Finance CPI stays elevated | 2.5-3.0% range | Supported |
| Cut rates | Finance eases + housing stable | Falls to 2.0-2.5% | Modest softening |
| Cut + housing reheats | Imputed rent surges | Could exceed 3.0% | Temporary weakness then reversal |
Key Threshold for Rate Cuts
If CPI-ATE falls below 2.5% in coming months, rate-cut discussions will intensify. If it rises above 3.0%, a hold is virtually certain. The current 2.7% reading sits in the ambiguous zone.
Administered Price Risk
Norway’s 2027 budget discussions (beginning in autumn 2026) could include increases in childcare fees, public transport fares, and healthcare co-payments. These administered prices currently suppress labor-intensive services inflation to 0.0%. Any upward adjustment would create an inflation surprise that markets are not pricing.
NOK Positioning
For FX traders, the key takeaway is that Norway’s inflation structure does not support aggressive rate cuts. The krone should remain supported versus the euro and Swedish krona as long as Norges Bank maintains its cautious stance. The interest rate differential with the ECB (which has already cut) favors NOK carry.
Next Catalysts
- August 10: July CPI release — watch insurance & finance trajectory
- Mid-August: Norges Bank monetary policy decision
- Autumn 2026: Budget discussions — administered price risk emerges
Disclaimer: This article is for informational purposes only. All investment decisions are made solely at your own risk.