📺 Watch the Full Video Analysis
This article was automatically generated by the NFC Market Live AI analysis system. (Updated: 2026-09-01 14:09 JST)
📄 Primary Source
内閣府経済社会総合研究所
https://www.esri.cao.go.jp/jp/stat/shouhi/gaiyou.pdf, https://www.esri.cao.go.jp/jp/stat/shouhi/honbun.pdf
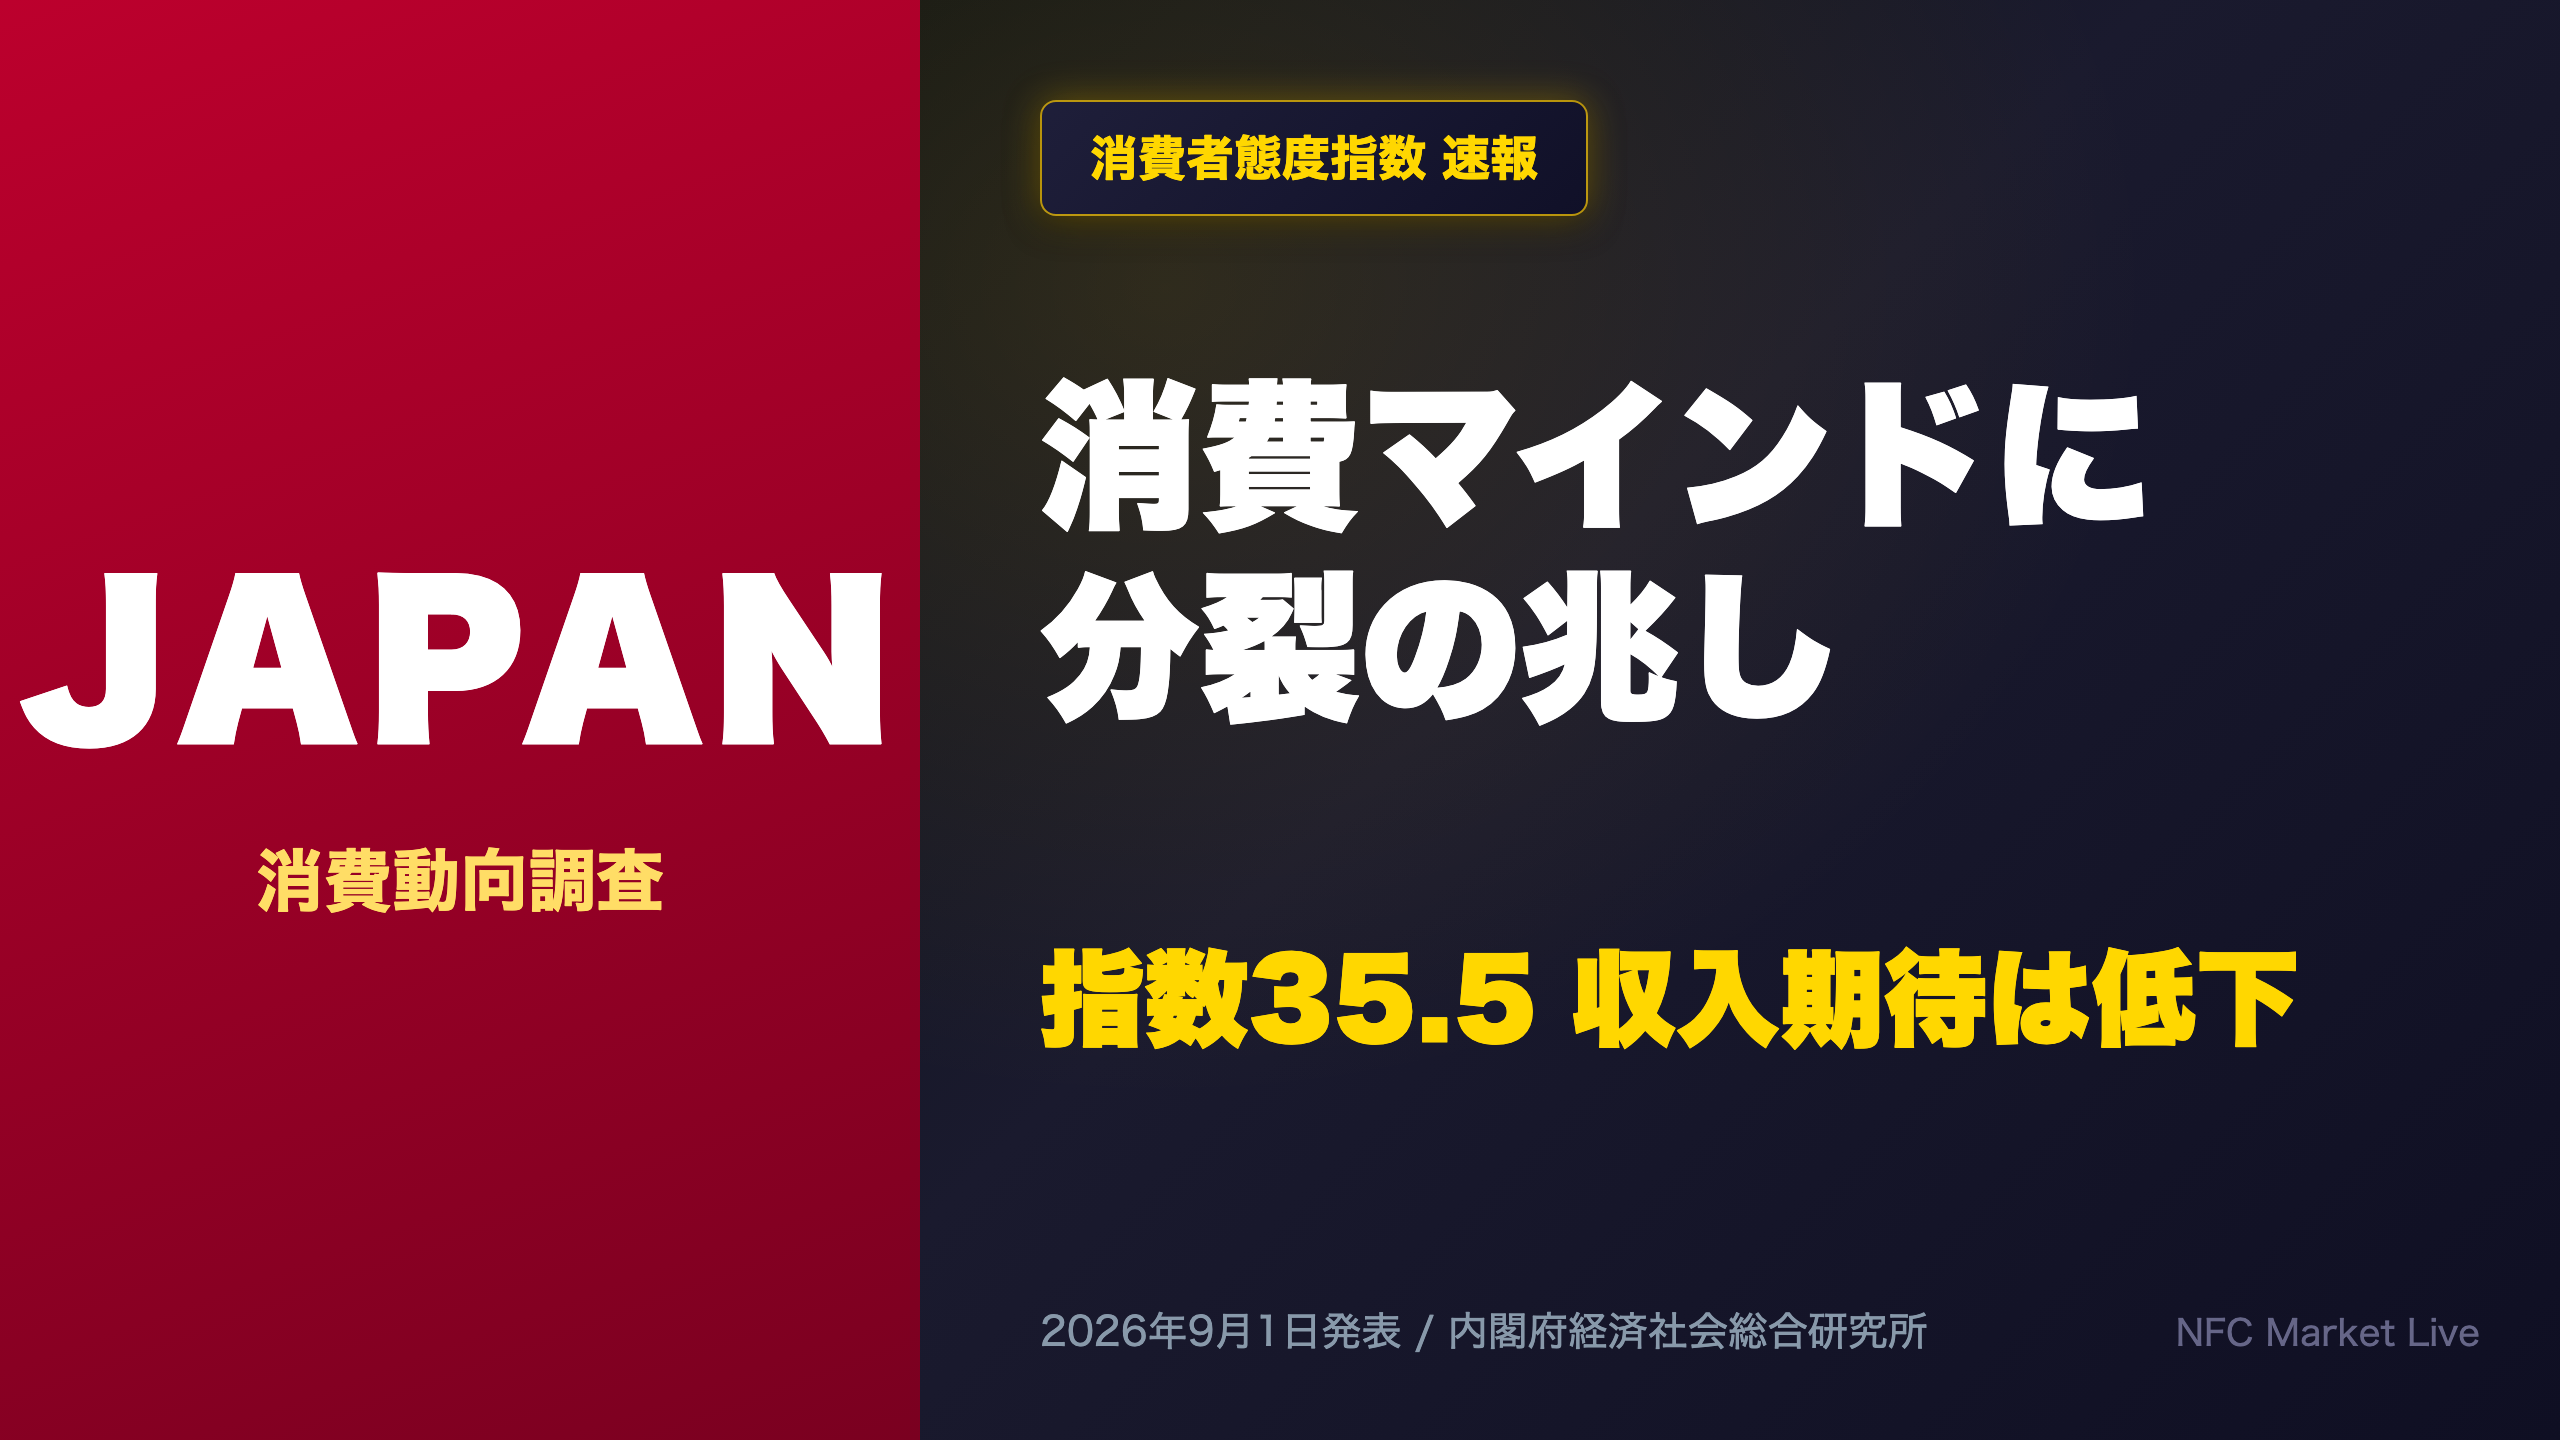
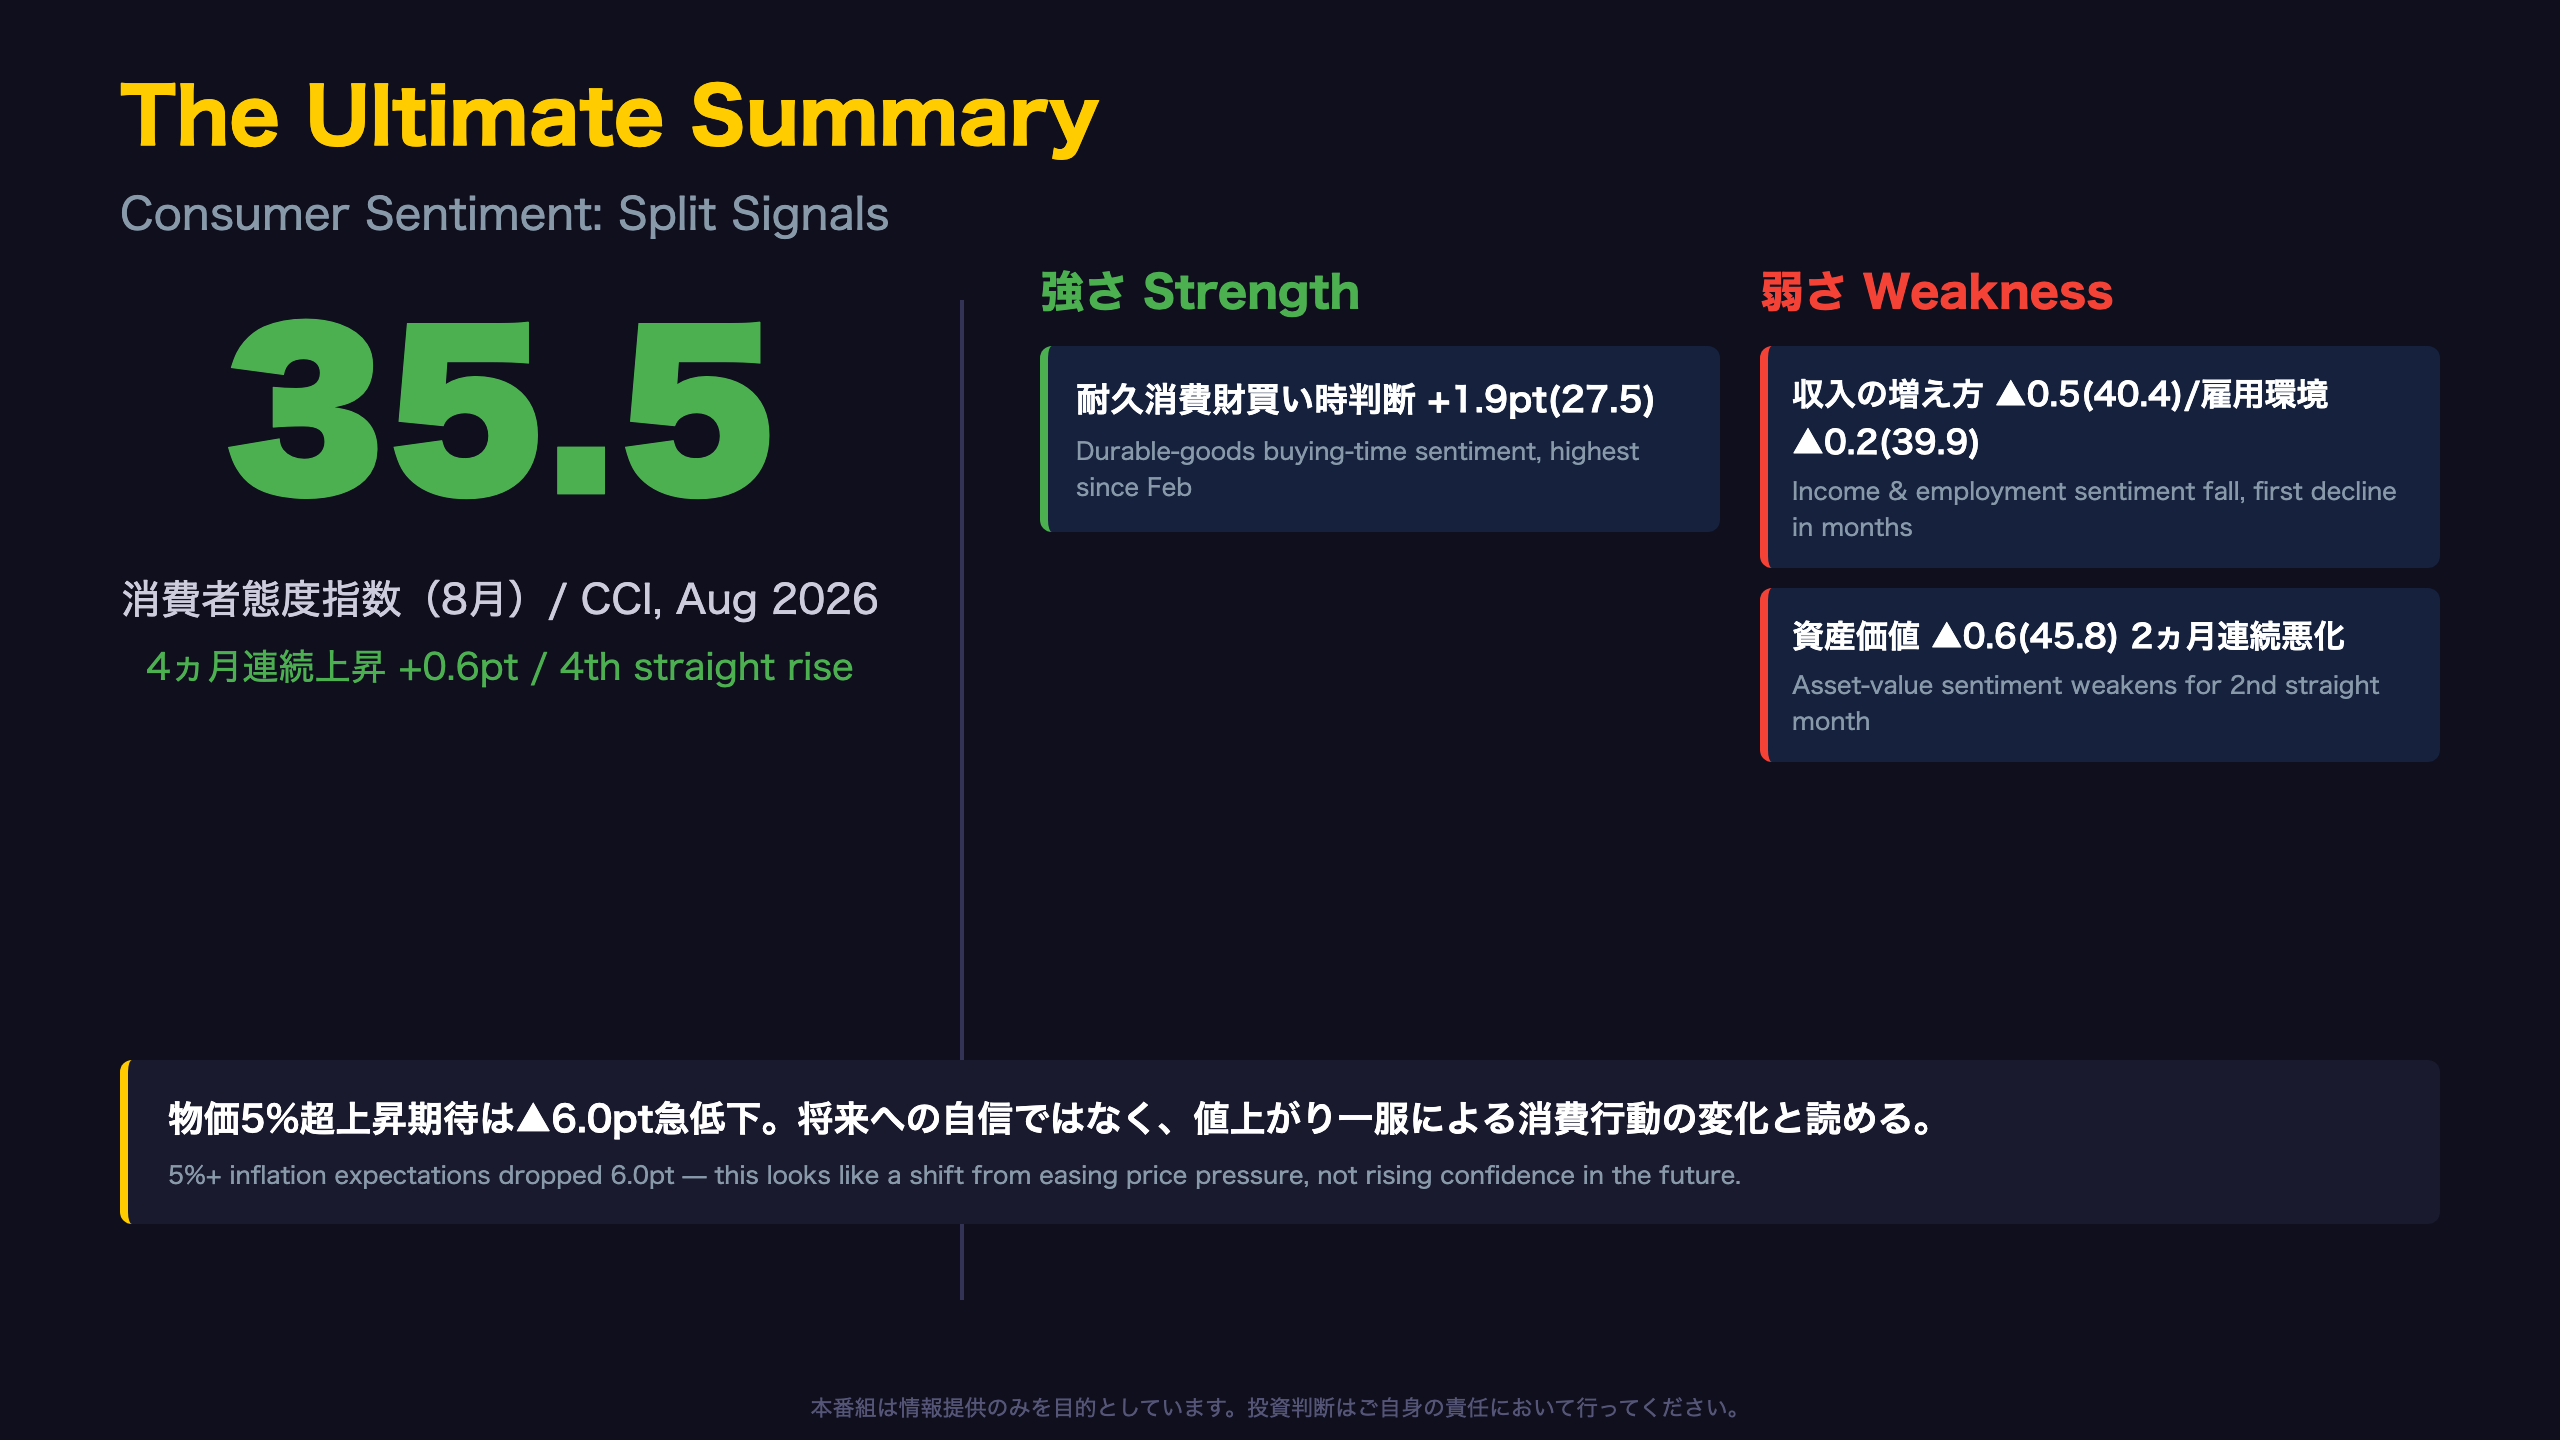
📊 Japan’s Cabinet Office reported the Consumer Confidence Index rose to 35.5 in August, up 0.6pt for a 4th straight month.
📈 The durable-goods buying-time sub-index jumped 1.9pt to its highest since February.
📉 But income growth and employment expectations both declined for the first time in months. Expectations for 5%+ inflation plunged 6.0pt.
💡 We break down the split between headline improvement and internal cracks, plus what it means for BOJ policy and consumer stocks.
⚠️ Next release (September data) is due early October — watch whether income/employment sentiment rebounds.
The Ultimate Summary:消費マインドの分裂
Beyond the Headline
Japan’s Consumer Confidence Index (seasonally adjusted), compiled by the Cabinet Office’s Economic and Social Research Institute (ESRI) from the monthly Consumer Confidence Survey (Shohi Doko Chosa), rose to 35.5 in August 2026 — a fourth consecutive monthly gain from April’s low of 32.2. Notably, the government kept its qualitative assessment (“kicho hanteil”) unchanged at “showing signs of picking up,” a step down in momentum from July’s upward revision.
Context for International Readers
Unlike the University of Michigan Consumer Sentiment Index in the US, Japan’s CCI is built from five 5-point-scale questions (living standards, income growth, employment, durable-goods timing, and asset values), with the headline figure averaging the first four.
The Internal Split
The biggest story here isn’t the headline — it’s the divergence. Durable-goods buying-time sentiment jumped 1.9pt, driving the index higher, while income growth (-0.5) and employment sentiment (-0.2) fell for the first time in months.
Per the official release: “Income growth fell 0.5pt to 40.4; employment environment fell 0.2pt to 39.9.”
Bullish reading: stronger real purchase intent. Bearish reading: consumption is running ahead of income confidence. Watch September data for a reversal signal.
総合指数:4ヵ月連続上昇もペース鈍化
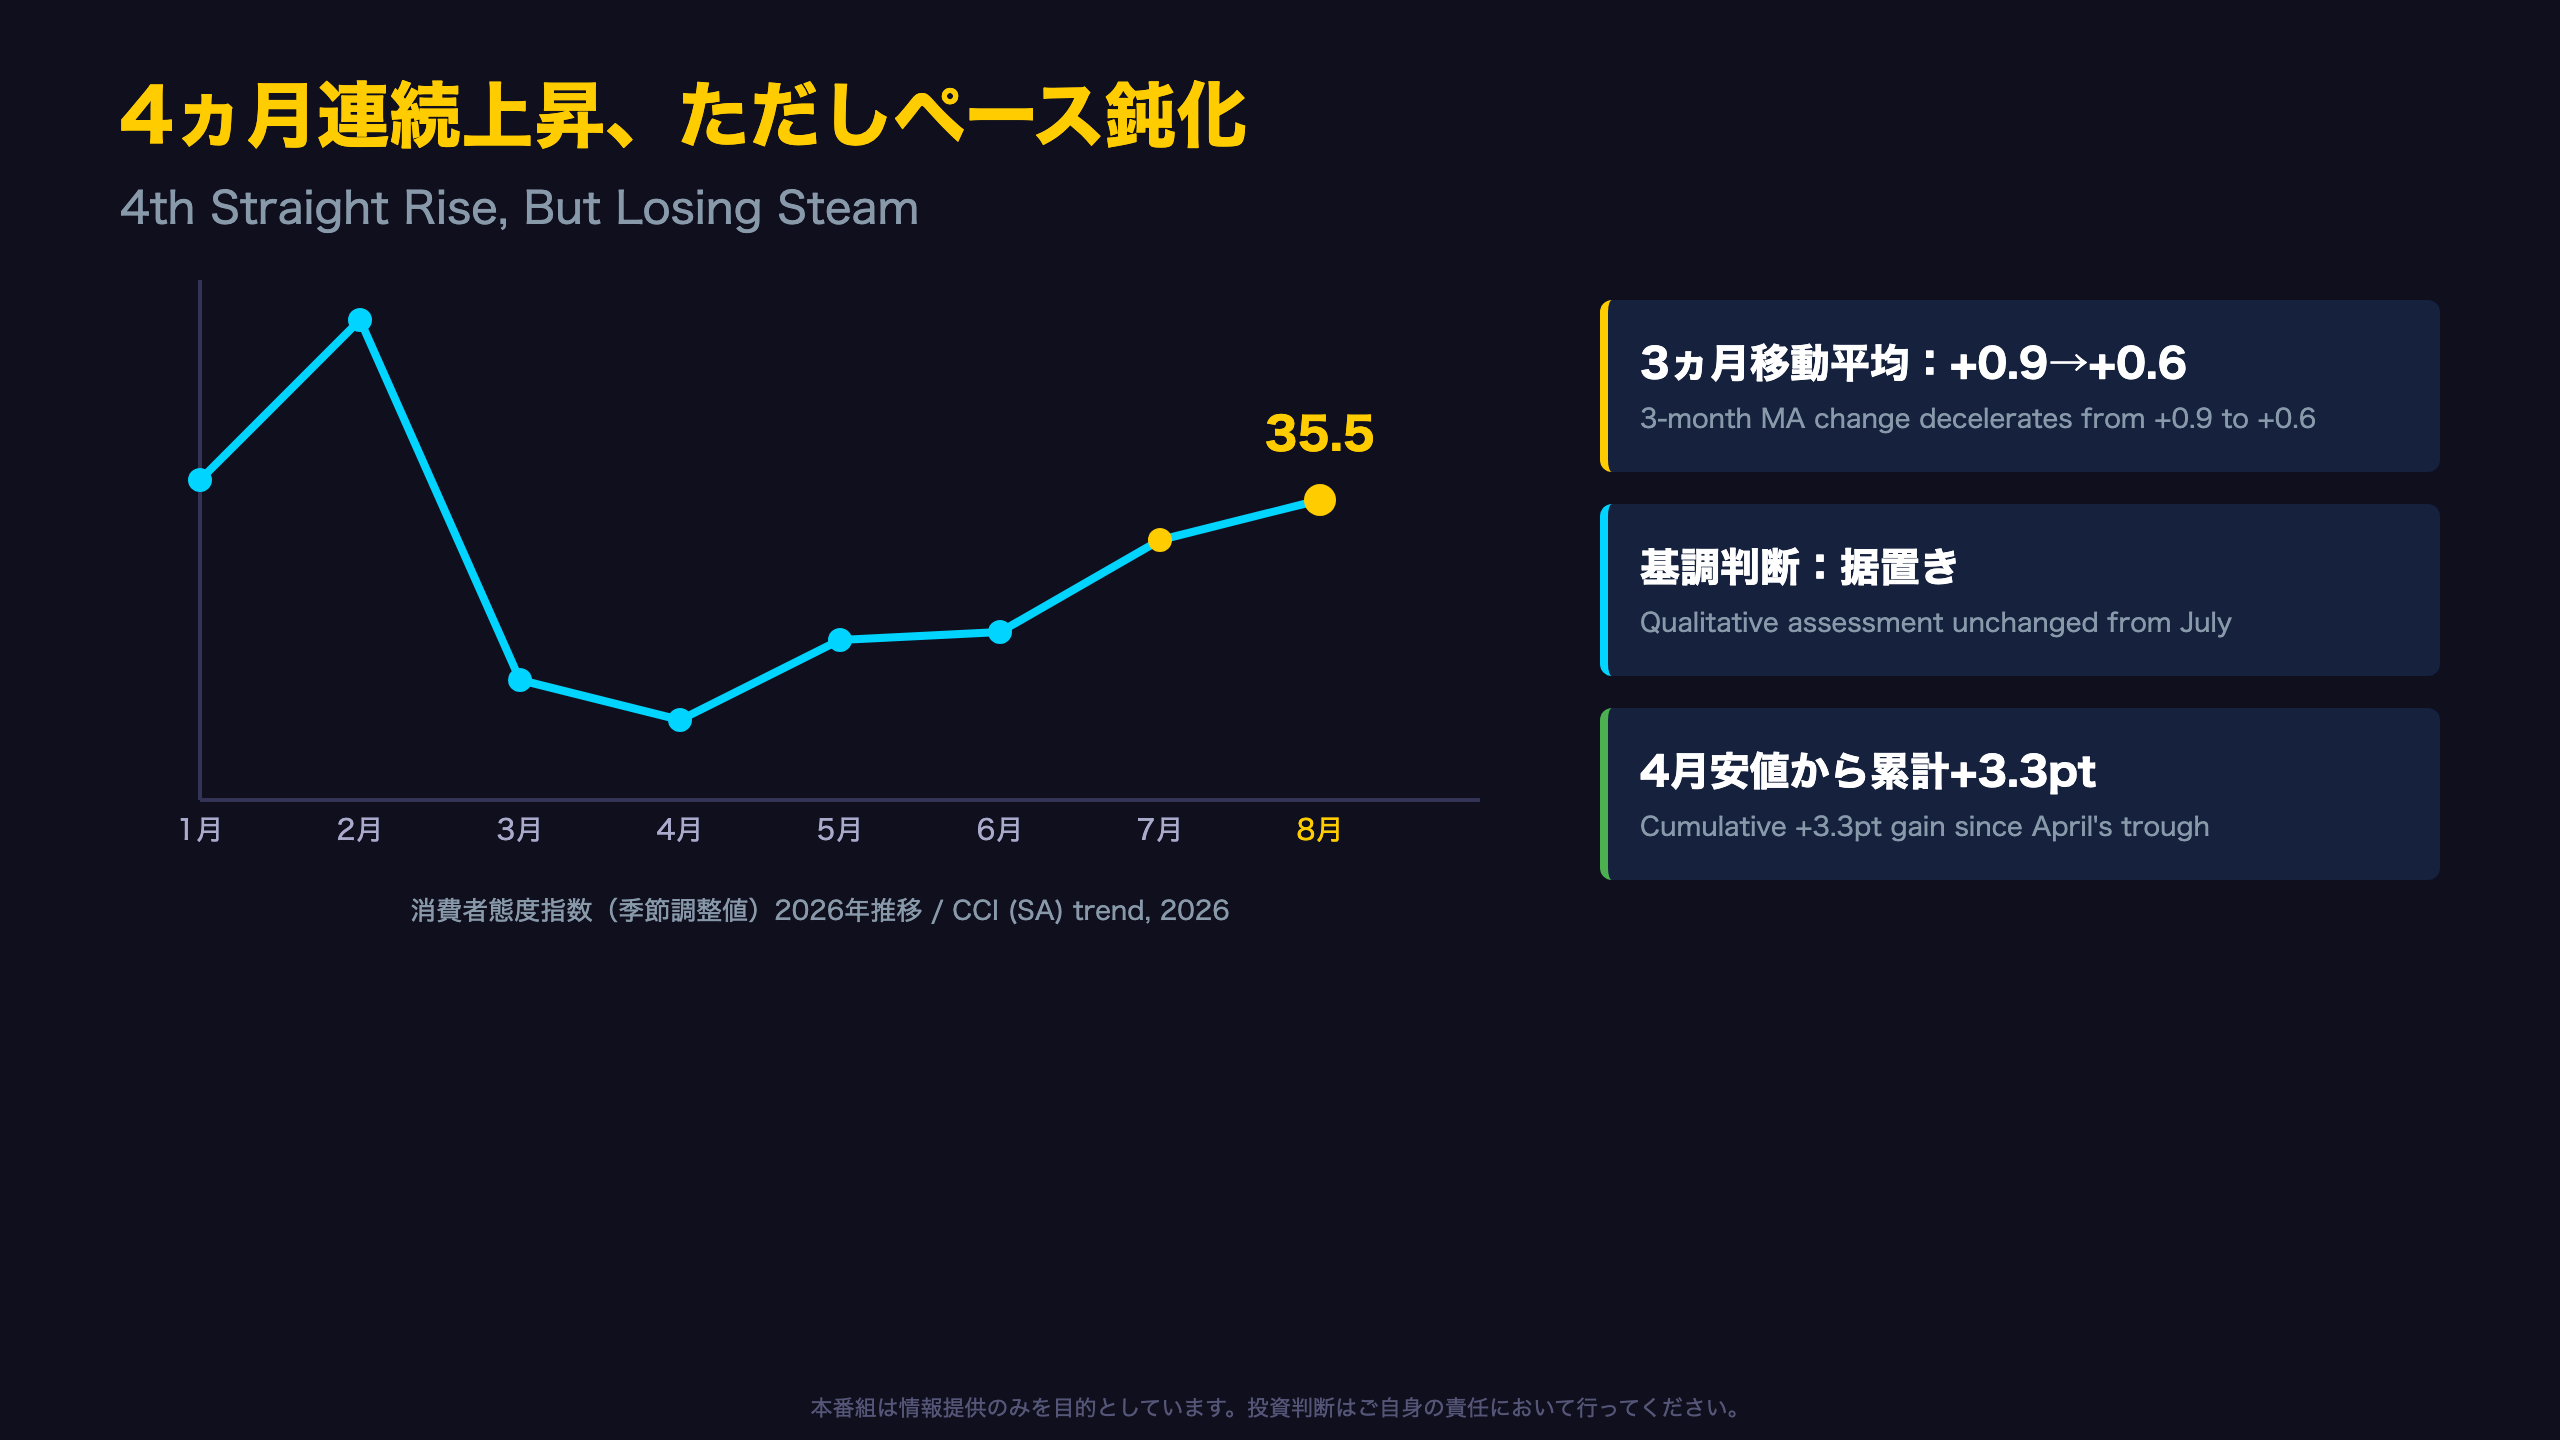
Gauging the Momentum
Japan’s Consumer Confidence Index climbed 0.6pt to 35.5 in August, extending a streak that began in April at a trough of 32.2 — a cumulative gain of 3.3 points over four months.
What the Moving Average Reveals
Looking beyond the single-month change, the three-month moving average of the change slowed to +0.6 in August from +0.9 in July. This doesn’t mean the recovery reversed, but it does suggest the pace of improvement is cooling.
Why the Qualitative Assessment Matters
ESRI’s report retained its qualitative judgment — “showing signs of picking up” — unchanged from July, after it had been upgraded from “weakening” the prior month. In Japan’s survey methodology, these qualitative labels (similar to how the Fed’s Beige Book characterizes regional conditions) are watched closely by analysts as a shorthand for momentum, and the lack of a further upgrade corroborates the deceleration.
Historical Context
At 35.5, the index sits close to September 2025’s 35.4, placing it mid-range within the roughly 33-37 band seen over the past year — not yet a decisive breakout. Still, four consecutive monthly gains do confirm resilience following April’s sharp drop, suggesting the downside break was arrested rather than becoming entrenched.
意識指標の分解:買い時判断 vs 収入・雇用
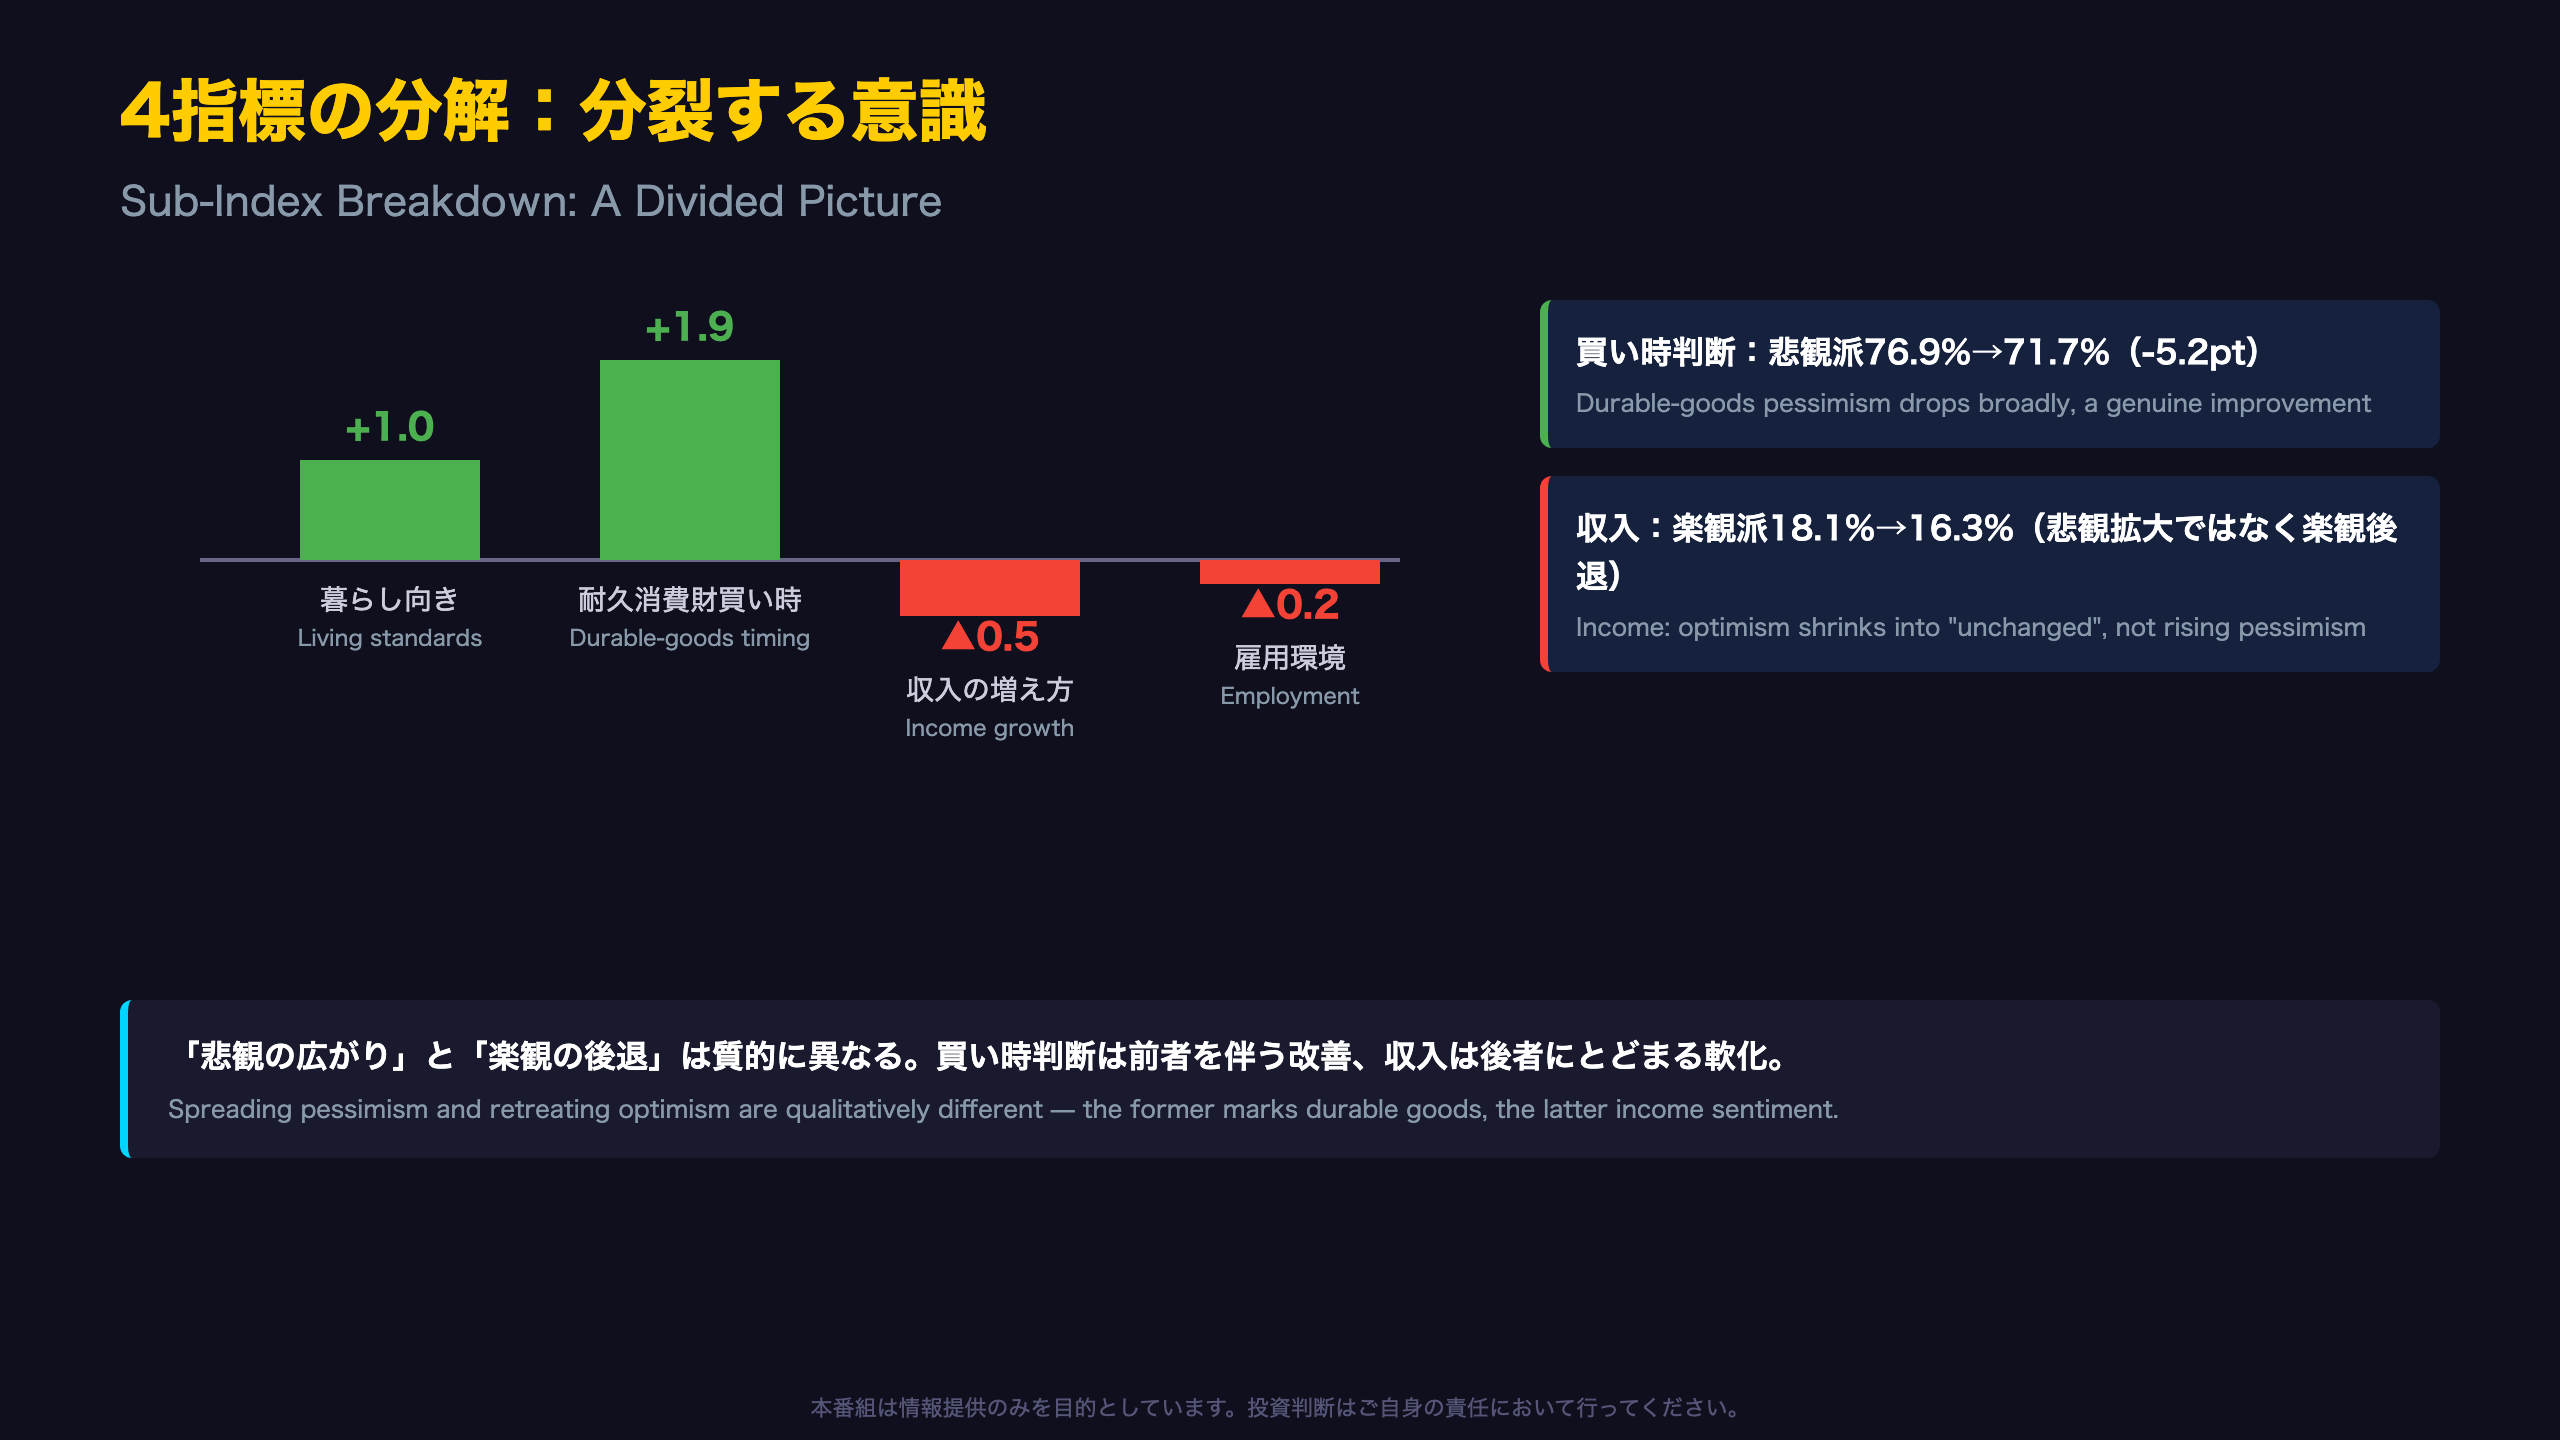
Distribution Analysis: Two Different Kinds of Change
The headline sub-index moves in August mask an important qualitative distinction visible only in the underlying response distributions (“kaito kubun betsu koseihi”) published by ESRI.
Durable Goods: A Broad-Based Improvement
For durable-goods buying-time sentiment, the pessimistic share (“somewhat worse” + “worse”) fell a combined 5.2 points, from 76.9% to 71.7%, while the optimistic share edged up from 2.4% to 3.0%. This is a textbook improvement pattern — pessimism shrinking as optimism grows — and it lifted the sub-index to 27.5, its highest since February 2026 (33.7).
Income Growth: Optimism Retreating, Not Pessimism Rising
By contrast, income-growth sentiment tells a different story. The optimistic share fell from 18.1% to 16.3%, but the pessimistic share was essentially flat (31.8% → 31.7%). The real mover was the “unchanged” bucket, which rose from 61.0% to 62.8%.
This distinction matters: a retreat of optimism into a “wait-and-see” stance is a materially different — and less alarming — signal than a genuine broadening of pessimism.
Employment sentiment showed a similarly mild softening (optimistic share roughly flat, pessimistic share up slightly to 39.1%). For US-based readers, this parallels the distinction between a fall in the University of Michigan’s “current conditions” versus “expectations” components — the composition of a sentiment change often matters more than the headline print itself.
物価見通しの後退:インフレ期待クールダウン
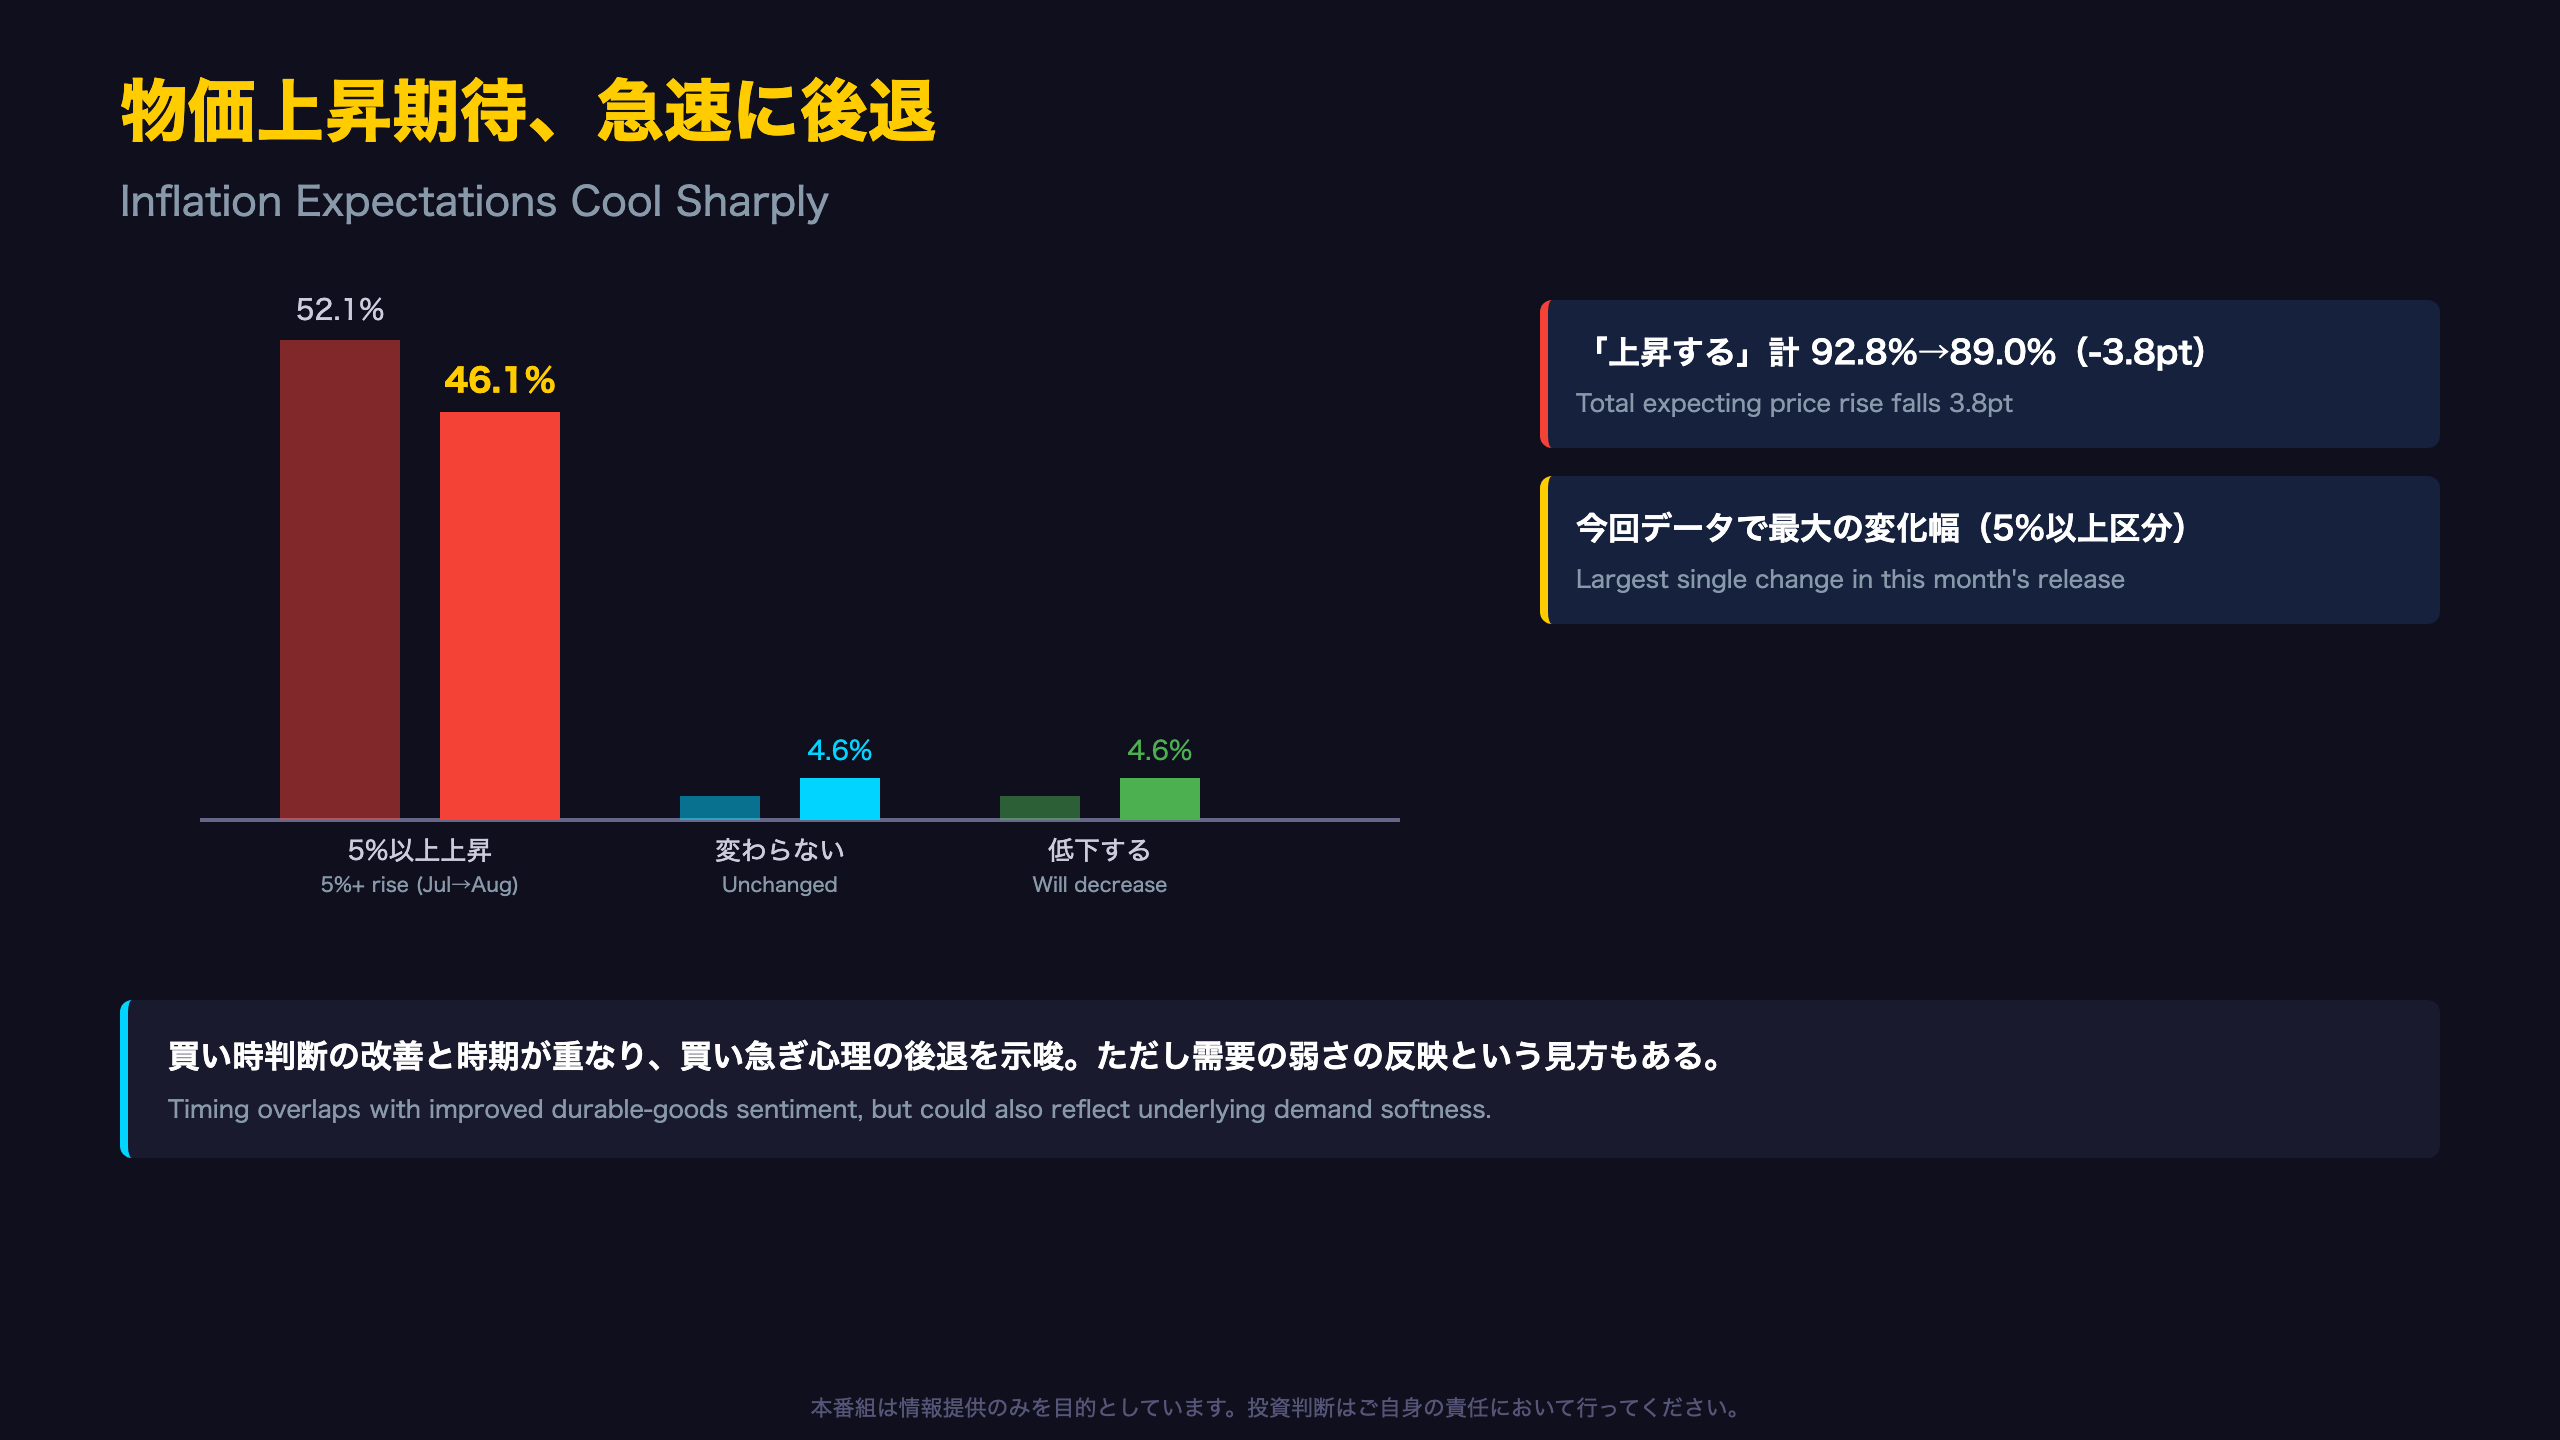
A Quiet Turn in Inflation Expectations
The most striking single data point in August’s survey is the share of households expecting prices to rise 5% or more over the next year, which fell from 52.1% to 46.1% — a 6.0-point drop that stands out even against this series’ typically volatile history.
How the Distribution Shifted
The total share expecting any price increase fell 3.8 points, from 92.8% to 89.0%. The slack was absorbed by both the “unchanged” (2.9% → 4.6%) and “will decrease” (2.5% → 4.6%) categories, up 1.7 and 2.1 points respectively.
Per the official release: “month-on-month, ‘unchanged’ rose 0.4pt and ‘will decrease’ rose 0.3pt, while ‘will rise’ fell 0.5pt” — note this figure reflects the aggregated year-on-year comparison table; the 5%-plus bucket alone moved a much larger 6.0 points.
Two Readings
Bullish read: Easing fear of runaway prices reduces real-purchasing-power anxiety, lowering the psychological barrier to big-ticket purchases — consistent with the concurrent rise in durable-goods buying-time sentiment.
Bearish read: A retreat in inflation expectations can also reflect underlying demand softness, so it should not be read purely as good news.
What to Watch Next
This series is historically volatile month to month, so confirmation from the September release will be key. For readers familiar with the US Michigan or NY Fed inflation expectation surveys, this kind of single-month swing warrants caution before drawing conclusions about the BOJ’s inflation narrative.
資産価値の分岐:ウェルスエフェクトの陰り
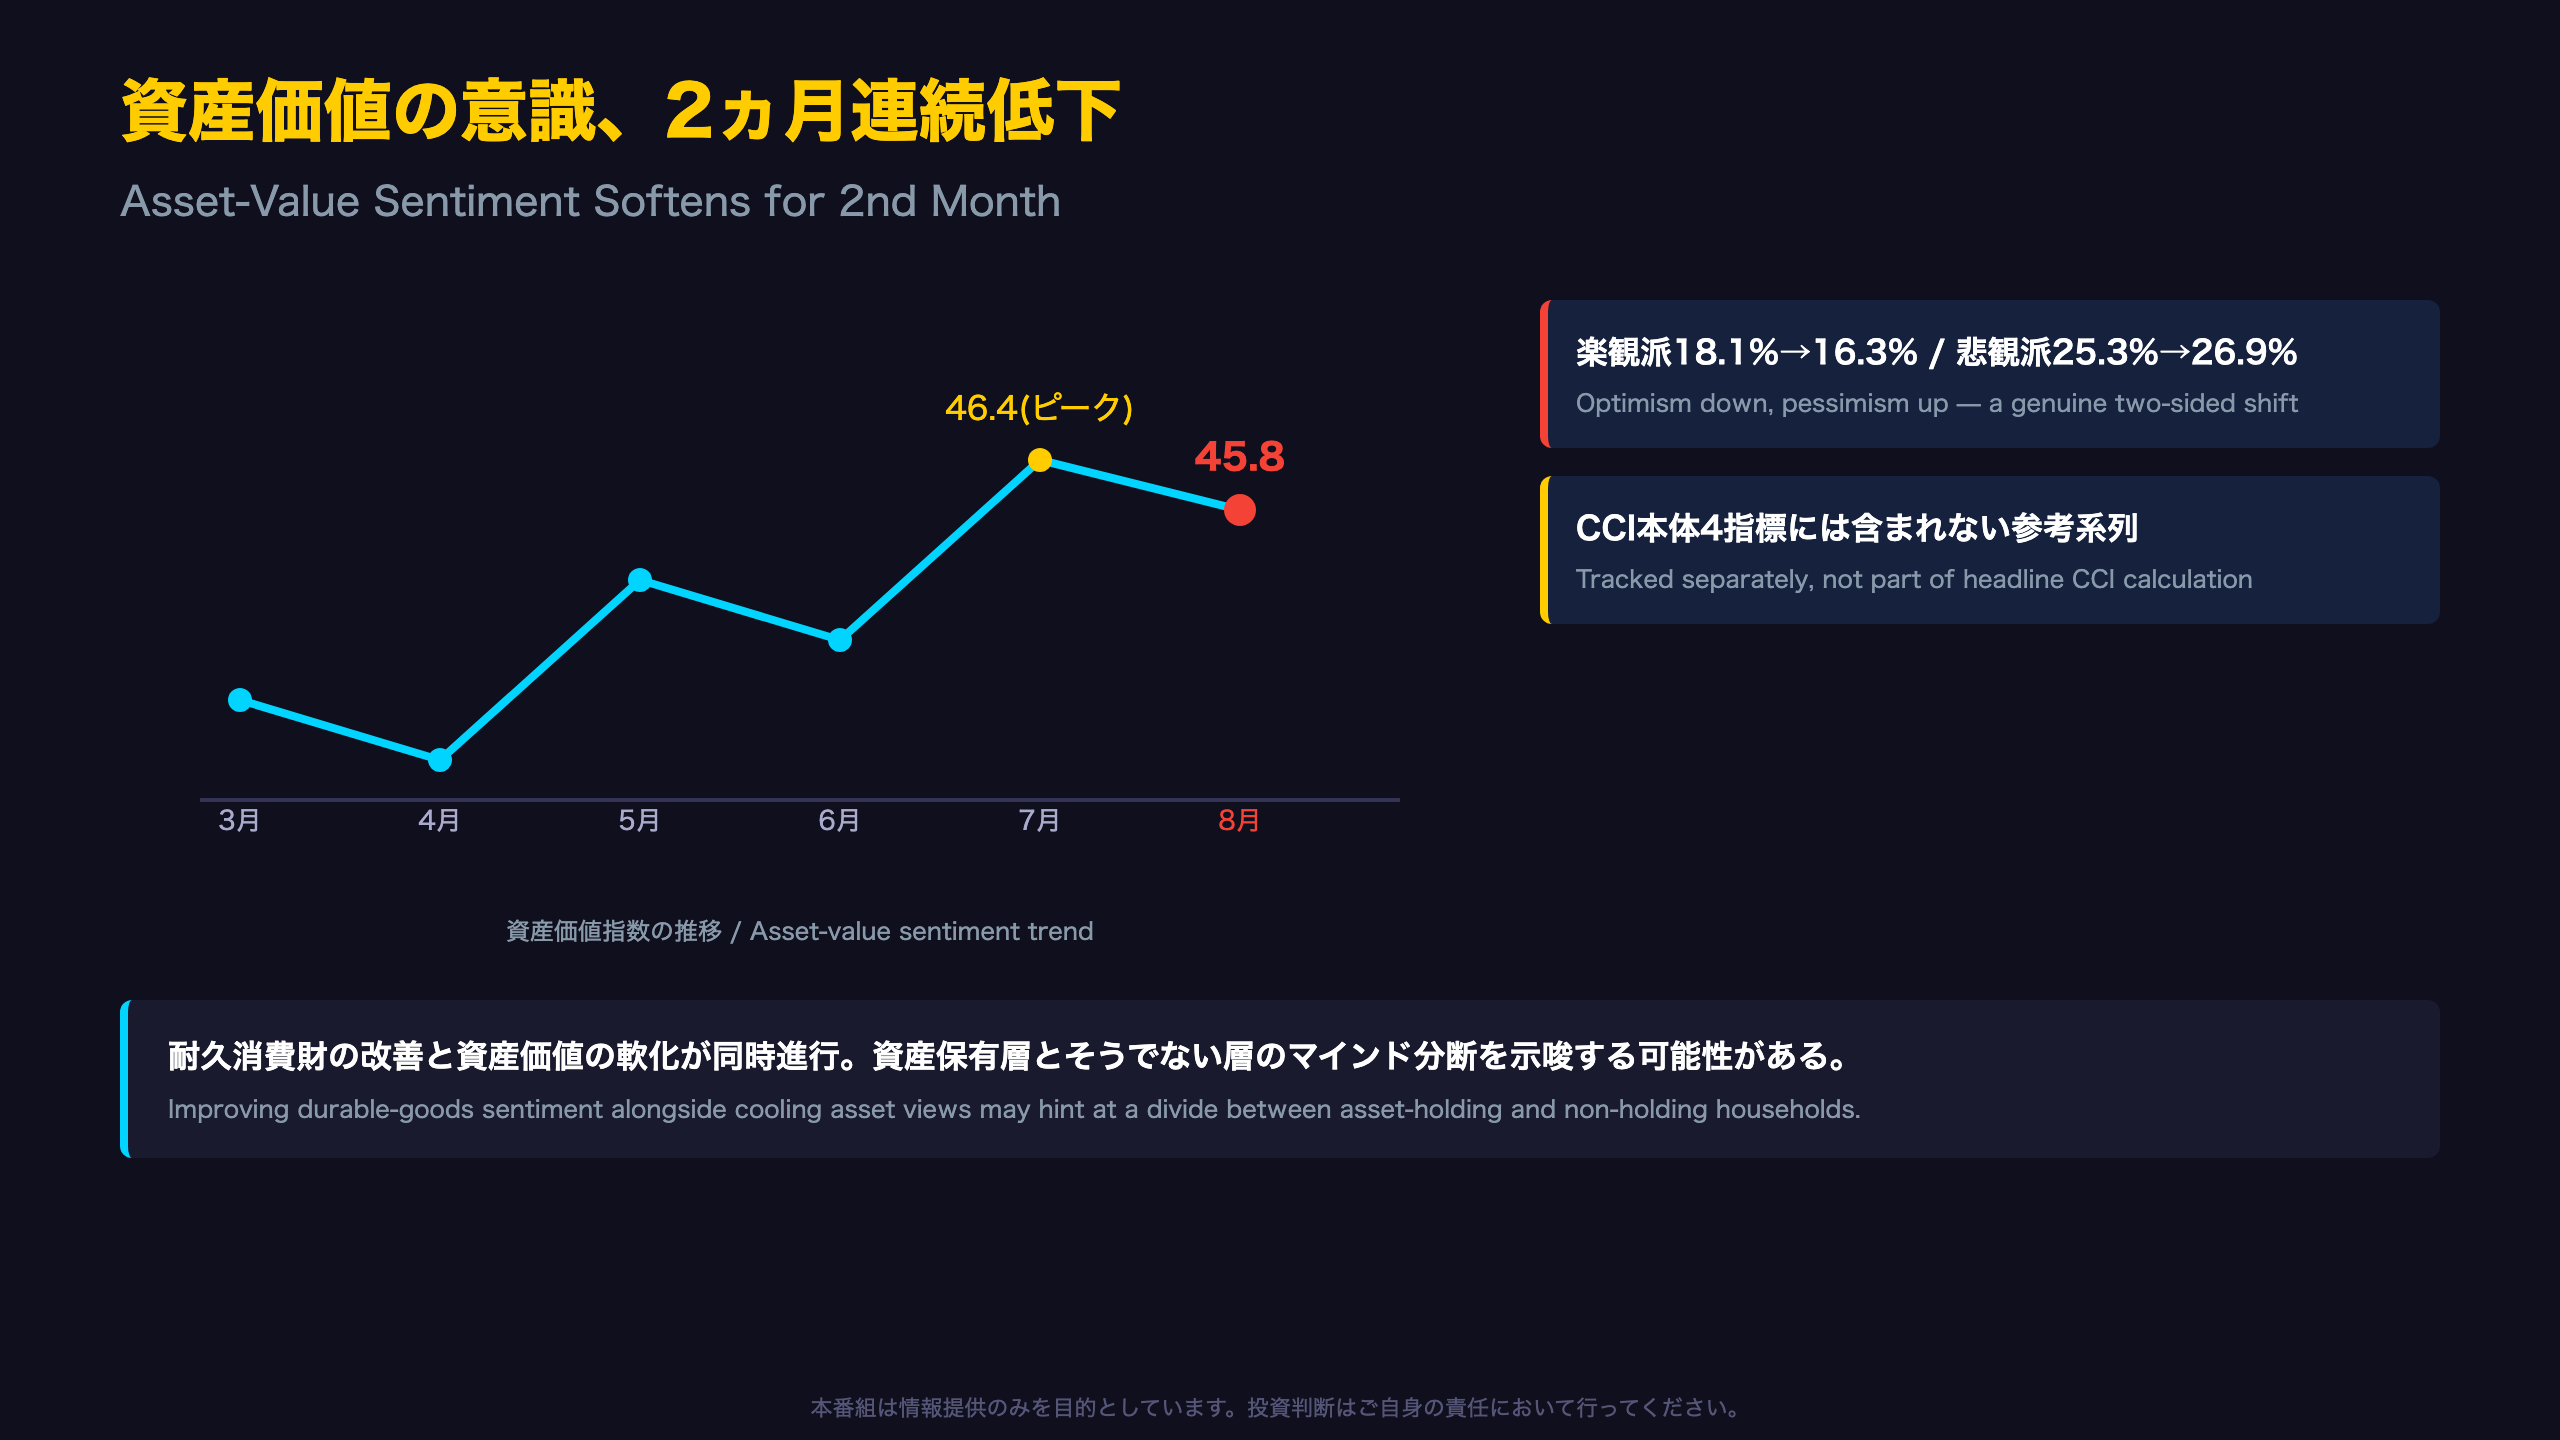
The Overlooked “Asset Value” Gauge
Alongside the four components that make up Japan’s headline Consumer Confidence Index, ESRI’s monthly survey also tracks a separate “asset value” sentiment index — households’ outlook on stocks, land, and other holdings. This index fell 0.6 points to 45.8 in August, a second straight monthly decline.
Confirming a Genuine Softening
Unlike the income-growth data discussed elsewhere in this report — where optimism merely retreated into “unchanged” — the asset-value distribution shows a true two-sided shift: the optimistic share fell from 18.1% to 16.3%, while the pessimistic share rose from 25.3% to 26.9%. Both effects reinforce each other, marking a clearer softening pattern.
Recent Trajectory
After a sharp drop to 41.9 in March, the index recovered to 45.4 (May), dipped to 44.8 (June), rebounded to 46.4 (July), and has now pulled back again in August. July’s 46.4 looks like a local peak for the year so far.
Two Interpretations
On the positive side, since durable-goods buying-time sentiment (a proxy for real demand) is improving concurrently, the softer asset outlook hasn’t yet visibly dented near-term spending intent. On the cautious side, a cooling wealth-effect signal among asset-holding households could eventually weigh on discretionary and luxury consumption — a segment often more sensitive to portfolio valuations than to income growth.
Note: this series is historically more volatile month-to-month than the four core sub-indices, so a single decline should not be extrapolated into a definitive trend without confirmation from subsequent releases.
結論:値上がり一服型の消費とその含意
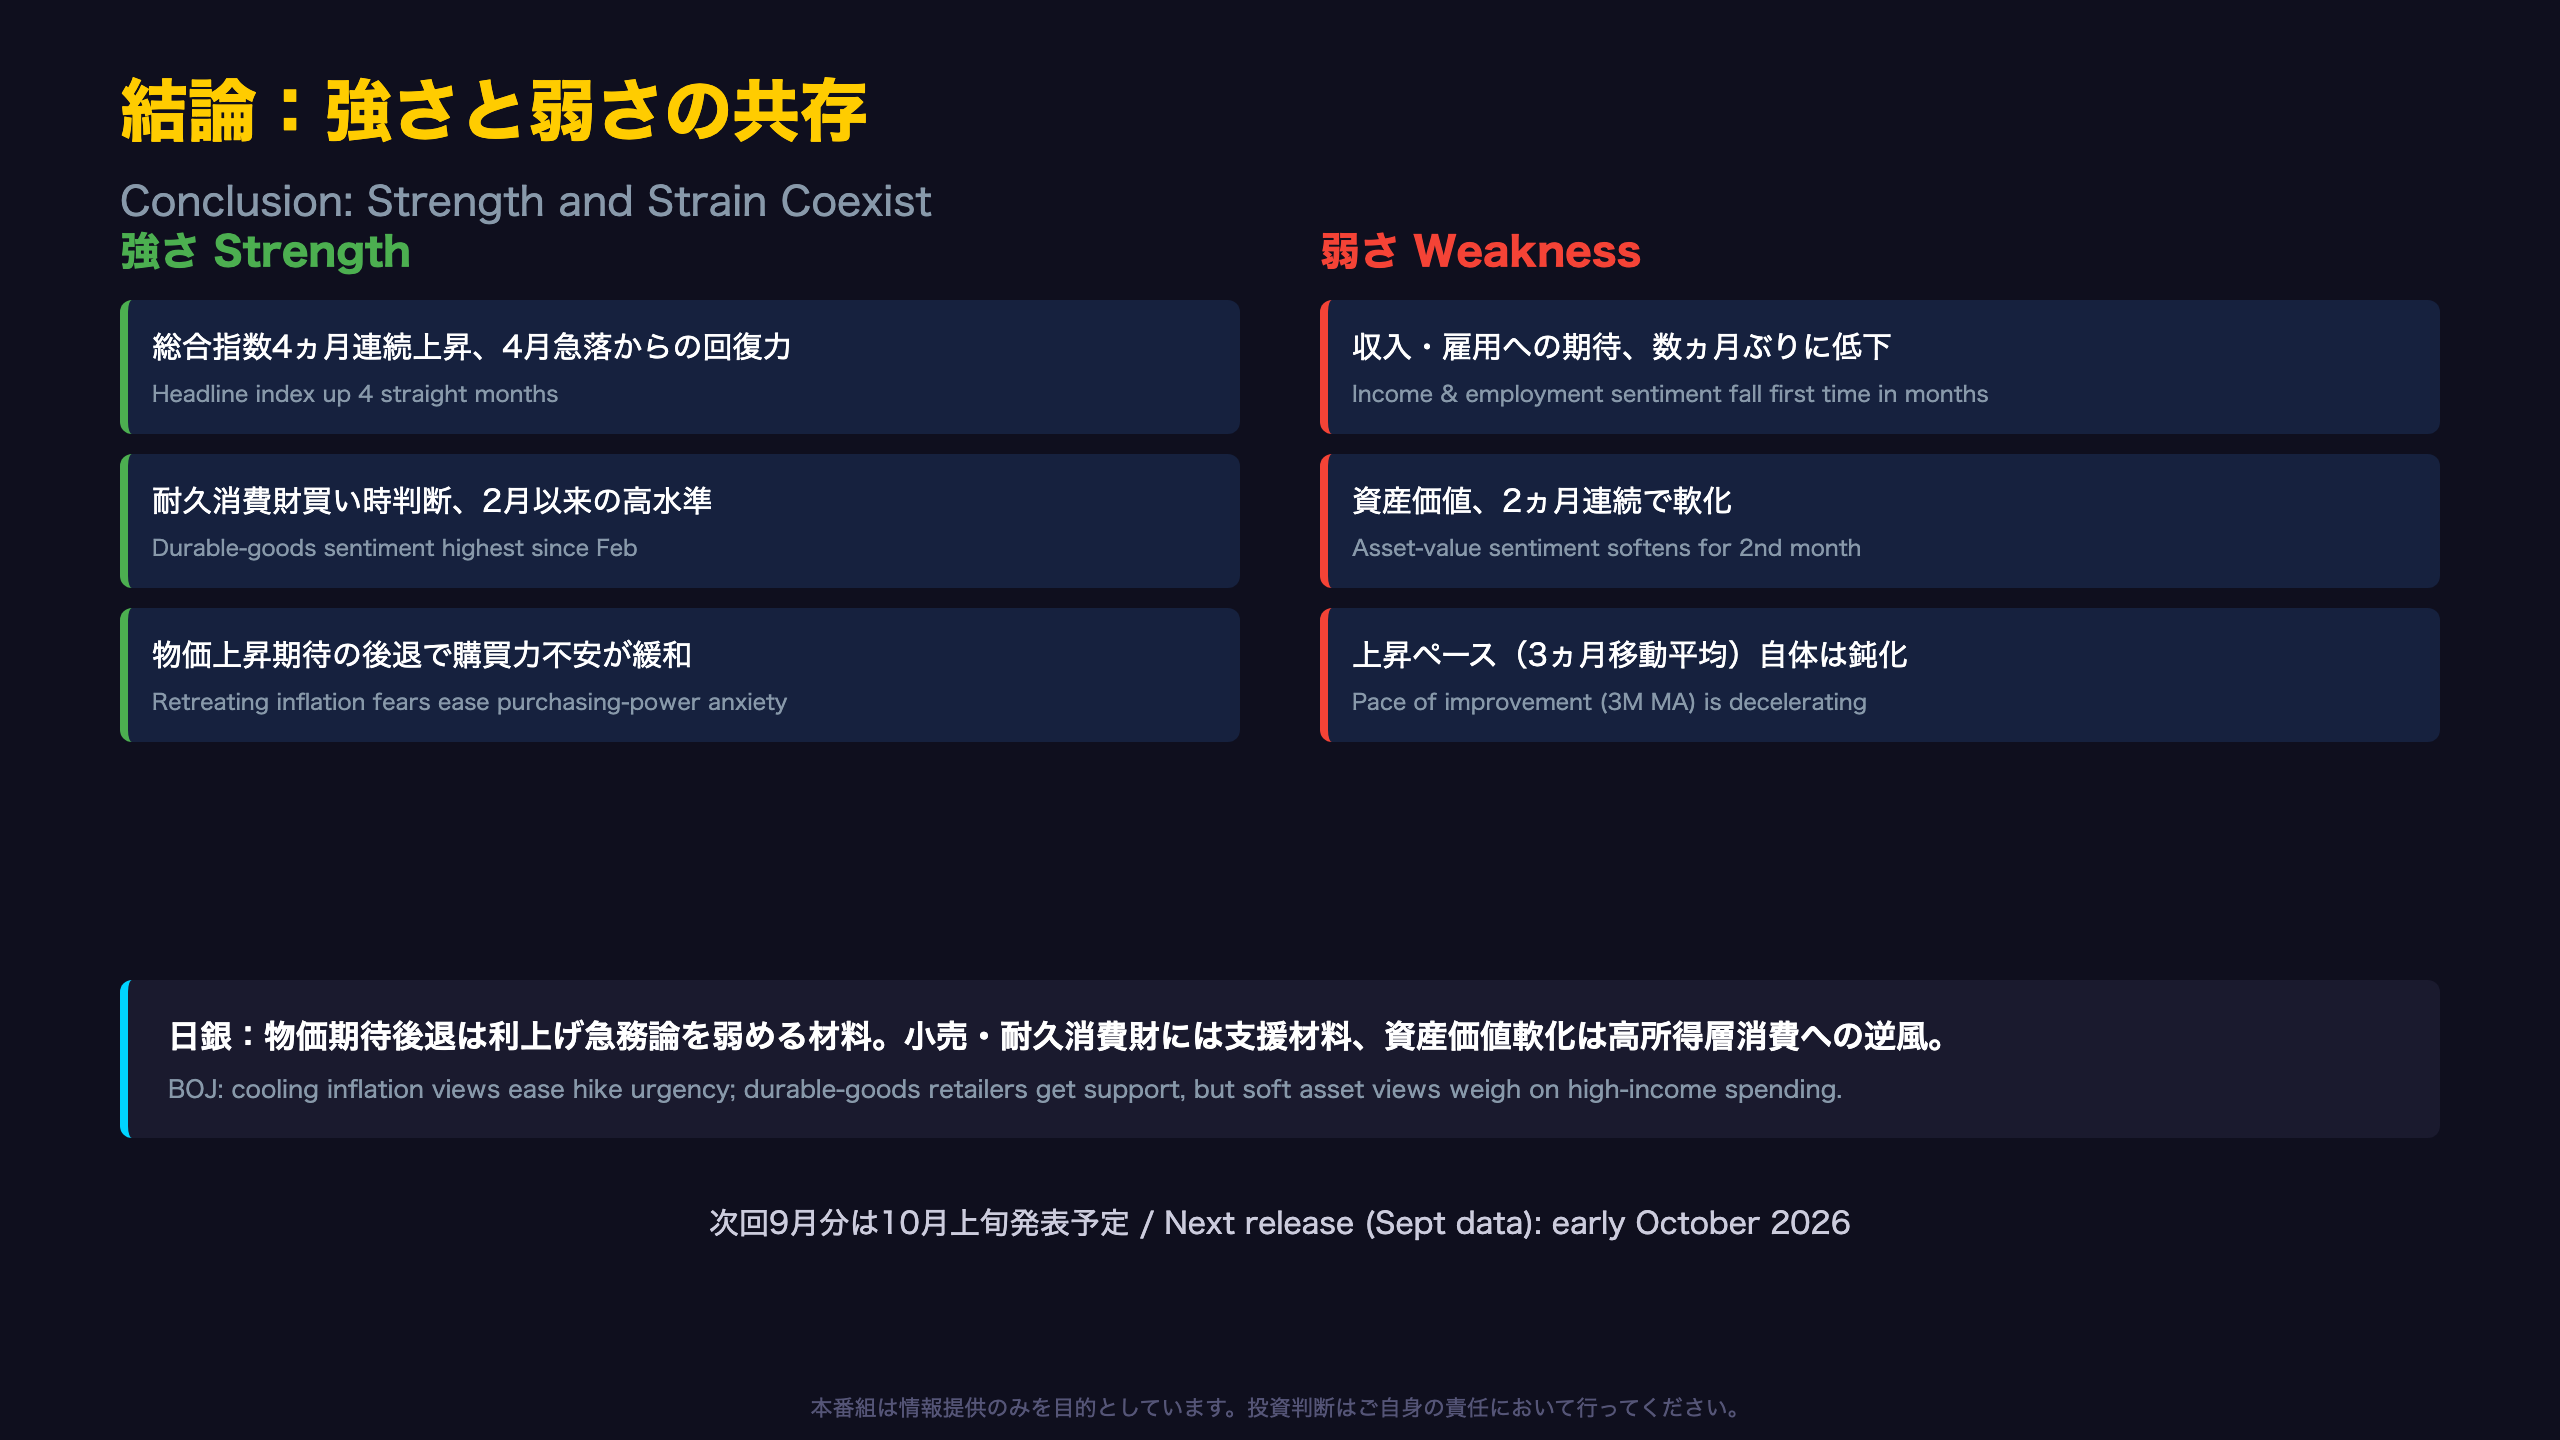
Reconciling Strength and Strain
The core takeaway from this release is that improvement and internal strain coexist — not a simple bullish or bearish signal. Here’s how to weigh both sides.
The Bullish Case
- The headline index has risen for four consecutive months, confirming resilience since April’s sharp drop
- Durable-goods buying-time sentiment hit its highest level since February, with a broad-based decline in pessimism
- Retreating inflation expectations may ease real purchasing-power anxiety
The Bearish Case
- Income and employment sentiment declined for the first time in months, showing no rise in future confidence
- Asset-value sentiment fell for a second straight month, with both shrinking optimism and rising pessimism
- The pace of overall improvement (3-month moving average) is decelerating
Policy and Market Implications (inference level B-C)
A retreat in consumer inflation expectations could be one data point supporting the Bank of Japan’s cautious approach to confirming a sustainable “wage-price virtuous cycle,” though it does not by itself dictate a policy shift — the BOJ weighs many indicators including the quarterly Tankan survey and wage negotiation outcomes. For retail, appliance, and auto-related stocks, improving buying-time sentiment is a modest tailwind, while softening asset-value sentiment is a caution flag for luxury and high-end discretionary spending, sectors more sensitive to wealth effects than to income growth alone.
What to Watch Next
The next Consumer Confidence Survey, covering September data, is scheduled for release in early October 2026. Key questions: will income and employment sentiment rebound, and will asset-value softening extend into a third consecutive month? Both will help clarify whether August’s split signal resolves toward genuine recovery or renewed caution.
Disclaimer: This article is for informational purposes only. All investment decisions are made solely at your own risk.