
This article was automatically generated by the NFC Market Live AI analysis system. (Updated: 2026-10-29 09:05 JST)
📊 Breaking down Japan’s Ministry of Finance weekly cross-border securities data for Oct 18-24.
📈 Foreign investors net bought 1.18 trillion yen of Japanese stocks. The four-week total is about 6.9 trillion yen, a sharp reversal from September’s selling.
📉 Foreign buying of Japanese long-term bonds slowed to 43.3 billion yen from 1.45 trillion the week before, and short-term debt saw a second week of net selling.
💡 Japanese selling of foreign bonds continues but is shrinking. The data shows no clear link with USD/JPY; whether the buying lasts depends on upcoming weekly reports.
サマリー:海外勢の日本株買いが1兆1,809億円に
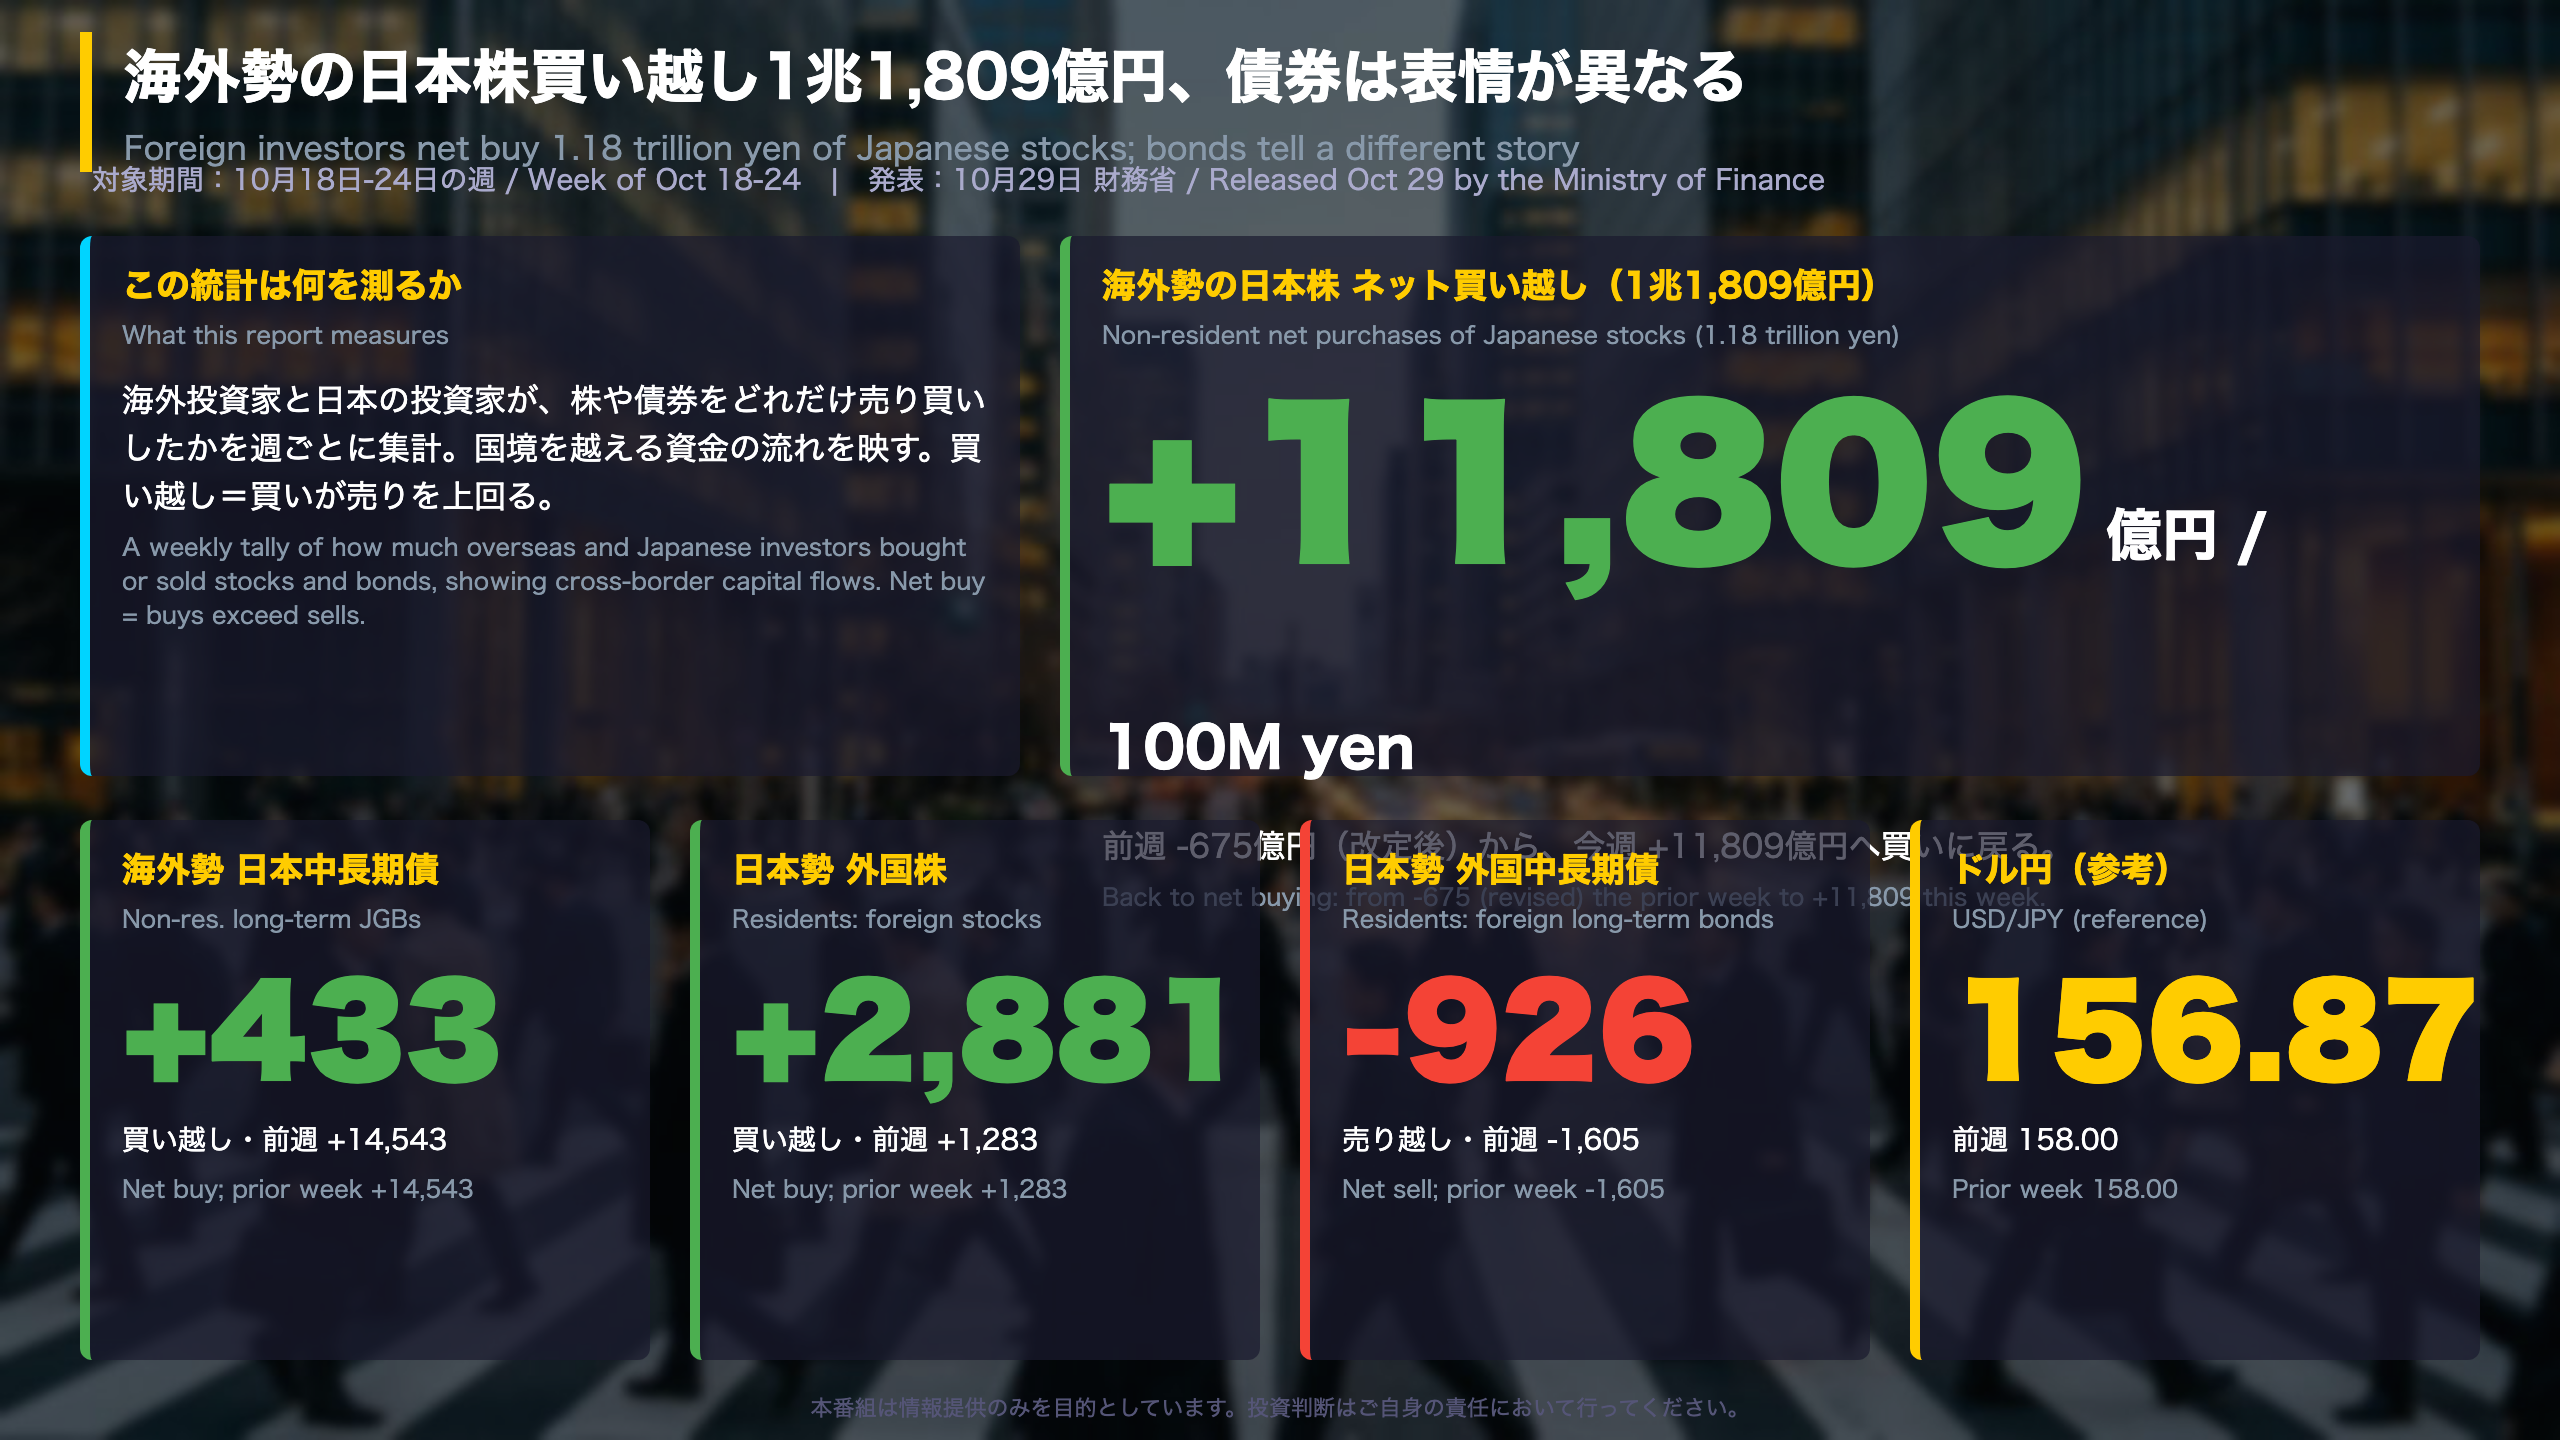
What this report is
Japan’s Ministry of Finance (MOF) publishes weekly data on cross-border securities transactions: how much Japanese residents bought or sold in foreign stocks and bonds, and how much non-residents bought or sold in Japanese stocks and bonds. Positive numbers are net purchases. The closest US analogue is the Treasury’s TIC report, but the MOF series arrives weekly rather than monthly, which makes it a timely read on foreign appetite for Japanese assets.
The week of Oct 18-24 (100 million yen)
| Category | This week | Prior week (revised) |
|---|---|---|
| Non-residents: Japanese stocks | +11,809 | -675 |
| Non-residents: long-term bonds | +433 | +14,543 |
| Non-residents: short-term debt | -11,817 | -22,366 |
| Residents: foreign stocks | +2,881 | +1,283 |
| Residents: foreign long-term bonds | -926 | -1,605 |
USD/JPY was 156.87, down from 158.00 a week earlier.
Reading it carefully
- Figures are revised slightly: the Oct 22 release showed -665 for non-resident stock flows in the prior week, while the latest table shows -675.
- Short-term debt flows swing widely (from -44,514 to +35,949 over the past year), so a single week says little.
- Positive: foreign money returned to Japanese stocks. Cautious: until the buying persists, it is weekly noise. The data alone says nothing definitive about yen direction or equity prices.
深掘り1:海外勢の日本株フローは9月の売りから反転
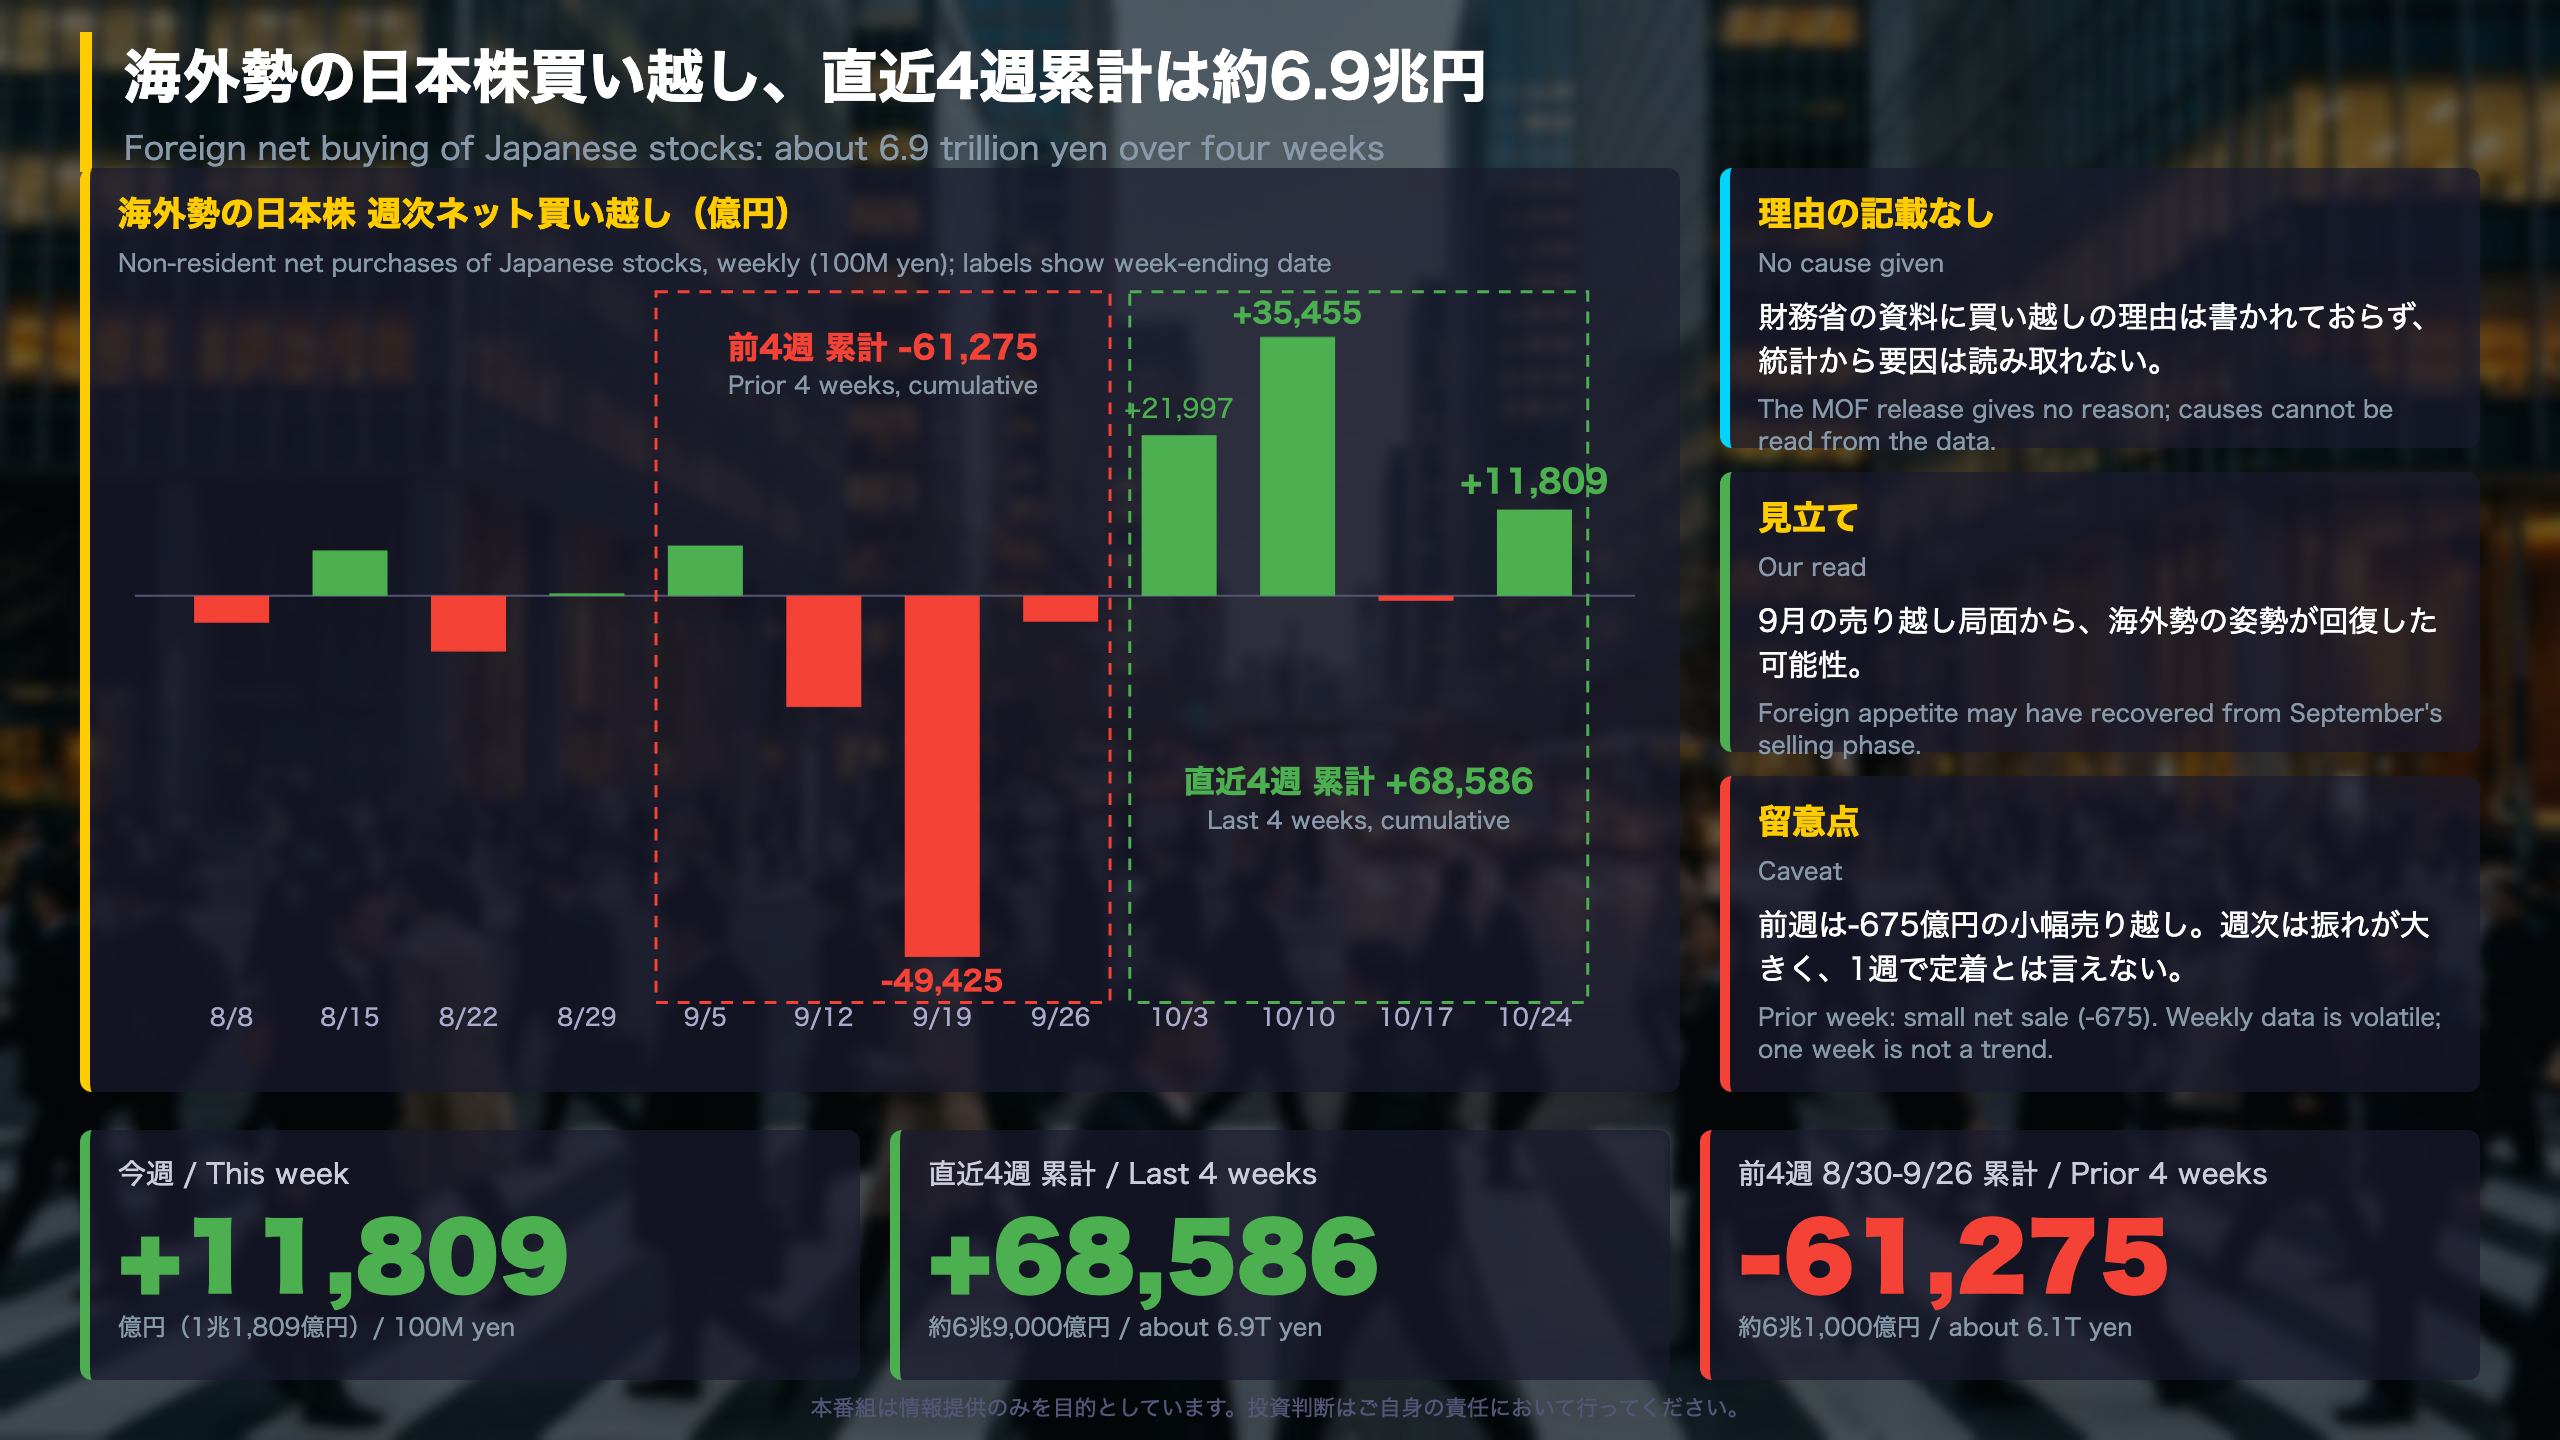
Foreign flows into Japanese stocks: a 12-week view
The chart shows weekly net purchases of Japanese equities by non-residents, as reported by Japan’s Ministry of Finance. Context from the past year:
- The week of Sep 13-19 (-4.94 trillion yen) was the largest net sale of the past year, followed by Mar 22-28 (-4.45 trillion).
- Sep 27-Oct 3 (+2.20 trillion) and Oct 4-10 (+3.55 trillion) both rank among the top five buying weeks of the past year; the largest was Apr 5-11 (+3.94 trillion).
- This week’s +1.18 trillion is a mid-sized figure by comparison.
A similar pattern in spring
After the Mar 22-28 sell-off, foreign investors were net buyers for eight straight weeks (Mar 29-May 23) before the streak broke. That shows sharp reversals can persist, but also that they end; one week’s data cannot tell us which case this is.
Two readings
- Constructive: Three buying weeks out of four, with a cumulative +6.86 trillion yen, a clear reversal from the -6.13 trillion of the prior four weeks.
- Cautious: The Oct 11-17 week was a small net sale (-67.5 billion yen), and the MOF release gives no reasons, so causes are speculative.
Why it matters internationally
Unlike the US Treasury’s monthly TIC data, this MOF series is weekly, so it is a faster gauge of foreign positioning in Japan. It is a flow measure, not a price forecast. The next weekly releases will show whether the buying persists as it did in spring.
深掘り2:債券は海外買いが減速、日本勢の外債売りも縮小
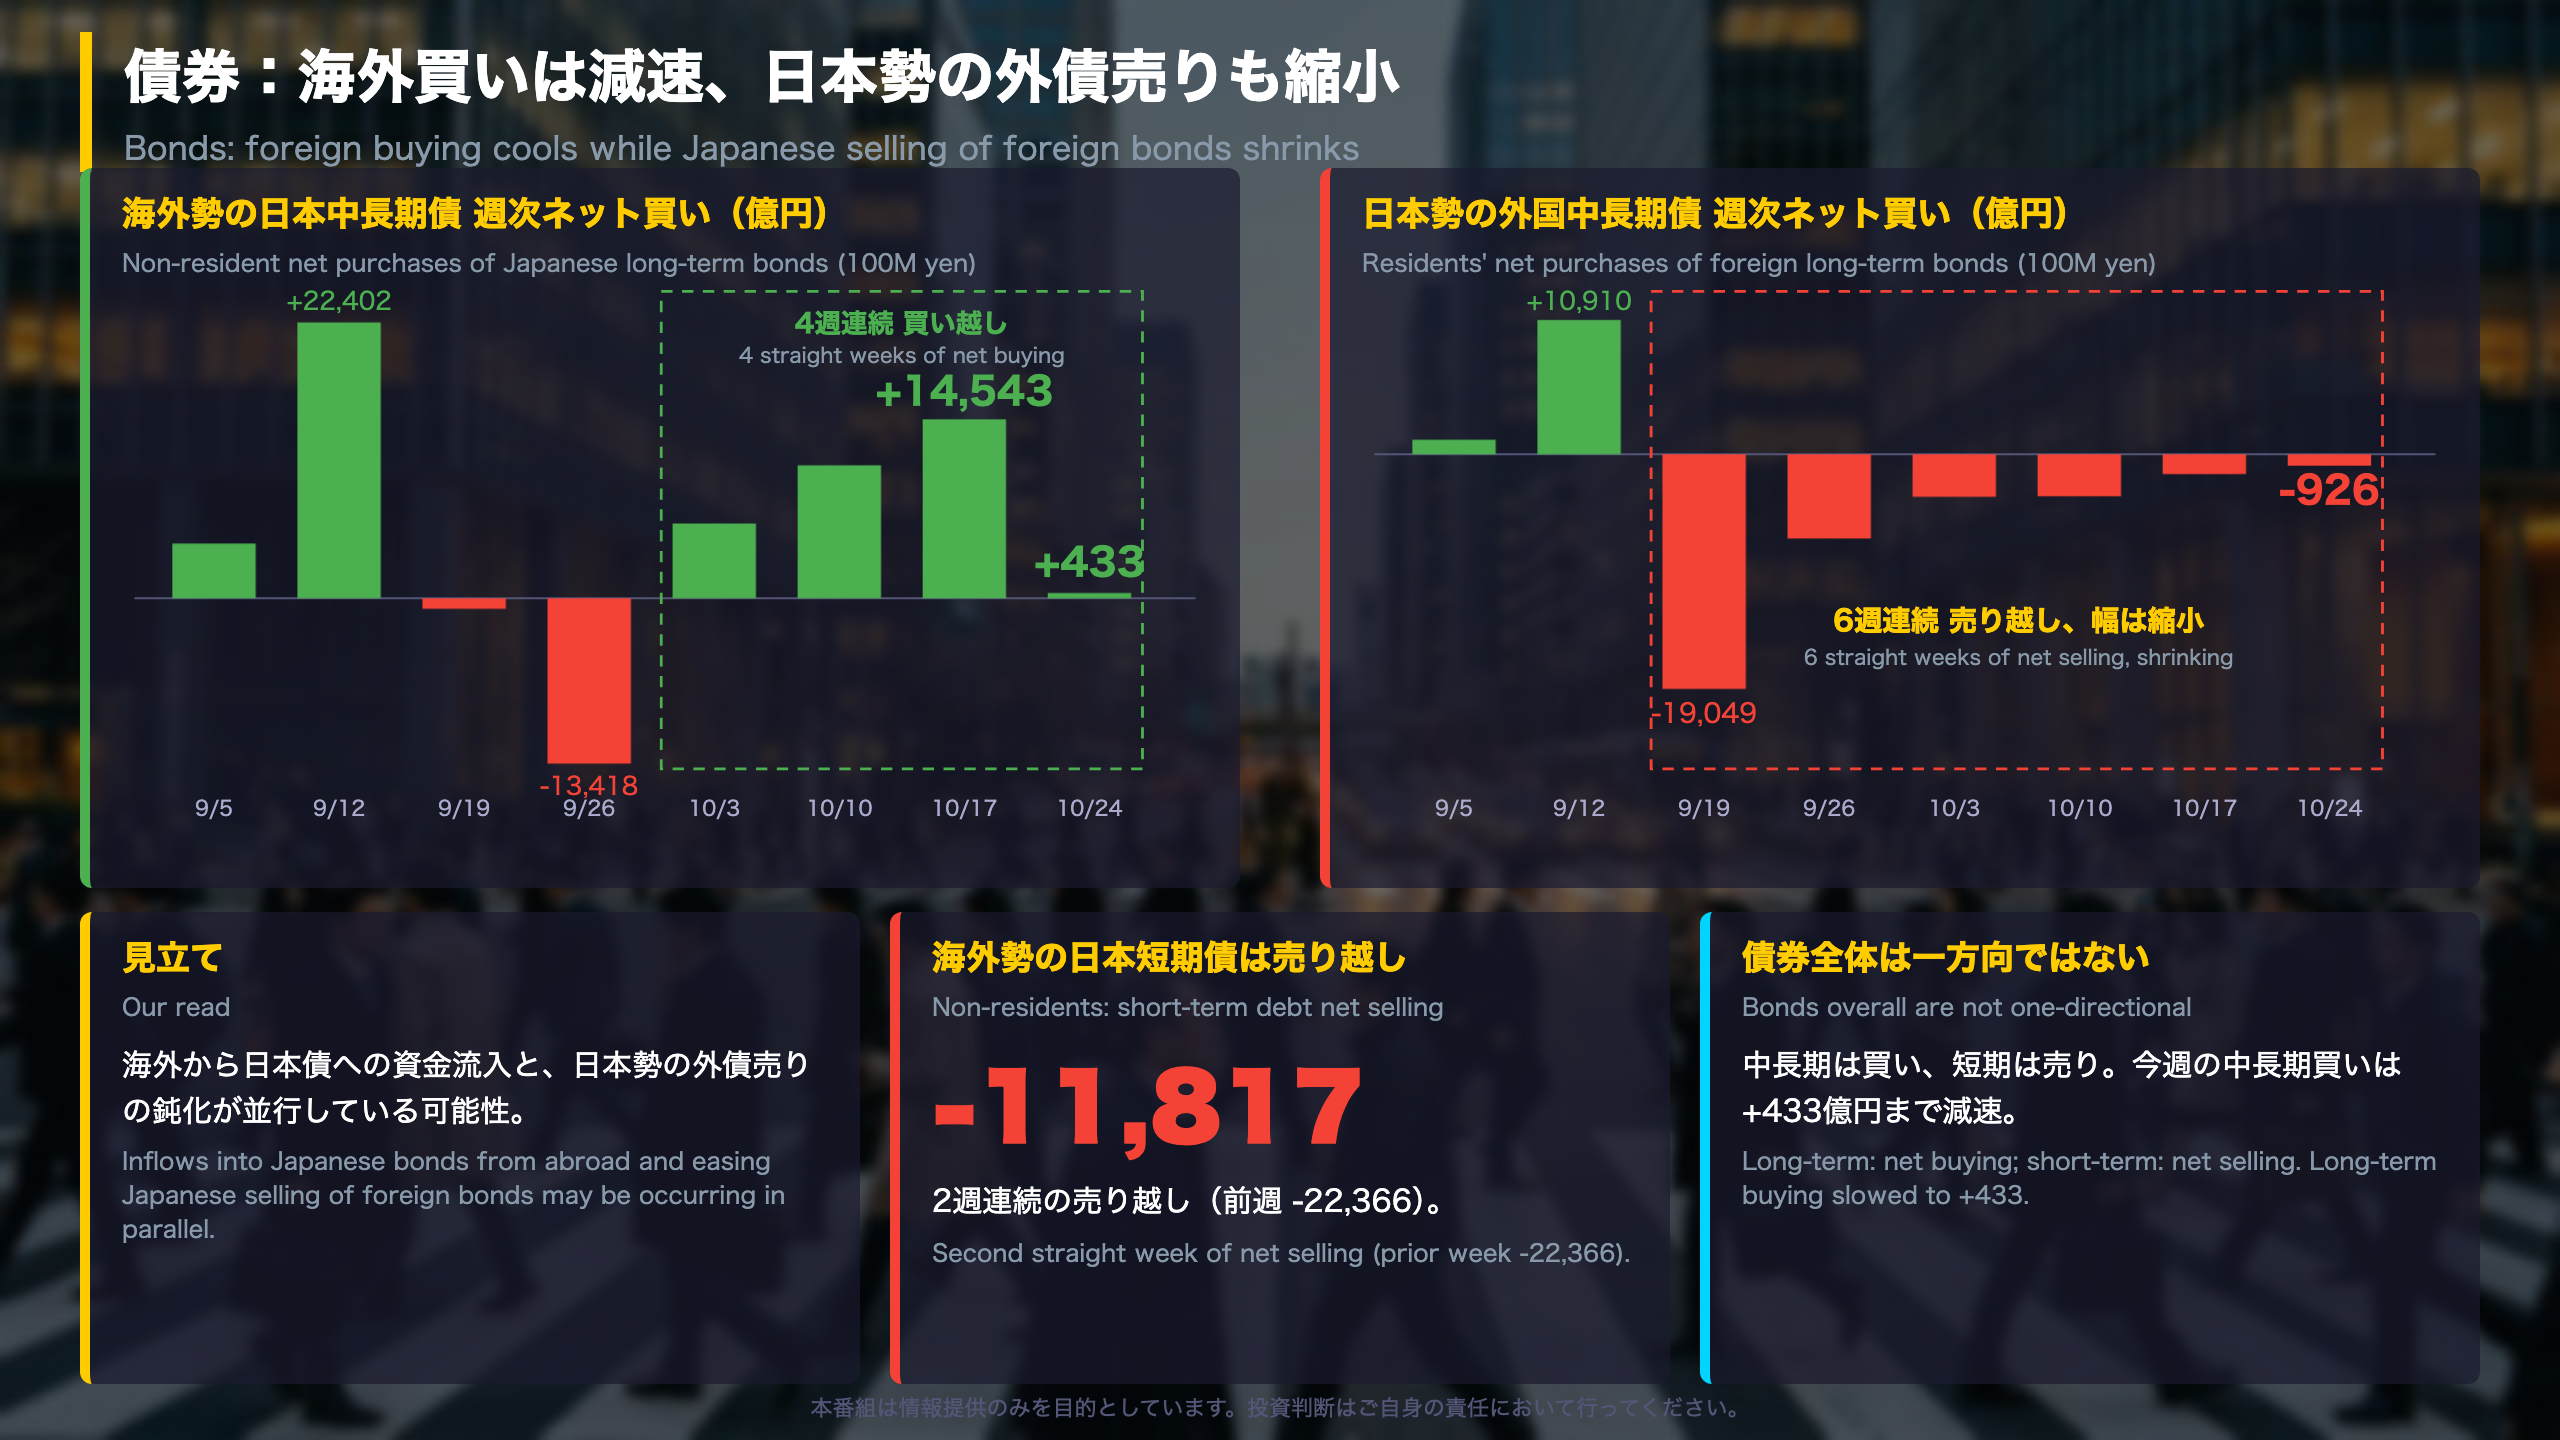
Bond flows in detail
Non-residents’ purchases of Japanese long-term bonds (100M yen)
| Week | 9/27-10/3 | 10/4-10/10 | 10/11-10/17 | 10/18-10/24 |
|---|---|---|---|---|
| Net buying | +6,081 | +10,802 | +14,543 | +433 |
Four straight weeks of net buying, totaling +31,859 (about 3.2 trillion yen). The latest week is only about 3% of the prior week’s size.
Japanese investors and foreign bonds
Residents have been net sellers of foreign long-term bonds for six straight weeks (from -19,049 in Sep 13-19 down to -926), with the selling shrinking each week; the six-week total is -35,249. In spring a similar pattern appeared: a -24,789 week (Mar 29-Apr 4) was followed, weeks later, by a +24,064 buying week (Apr 26-May 2). Shrinking sales do not guarantee a reversal.
Short-term debt behaves differently
Non-residents net sold Japanese short-term debt for two weeks (-22,366, then -11,817). Residents bought +2,353 of foreign short-term debt. These series are noisy and are best read separately from long-term flows.
Two readings
- Constructive: Four weeks of foreign inflows into Japanese bonds, and fading Japanese selling of foreign bonds.
- Cautious: The latest inflow cooled sharply, and short-term debt is seeing outflows.
For non-Japanese readers: this is the MOF’s weekly cross-border series, comparable in purpose to the US Treasury’s monthly TIC data. It describes flows, not prices, and no market forecast is implied. The next weekly report will show whether bond buying re-accelerates.
質疑:為替との関係と「買いの定着」をどう見るか
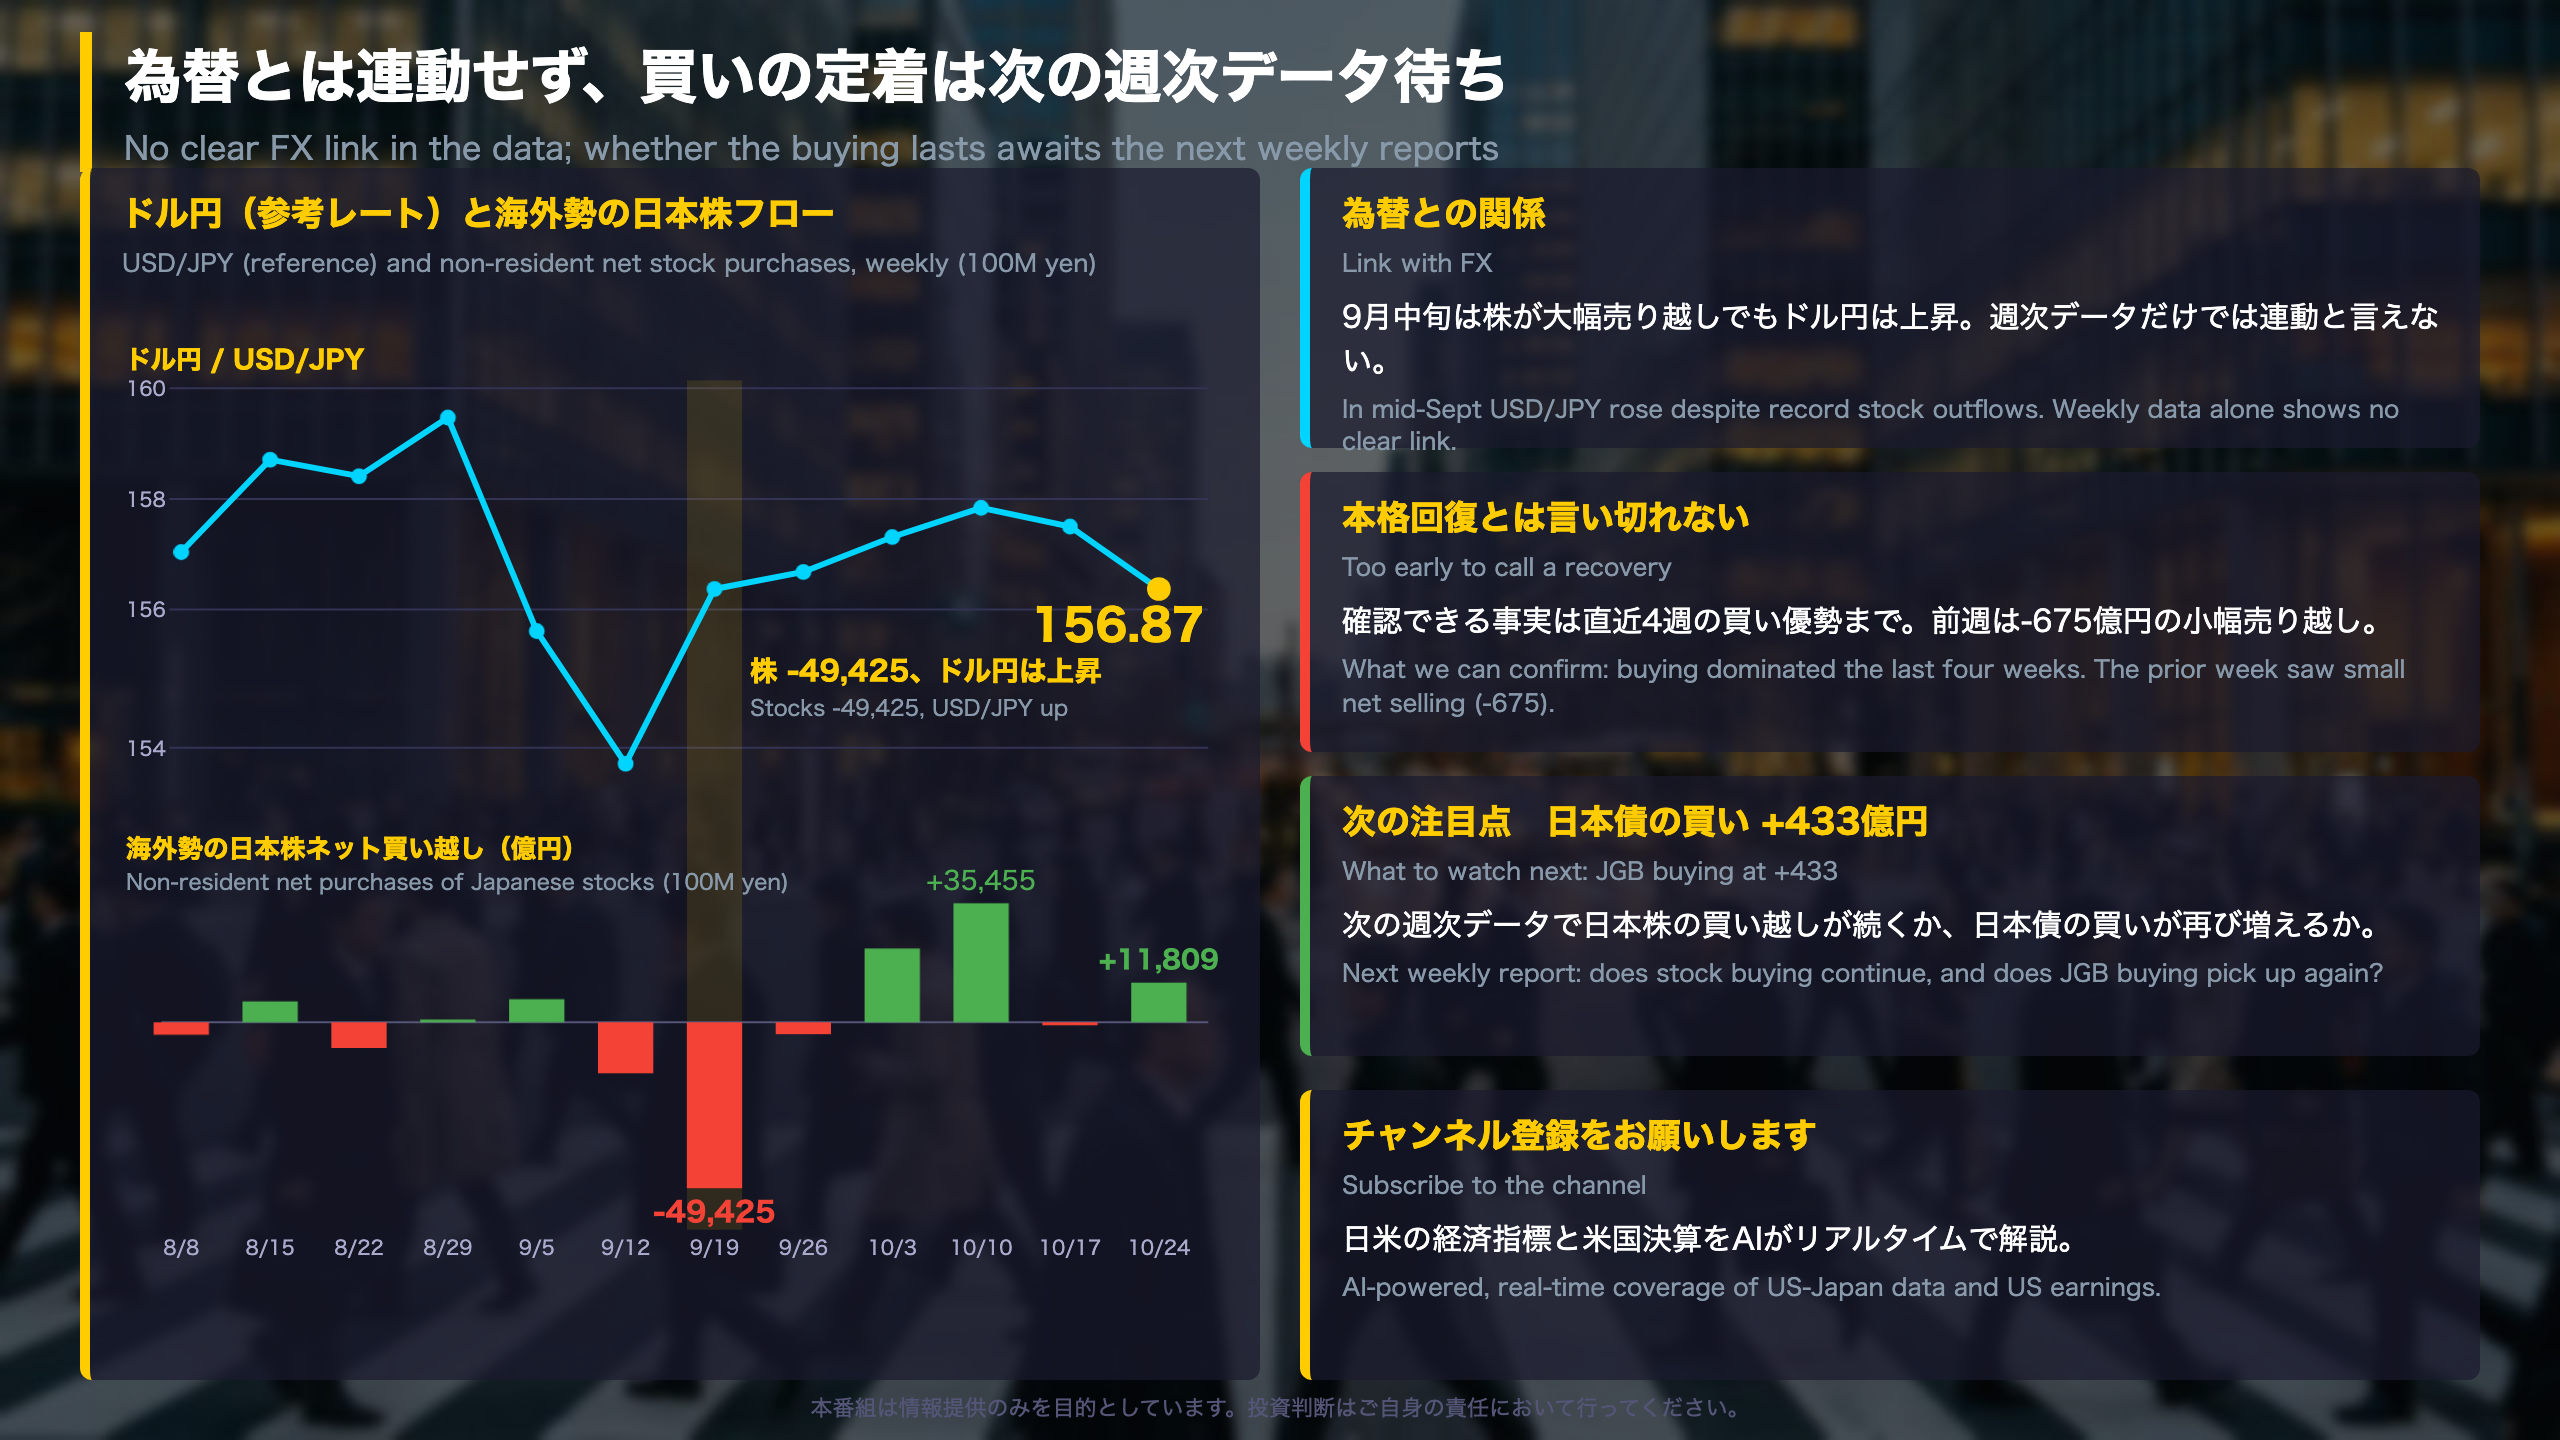
Does the flow data line up with USD/JPY?
The MOF release includes a reference USD/JPY level for each week. Recent weeks (100 million yen):
| Week | Non-resident Japanese stocks | USD/JPY | Weekly change |
|---|---|---|---|
| 9/27-10/3 | +21,997 | 157.81 | +0.63 |
| 10/4-10/10 | +35,455 | 158.34 | +0.53 |
| 10/11-10/17 | -675 | 158.00 | -0.34 |
| 10/18-10/24 | +11,809 | 156.87 | -1.13 |
Buying weeks coincided with both higher and lower USD/JPY. In Sep 13-19, the largest net selling of the past year (-49,425) came as USD/JPY rose from 153.71 to 156.87. So there is no consistent weekly relationship in this data.
Context
USD/JPY fell from 163.71 (Jul 19-25) to 153.71 (Sep 6-12) and has since traded in the 156-158 area. For international readers: Japanese investors’ foreign-asset purchases and foreigners’ purchases of Japanese assets both affect currency demand, but hedging, rates and trade flows also matter, which is why weekly securities flows alone cannot explain moves in the yen.
Two views
- Link view: Selling weeks and yen strength sometimes overlap (e.g., Sep 6-12).
- No-link view: Multiple drivers dominate, and weekly flows are too noisy to isolate.
This analysis stays within the primary data and offers no currency forecast.
What to watch next
In the next weekly release, check whether foreign net buying of Japanese stocks continues and whether buying of Japanese long-term bonds recovers from this week’s 43.3 billion yen.
Disclaimer: This article is for informational purposes only. All investment decisions are made solely at your own risk.