📺 Watch the Full Video Analysis
This article was automatically generated by the NFC Market Live AI analysis system. (Updated: 2026-10-30 09:59 JST)
📄 Primary Source
総務省統計局
https://www.stat.go.jp/data/cpi/sokuhou/tsuki/pdf/kubu.pdf
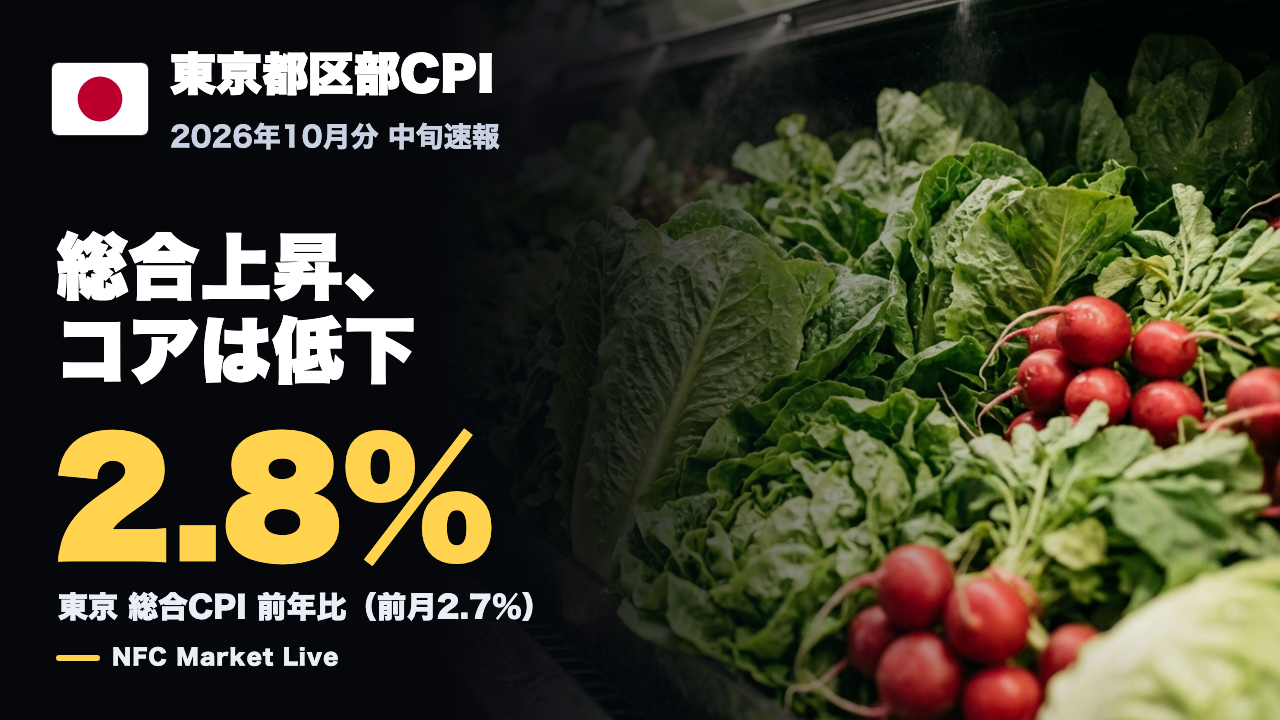
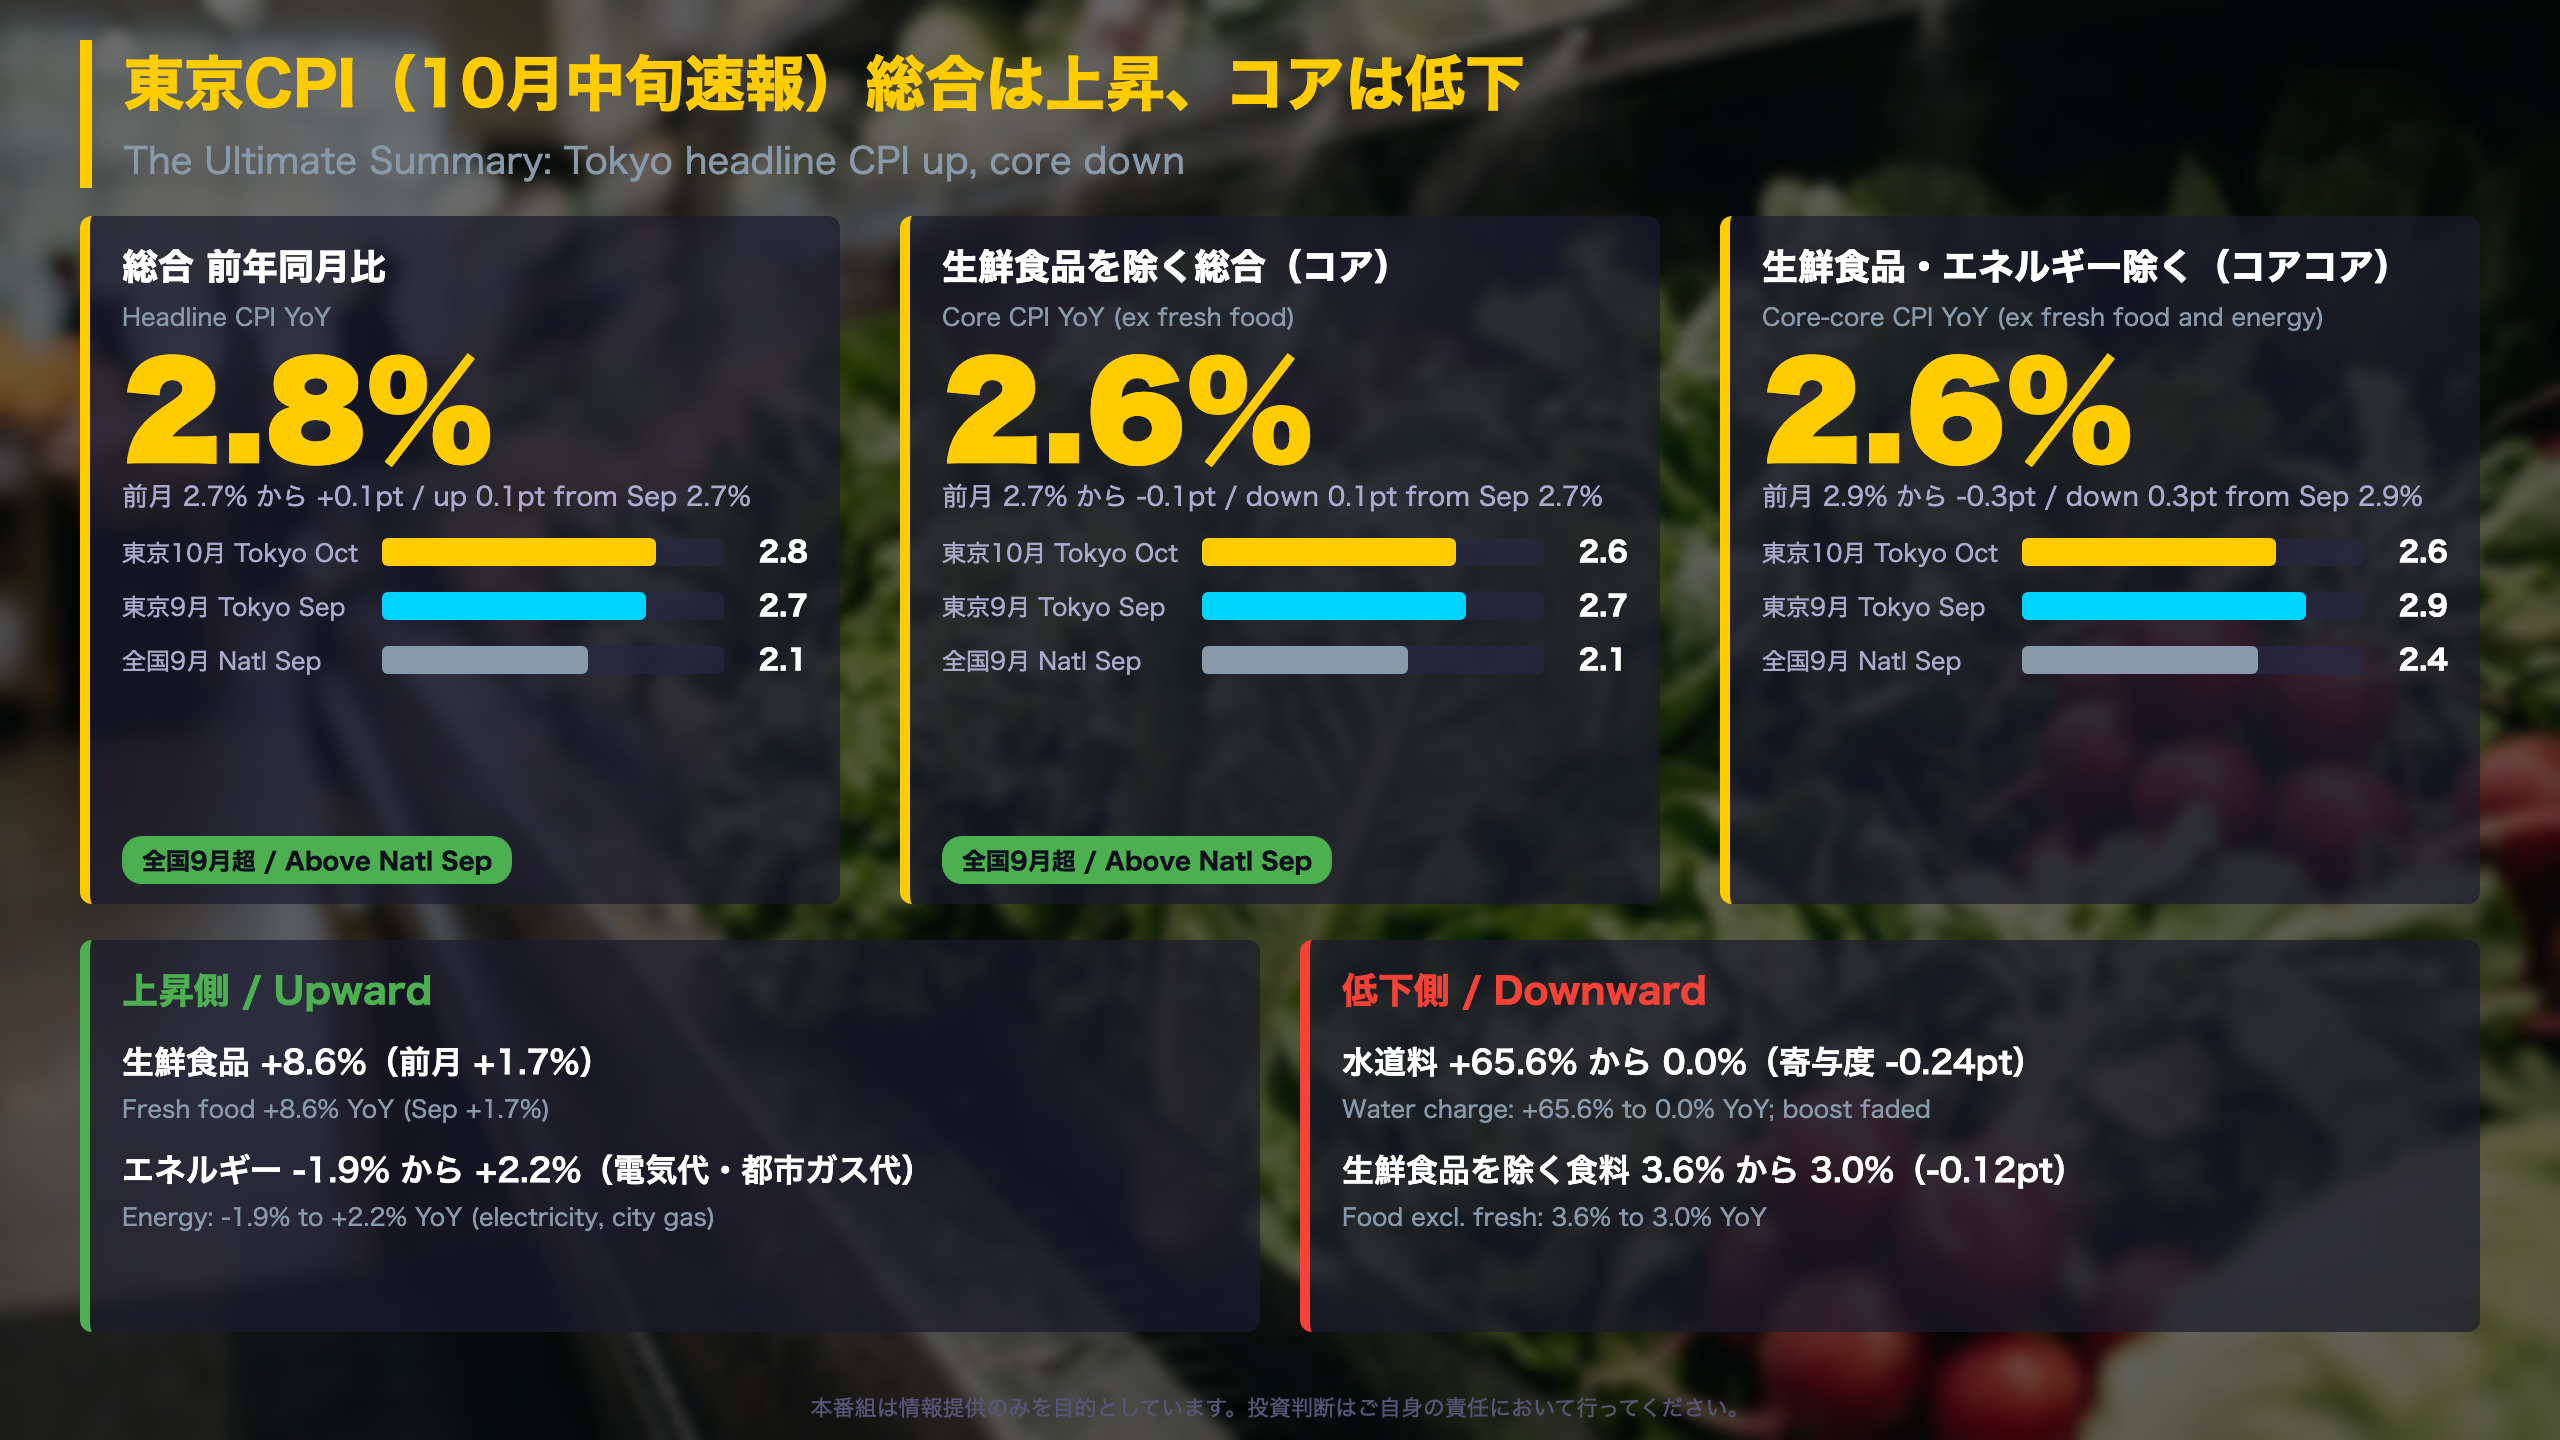
📊 Tokyo CPI (October mid-month flash): headline 2.8% YoY (Sep 2.7%), core ex fresh food 2.6%, core-core ex fresh food and energy 2.6% (Sep 2.9%).
📈 Fresh food (+8.6%) and an energy reversal (-1.9% to +2.2%) lifted the headline.
📉 Core-core eased as a water-charge effect dropped out (-0.24pt).
💡 Rent and hotel prices keep rising, so the picture is mixed. Tokyo leads the national release by about three weeks; the national October CPI on Nov 20 is the next check.
The Ultimate Summary
What the Tokyo CPI flash is and why it matters
The Ministry of Internal Affairs and Communications (MIC) publishes Tokyo’s ward-area CPI as a mid-month flash about three weeks before the national figure (Oct 30 for Tokyo, Nov 20 for the nation). It is an early read, not a mirror, because Tokyo’s basket and weights differ from the national one.
Three Japanese CPI lenses
- Headline: 2.8% YoY (Sep: 2.7%)
- Core (excludes fresh food only; the measure most followed in Japan): 2.6% (Sep: 2.7%)
- Core-core (excludes fresh food and energy): 2.6% (Sep: 2.9%, versus a 3.0% flash). It is the nearest analogue to US core CPI, although US core strips out all food.
Momentum
Seasonally adjusted MoM: headline +0.5%, core +0.3%, core-core +0.2%, versus +0.6%, +0.9% and +0.7% in September. October looks more measured after a sharp September.
Independent take
The print is mixed rather than clearly strong or weak. Headline edged up on fresh food and an energy reversal, while core-core eased as a water-charge effect dropped out. All three gauges still sit above the latest national September readings (2.1%, 2.1%, 2.4%). The BOJ and the Fed both target 2%, which offers a common yardstick, but a single flash print is not a trend; the national October release on Nov 20 is the next check.
総合を押し上げた2つの要因
Inside the headline: fresh food and energy
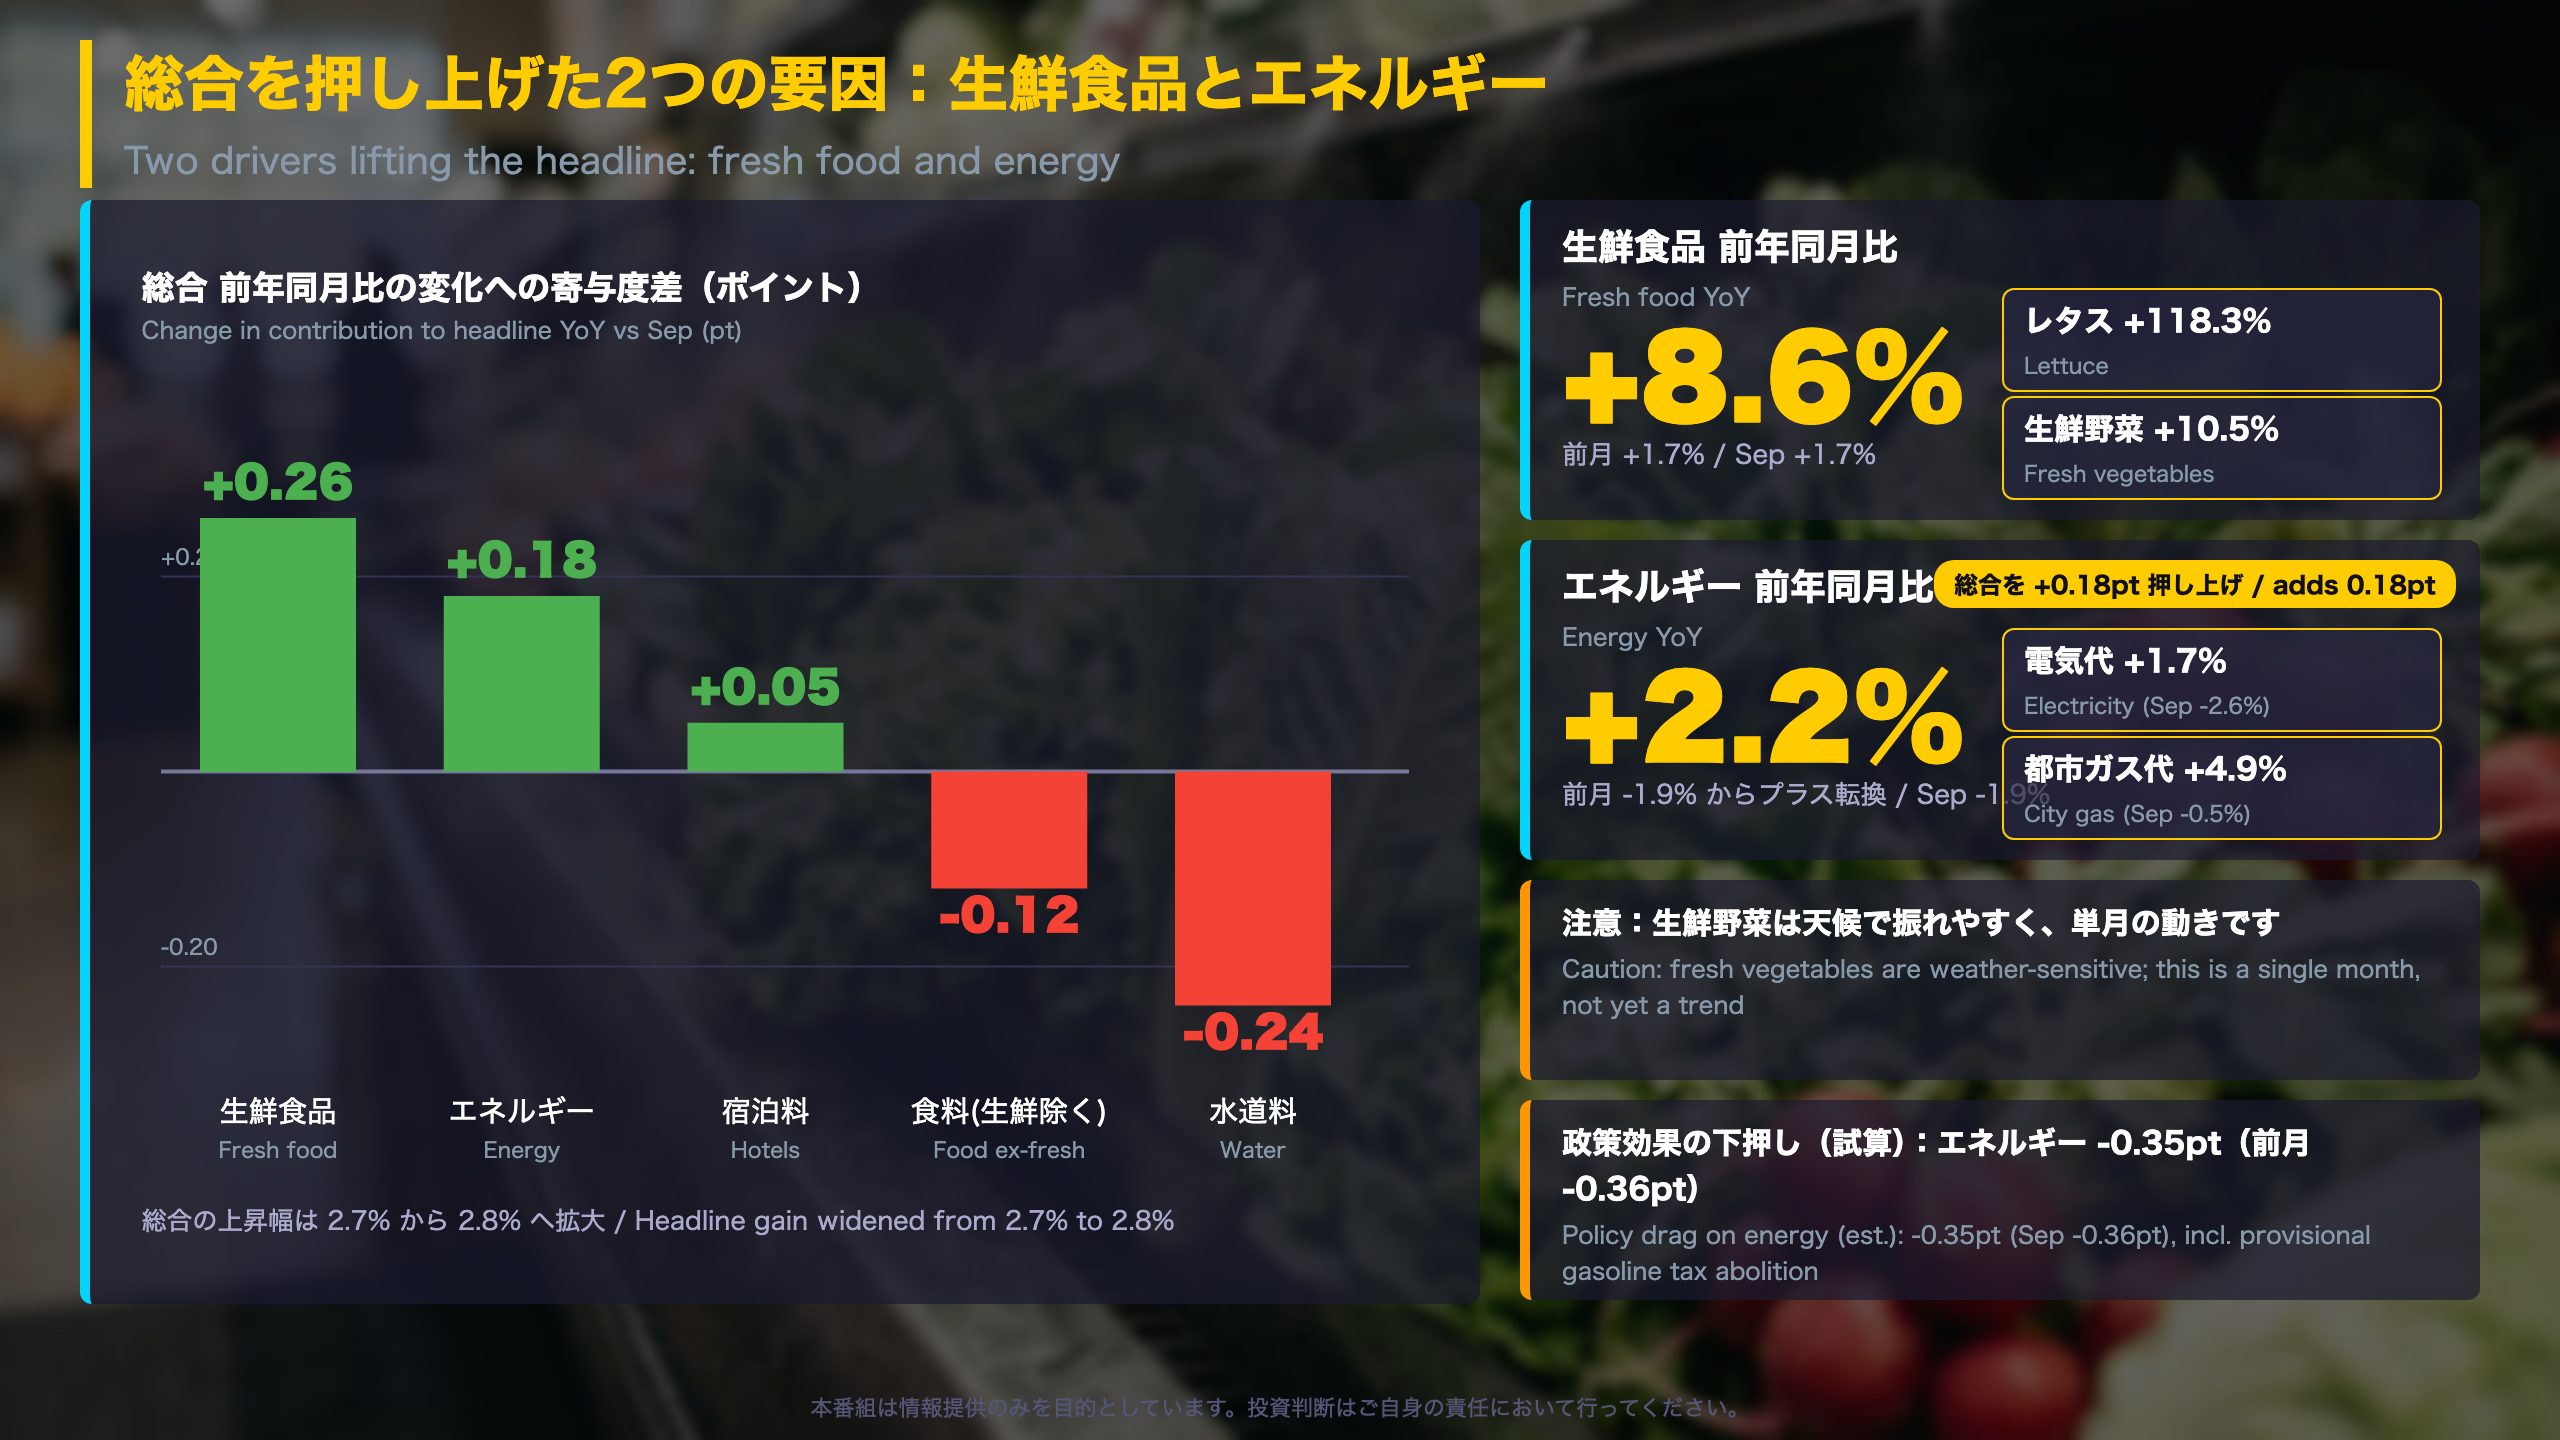
Fresh food (+8.6% YoY, vs +1.7% in September)
Fresh vegetables rose 10.5% YoY (contribution 0.20pt), with lettuce up 118.3% (0.10pt). Fresh fish added 14.2% (0.14pt). Month on month, fresh food jumped 6.9%.
Energy (+2.2% YoY, vs -1.9%)
| Item | Sep YoY | Oct YoY | Oct MoM |
|---|---|---|---|
| Electricity | -2.6% | +1.7% | +5.2% |
| City gas | -0.5% | +4.9% | +5.9% |
| Gasoline | -2.6% | -2.3% | +0.1% |
MIC notes that electricity and city gas turning positive widened the headline gain by 0.18pt. Policy effects, including the abolition of the provisional gasoline tax, still subtract an estimated 0.35pt from the headline (Sep: 0.36pt).
Goods vs services
Goods inflation was 3.5% (Sep: 3.2%) while services was 2.2% (Sep: 2.3%), so the upside came from goods.
Two readings
- Constructive: energy turning positive suggests a drag is fading.
- Cautious: fresh produce is weather-driven, and one month rarely changes the trend.
For global readers: Japan’s energy inflation is shaped partly by tax changes and other policy measures, so the year-on-year rate can swing on policy timing as well as on oil and gas prices.
コアコアが低下した理由
Why core-core slowed, and what lifted it in September
One-year path (Tokyo core-core, YoY)
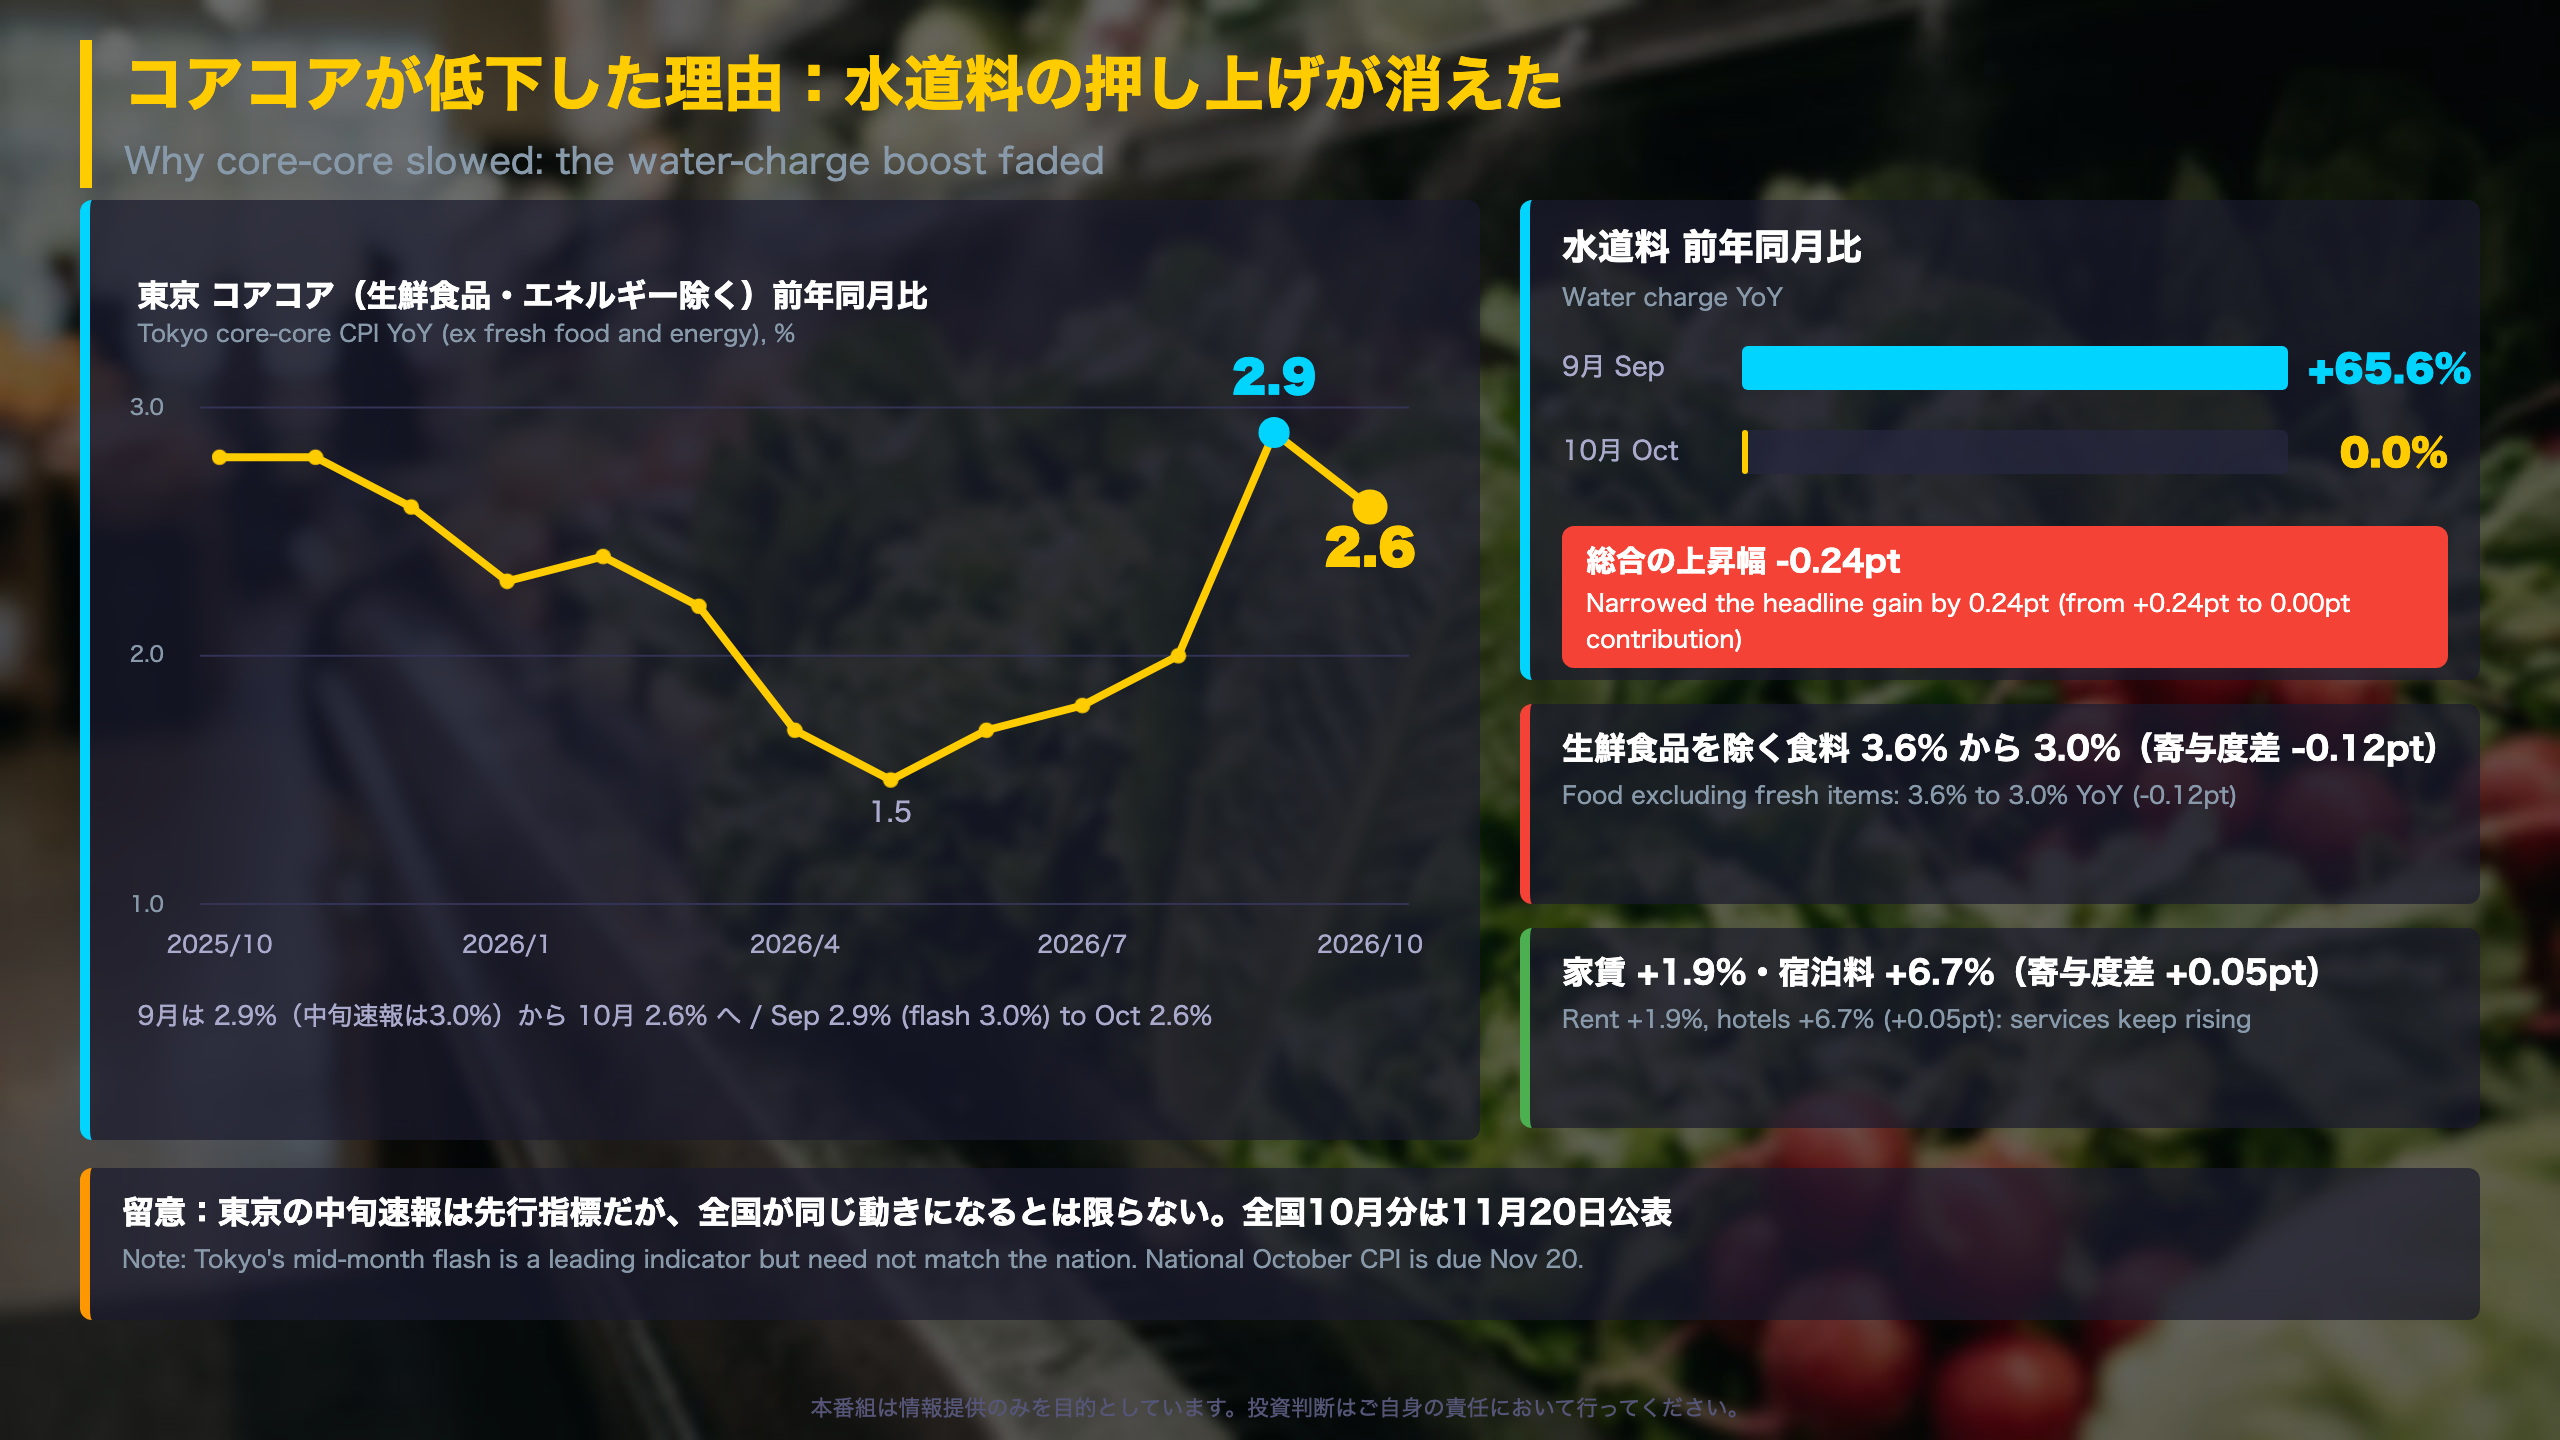
It stood at 2.8% in Oct-Nov 2025, fell to 1.5% in May 2026, then recovered: 1.8% in July, 2.0% in August, 2.9% in September and 2.6% in October.
September’s boosters (per the September release)
- Childcare fees: +0.29pt widening of the headline gain
- Water charges: +0.24pt
- Hotel prices: +0.12pt
In October, MIC states that water charges narrowed the headline gain by 0.24pt: water inflation went from +65.6% in September to 0.0%. Childcare fees (-100% YoY, a policy-driven drop) were unchanged from September and did not drive the October move.
Other moves
- Food excluding fresh items: 3.6% to 3.0% (-0.12pt). Cereals -7.2%, with non-Koshihikari rice -31.3%.
- Hotels +6.7% (+0.05pt), +9.6% MoM.
- Eating out +4.6% (0.29pt contribution).
Two readings
- Cautious: a set of September-specific factors fell away and monthly momentum cooled.
- Constructive: 2.6% remains well above the 1.5-1.7% seen in spring, and services such as dining out and lodging keep rising.
Comparison for global readers: unlike US core CPI, Japan’s core-core still includes food other than fresh items, which is why rice prices matter. The national October CPI on Nov 20 will show whether this shows up beyond Tokyo.
質疑で深める:東京が高めに出る理由と次の焦点
Why Tokyo reads higher than the nation, and what to watch next
Rent comparison
| Item | Tokyo (Oct) | Nation (Sep) |
|---|---|---|
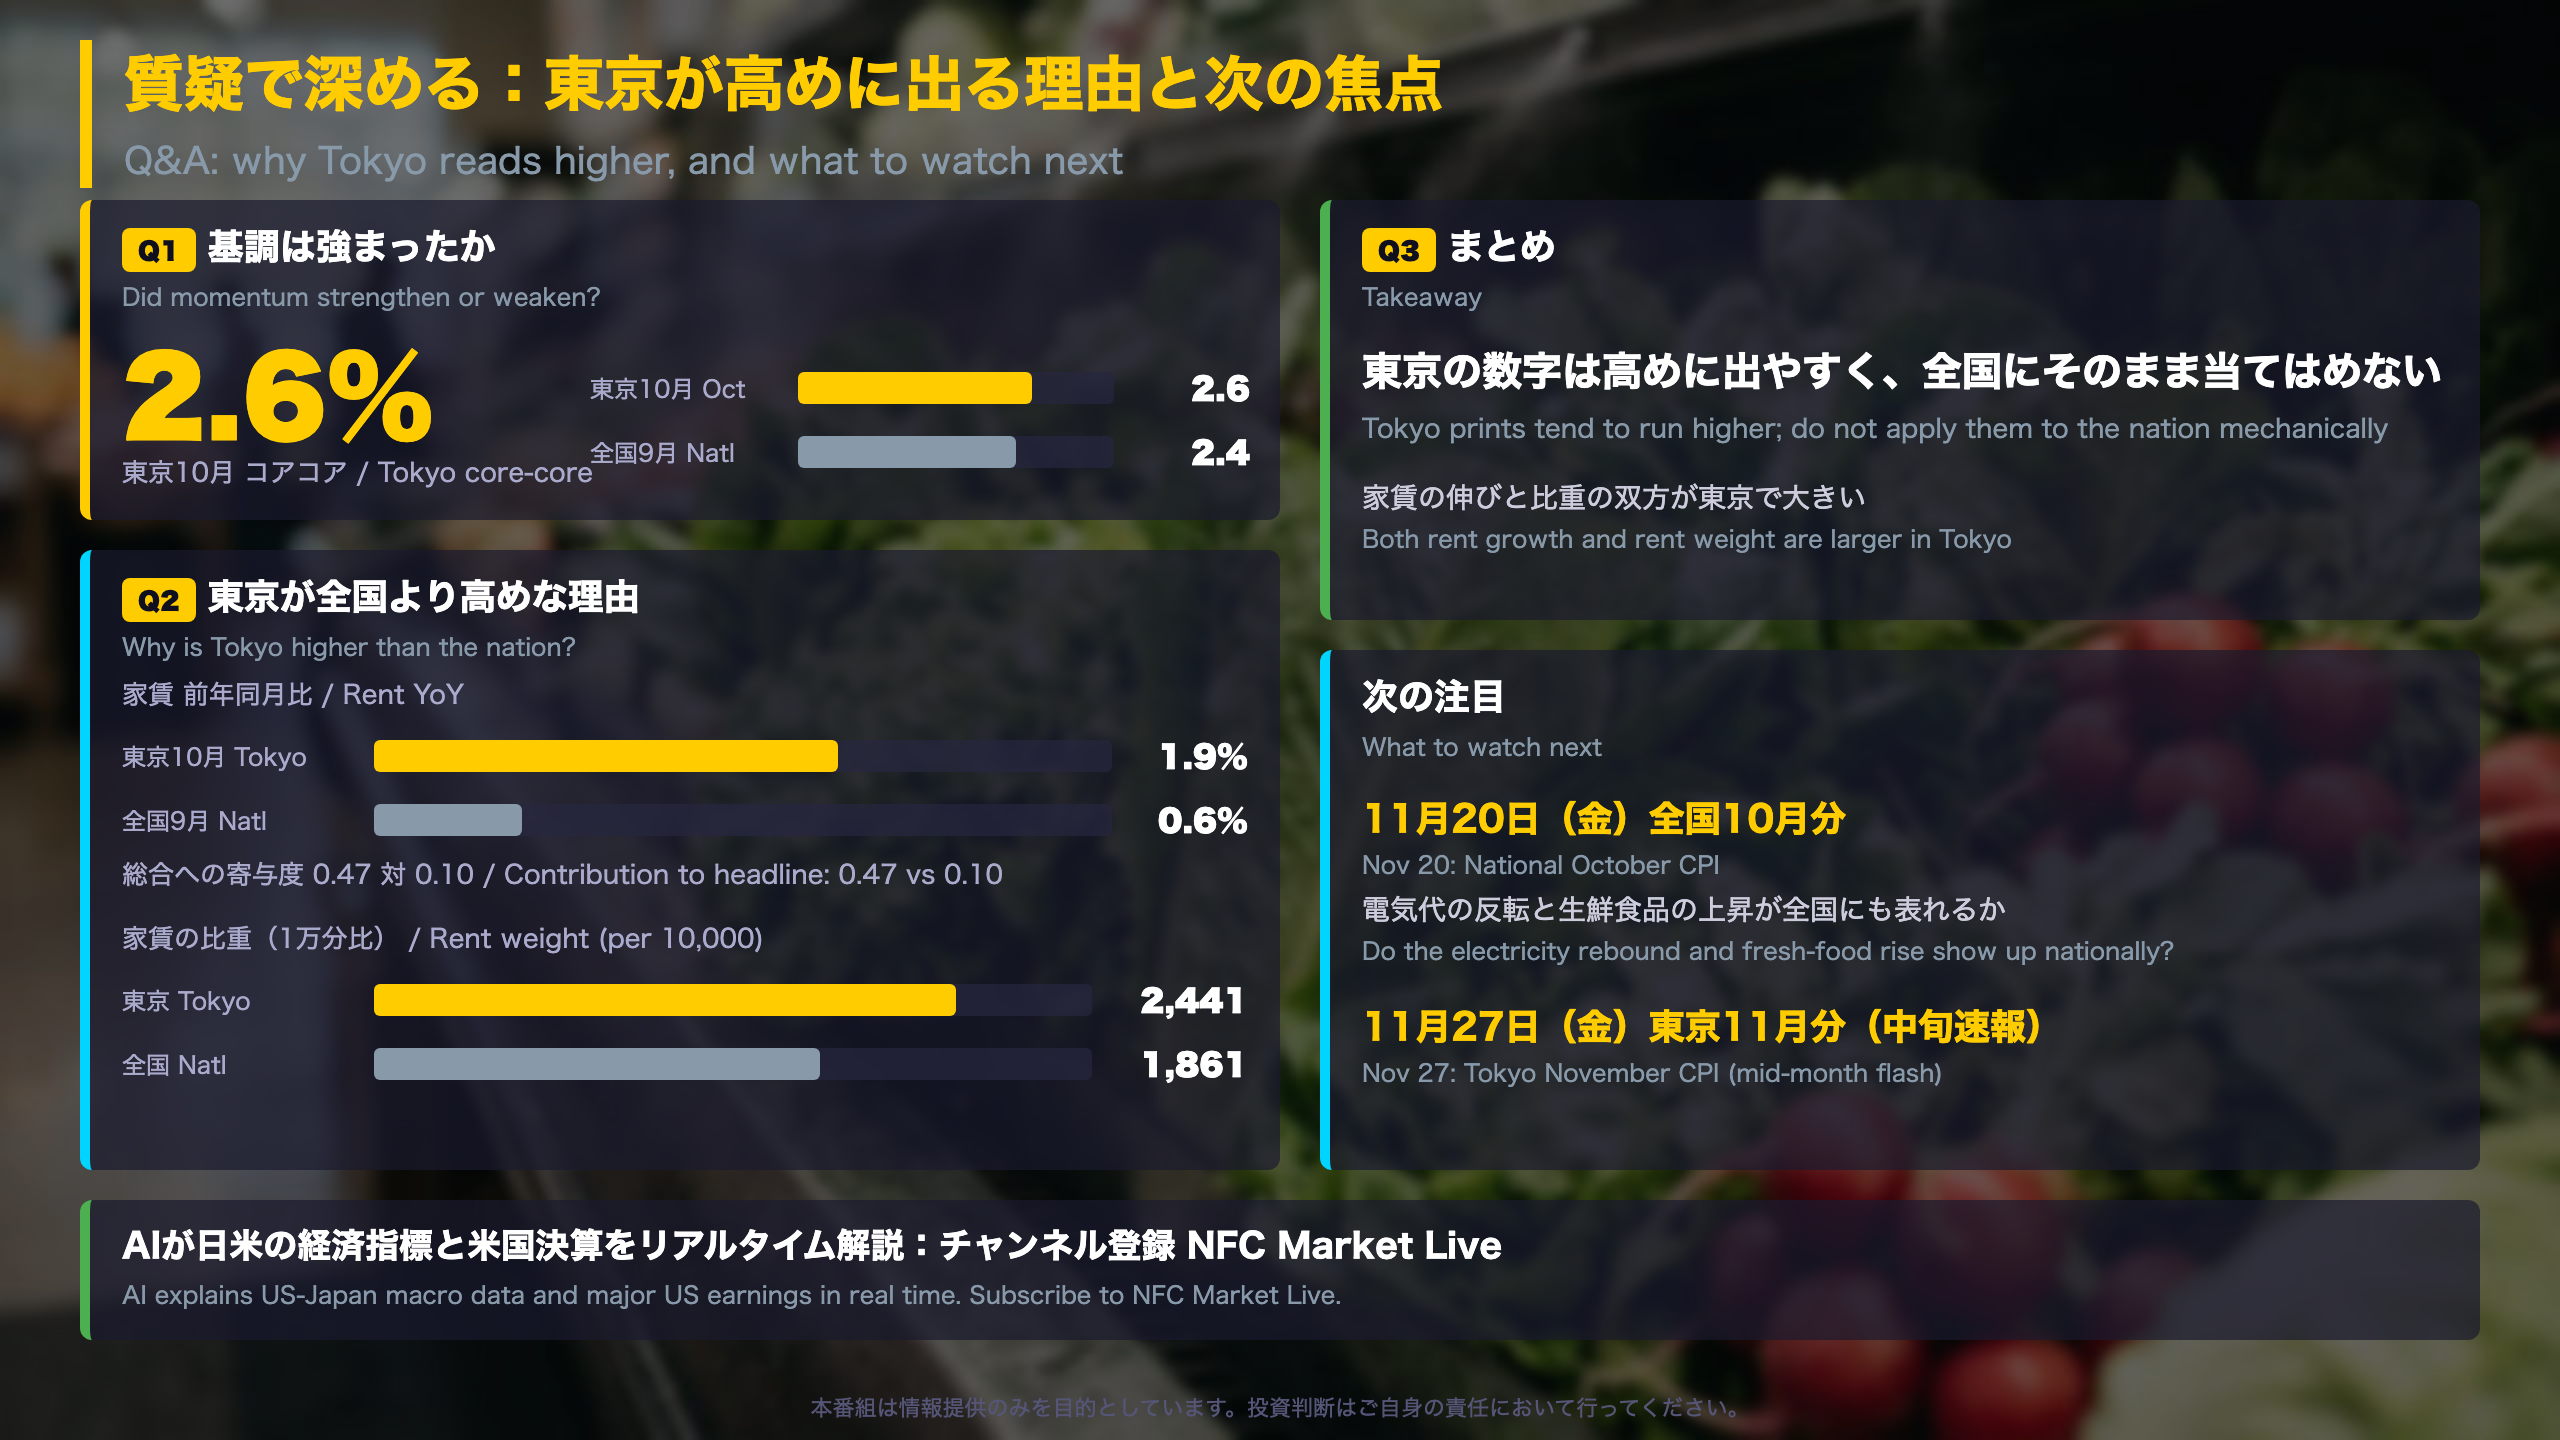
| Rent, YoY | +1.9% | +0.6% |
| Contribution to headline | 0.47pt | 0.10pt |
| Weight (per 10,000) | 2,441 | 1,861 |
Tokyo has both faster rent inflation and a heavier rent weight, so its contribution is more than four times larger (note the months differ).
Energy weight differs too
Energy carries a weight of 749 nationally versus 460 in Tokyo, and the estimated policy drag (gasoline tax abolition and related measures) was -0.82pt nationally in September versus -0.35pt in Tokyo in October. How Tokyo’s electricity rebound appears nationally therefore also depends on these weights.
Policy-driven drags
Tokyo: childcare fees -100% YoY (-0.21pt). Nation: private high-school tuition -73.2% (-0.15pt). Both are policy-related and hold down YoY readings.
Calendar
- Nov 20: national October CPI
- Nov 27: Tokyo November flash
- Dec 18: national November CPI
Independent take
Tokyo’s higher prints partly reflect structure, so they are not a direct forecast of the national number. At the same time, national core-core at 2.4% in September was above the 1.7-1.9% range of spring and summer, so the underlying trend has firmed. Neither reading should be pushed too far on one month of data.
Disclaimer: This article is for informational purposes only. All investment decisions are made solely at your own risk.