📺 Watch the Full Video Analysis
This article was automatically generated by the NFC Market Live AI analysis system. (Updated: 2026-07-01 14:10 JST)
📄 Primary Source
内閣府経済社会総合研究所
https://www.esri.cao.go.jp/jp/stat/shouhi/gaiyou.pdf, https://www.esri.cao.go.jp/jp/stat/shouhi/honbun.pdf
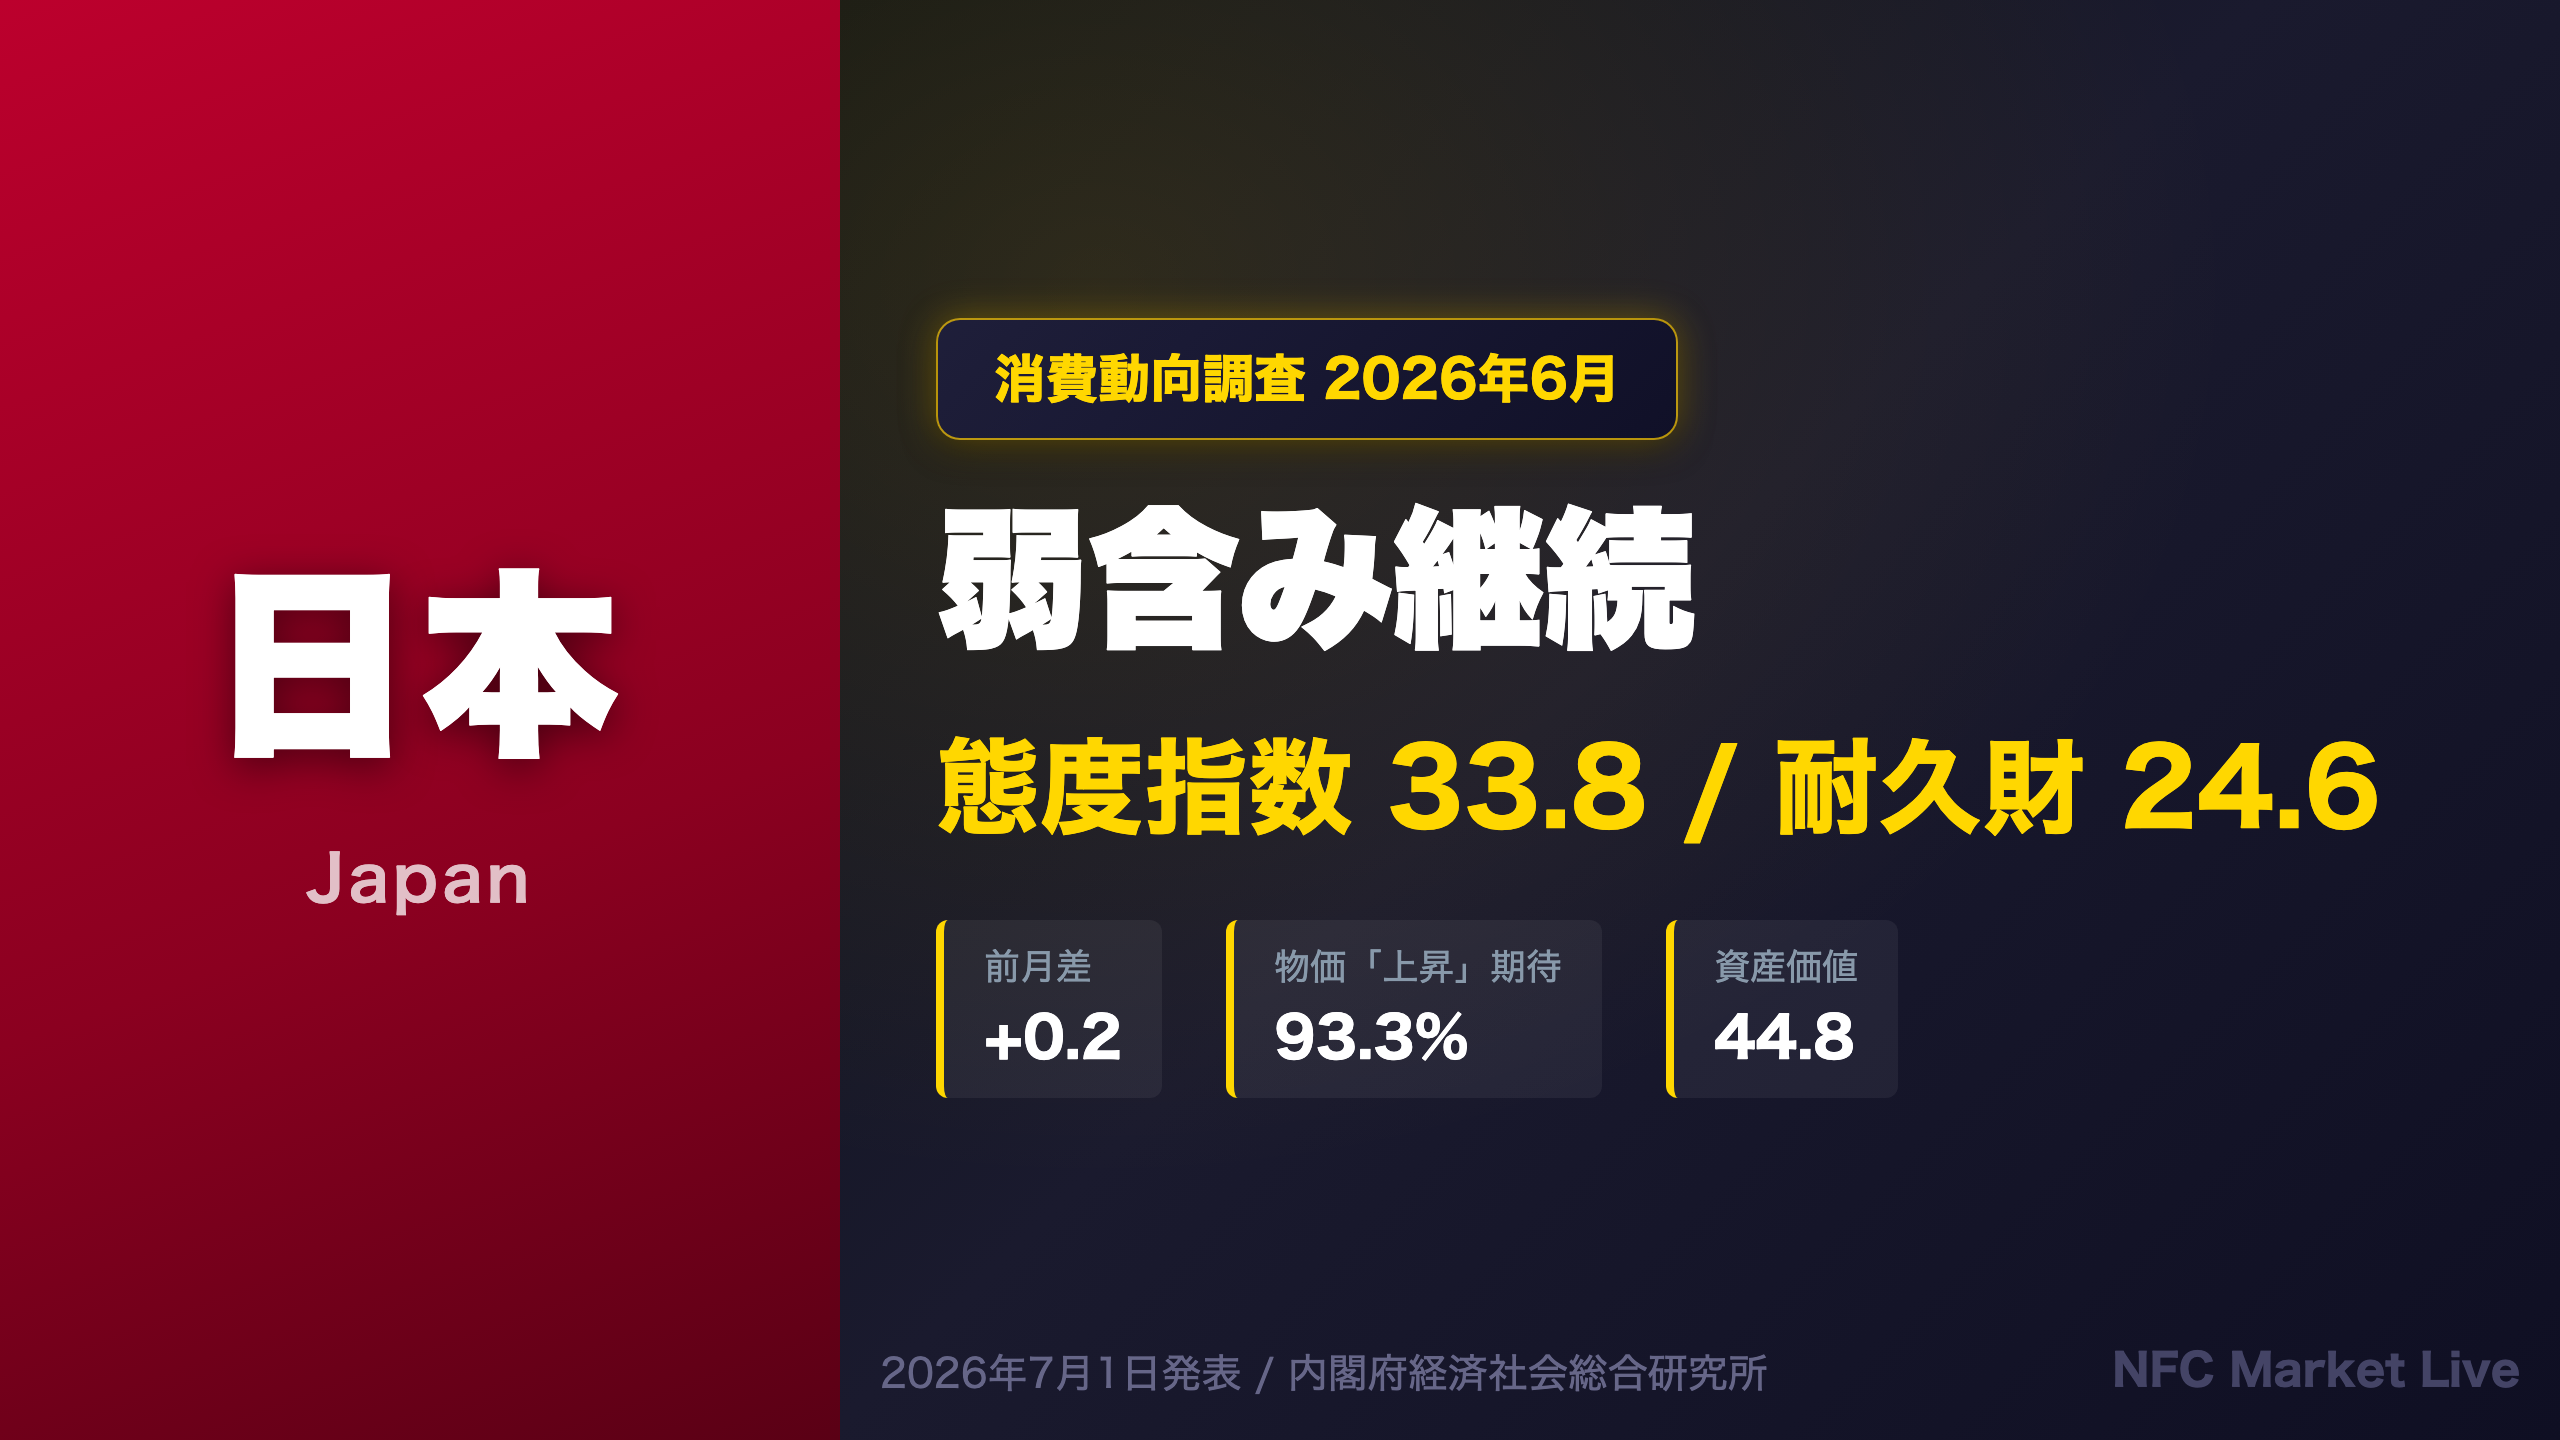
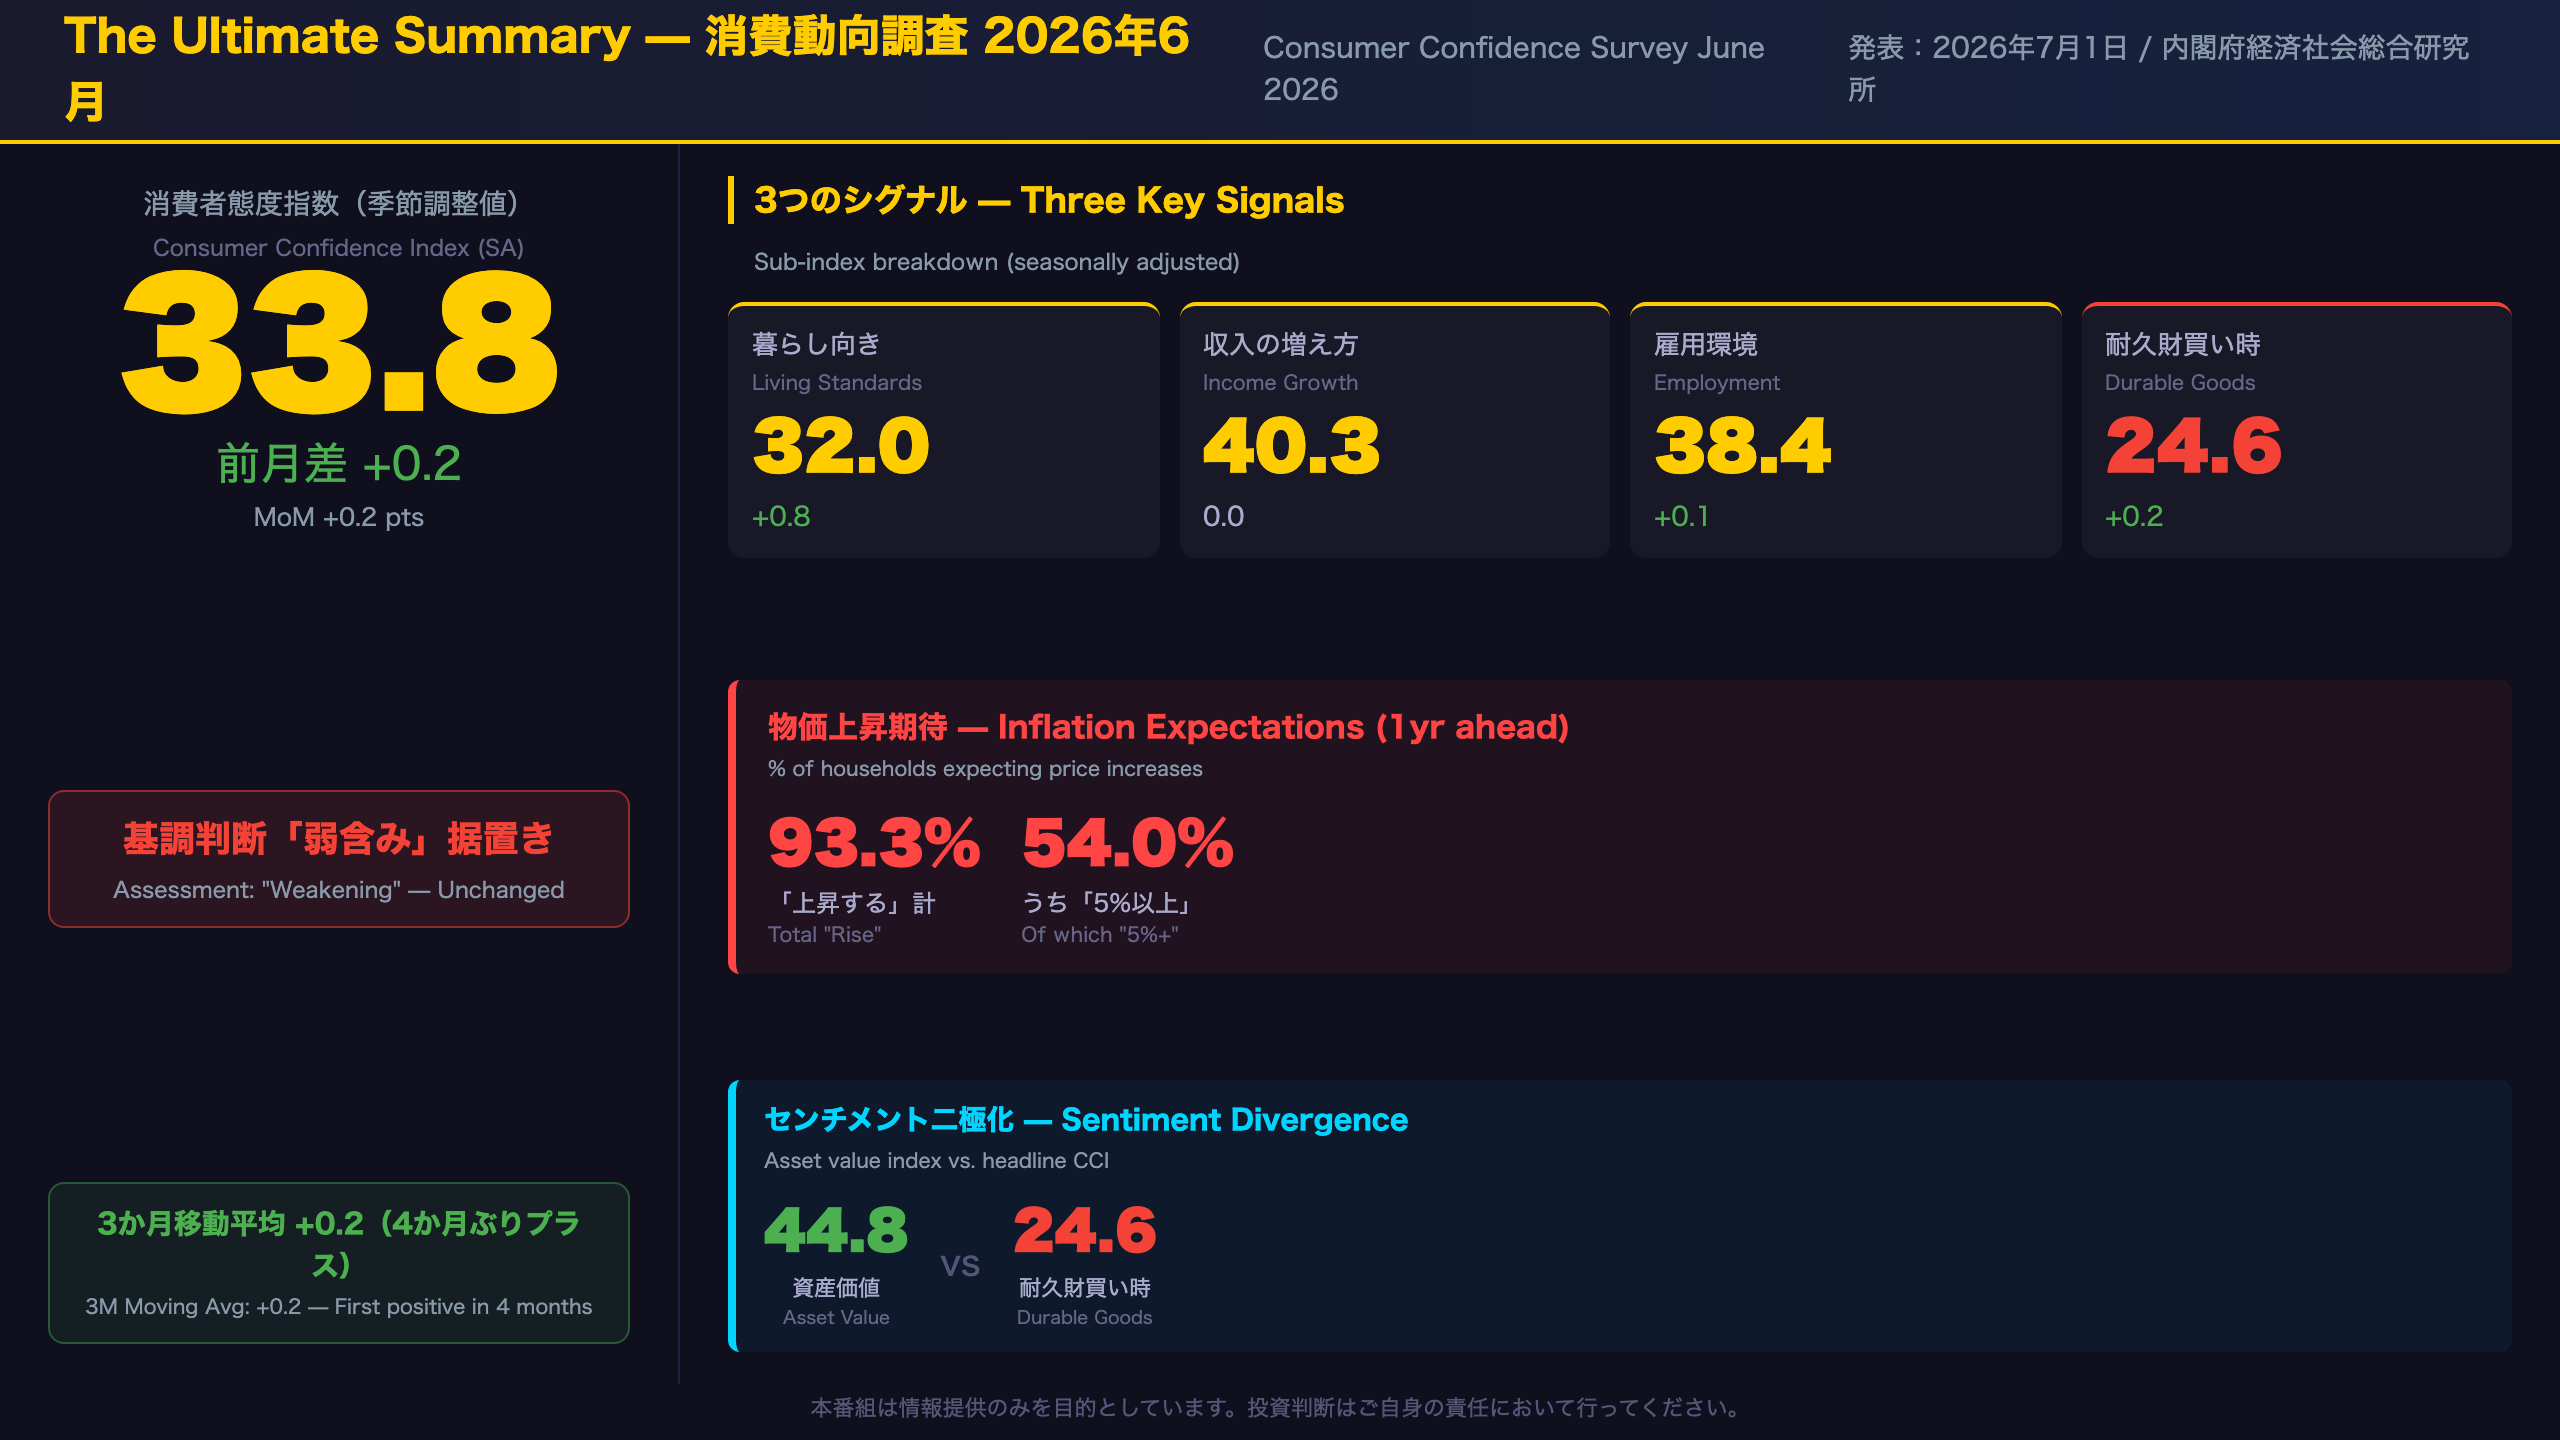
Japan’s Cabinet Office released the June 2026 Consumer Confidence Survey on July 1. The headline Consumer Confidence Index edged up +0.2 to 33.8, with the 3-month moving average turning positive for the first time in 4 months — yet the Cabinet Office maintained its ‘weakening’ assessment. The durable goods purchase timing index remains near historic lows at 24.6, while the asset value index holds relatively firm at 44.8. Over 93% of households expect prices to rise in the next 12 months. We break down the structural divergence in sentiment and its implications for BOJ policy and retail stocks.
The Ultimate Summary:6月消費者態度指数が示す3つのシグナル
The Ultimate Summary: Three Signals from Japan’s June 2026 Consumer Confidence Index
What Is the Consumer Confidence Survey?
The Consumer Confidence Survey (消費動向調査, Shōhi Dōkō Chōsa) is a monthly survey conducted by Japan’s Cabinet Office Economic and Social Research Institute (ESRI). It polls approximately 8,400 households nationwide on their 6-month outlook across five dimensions: living standards, income growth, employment conditions, durable goods purchase timing, and asset values. The headline Consumer Confidence Index (CCI) is the simple average of the first four sub-indices (seasonally adjusted).
June 2026 Headline: 33.8, Up 0.2
The June reading of 33.8 (+0.2 MoM) marks the second consecutive monthly gain following March’s dramatic plunge of -6.4 points. The 3-month moving average turned positive (+0.2) for the first time in four months. Despite this, the Cabinet Office maintained its ‘weakening’ (弱含み) assessment — a signal that officials view the recovery as insufficient to change the directional call.
Three Structural Signals
Signal 1 — Slow Recovery Pace
The rebound from March’s trough (33.3) has been gradual: +1.4 in May, +0.2 in June. The gap versus February’s peak (39.7) remains approximately 6 points.
Signal 2 — Durable Goods Timing Near Historic Lows
At 24.6, the durable goods purchase timing index remains well below its 2024 average of approximately 30. This sub-index has the weakest recovery trajectory among all four components.
Signal 3 — Asset Value Divergence
The asset value index (not included in the headline CCI) held at 44.8, roughly 11 points above the headline index. This gap may suggest a sentiment divergence between asset-holding households (equities, real estate) and those without financial assets — a dynamic worth monitoring as a potential indicator of consumption inequality.
Inflation Expectations Context
Over 93% of respondents expect prices to rise in the next 12 months, with 54% expecting gains of 5% or more. Whether this translates into front-loaded buying or purchasing power anxiety is a key open question — one that this dataset alone cannot resolve.
Watch for Next Month
The July survey (expected August release) will be critical: if the 3-month moving average sustains its positive turn, the Cabinet Office may consider upgrading its baseline assessment.
センチメントの分解:4指標の変化を主導したのは何か
Decomposing the Sentiment: What Drove the June Change?
The Quality of Improvement Matters
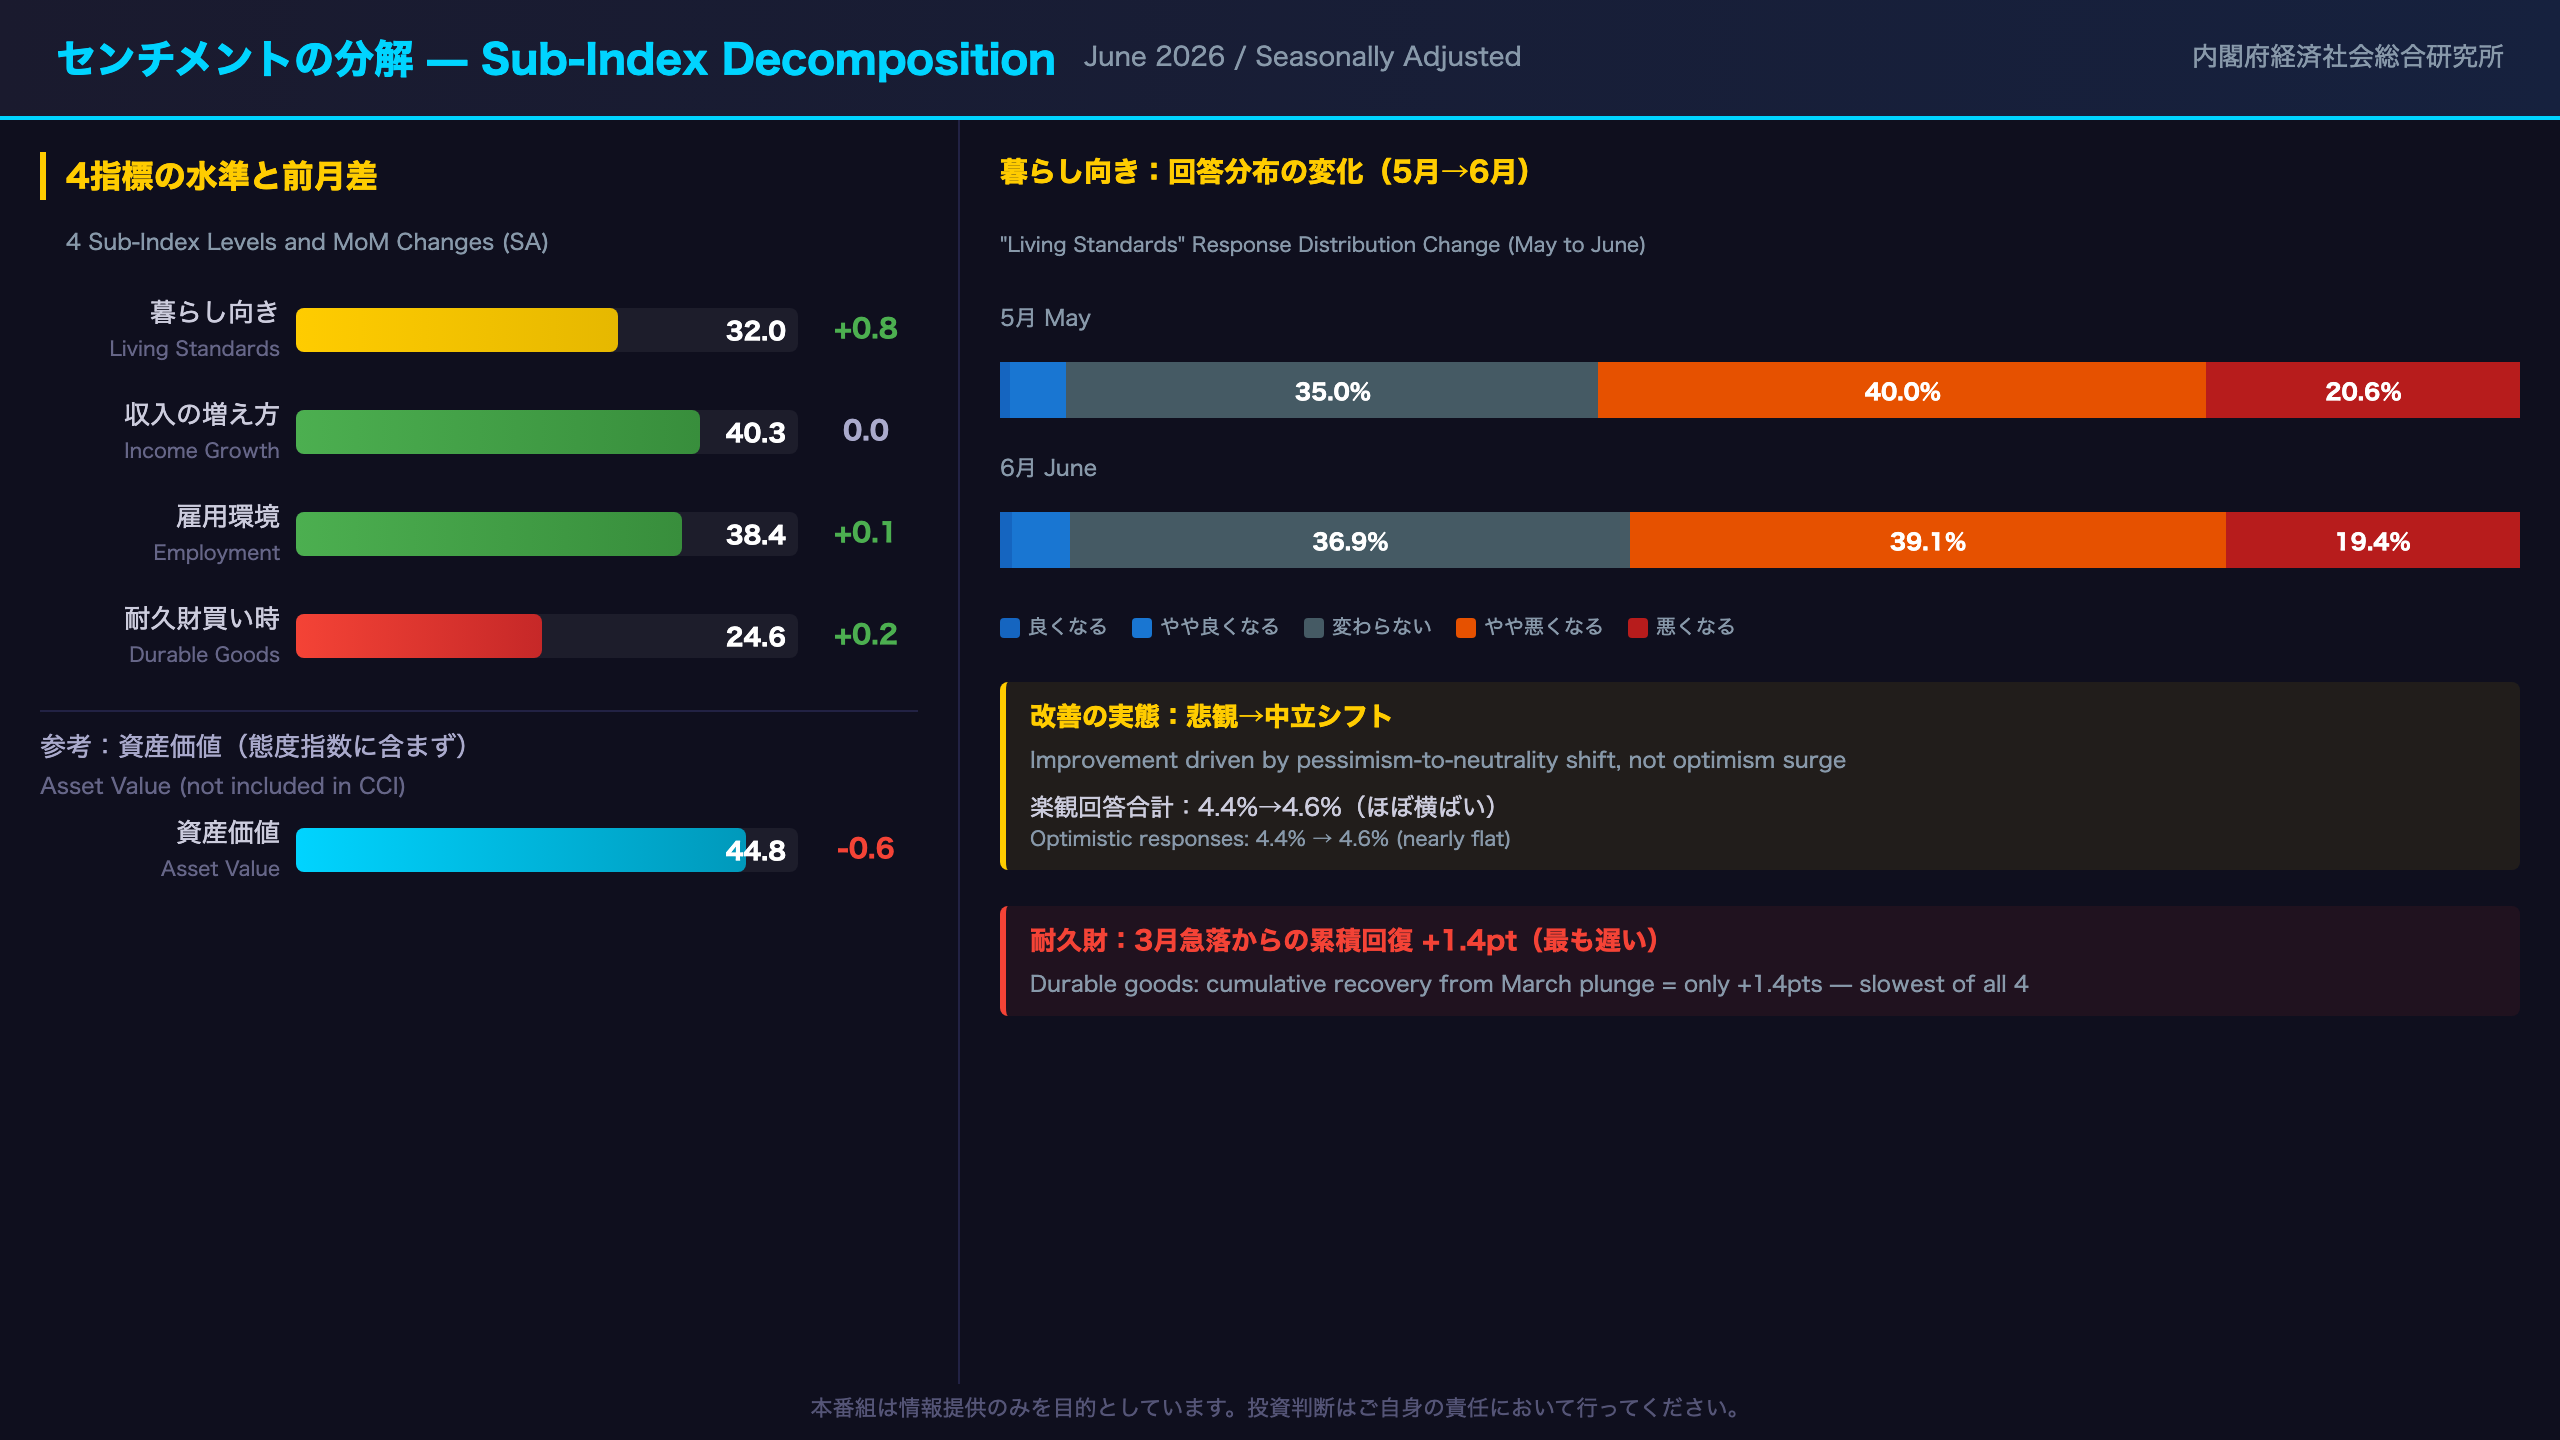
The headline improvement of +0.2 in the CCI was primarily driven by the ‘living standards’ sub-index (+0.8). However, a closer look at the response distribution reveals that the improvement was driven by a shift from pessimism to neutrality, not a surge in optimism:
- ‘Will worsen’: 20.6% → 19.4% (-1.2pp)
- ‘Will somewhat worsen’: 40.0% → 39.1% (-0.9pp)
- ‘Unchanged’: 35.0% → 36.9% (+1.9pp)
- ‘Will somewhat improve’ + ‘Will improve’: 4.4% → 4.6% (barely changed)
This is a meaningful distinction. A genuine sentiment recovery would typically show an increase in optimistic responses. The current pattern suggests households are becoming less pessimistic rather than more confident.
Durable Goods: The Laggard
The durable goods purchase timing index (24.6) remains the weakest of all four components — the only one still in the mid-20s. Since March’s plunge of -7.7 points, the cumulative recovery is just +1.4 points over two months. The share answering ‘will worsen’ fell to 26.4% from 28.3%, but ‘will somewhat worsen’ ticked up slightly to 52.0% from 51.4%, suggesting the pessimistic structure remains entrenched.
Income and Employment: Relative Stability
‘Income growth’ (40.3, flat) and ‘employment conditions’ (38.4, +0.1) are the most stable components. While both remain well below their February 2026 peaks (42.3 and 43.3 respectively), the absence of further deterioration is a modestly positive signal.
International Context
For reference, Japan’s CCI at 33.8 compares to a theoretical neutral level of 50 (where equal shares expect improvement and deterioration). The persistent sub-40 readings across all components reflect a structural caution that has characterized Japanese consumer sentiment since mid-2024.
物価期待との連動:インフレは「買い急ぎ」か「購買力不安」か
Inflation Expectations: Front-Loading or Purchasing Power Anxiety?
The Data
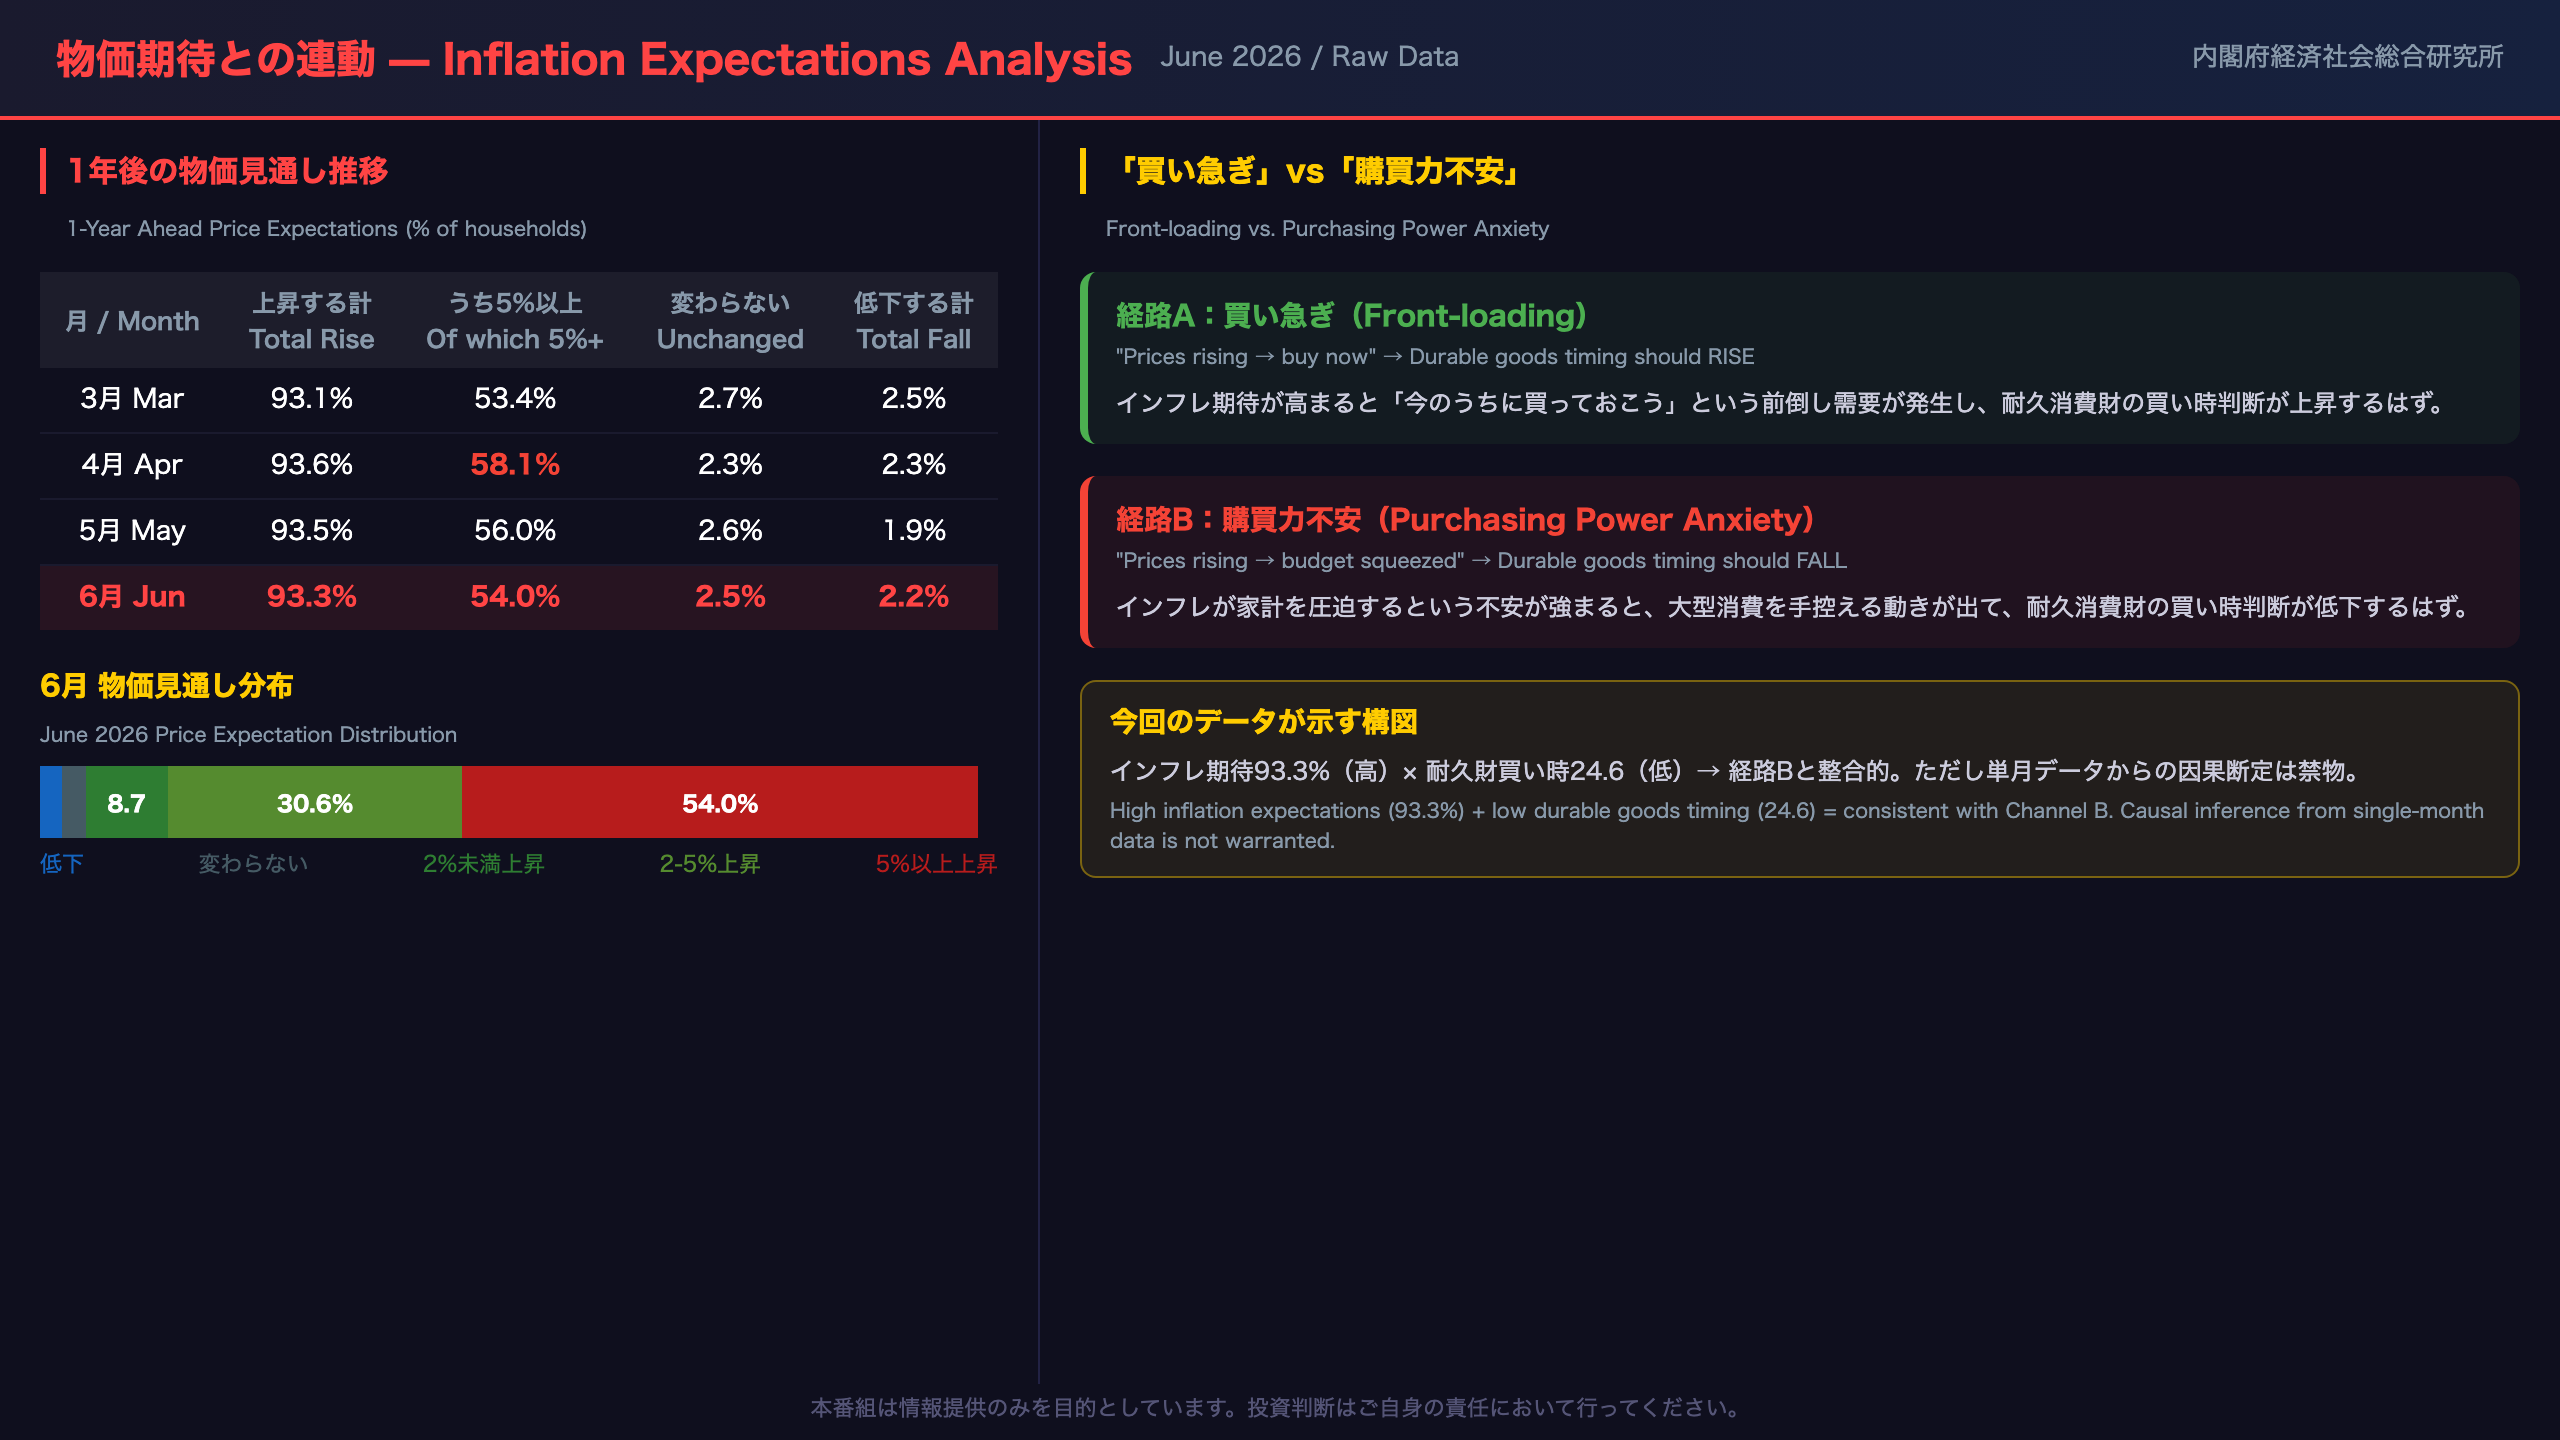
June’s inflation expectations data shows 93.3% of households expect prices to rise over the next 12 months — a level that has been sustained above 90% for an extended period. The modal response remains ‘5% or more’ at 54.0%, down from April’s peak of 58.1% but still representing an absolute majority of respondents.
Two Competing Channels
Economic theory suggests two competing channels through which inflation expectations affect consumer behavior:
Channel A (Front-loading): “Prices will rise, so I should buy now” → Should manifest as higher durable goods purchase timing scores
Channel B (Purchasing power anxiety): “Rising prices will squeeze my budget” → Should manifest as lower durable goods purchase timing scores
The June data shows high inflation expectations (93.3%) coexisting with a near-historic-low durable goods purchase timing index (24.6). This pattern is consistent with Channel B, but a single month’s data is insufficient to establish causality.
Year-on-Year Context
According to the time-series table, the ‘price rise’ share in June 2026 (93.3%) is +1.2 percentage points above June 2025 (92.1%). Inflation expectations have risen year-on-year, suggesting this is not a temporary phenomenon.
The Shrinking ‘Unchanged’ Camp
The share expecting prices to be ‘roughly unchanged’ (0%) has fallen to just 2.5% — compared to approximately 3% throughout 2024. The near-disappearance of the ‘stable prices’ camp reflects a fundamental shift in Japanese consumer inflation psychology that has been building since 2022.
BOJ Policy Implication
The BOJ’s 2% inflation target is well-anchored in consumer expectations — in fact, expectations significantly overshoot the target. However, if this inflation expectation is functioning as a headwind to consumption rather than a tailwind, it complicates the BOJ’s assessment of whether the ‘virtuous cycle’ between wages, prices, and consumption is operating as intended. This is a consideration worth monitoring, though the data alone cannot confirm this interpretation.
資産価値指標との乖離:センチメントの二極化を読む
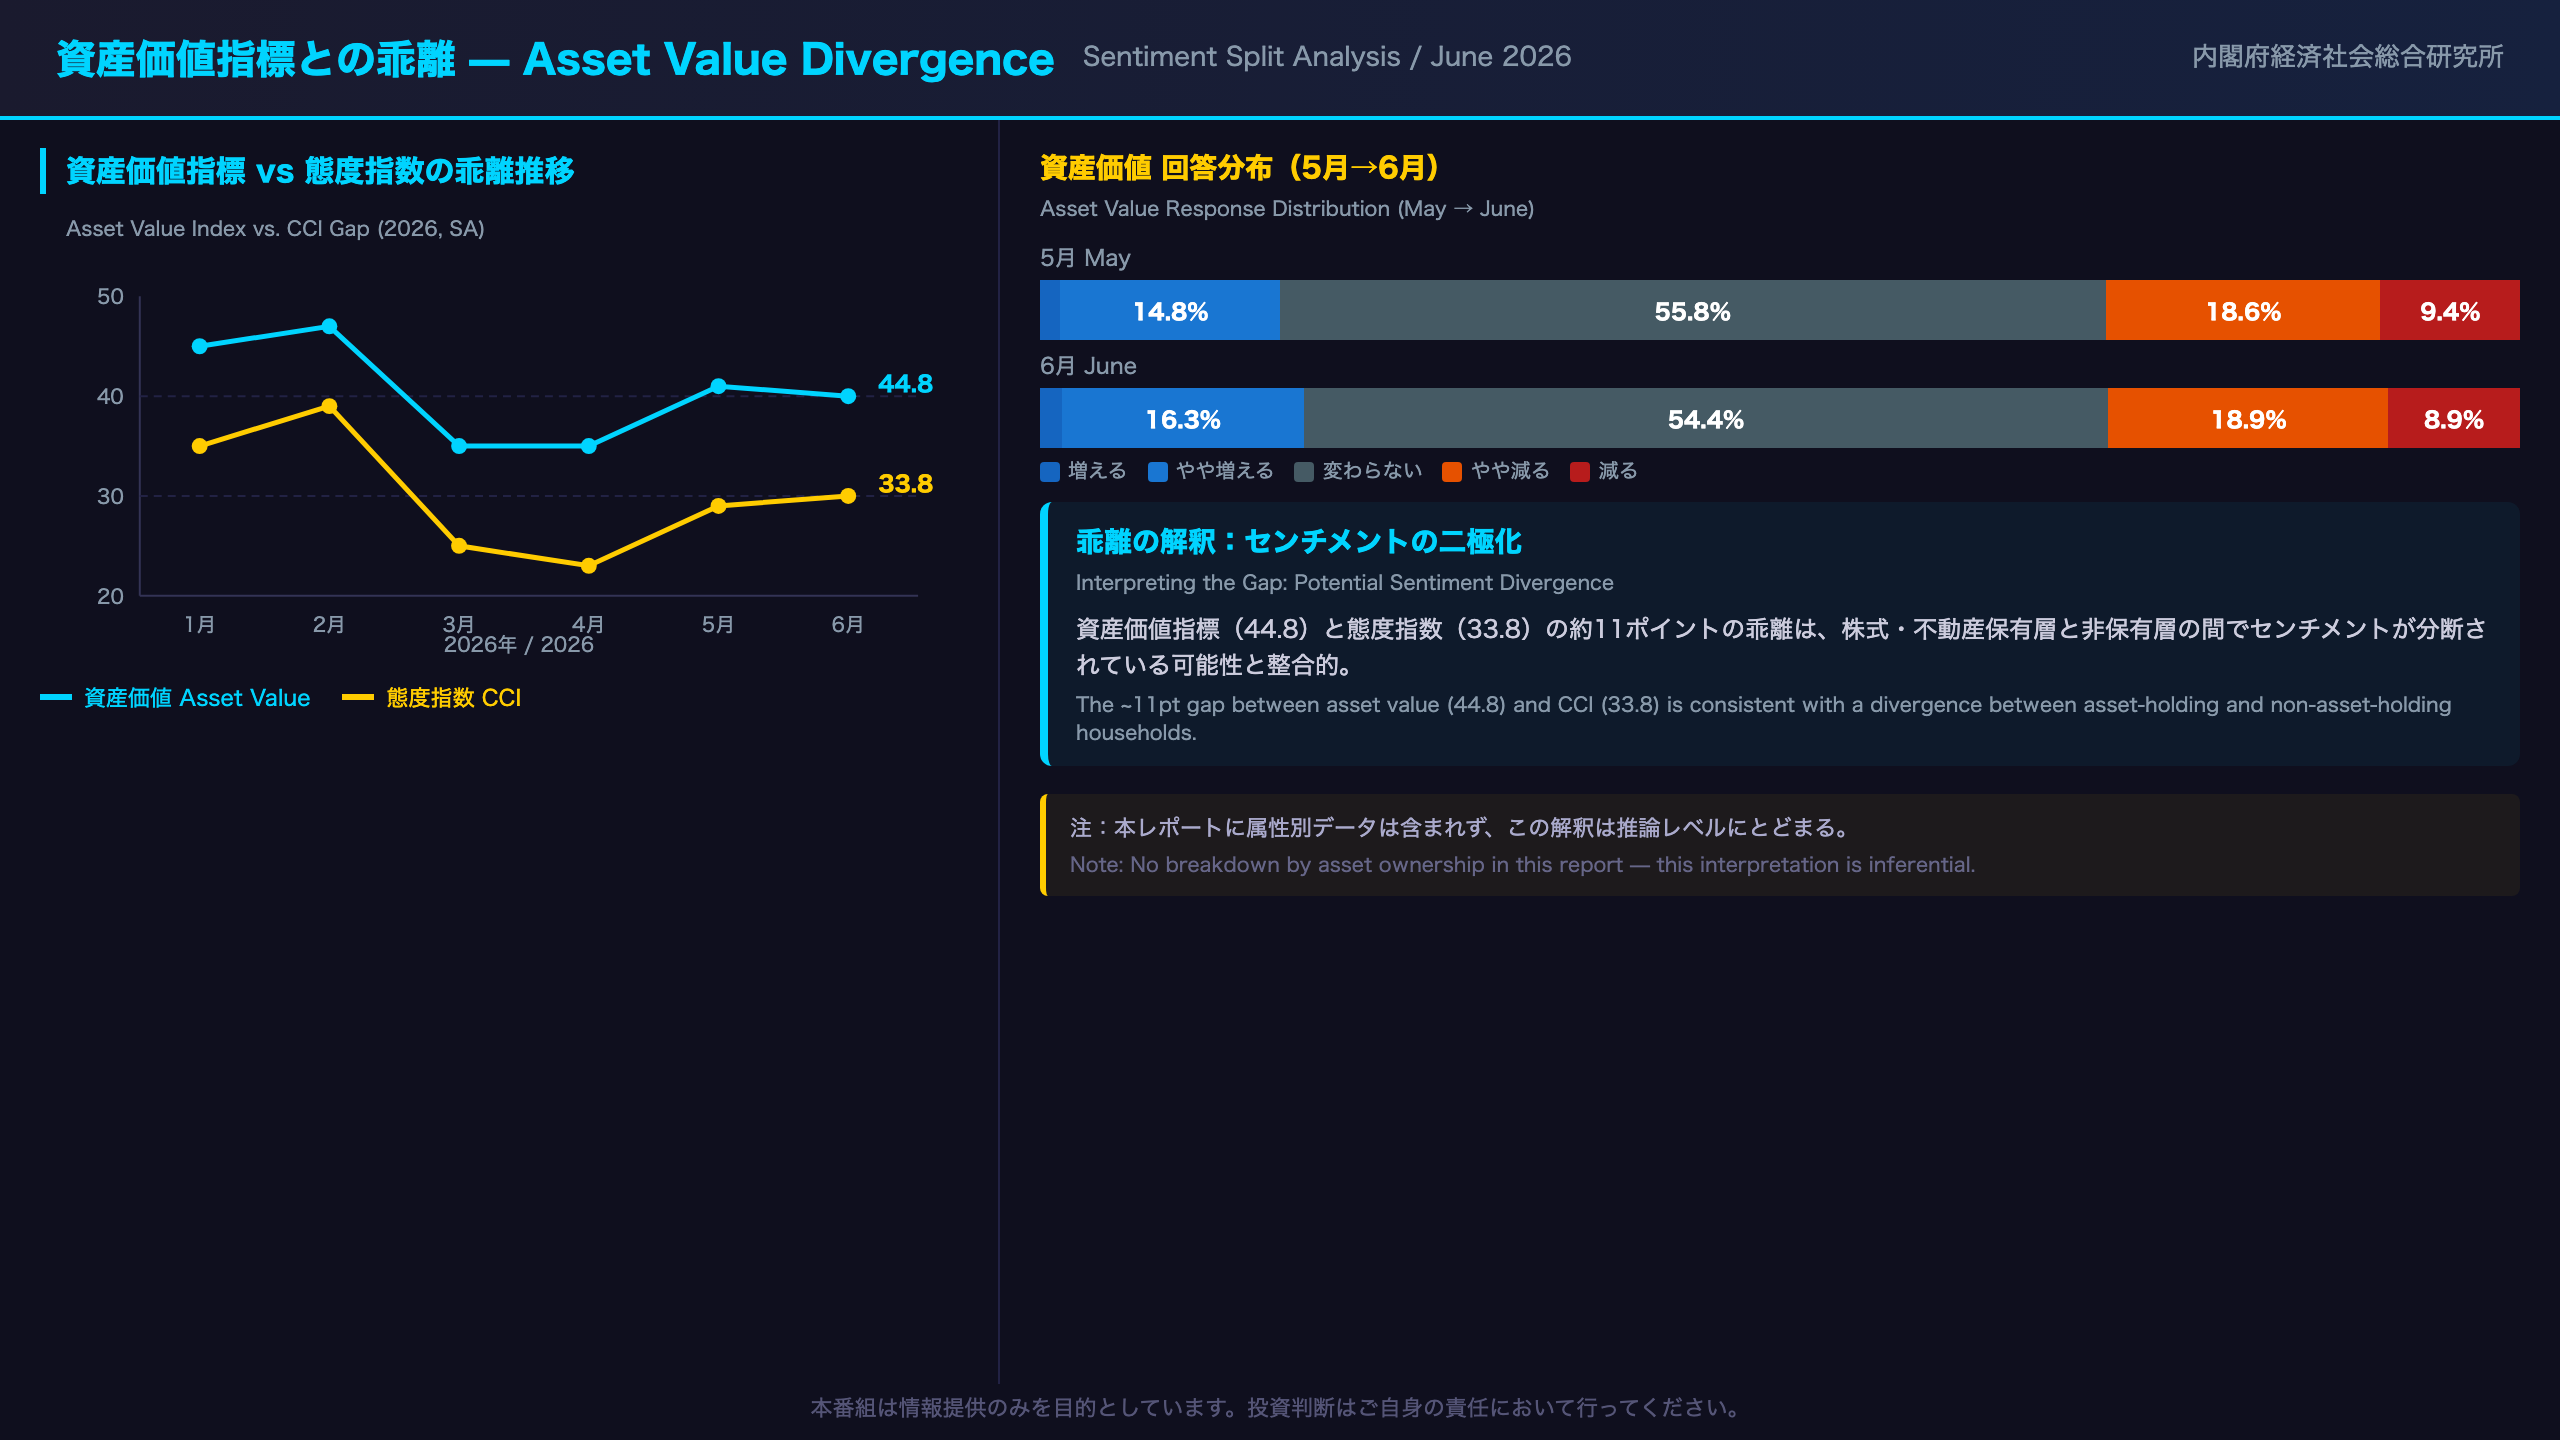
Asset Value Divergence: Reading the Sentiment Split
The Growing Gap
The asset value index (44.8) and the headline CCI (33.8) are separated by approximately 11 points — a gap that has been widening since early 2026:
| Month | Asset Value (SA) | CCI (SA) | Gap |
|---|---|---|---|
| Jan 2026 | 47.3 | 37.6 | 9.7 |
| Feb 2026 | 48.5 | 39.7 | 8.8 |
| Mar 2026 | 41.9 | 33.3 | 8.6 |
| Apr 2026 | 41.9 | 32.2 | 9.7 |
| May 2026 | 45.4 | 33.6 | 11.8 |
| Jun 2026 | 44.8 | 33.8 | 11.0 |
What the Asset Value Index Measures
The asset value question asks respondents about their outlook for the value of stocks, land, and other assets they own over the next 6 months. This makes the index inherently more sensitive to the views of households that hold financial assets or real estate — a subset of the total survey population.
June Response Distribution
The June distribution shift shows ‘will somewhat increase’ rising +1.5pp to 16.3%, while ‘unchanged’ fell -1.4pp to 54.4%. The net effect was a slight decline of -0.6 points in the index, suggesting the distribution shift was not large enough to overcome the modest increase in ‘will somewhat decrease’ (+0.3pp to 18.9%).
Interpreting the Divergence
The 11-point gap between the asset value index and the headline CCI is consistent with a sentiment divergence between asset-holding and non-asset-holding households. Asset holders may be benefiting from equity and real estate price dynamics, while non-holders are primarily experiencing the negative purchasing power effects of inflation. However, this interpretation is an inference from the survey design — the report does not provide breakdown data by asset ownership status, so this remains a hypothesis rather than a confirmed finding.
Why This Matters for Consumption Analysis
If the divergence reflects a genuine split between asset-rich and asset-poor households, it has implications for the composition of consumption growth: spending by asset-holding households (luxury goods, travel, services) may hold up better than spending by non-asset-holding households (everyday goods, durable goods). This is consistent with the durable goods purchase timing index remaining near historic lows.
インプリケーション:日銀政策・消費株・為替への示唆
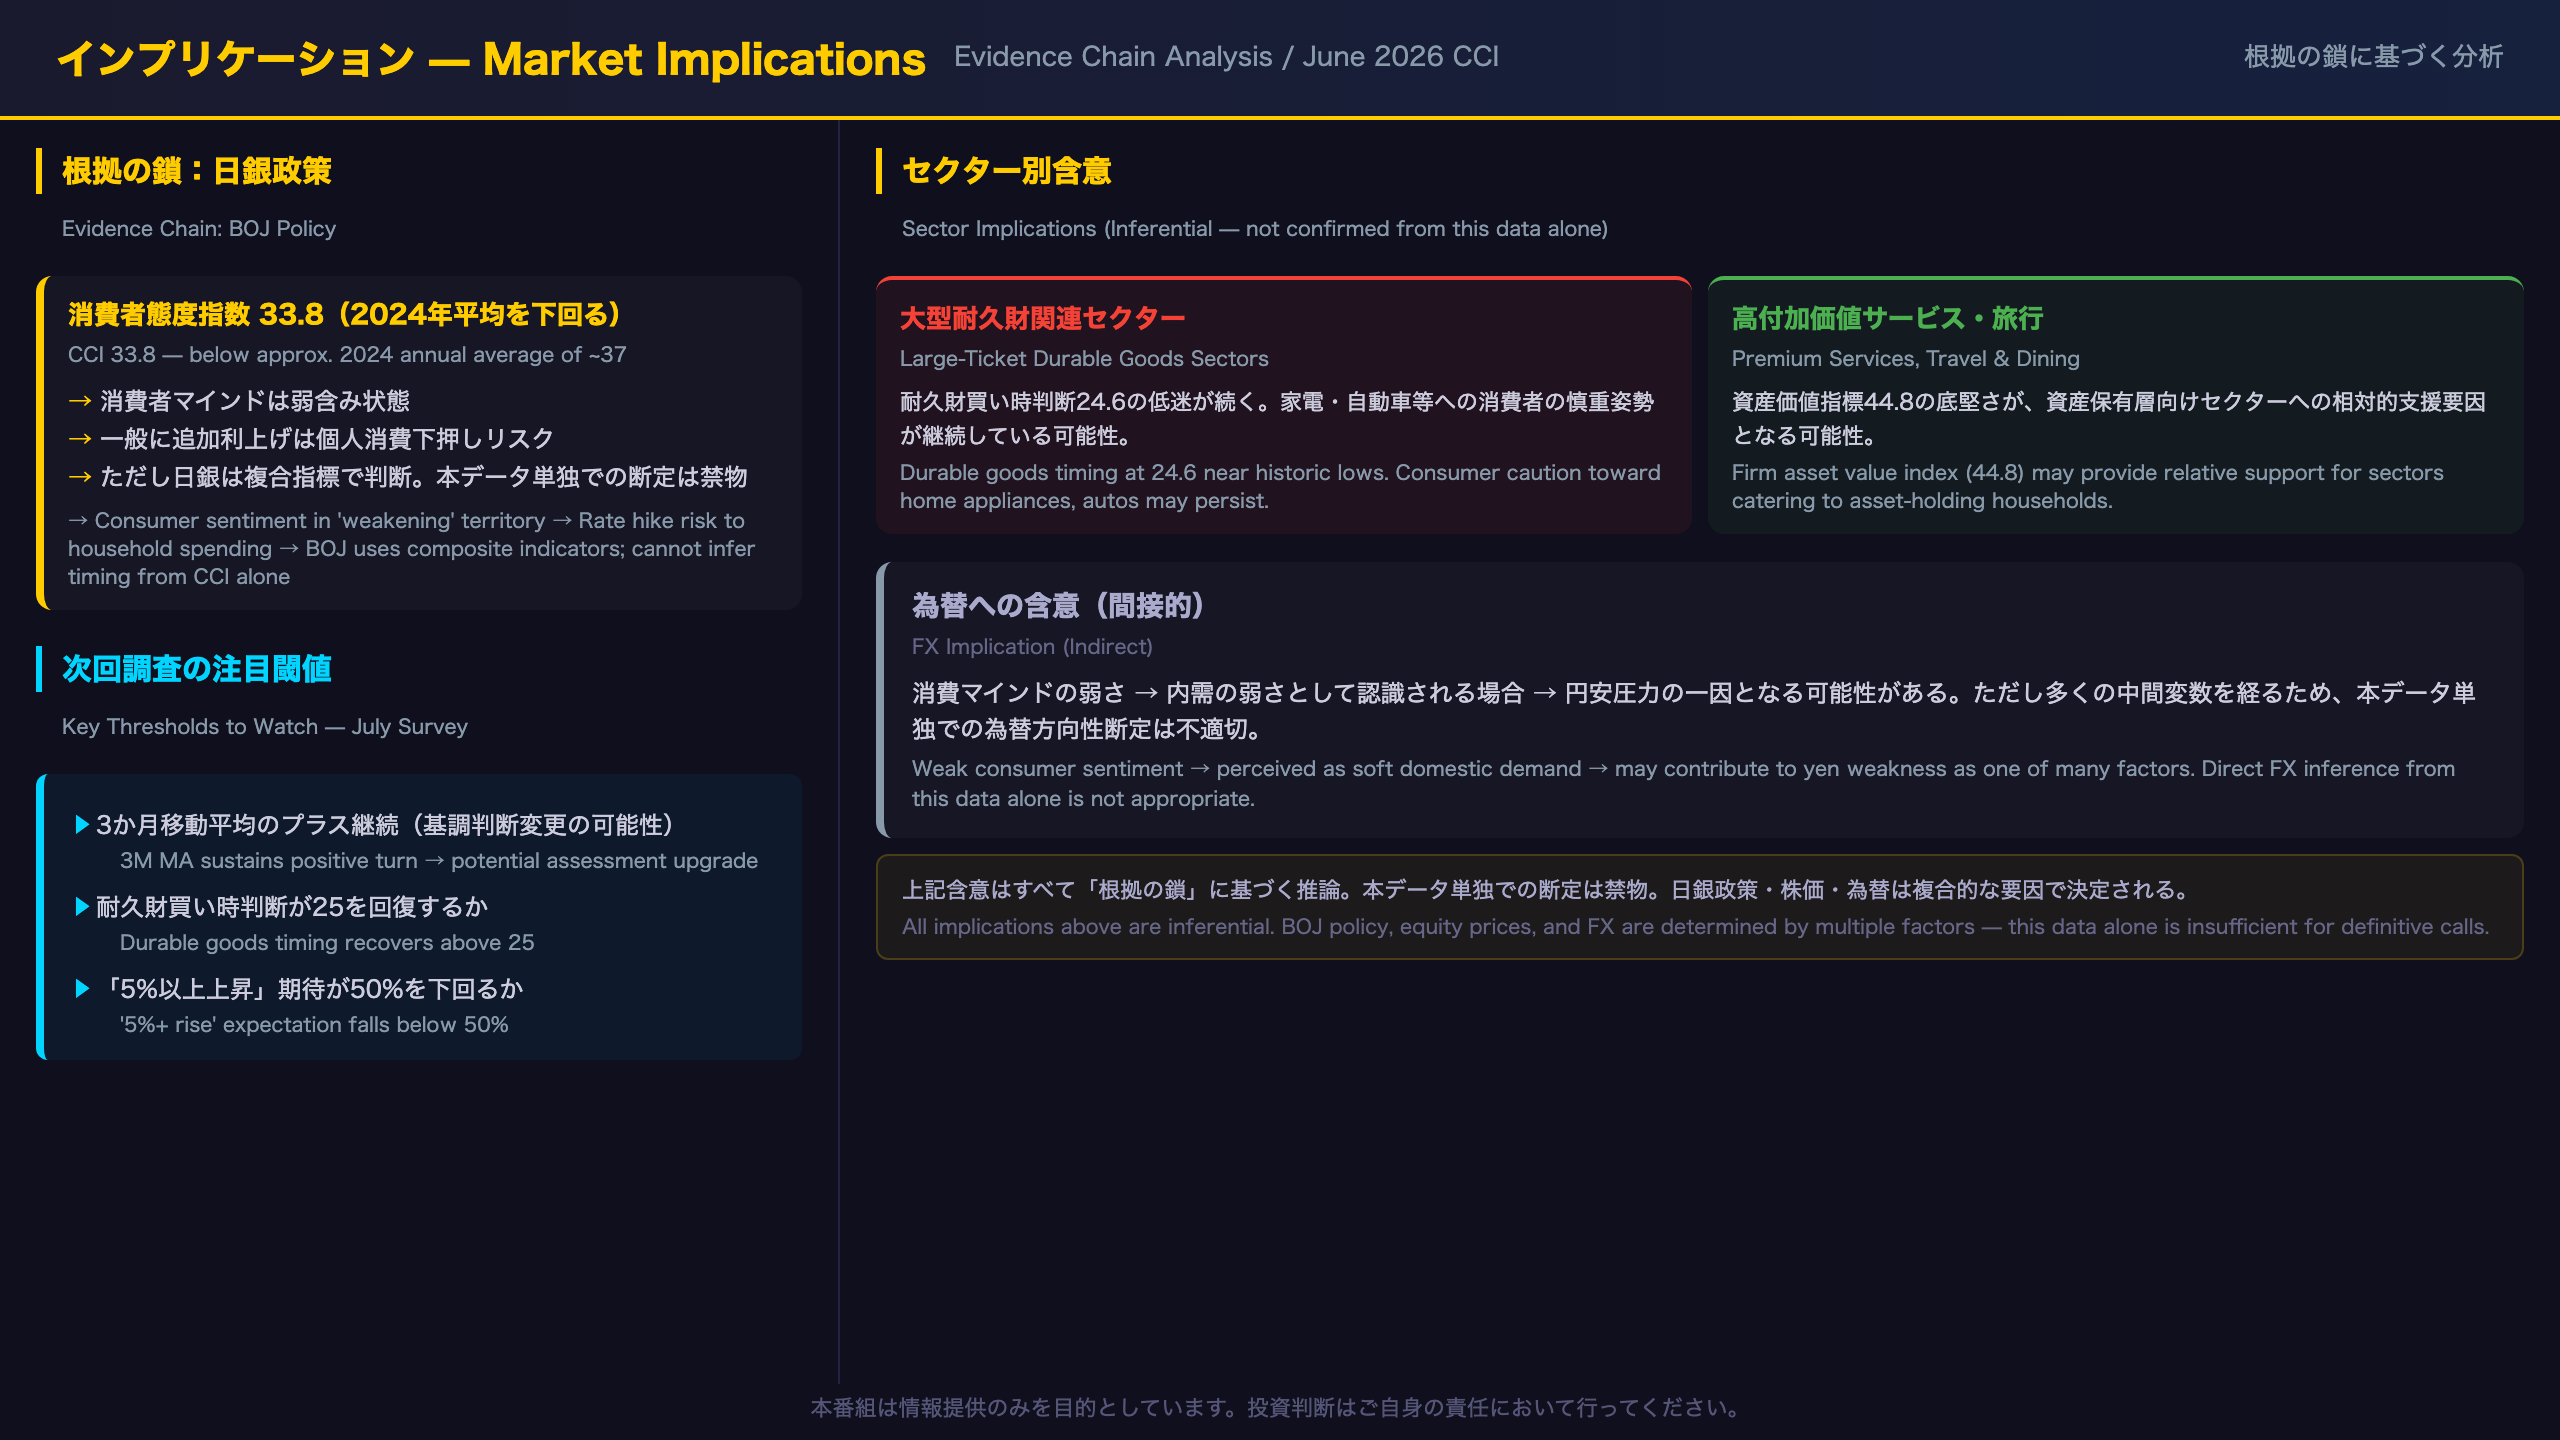
Implications: BOJ Policy, Consumer Stocks, and FX
Evidence Chain Analysis
BOJ Policy Implication
CCI at 33.8 (below approximate 2024 annual average of ~37) → Consumer sentiment in ‘weakening’ territory → In general, additional rate hikes during weak consumer sentiment periods carry the risk of further dampening household spending → However, BOJ decisions are based on composite indicators (wages, CPI, GDP, etc.) — rate hike timing cannot be inferred from this data alone
Retail and Services Sector Implication
Durable goods purchase timing at 24.6 (near historic lows) → Persistent consumer caution toward big-ticket purchases → May suggest caution toward large-ticket durable goods sectors (home appliances, automobiles) — though single-month data is insufficient for sector calls
Asset value index at 44.8 (relatively firm) → Asset-holding household sentiment relatively positive → May suggest relative resilience in premium services, travel, and dining sectors catering to asset-holding consumers
FX Implication
The CCI is not a direct FX indicator. However, if weak consumer sentiment translates into soft domestic demand, and if that is perceived as a signal of weak Japanese internal demand, it could be one factor among many contributing to yen weakness. The causal chain involves many intermediate variables, making direct FX inference from this data alone inappropriate.
Key Thresholds to Watch in July Survey
- Will the 3-month moving average sustain its positive turn? (Potential trigger for assessment upgrade)
- Will the durable goods purchase timing index recover above 25?
- Will the ‘5%+ price rise’ expectation share fall below 50%? (Signal of easing inflation anxiety)
Context: Where Does 33.8 Stand Historically?
The June 2026 reading of 33.8 is below the approximate 2024 annual average of 37 and well below the 2023 recovery peak of approximately 39. It is, however, above the COVID-era trough (approximately 21 in April 2020) and the 2025 April trough of 31.5. The current level suggests a consumer sentiment environment that is cautious but not in crisis territory.
Disclaimer: This article is for informational purposes only. All investment decisions are made solely at your own risk.







