📺 Watch the Full Video Analysis
This article was automatically generated by the NFC Market Live AI analysis system. (Updated: 2026-07-24 09:00 JST)
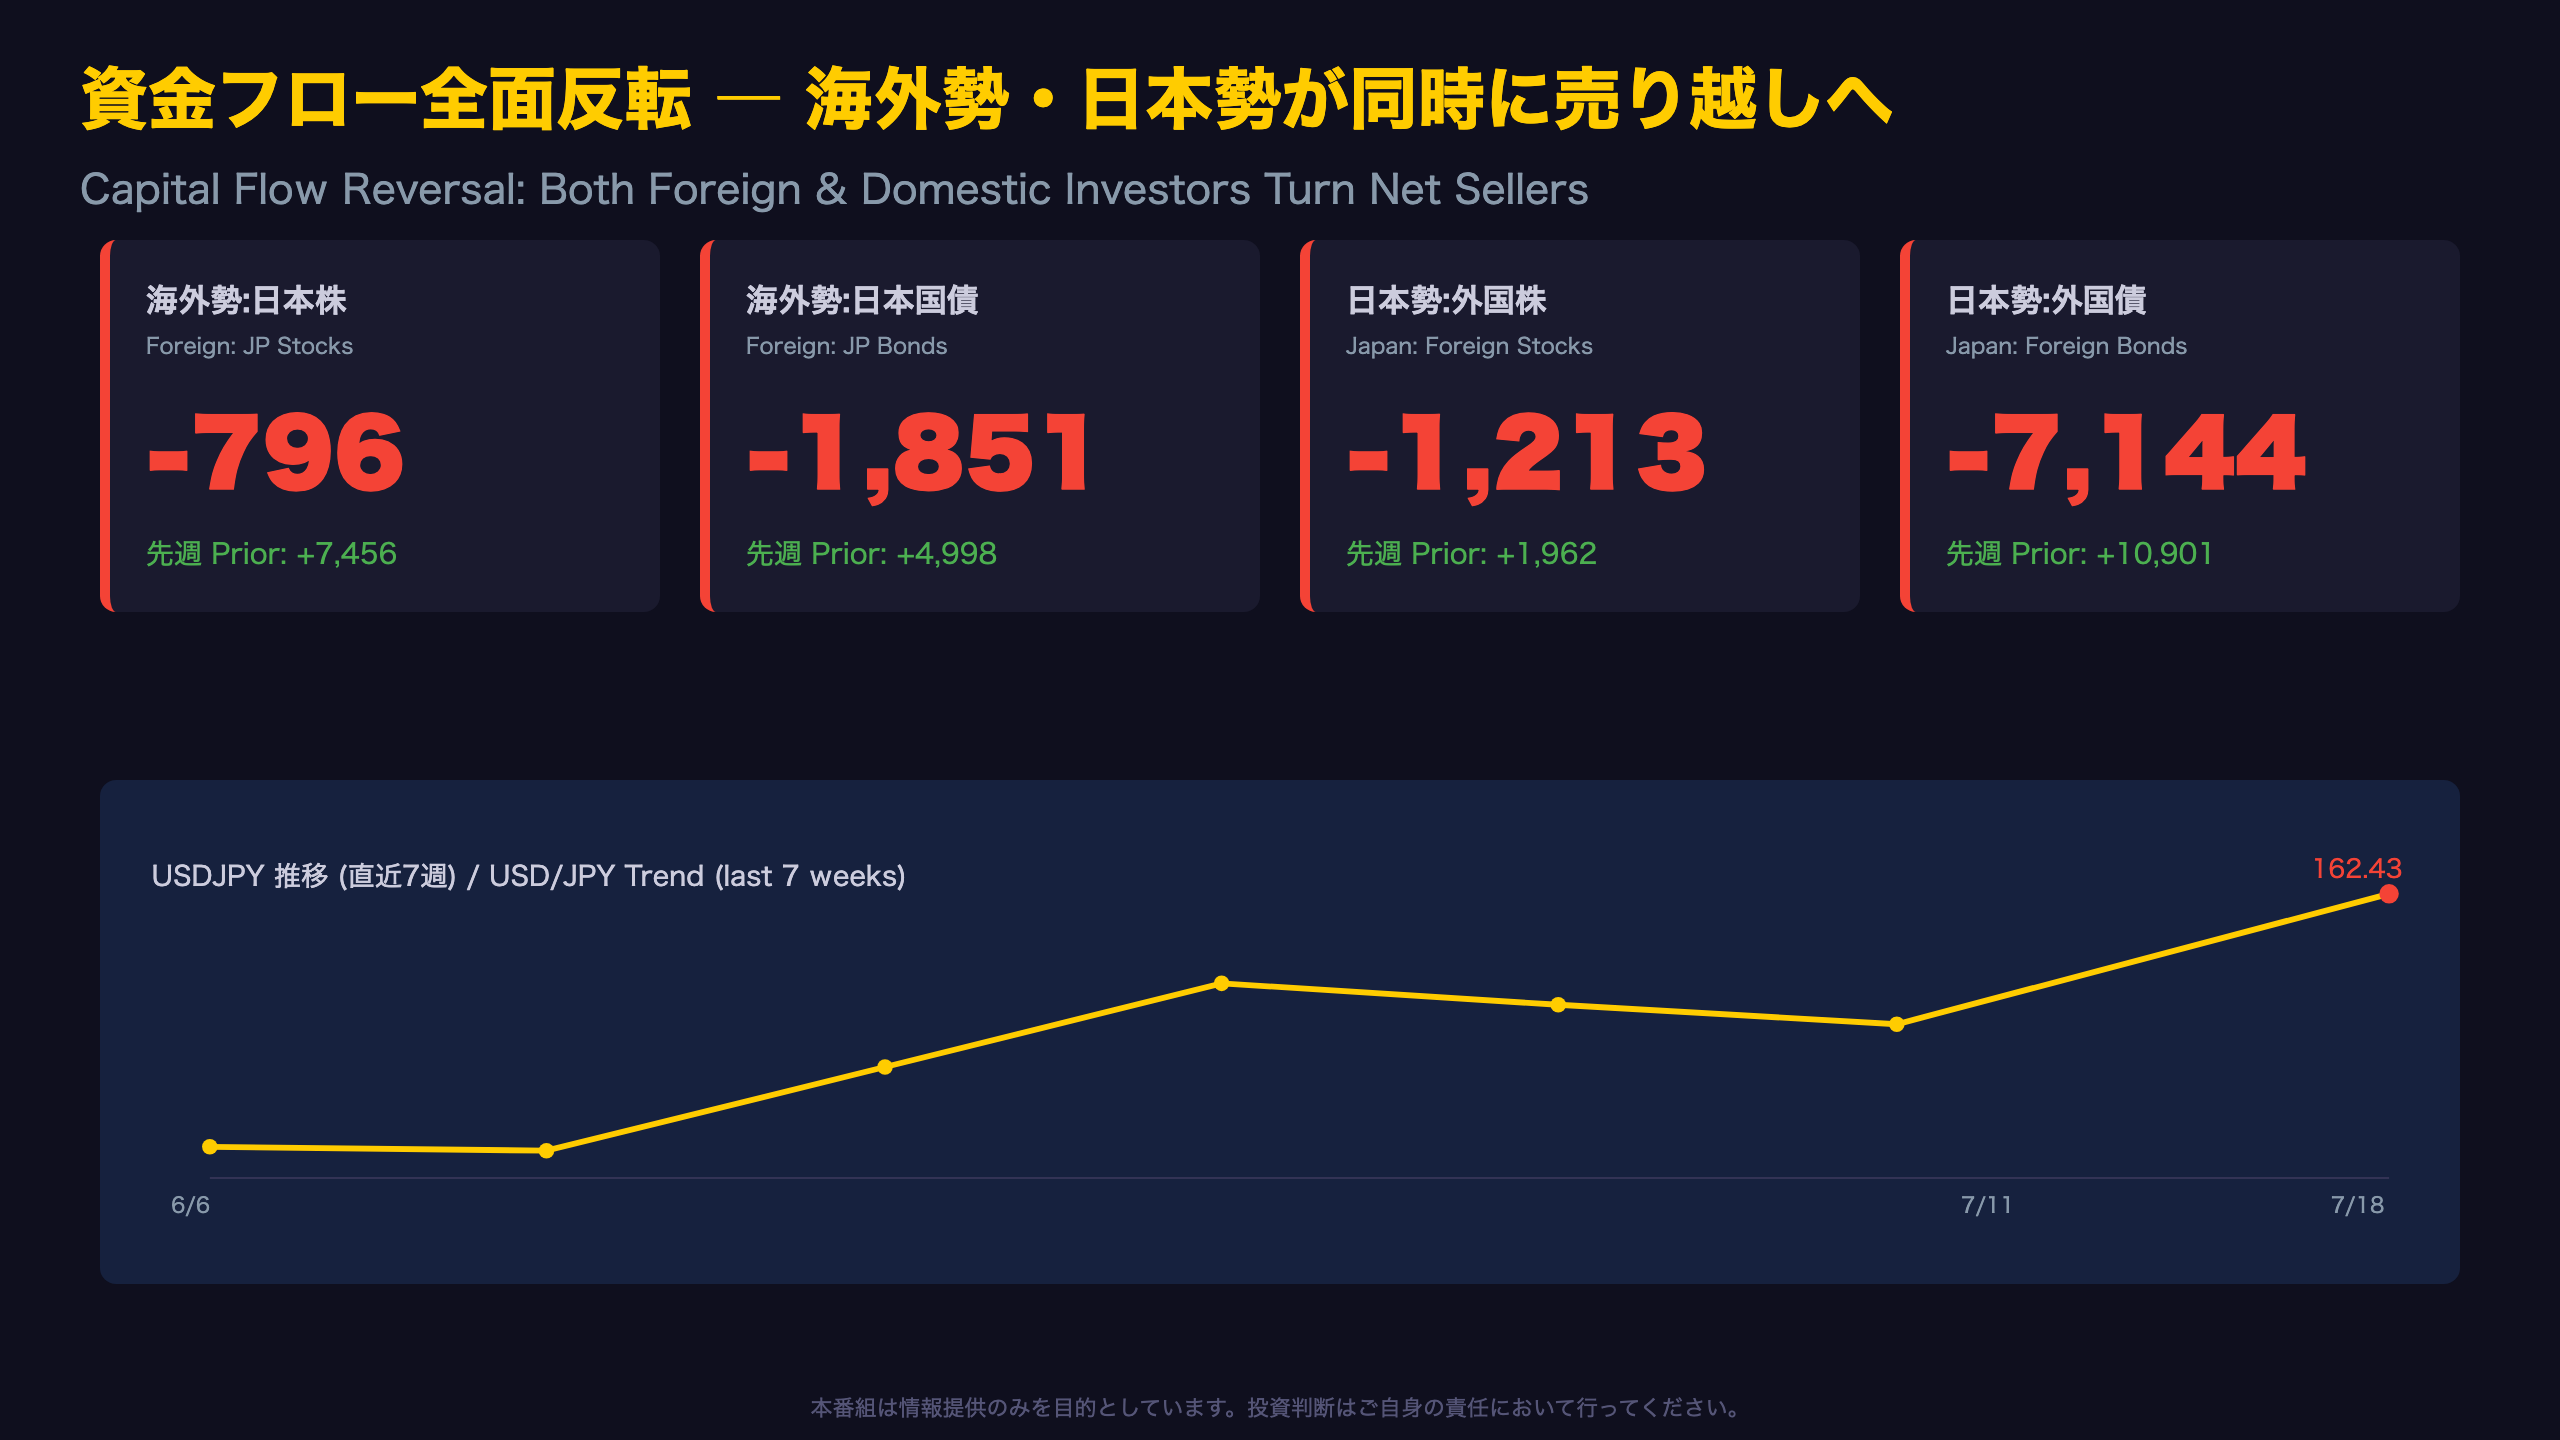
Japan’s Ministry of Finance weekly securities flow data (Jul 12-18) shows a striking reversal: foreign investors turned net sellers of Japanese stocks and bonds, while Japanese investors also sold foreign stocks and bonds. 📉
Just one week earlier, all four categories showed net buying.
Yet USD/JPY still weakened from 161.31 to 162.43 💹
We break down this apparent disconnect between flow data and FX moves using a full year of historical context.
⚠️ This video is for informational purposes only.
資金フロー全面反転 ― 海外勢・日本勢が同時に売り越しへ
A Simultaneous Reversal Across All Four Flow Categories
Japan’s Ministry of Finance (MOF) publishes a weekly report titled “Trends in International Investment in Securities,” tracking capital flows into and out of Japan by both foreign investors (non-residents) and Japanese investors (residents). For the week of July 12-18, 2026, all four major categories flipped to net selling simultaneously — a notable break from the prior week’s uniform buying.
| Category | Latest Week (Jul 12-18) | Prior Week (Jul 5-11) |
|---|---|---|
| Foreign: JP Stocks | -¥79.6bn | +¥745.6bn |
| Foreign: JP Bonds | -¥185.1bn | +¥499.8bn |
| Japan: Foreign Stocks | -¥121.3bn | +¥196.2bn |
| Japan: Foreign Bonds | -¥714.4bn | +¥1,090.1bn |
For context, U.S. investors follow similar TIC (Treasury International Capital) data monthly, but Japan’s weekly cadence offers a higher-frequency lens into cross-border positioning — useful for FX traders watching USD/JPY.
Crucially, in absolute terms, the -¥79.6bn move in foreign JP stock flows is small relative to the past year’s range (-¥4.45tn to +¥3.94tn), suggesting this is not a panic-driven capital flight. The bigger story may be the simultaneous retreat on both sides of the flow, which merits closer examination in subsequent slides.
海外勢の日本売り ― 株式は誤差範囲、国債は継続売り基調
Stock Flows Look Like Noise, But Bond Flows Show a Pattern
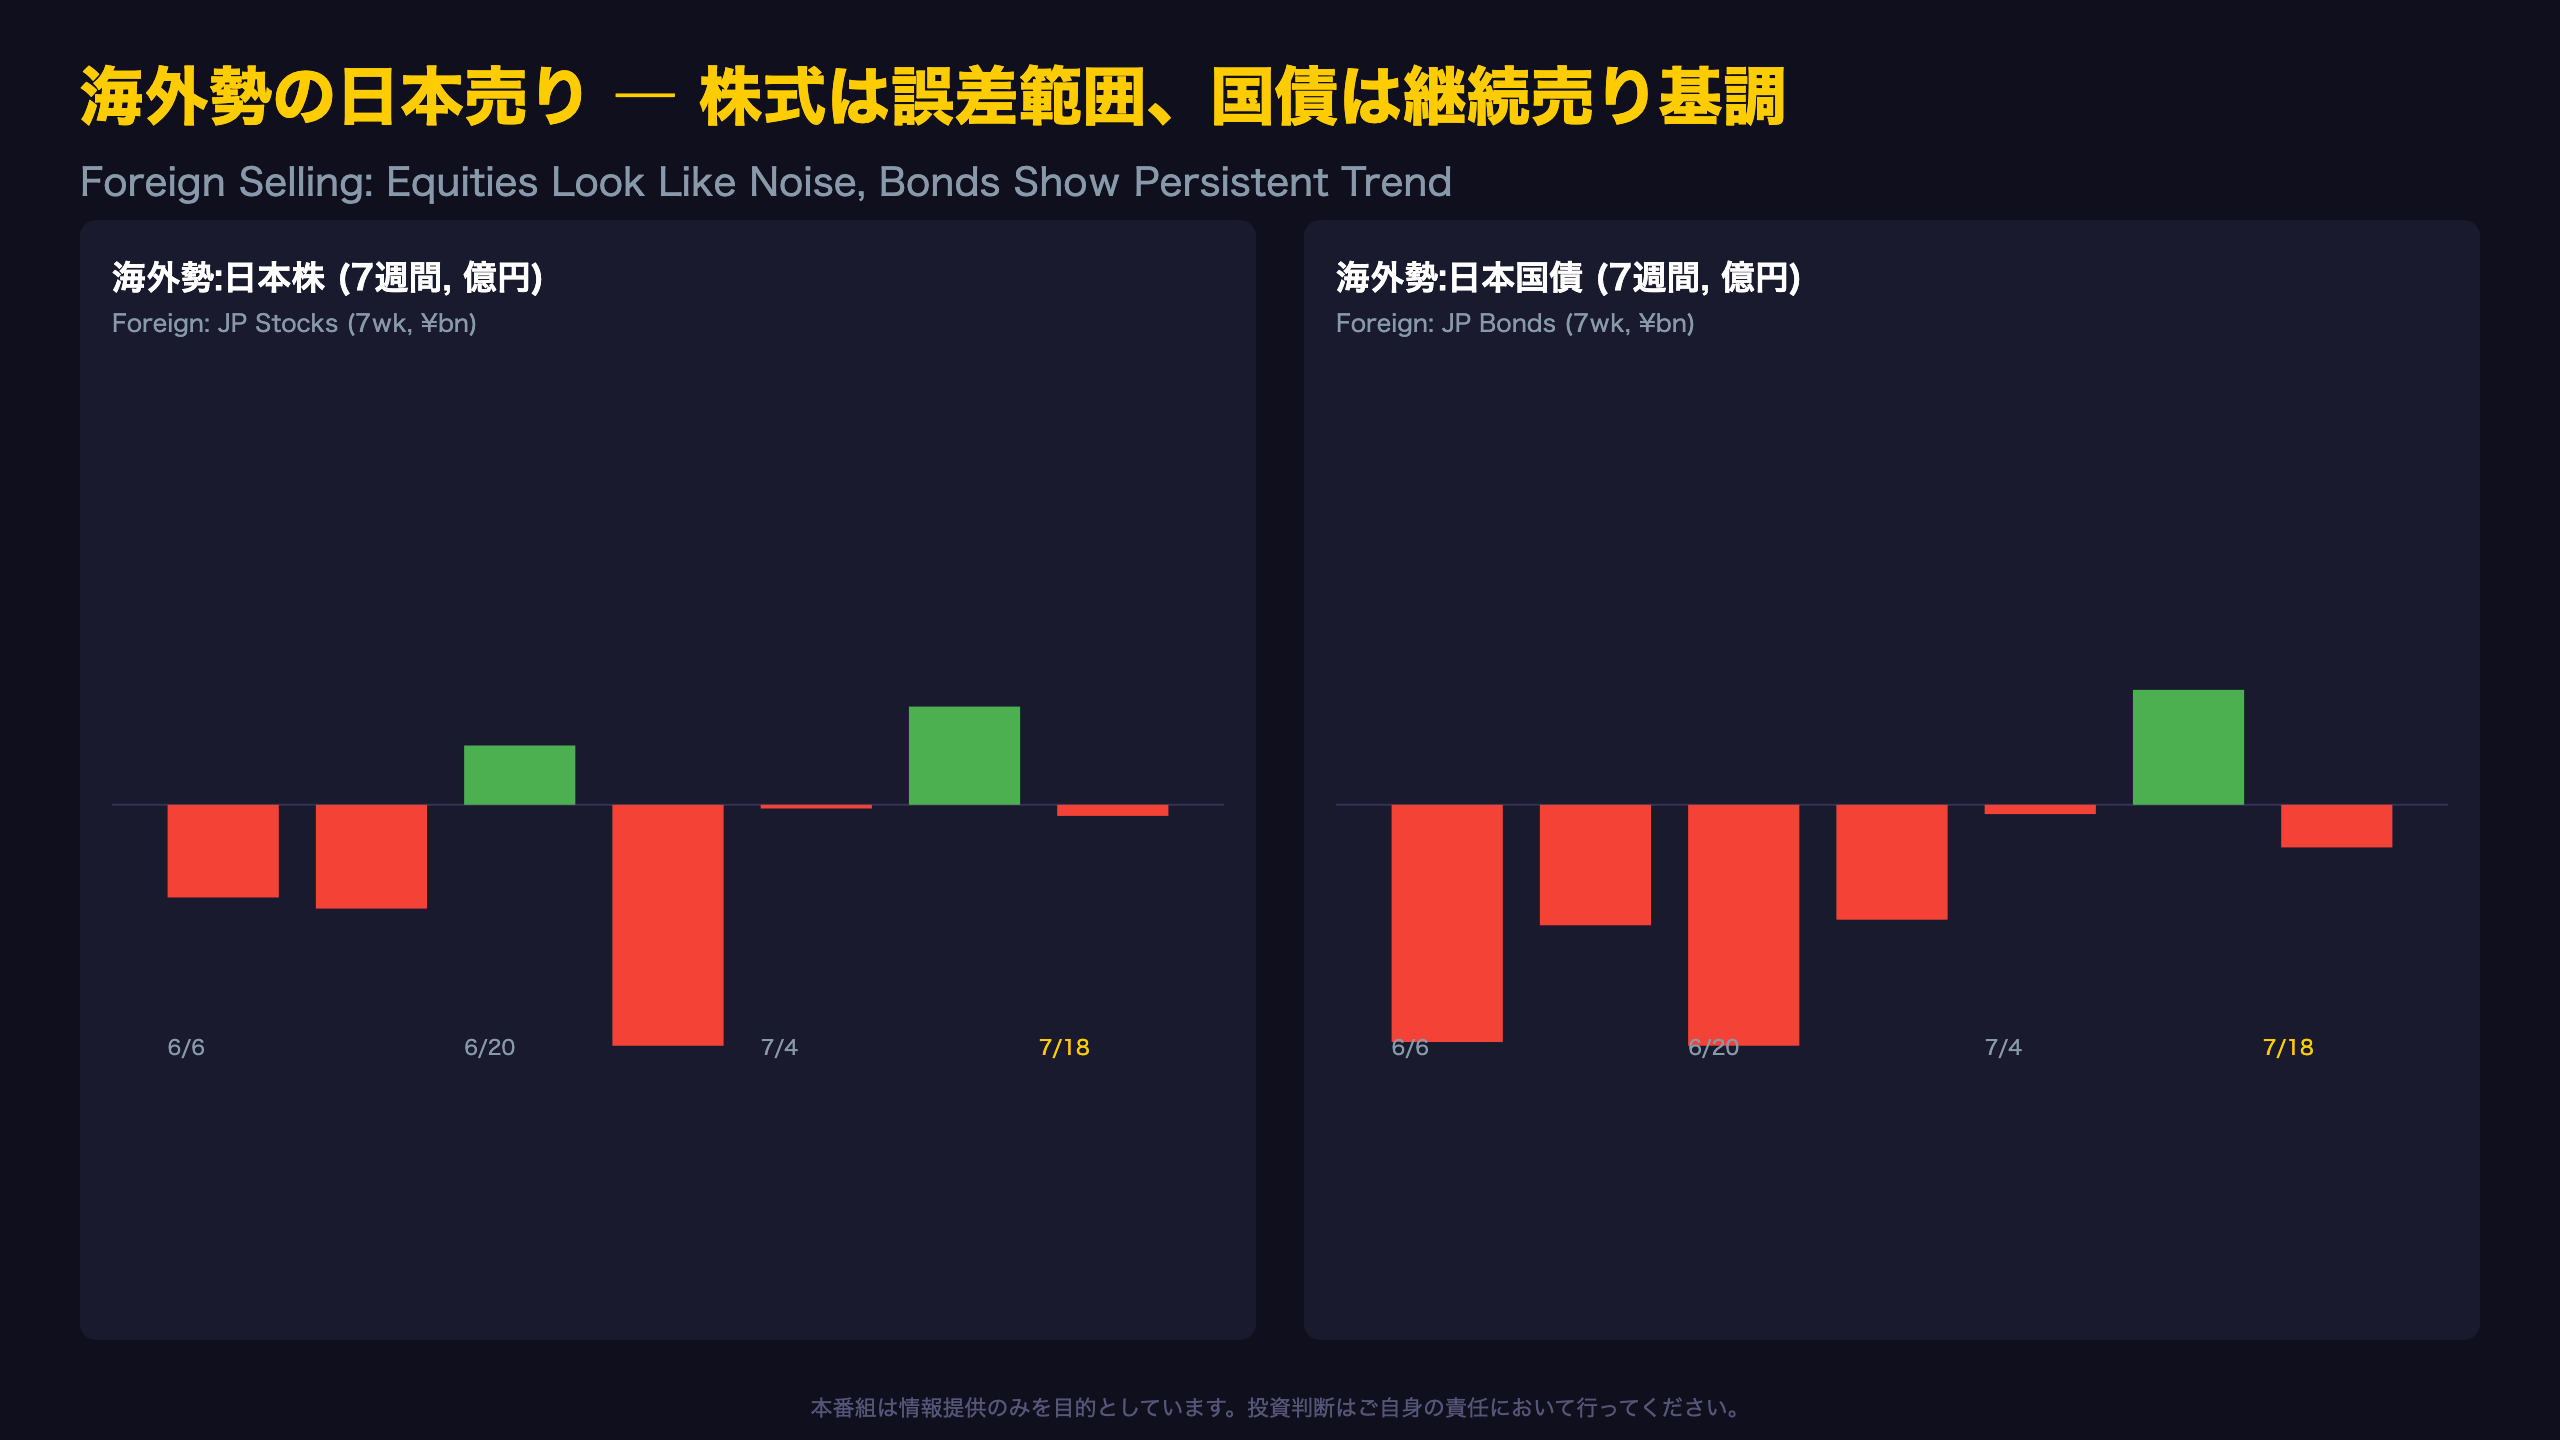
Foreign net selling of Japanese equities totaled negative 79.6 billion yen in the latest week. To put this in context, Japan’s weekly flow data has swung wildly over the past year:
- March 22-28, 2026: -¥4.45 trillion (largest sell-off of the year)
- April 5-11, 2026: +¥3.94 trillion (sharp rebound)
- April 19-25, 2026: +¥811.7 billion
Against this backdrop, a -¥79.6 billion move is statistically close to noise. It would be a stretch to interpret this single data point as evidence of a broader equity capital flight — a distinction international investors familiar with monthly U.S. TIC data (which smooths out weekly noise) should note when reading Japan’s higher-frequency releases.
A More Persistent Pattern in JGBs
Foreign flows into Japanese government bonds (JGBs) have been negative in five of the last seven weeks:
| Week | Foreign Net Flow (JGBs, ¥bn) |
|---|---|
| Jun 6 | -1,038.6 |
| Jun 13 | -530.9 |
| Jun 20 | -1,057.3 |
| Jun 27 | -502.3 |
| Jul 4 | -38.4 |
| Jul 11 | +499.8 |
| Jul 18 | -185.1 |
Unlike the noisy equity data, this repeated directional bias over multiple weeks is more suggestive of underlying softness in foreign demand for JGBs — though a seven-week window remains too short to declare a firm structural trend.
日本勢の外債売り7,144億円 ― 前週の反動か新たなトレンドか
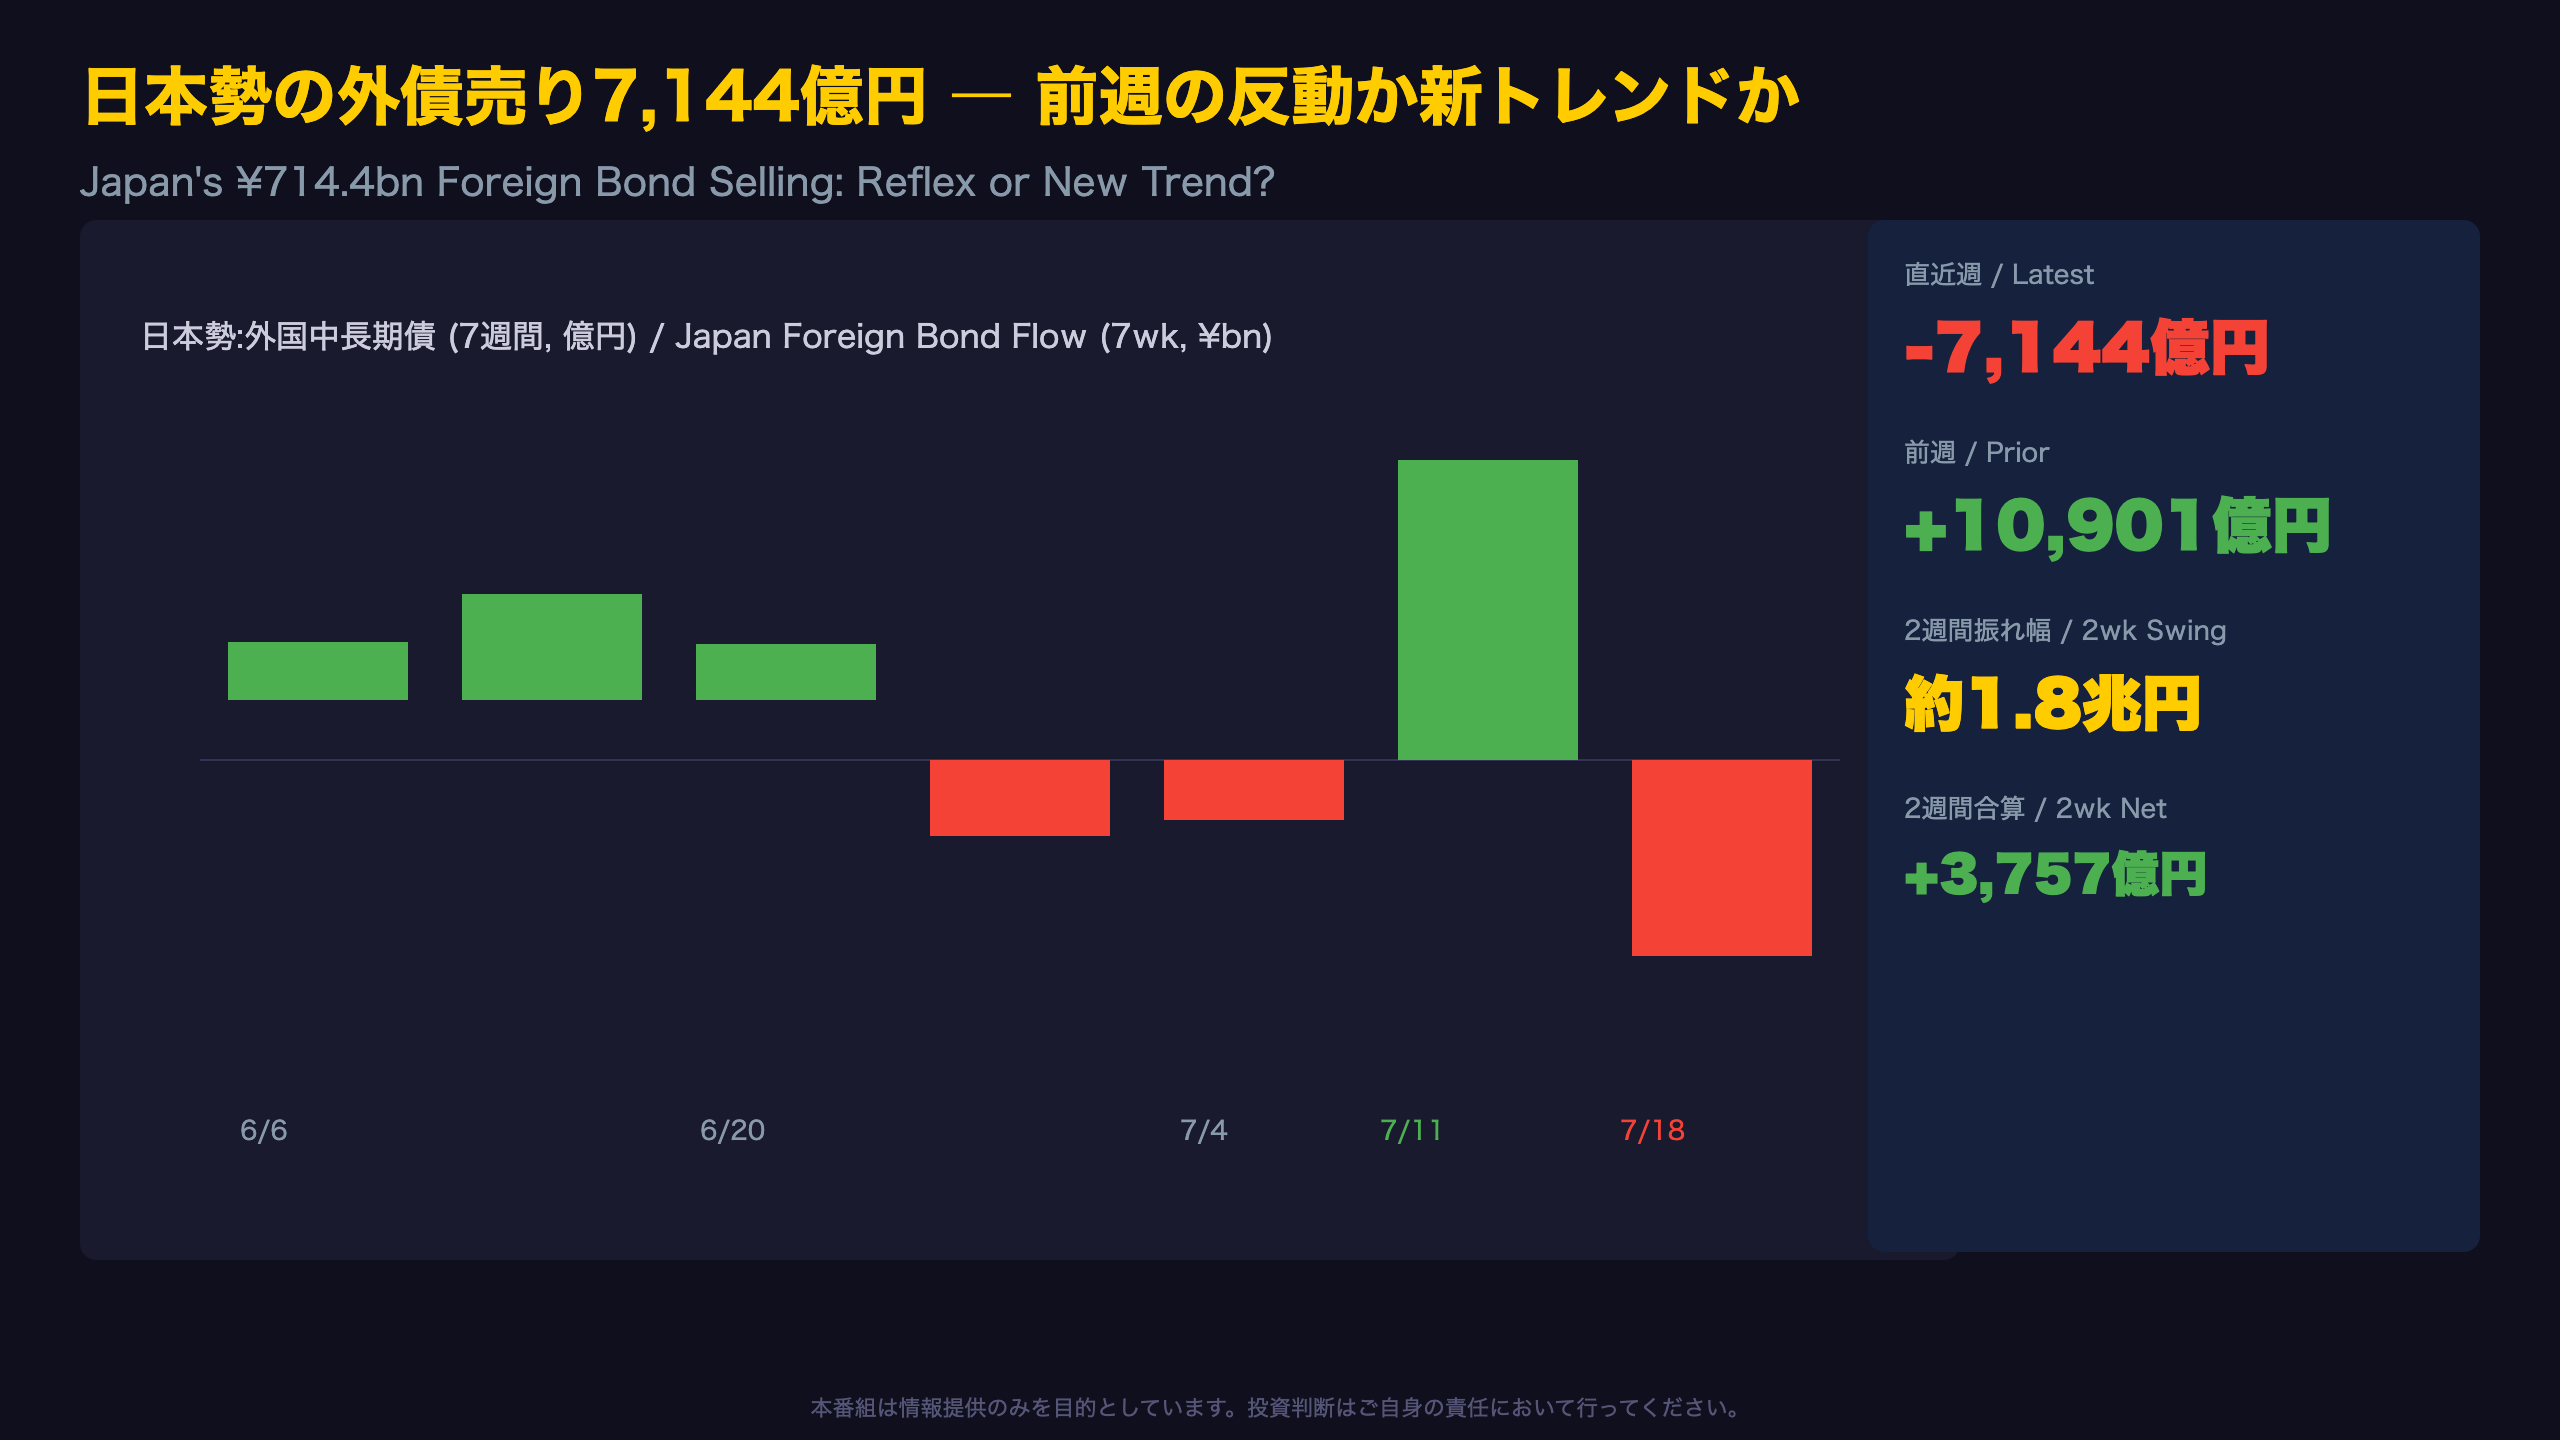
Reversal or Reflex? Japan’s Foreign Bond Selling in Context
Japanese investors recorded net selling of foreign long-term bonds worth negative 714.4 billion yen in the week of July 12-18 — a stark reversal from the prior week’s positive 1.09 trillion yen. That’s a two-week swing of roughly 1.8 trillion yen.
Historical Volatility Check
| Week | Resident Foreign Bond Flow (¥bn) |
|---|---|
| Apr 4 | -2,478.9 |
| Apr 11 | +698.2 |
| May 2 | +2,406.4 |
| May 9 | +1,644.3 |
| Jul 11 | +1,090.1 |
| Jul 18 | -714.4 |
For readers accustomed to U.S. TIC data (published monthly with far less volatility), Japan’s weekly figures can look dramatic. But viewed against April-May 2026 swings exceeding ¥2.4 trillion in both directions, this week’s reversal is not unprecedented.
Notably, netting the last two weeks together still leaves a positive ¥375.7 billion — meaning it would be a stretch (a “Level D” overreach in our analytical framework) to call this a structural retreat from foreign bonds by Japanese institutional investors.
Market context: USD/JPY rose from 161.31 to 162.43 over the same period. A weaker yen typically boosts the yen-value of foreign bond holdings, creating an incentive for profit-taking — one plausible (though not confirmed) explanation for the sell-off. The next release in early August will be key to distinguishing a one-off reflex from an emerging trend.
フロー縮小でも円安進行 ― 為替を動かす別の力
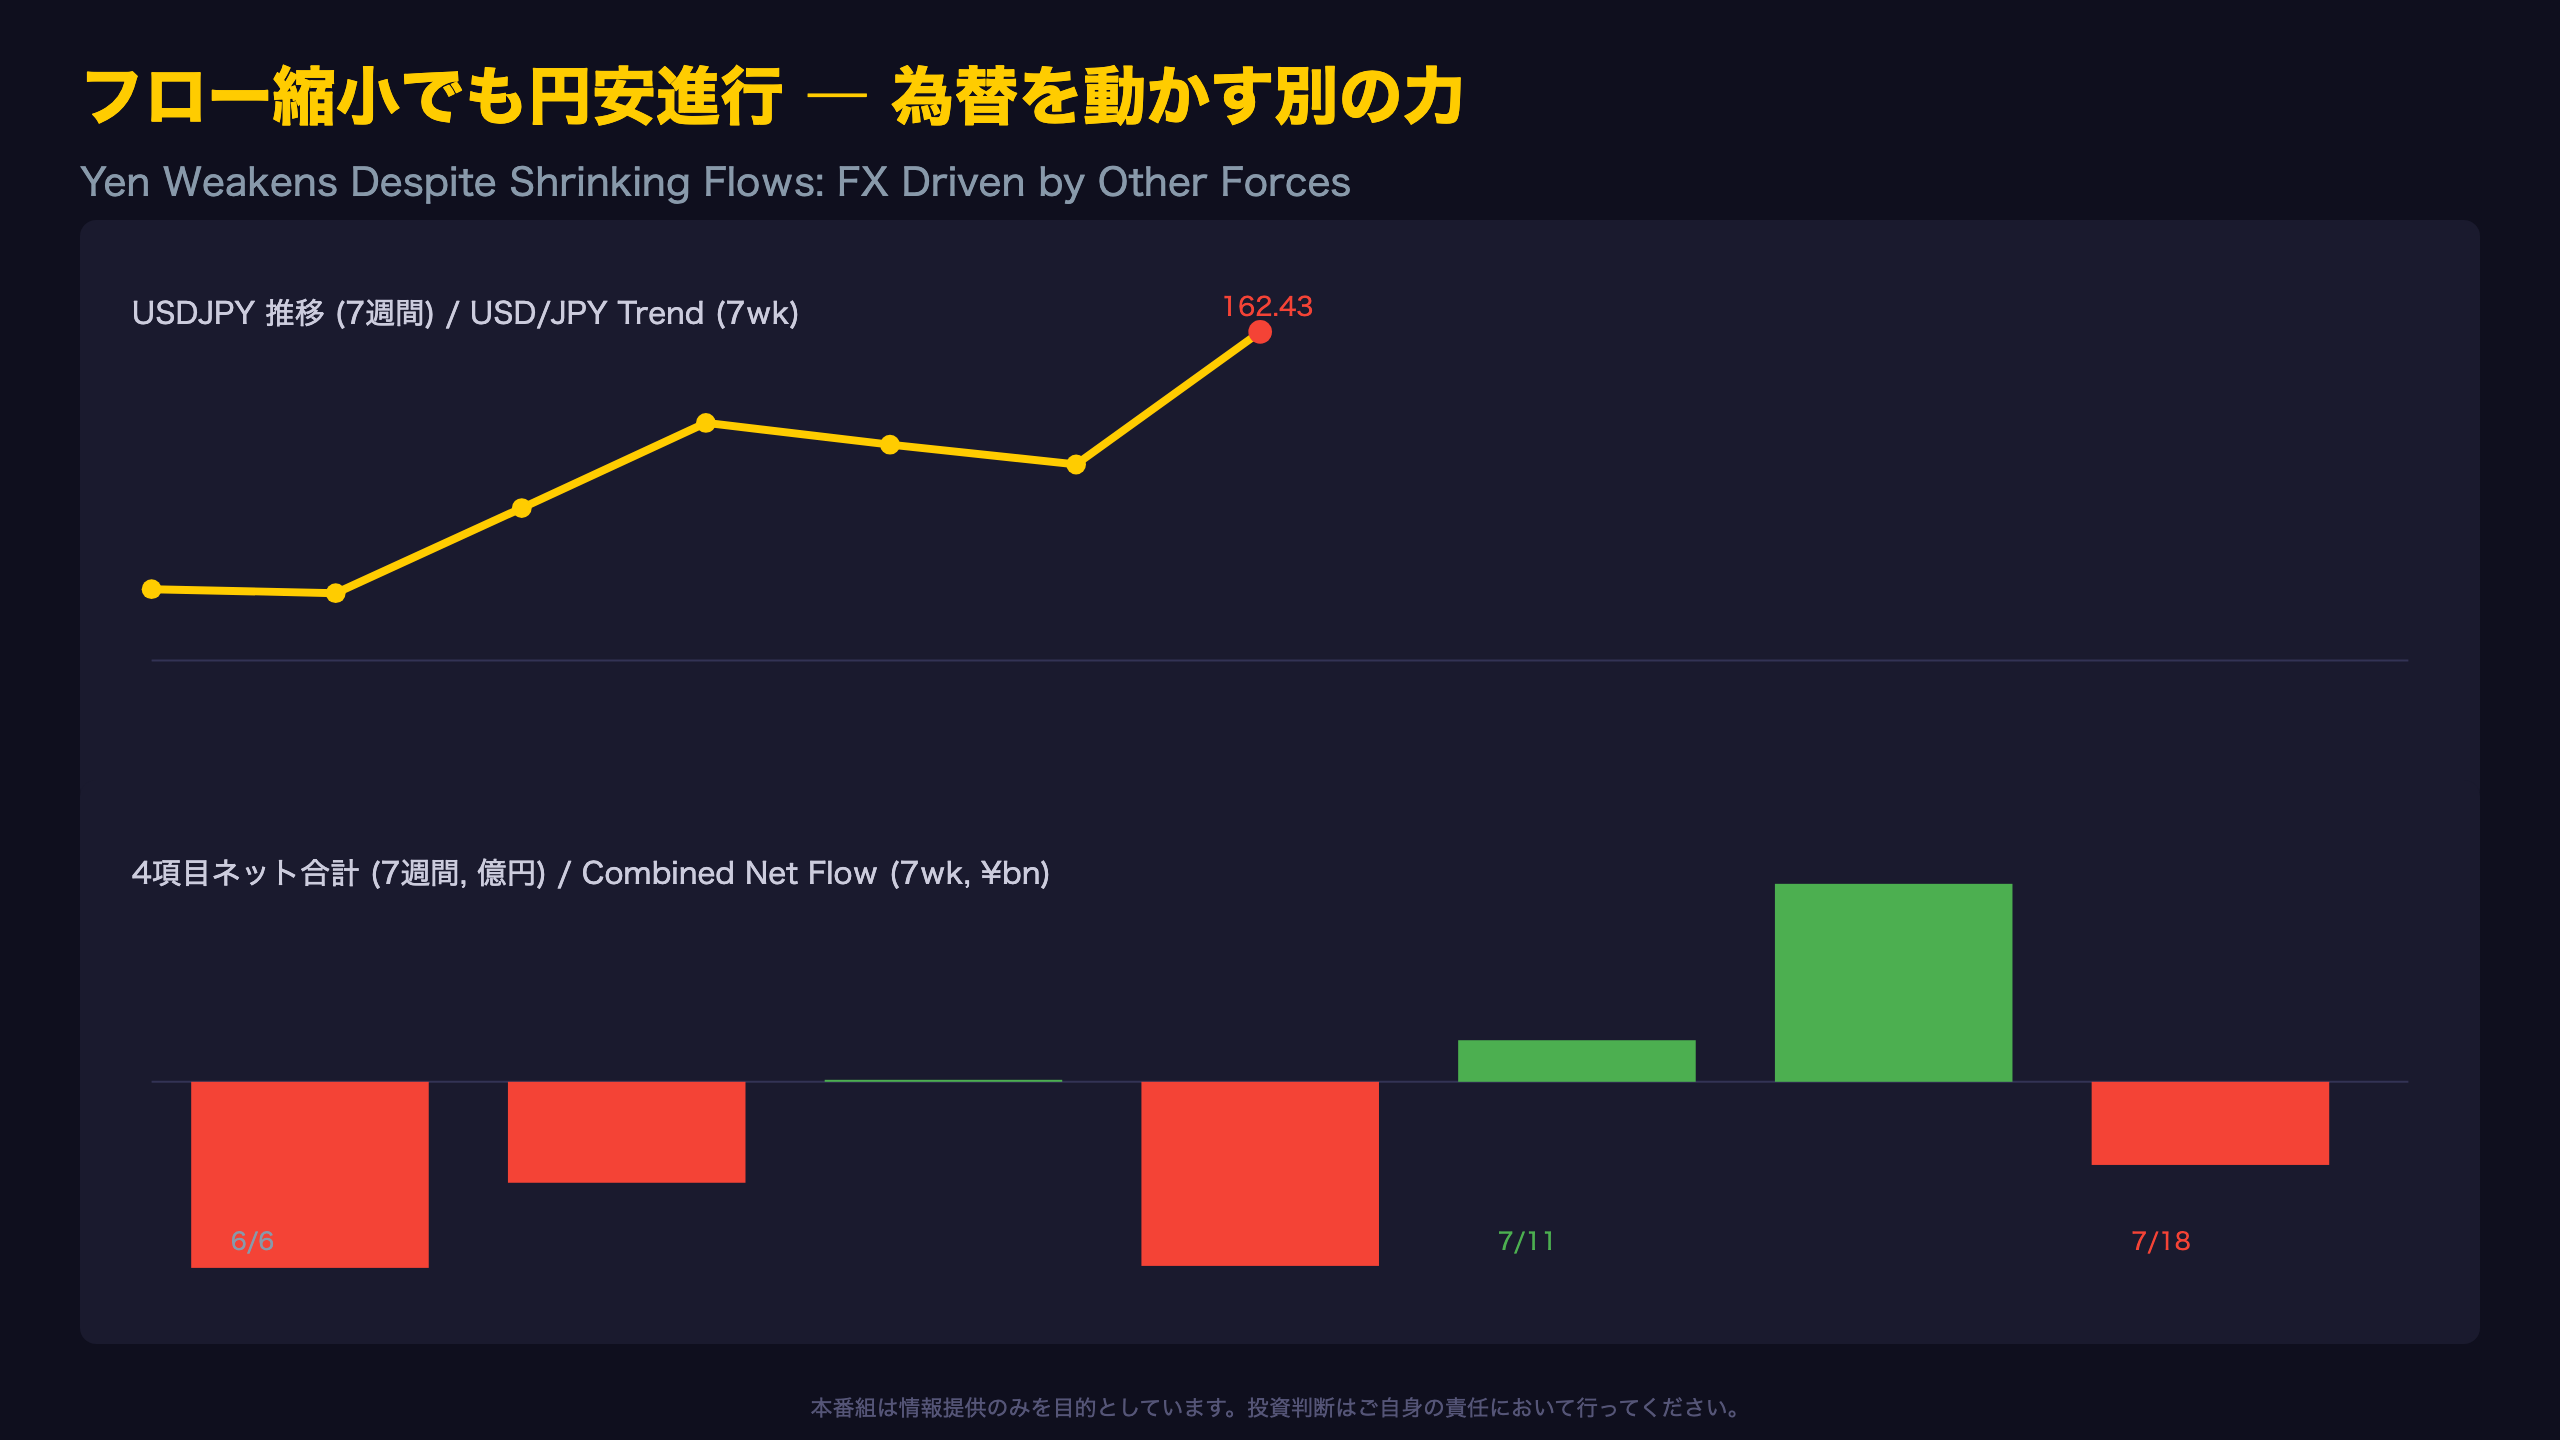
Flow Data and FX: A Growing Decoupling
Summing all four flow categories, the latest week’s net total came to negative 1.1 trillion yen, a steep drop from the prior week’s positive 2.63 trillion yen.
| Week | Net Flow (¥bn) | USD/JPY |
|---|---|---|
| Jun 6 | -2,482.8 | 160.26 |
| Jun 13 | -1,350.9 | 160.24 |
| Jun 20 | +22.8 | 160.95 |
| Jun 27 | -2,449.5 | 161.67 |
| Jul 4 | +547.5 | 161.49 |
| Jul 11 | +2,631.7 | 161.31 |
| Jul 18 | -1,100.4 | 162.43 |
No clear correlation emerges between weekly net flows and USD/JPY. The week of June 27 saw a large negative net flow (-¥2.45tn) yet USD/JPY continued climbing afterward. Conversely, July 11 showed a large positive net flow (+¥2.63tn) with the yen barely moving.
Why Flow Data Alone Can’t Explain FX
It is commonly understood that USD/JPY is driven by a combination of factors: the Fed-BOJ policy rate differential, inflation expectation gaps, and real-economy trade and investment flows — not portfolio flow data alone. Unlike the U.S. Treasury’s monthly TIC report, Japan’s MOF weekly securities data captures only contracted securities transactions, not the full picture of FX determinants like carry trades or options-related hedging flows.
Given this, drawing firm FX conclusions from this dataset alone would overstate its explanatory power. Cross-referencing with U.S. Treasury yields and BOJ policy signals is necessary for a fuller picture.
双方向フローの急収縮 ― 前週比較で見る資金移動の実態
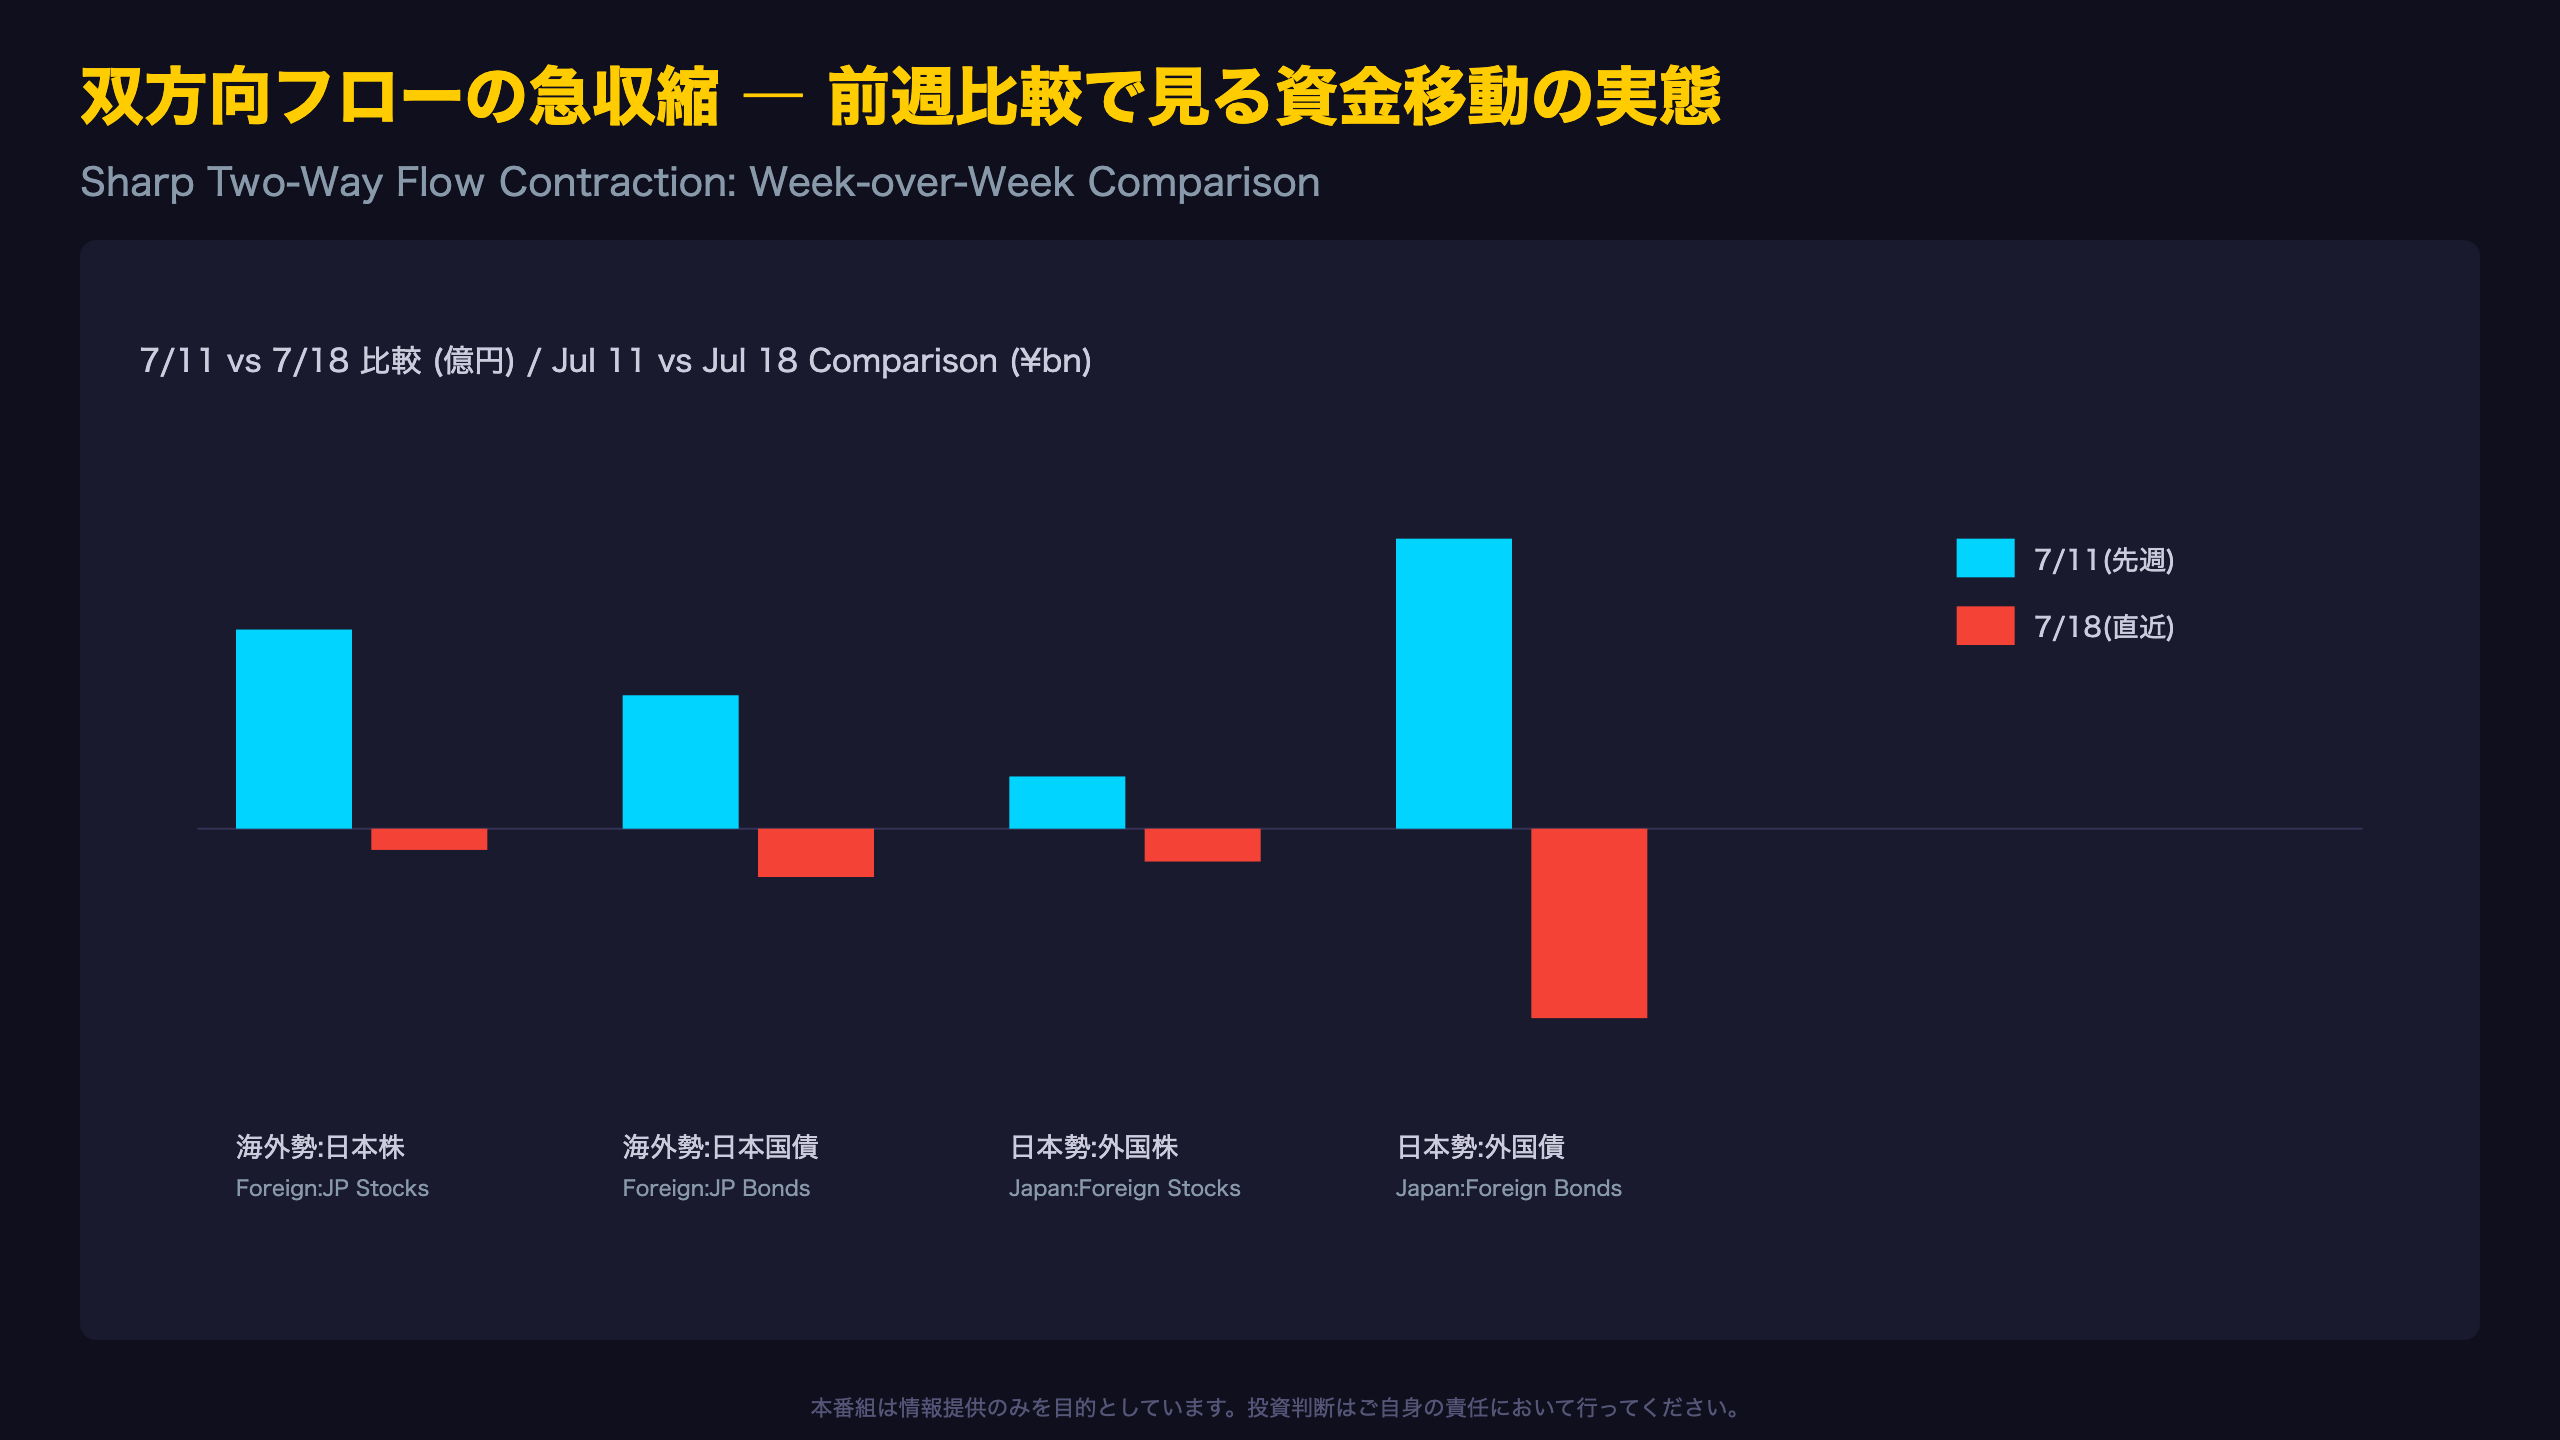
The Scale of the Week-on-Week Swing
Comparing July 11 and July 18 across all four categories reveals the magnitude of the reversal:
| Category | Jul 11 (¥bn) | Jul 18 (¥bn) | Change |
|---|---|---|---|
| Foreign: JP Stocks | +745.6 | -79.6 | -825.2 |
| Foreign: JP Bonds | +499.8 | -185.1 | -684.9 |
| Japan: Foreign Stocks | +196.2 | -121.3 | -317.5 |
| Japan: Foreign Bonds | +1,090.1 | -714.4 | -1,804.5 |
The largest swing came from Japanese investors’ foreign bond flows, a two-week change of ¥1.8 trillion — by far the biggest move among the four categories.
Putting It in Context: Late June Comparisons
Looking at combined net flows, the week of June 6 registered negative 2.48 trillion yen and June 27 negative 2.45 trillion yen — both larger negative swings than the current week’s negative 1.1 trillion yen. This suggests the current move is not an unprecedented anomaly but rather a continuation of a high-volatility regime that has persisted since late June.
Note: MOF’s weekly data captures contracted securities transactions, which may not perfectly align in timing with actual settlement-based capital movements — a nuance international readers accustomed to settlement-date reporting should keep in mind.
The next release will be key to determining whether this volatility regime is stabilizing or intensifying further.
インプリケーション ― フロー反転の持続性を見極める
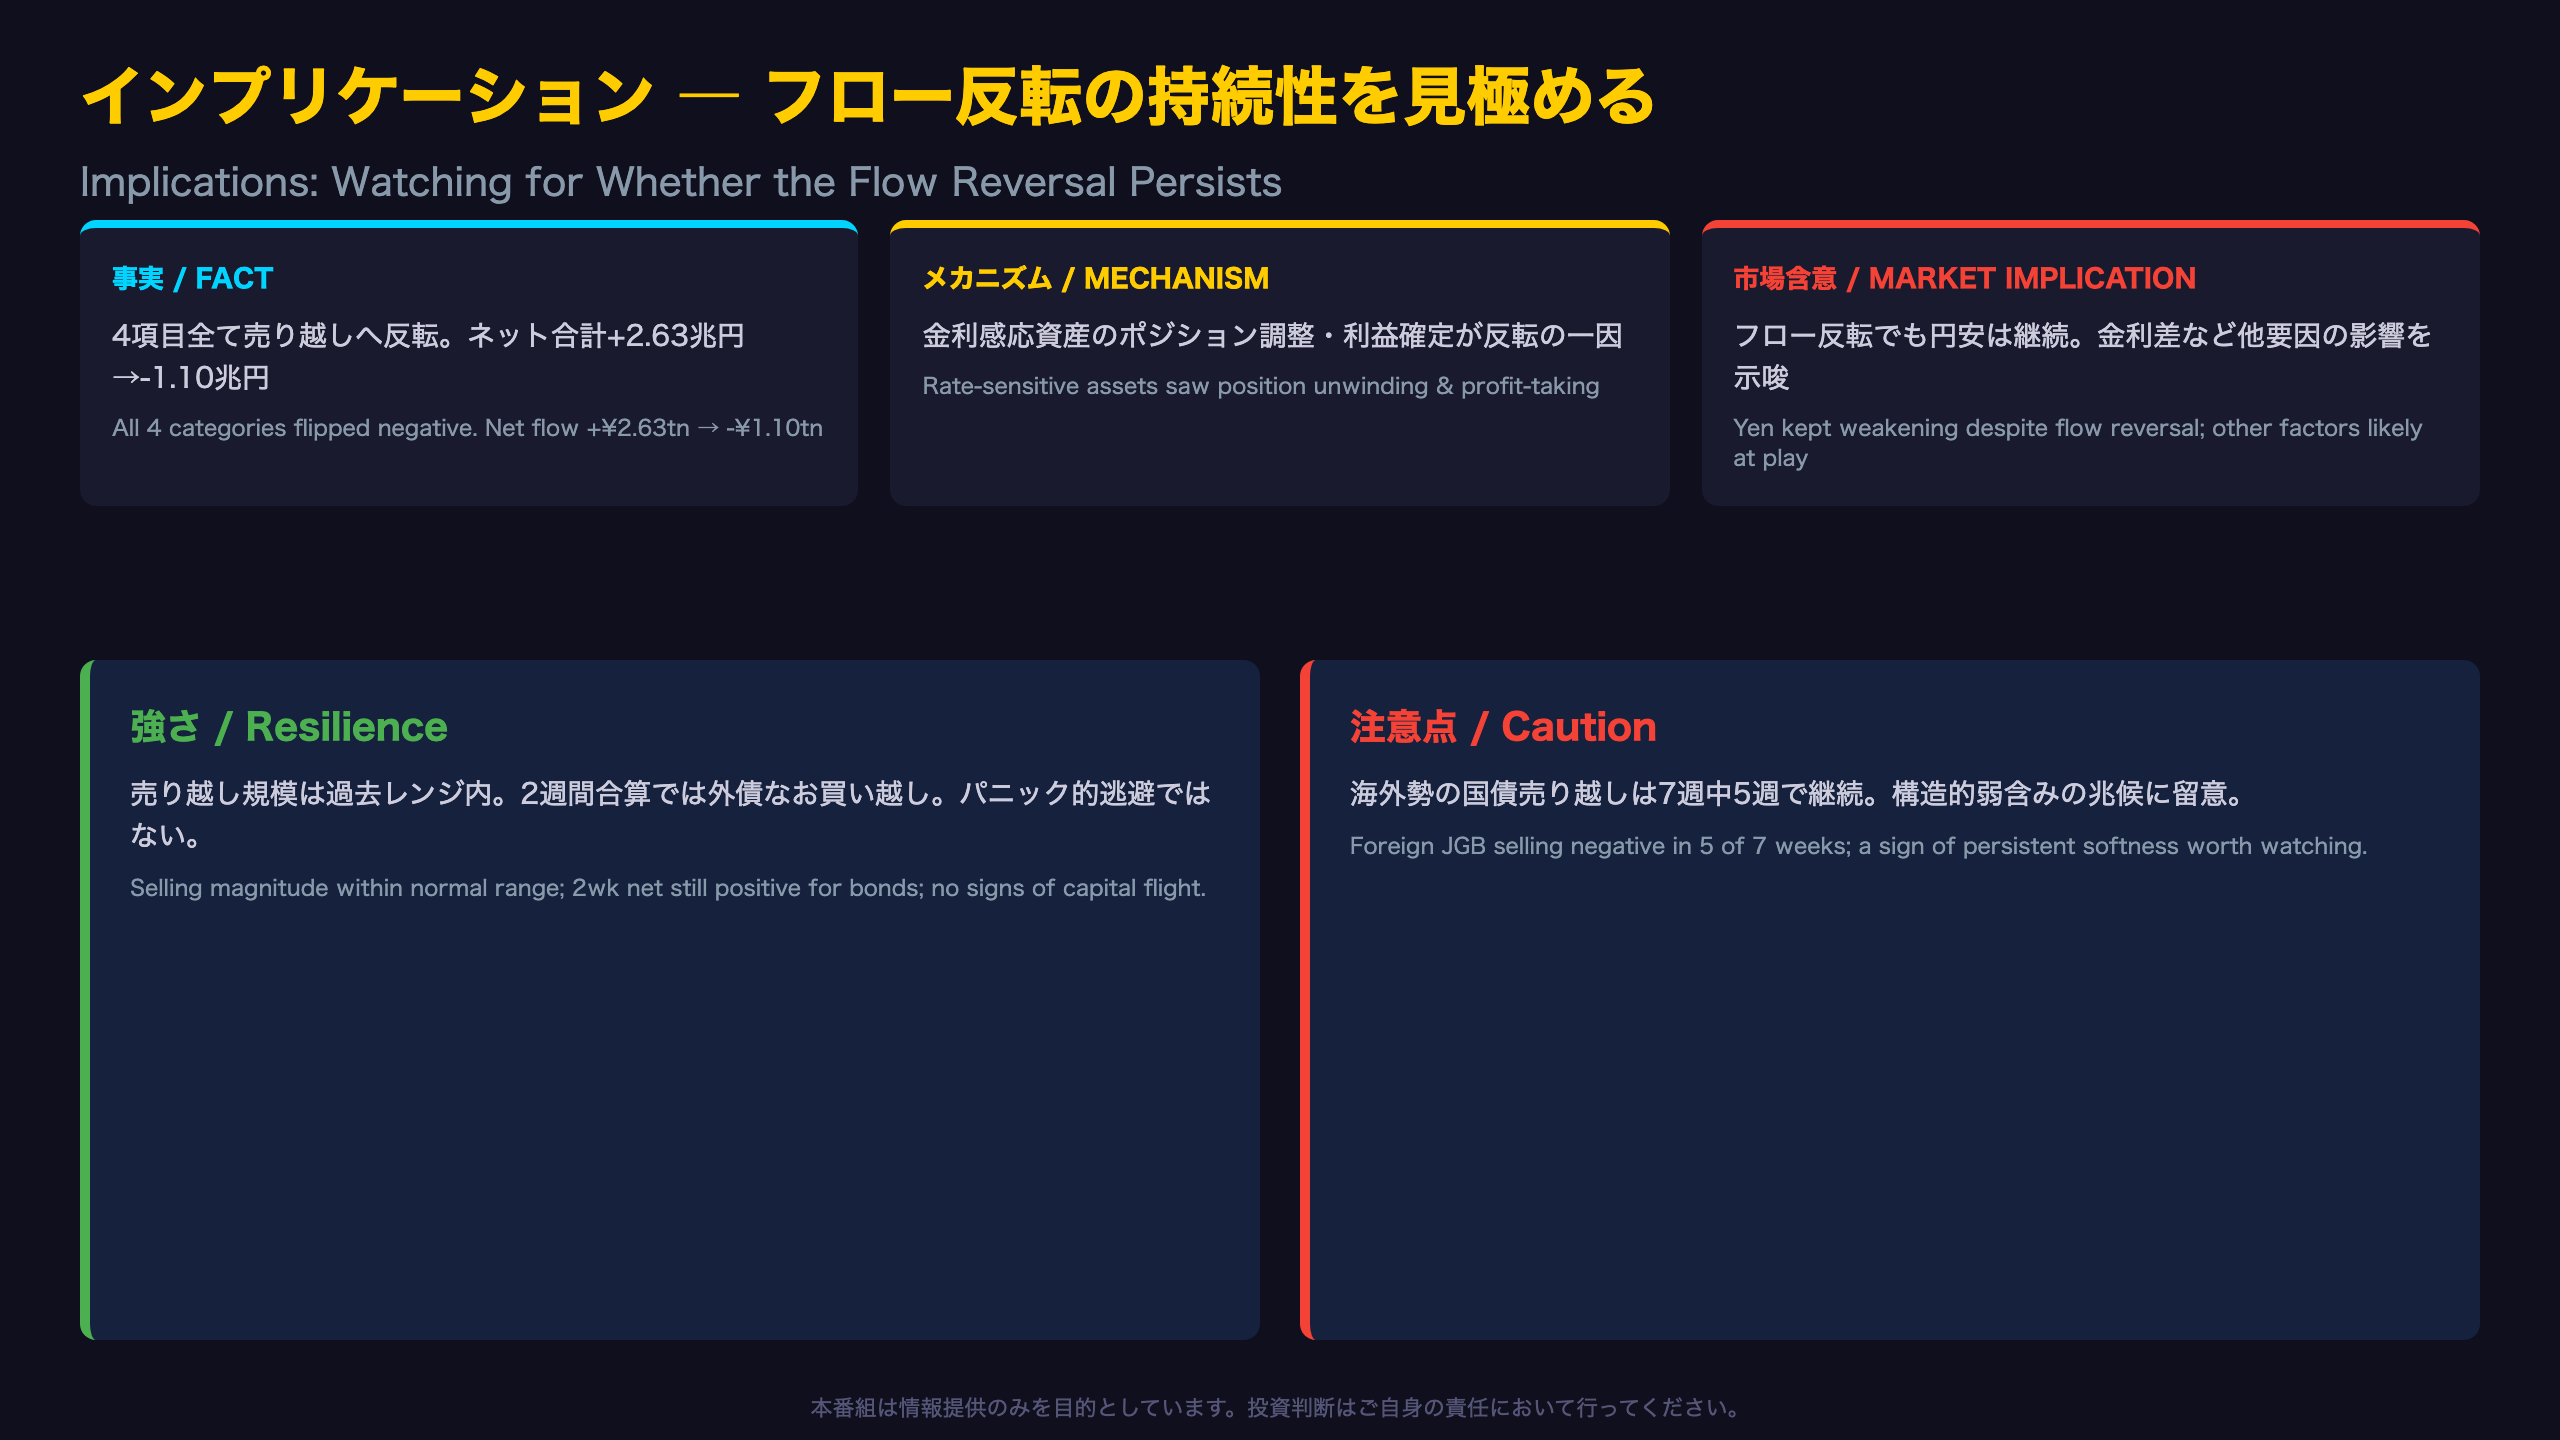
Conclusion: A Temporary Adjustment, With Yen Weakness on a Separate Track
Let’s trace the chain of evidence from this week’s data.
[Fact] All four flow categories flipped to net selling in the latest week, a complete reversal from the prior week’s uniform buying. The combined net flow swung from +¥2.63 trillion to -¥1.1 trillion, a change exceeding ¥3.7 trillion.
[Mechanism] Reversals in portfolio flow data are generally associated with short-term position adjustments and profit-taking, particularly in rate-sensitive assets like JGBs and foreign bonds, which are actively traded in response to shifting rate expectations.
[Market Implication] However, this flow reversal did not push the yen stronger — USD/JPY instead continued weakening to 162.43. This indicates that portfolio flow data alone cannot explain yen direction; a fuller picture requires cross-referencing the Japan-U.S. interest rate differential and broader macro trade flows, which lie outside the scope of this MOF dataset.
Balancing Both Sides
- Resilience: The magnitude of this week’s selling (-¥79.6bn in JP stocks, -¥714.4bn in foreign bonds) remains within the past year’s normal range — not a sign of capital flight. Netting the last two weeks, foreign bond flows are still positive.
- Caution flag: Foreign flows into JGBs have been negative in 5 of the last 7 weeks, hinting at a more persistent softening in demand.
The next MOF release in early August will be critical in determining whether this week’s reversal was a one-off adjustment or the start of a more structural shift — one that may also interact with future Bank of Japan policy signals.
Disclaimer: This article is for informational purposes only. All investment decisions are made solely at your own risk.