📺 Watch the Full Video Analysis
This article was automatically generated by the NFC Market Live AI analysis system. (Updated: 2026-10-18 08:42 JST)
📊 A single-map view of where the world economy stands after this week’s data.
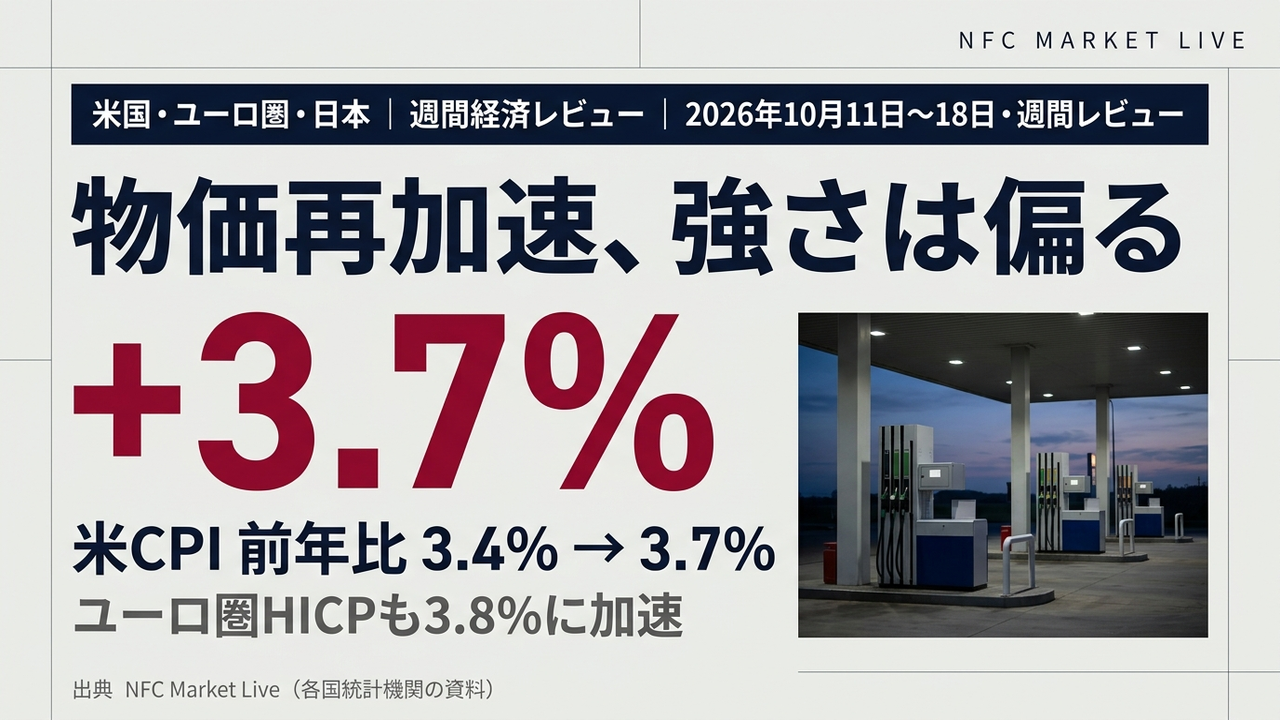
📈 US CPI rose to 3.7% y/y and euro-area HICP to 3.8%. Energy is the main driver, but US core also edged up to 2.6%.
🏭 Manufacturing surveys were strong, yet US retail sales excluding autos and gasoline rose only 0.2% m/m.
🏦 The RBA raised its cash rate unanimously to 4.60%, pointing the same way as the Fed and the ECB.
⚠️ Japan’s producer prices cooled. Next week: UK CPI (Oct 21), Japan national CPI and Michigan final sentiment (Oct 23).
オープニング:世界経済の現在地

This week at a glance
This edition of the NFC weekly review looks at where the world economy stands after a busy week of releases from the United States, the euro area and Japan. US producer prices rose 1.3% on the month in September, which the Bureau of Labor Statistics (BLS) describes as the largest monthly increase since March 2022. Euro-area inflation, measured by the harmonised index of consumer prices (HICP) at Eurostat, accelerated to 3.8% year on year.
Two questions
- Is the price acceleration energy-driven or broadening? We compare US CPI and PPI, euro-area HICP and Japan’s corporate goods price index.
- Why is manufacturing strong while consumption looks soft? We set the Empire State and Philadelphia Fed surveys against FRB industrial production, retail sales and the Fed’s Beige Book.
How to read the format
Unlike a single-indicator show, this review ranks economies by weight. The US, euro area, Japan, the UK and China form the backbone of the map, while smaller economies such as Australia and Canada are used only as supporting evidence. The show closes with what the central banks say in their own documents and the releases next week that can confirm or challenge the picture.
世界経済の現在地(見取り図)
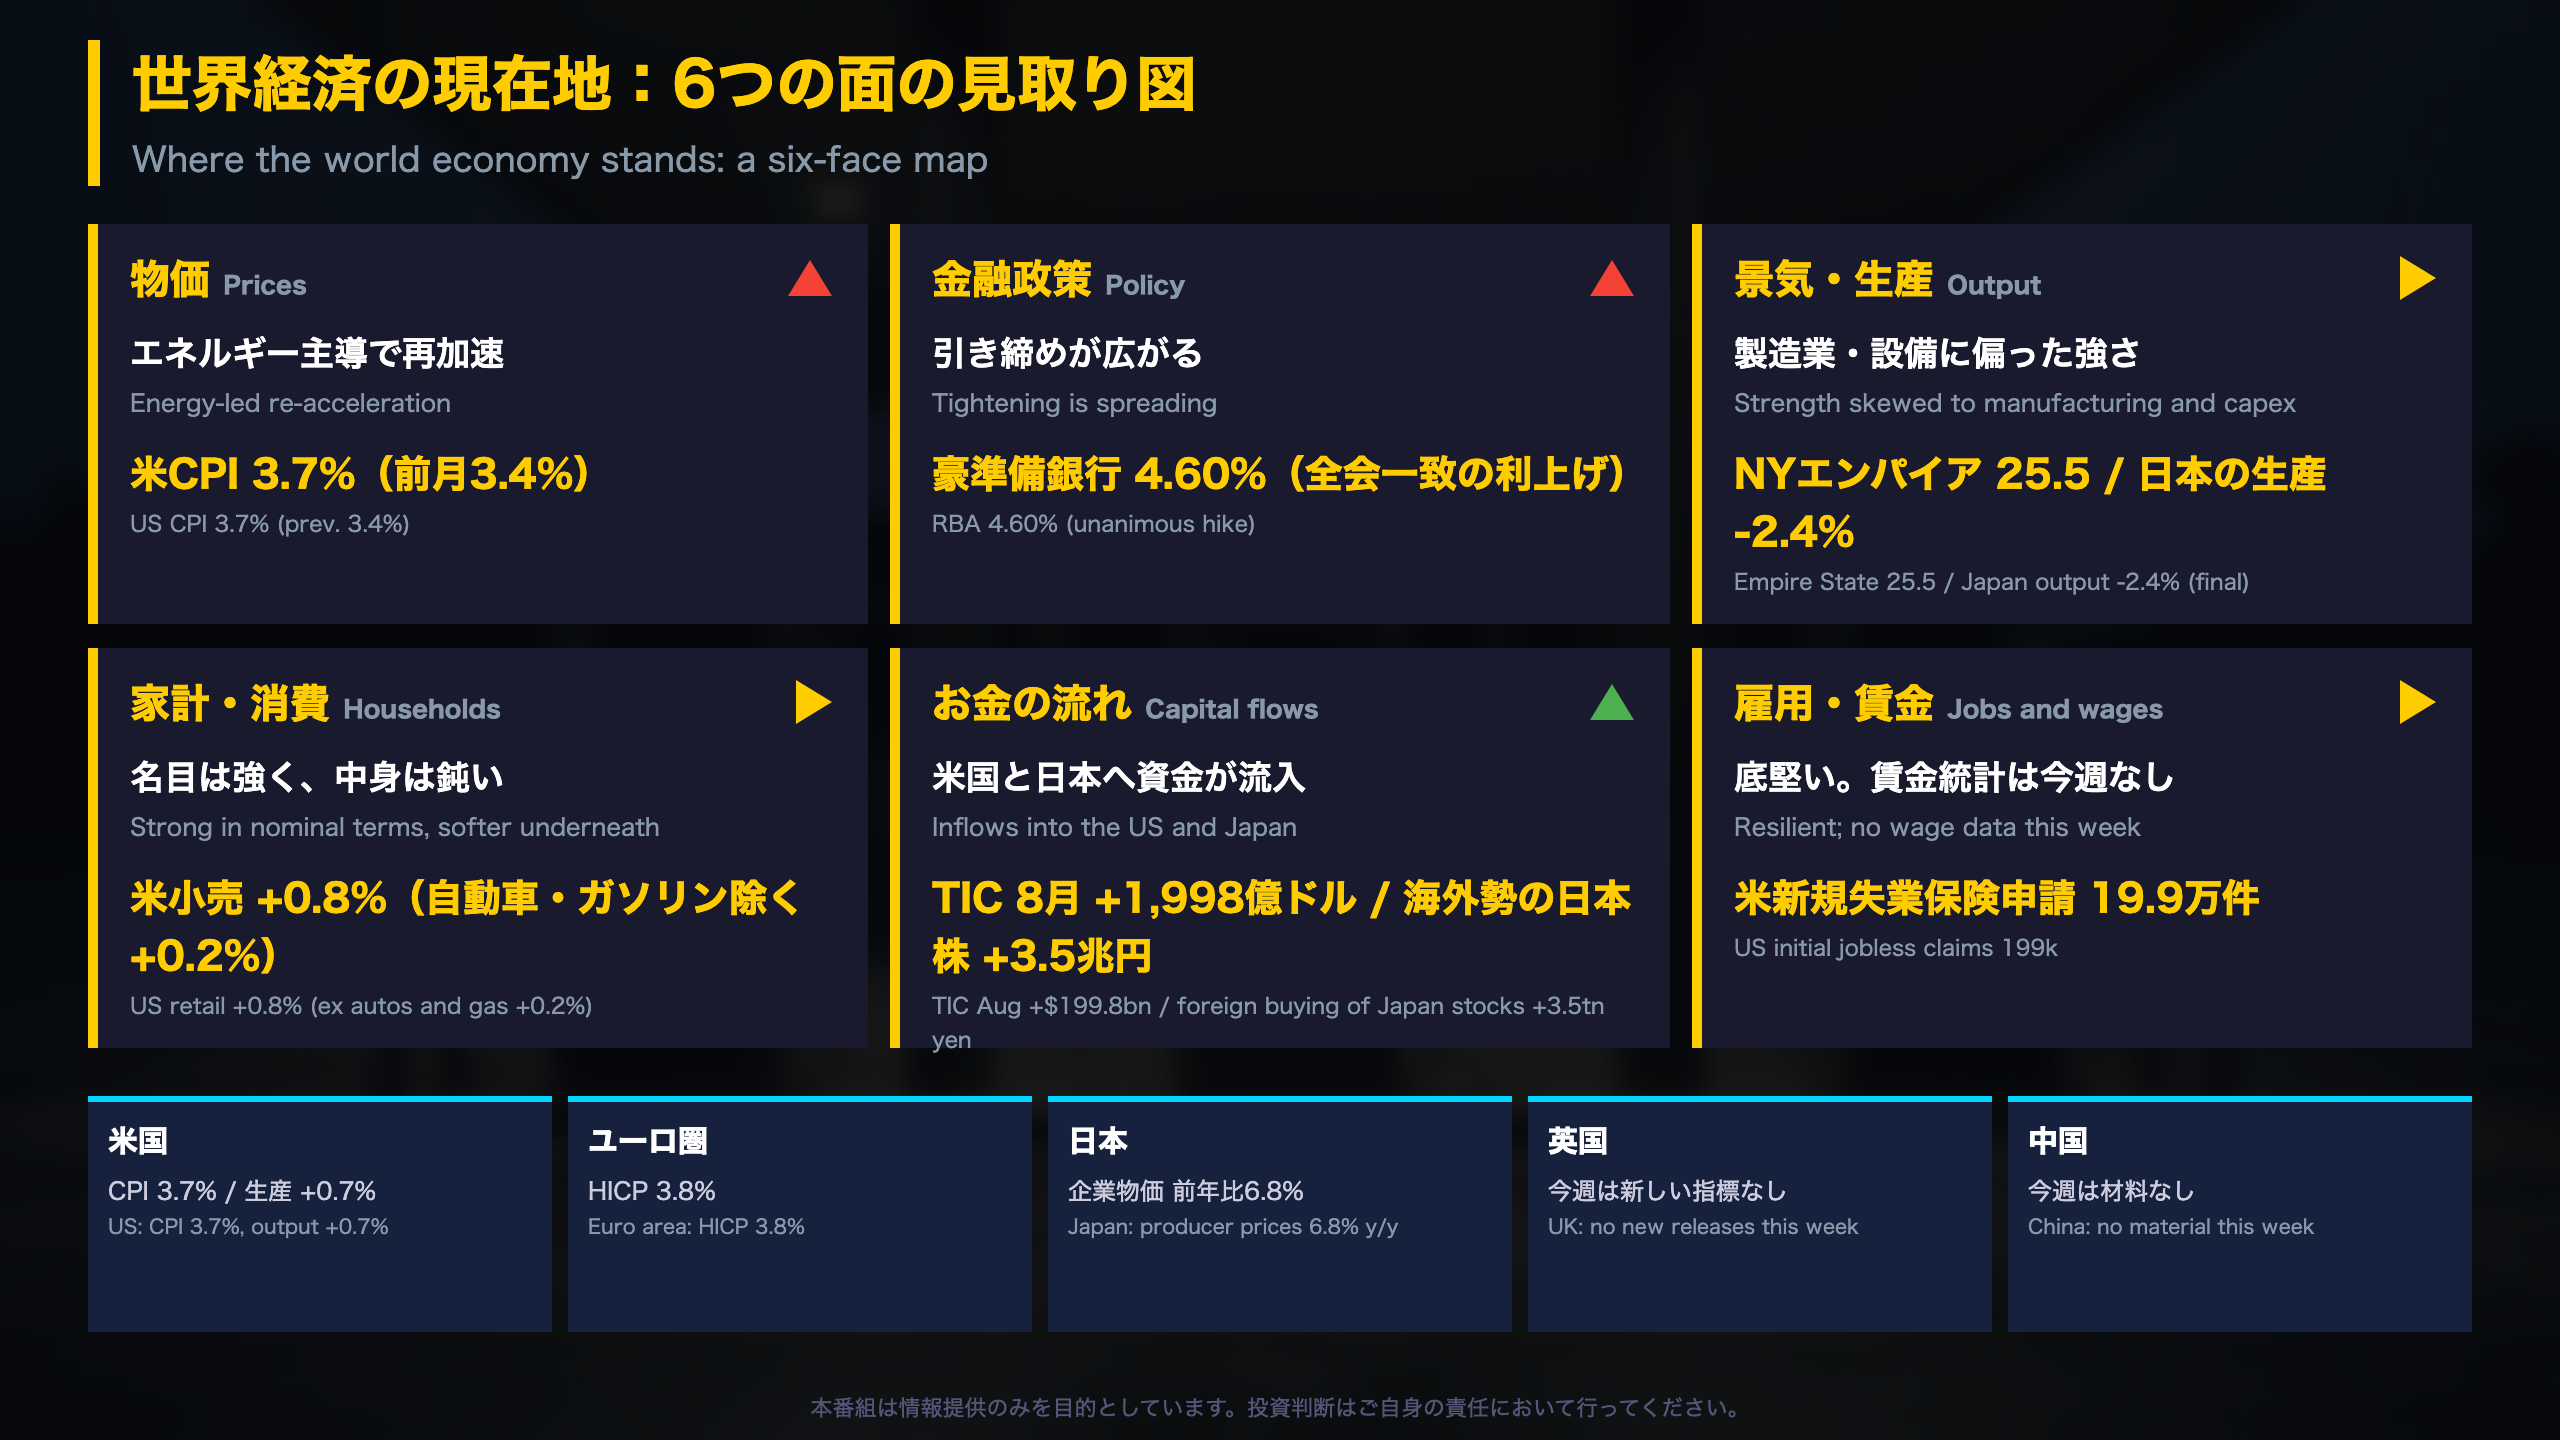
The six-face map and how it changed
The NFC map describes the world economy through six faces: prices, jobs and wages, output, households, monetary policy and capital flows. This week the price face was reinforced: US CPI reached 3.7% (3.4% in August) and euro-area HICP 3.8% (3.2%). The policy face tilted further toward tightening after the Reserve Bank of Australia (RBA) raised its cash rate unanimously to 4.60%.
Capital flows
- US Treasury TIC data for August show a net inflow of $199.8 billion, up from $87.4 billion in July.
- The trailing 12-month total is $1.3387 trillion, below the $1.7773 trillion of a year earlier, so a strong month sits alongside a softer cumulative picture.
- Japan’s Ministry of Finance weekly data show foreign investors bought 3.52 trillion yen of Japanese stocks, the second-largest week in 52 weeks. Five-week cumulative flows are still net negative at -1.1 trillion yen.
What is deliberately left blank
China had no material this week and the UK published no new macro releases, so we do not infer their state. Japan is mixed: the corporate goods price index slowed to 6.8% year on year from 7.7% in July, while contract-currency import prices remain 17.9% higher.
Why the weighting matters
Small economies can move sharply without changing the global picture. We therefore let the US, euro area and Japan decide each face, and use Canada or Australia only as cross-checks. Canadian wholesale sales fell 1.6% in August, a modest hint that activity outside the US is not uniformly strong.
物価の加速は、エネルギー頼みか、広がりか
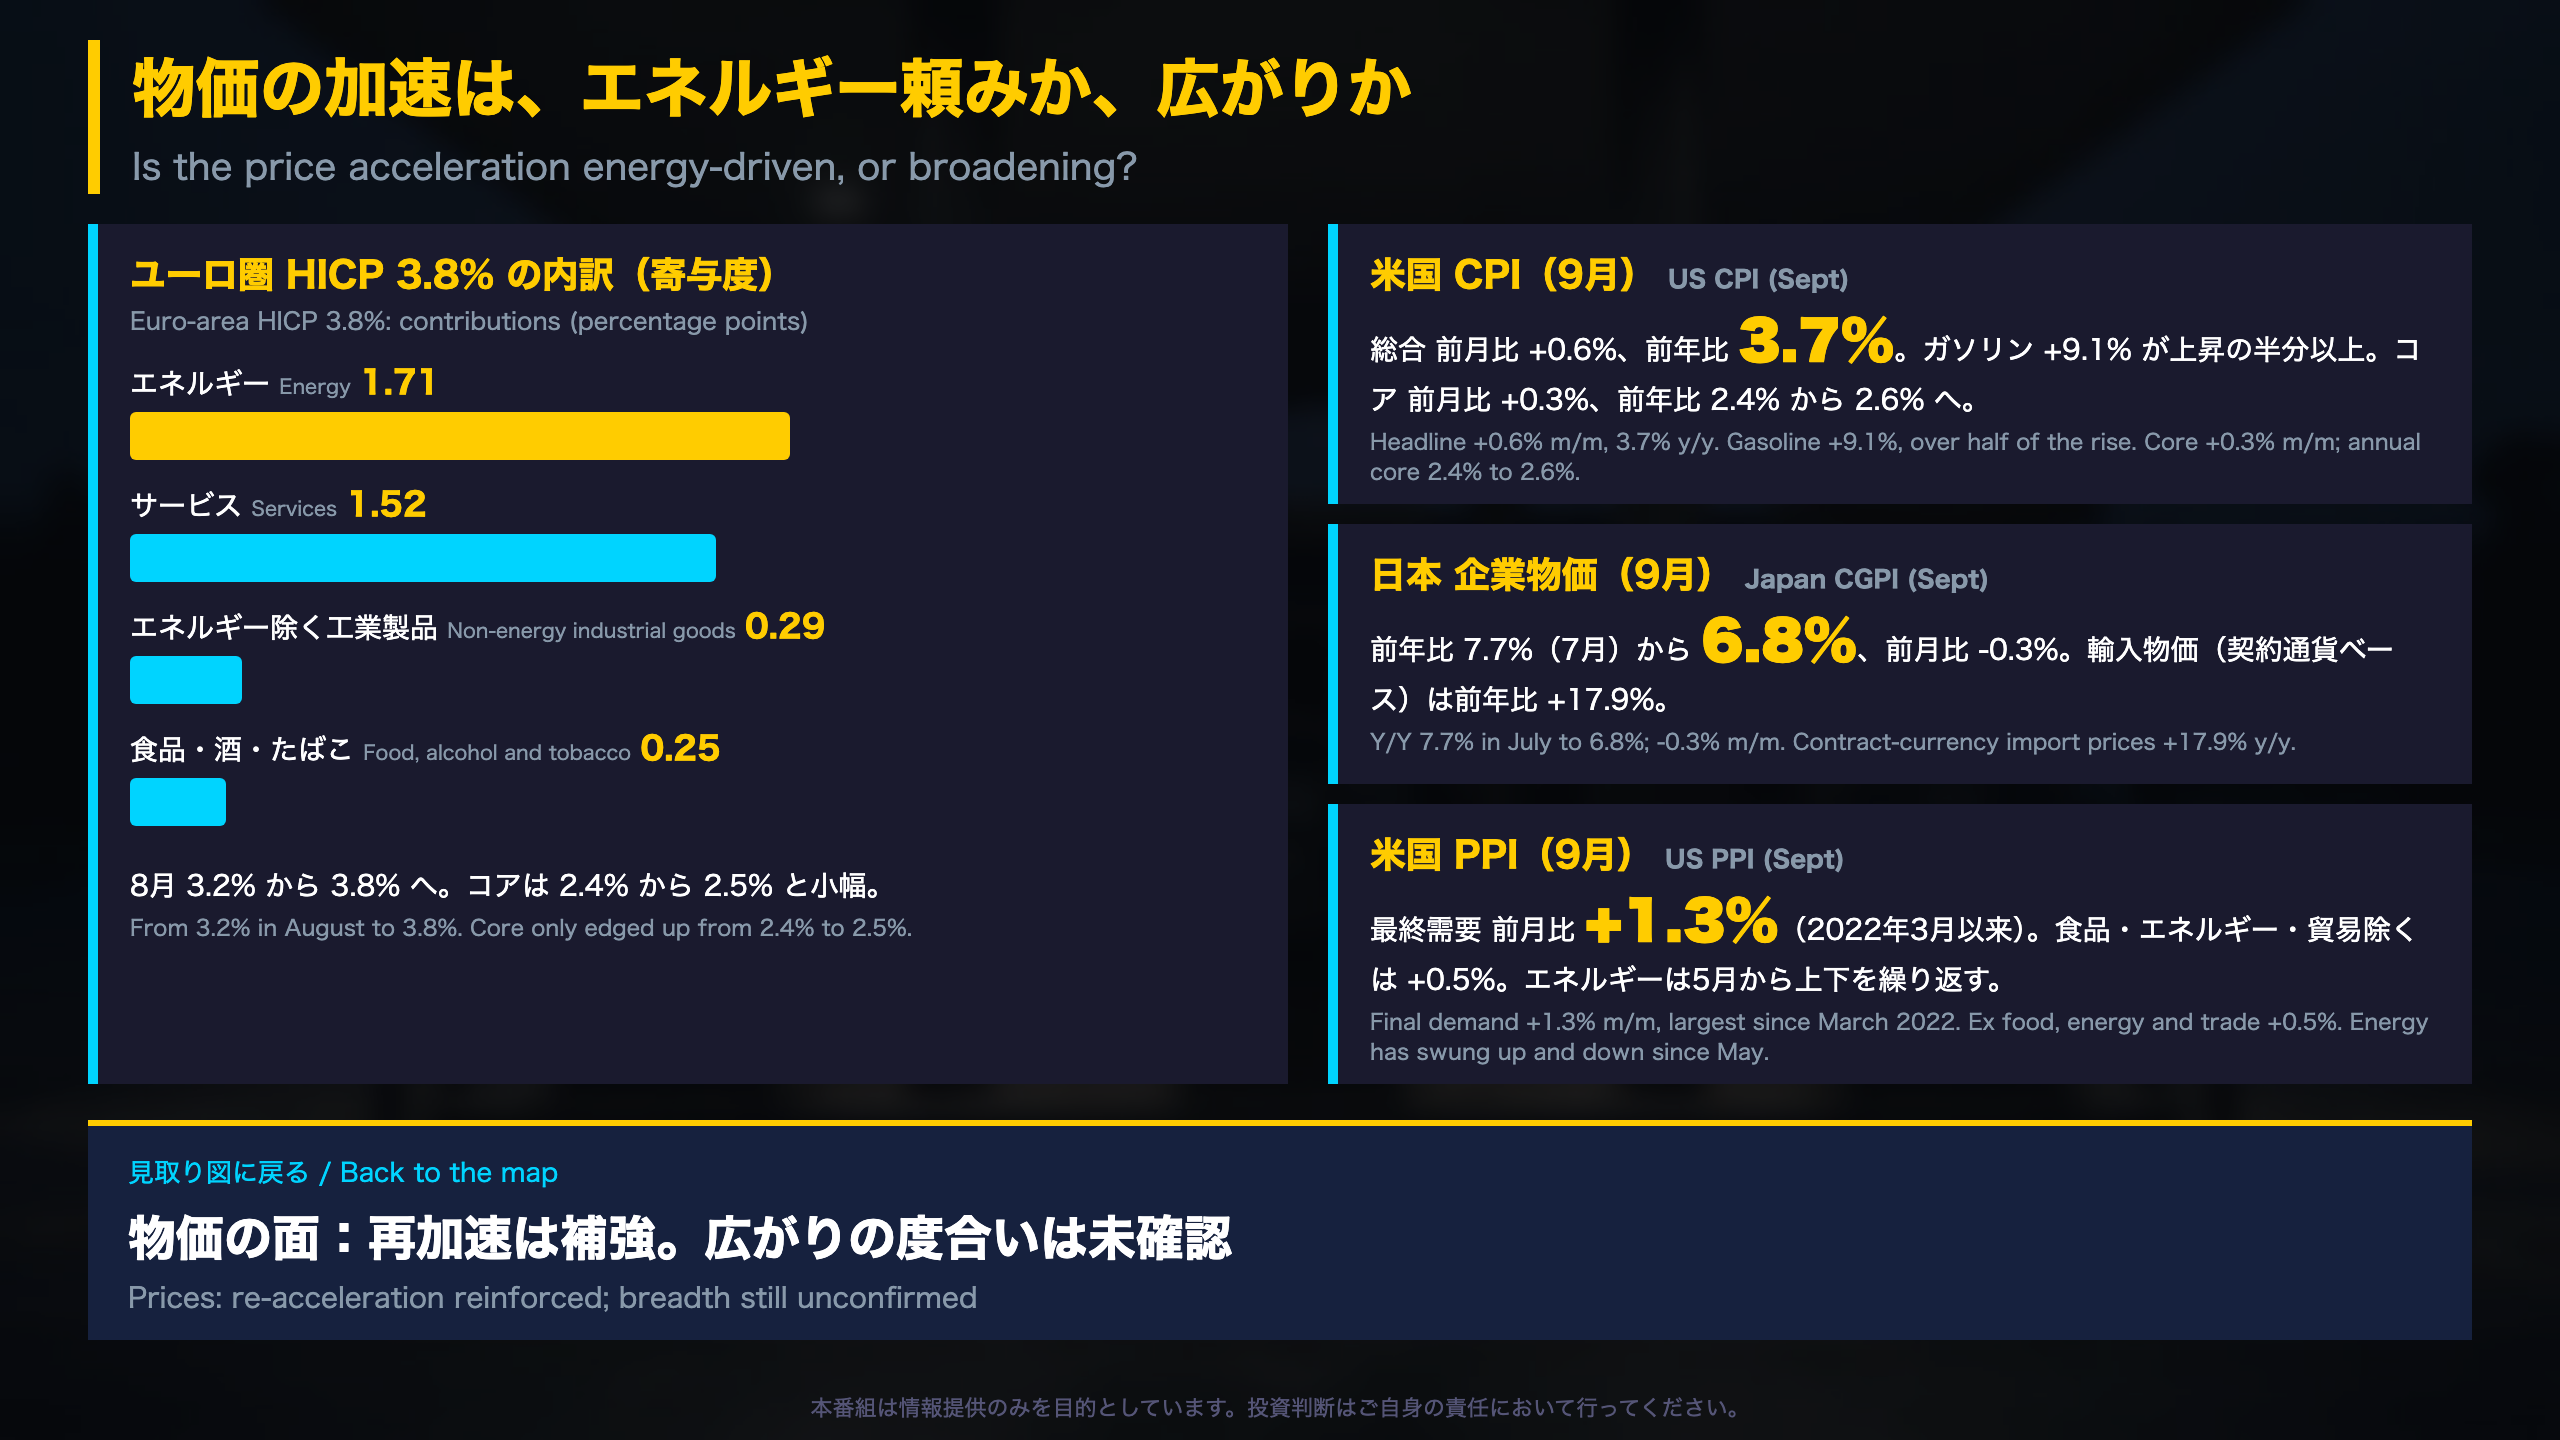
Reading the price data across three economies
United States. September CPI rose 0.6% on the month and 3.7% year on year. The BLS states that gasoline, up 9.1%, accounted for over half of the monthly increase. Gasoline contributed roughly 0.34 percentage points against about 0.27 for core. Core services excluding energy rose 0.4% (0.3% in August) and core goods 0.3% (0.1%), which is why we do not call this a pure energy story. The BLS also publishes standard errors: 0.04 points for the headline monthly change, so a 0.2% versus 0.3% core difference is hard to separate statistically.
Euro area. Eurostat’s final HICP is 3.8%. Energy contributed 1.71 points, services 1.52, non-energy industrial goods 0.29 and food, alcohol and tobacco 0.25. Annual rates rose in 23 of 27 member states, a sign that the energy shock is shared widely.
Japan. The Bank of Japan’s corporate goods price index slowed to 6.8% year on year from 7.7% in July, helped by a one-off agricultural drop of 8.8% on the month. Yet contract-currency import prices are 17.9% higher, so cost pressure upstream has not disappeared.
Market-neutral caveats
- US PPI excludes imports and imputed rent, so it is not a clean forecast for CPI.
- Energy in US PPI final demand moved +8.2%, -6.8%, -1.7%, +4.5% and +10.8% from May to September, showing how volatile a single month can be.
- Our judgment: services and core are the cleaner tests of breadth in coming releases.
Calendar
Euro-area October flash: Nov 4. US CPI: Nov 10. Japan CGPI: Nov 12. US PPI: Nov 13.
製造業は強いのに、消費と非製造業はなぜ鈍いのか
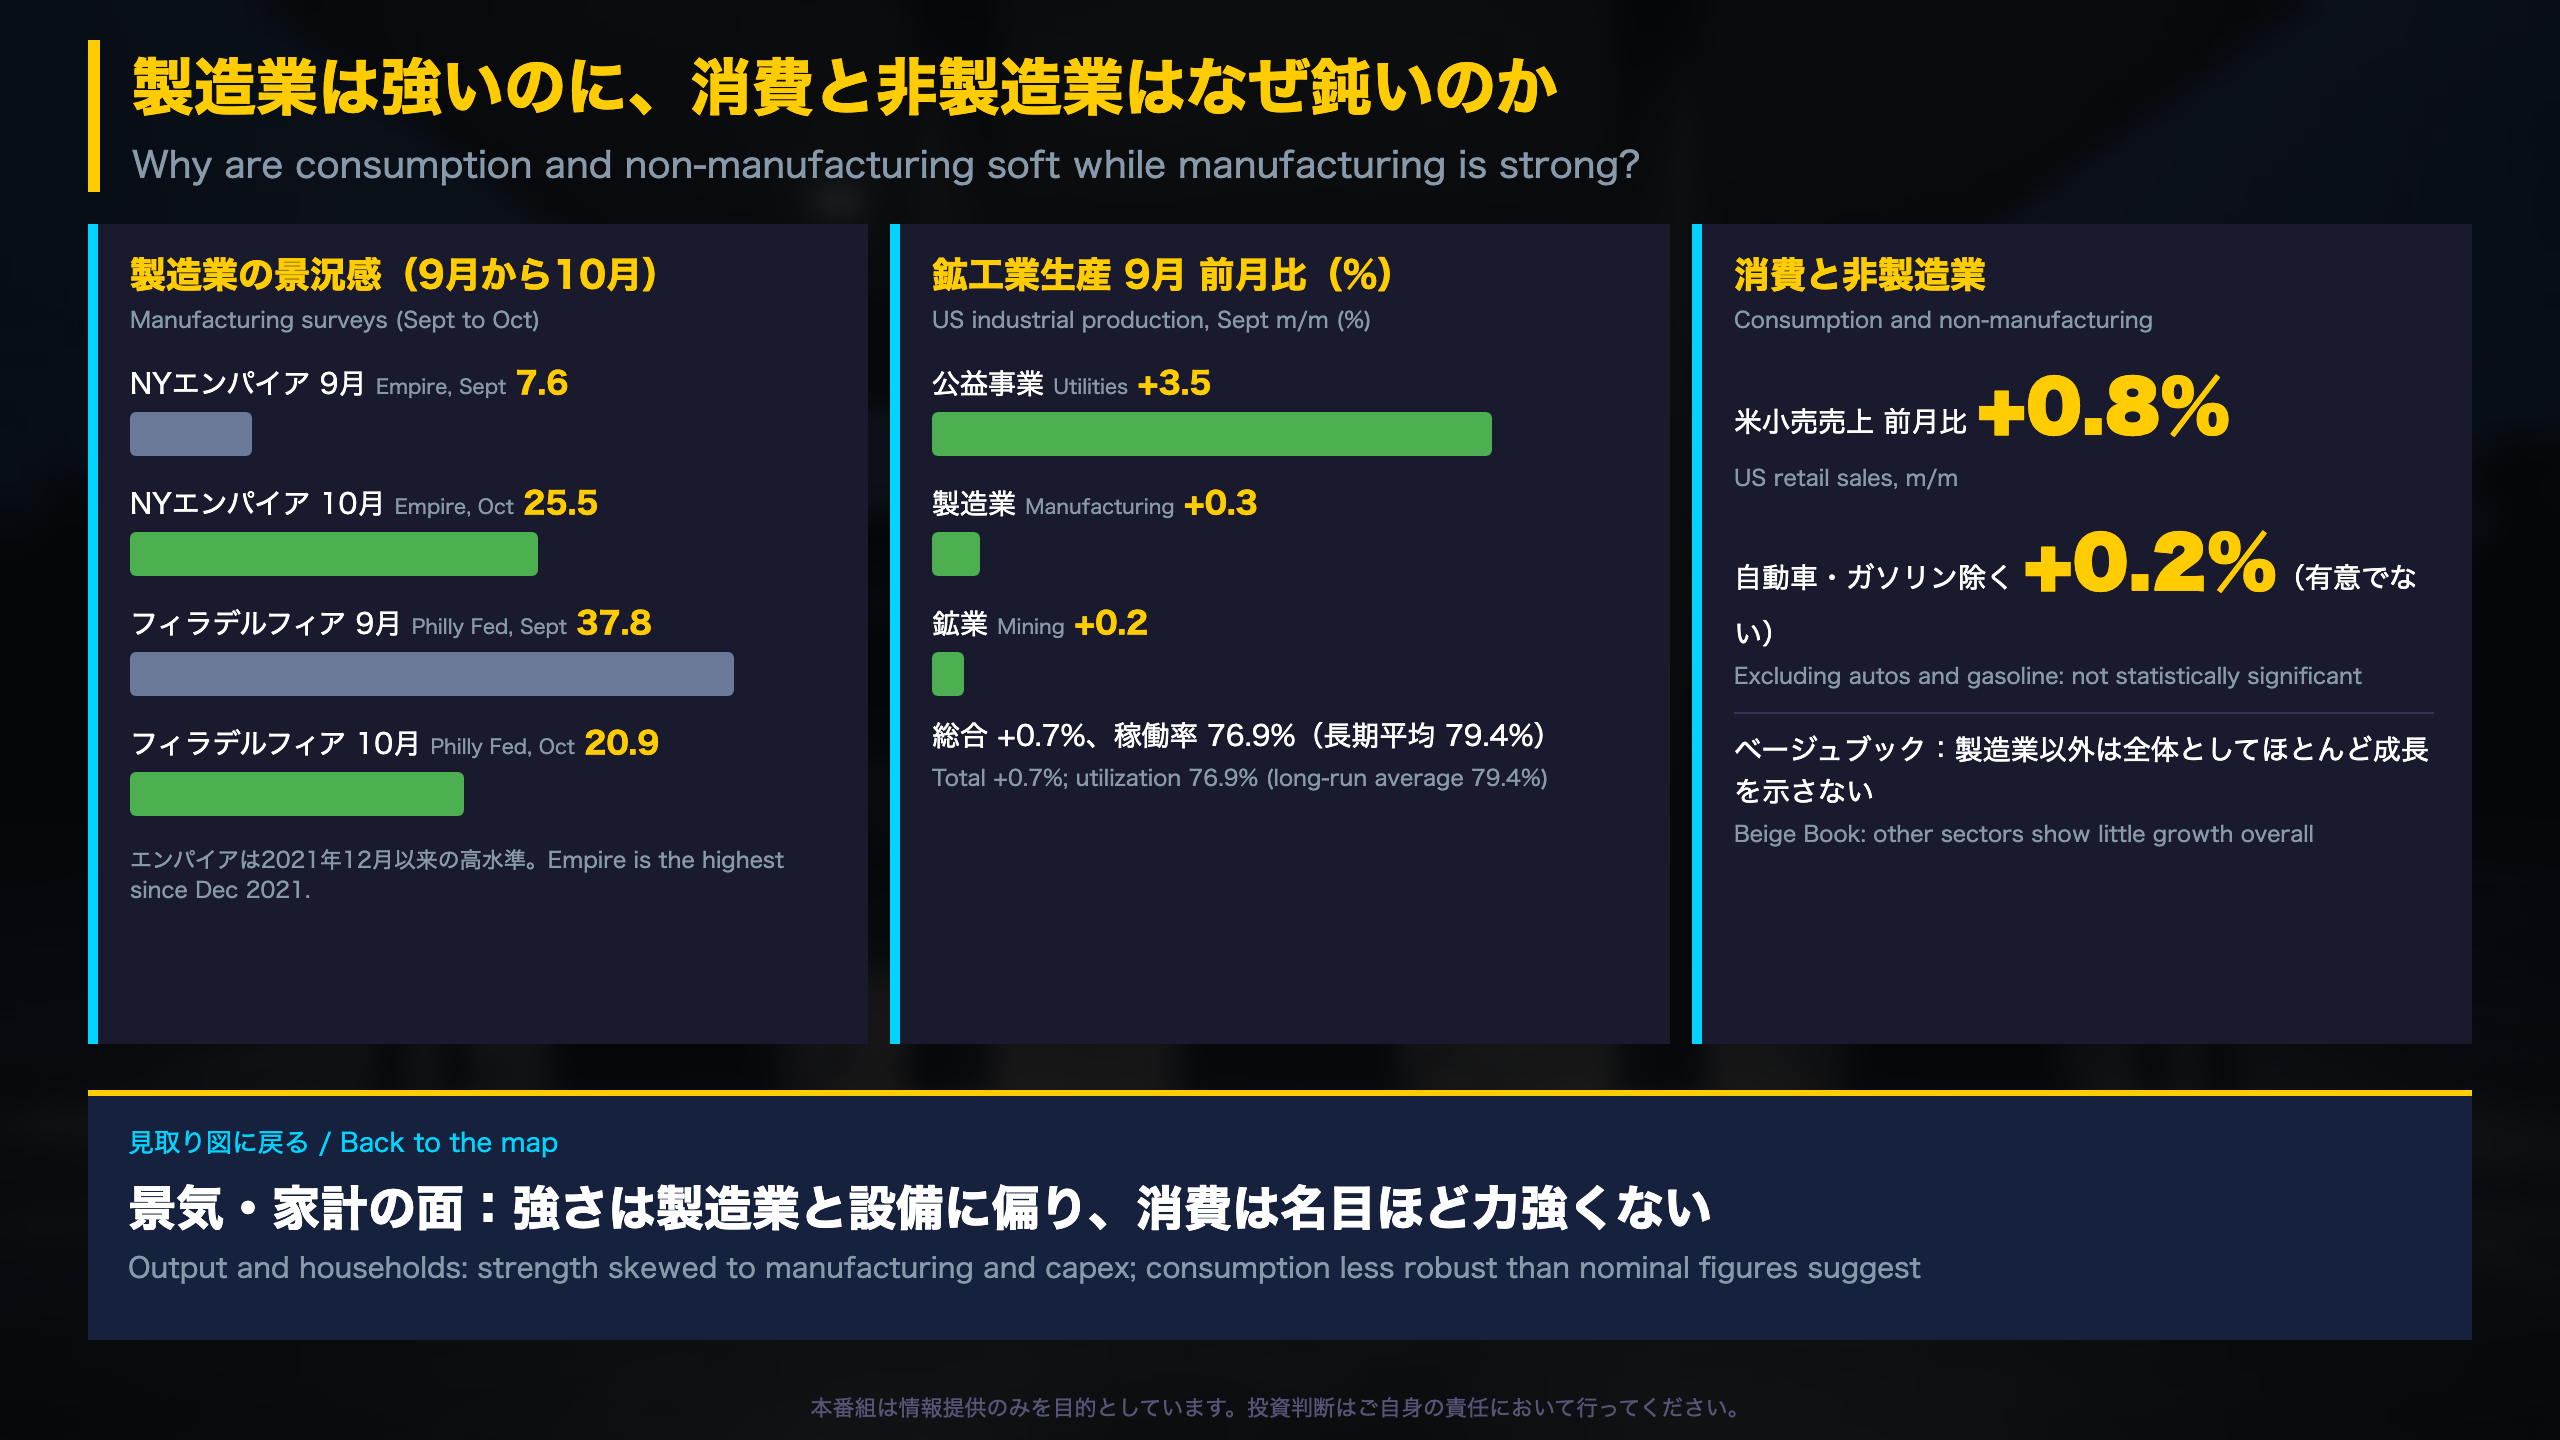
Two regional surveys, two different stories
The Empire State Manufacturing Survey (New York Fed) jumped to 25.5 in October from 7.6, which the Fed bank calls the highest in nearly five years. New orders (23.2) and shipments (13.1) both improved. The Philadelphia Fed survey moved the other way, from 37.8 to 20.9, with new orders falling to 4.3. Both remain in expansion territory, and 52% of Philadelphia respondents plan to raise 2027 capital spending versus none planning cuts.
What the Fed’s own data say
The Federal Reserve Board’s G.17 release shows September industrial production up 0.7%, but utilities (+3.5%) did most of the work while manufacturing rose just 0.3%. Capacity utilization is 76.9%, 2.5 points below its 1972-2025 average. Business equipment output is up 6.7% year on year; consumer goods are down 0.1%.
The Beige Book caveat
The Beige Book is a qualitative summary of conversations with businesses across the 12 Fed districts; it is not the view of Fed officials. It describes activity outside manufacturing as showing little growth overall, and notes that lower-income consumers are more cautious.
Retail sales
Census Bureau advance retail sales rose 0.8% in September (6.3% year on year, nominal), but excluding autos and gasoline the monthly gain is 0.2% and not statistically significant. An annual benchmark revision also shifted levels, so cross-release comparisons need care.
Our read
Growth is concentrated in AI and capex-related manufacturing, supported by TSMC’s 50.9% revenue growth and ASML’s record sales. We do not infer a recession signal from soft consumption; we flag the divergence as the key thing to monitor with Michigan’s final sentiment on Oct 23.
中央銀行は現在地をどう見ているか
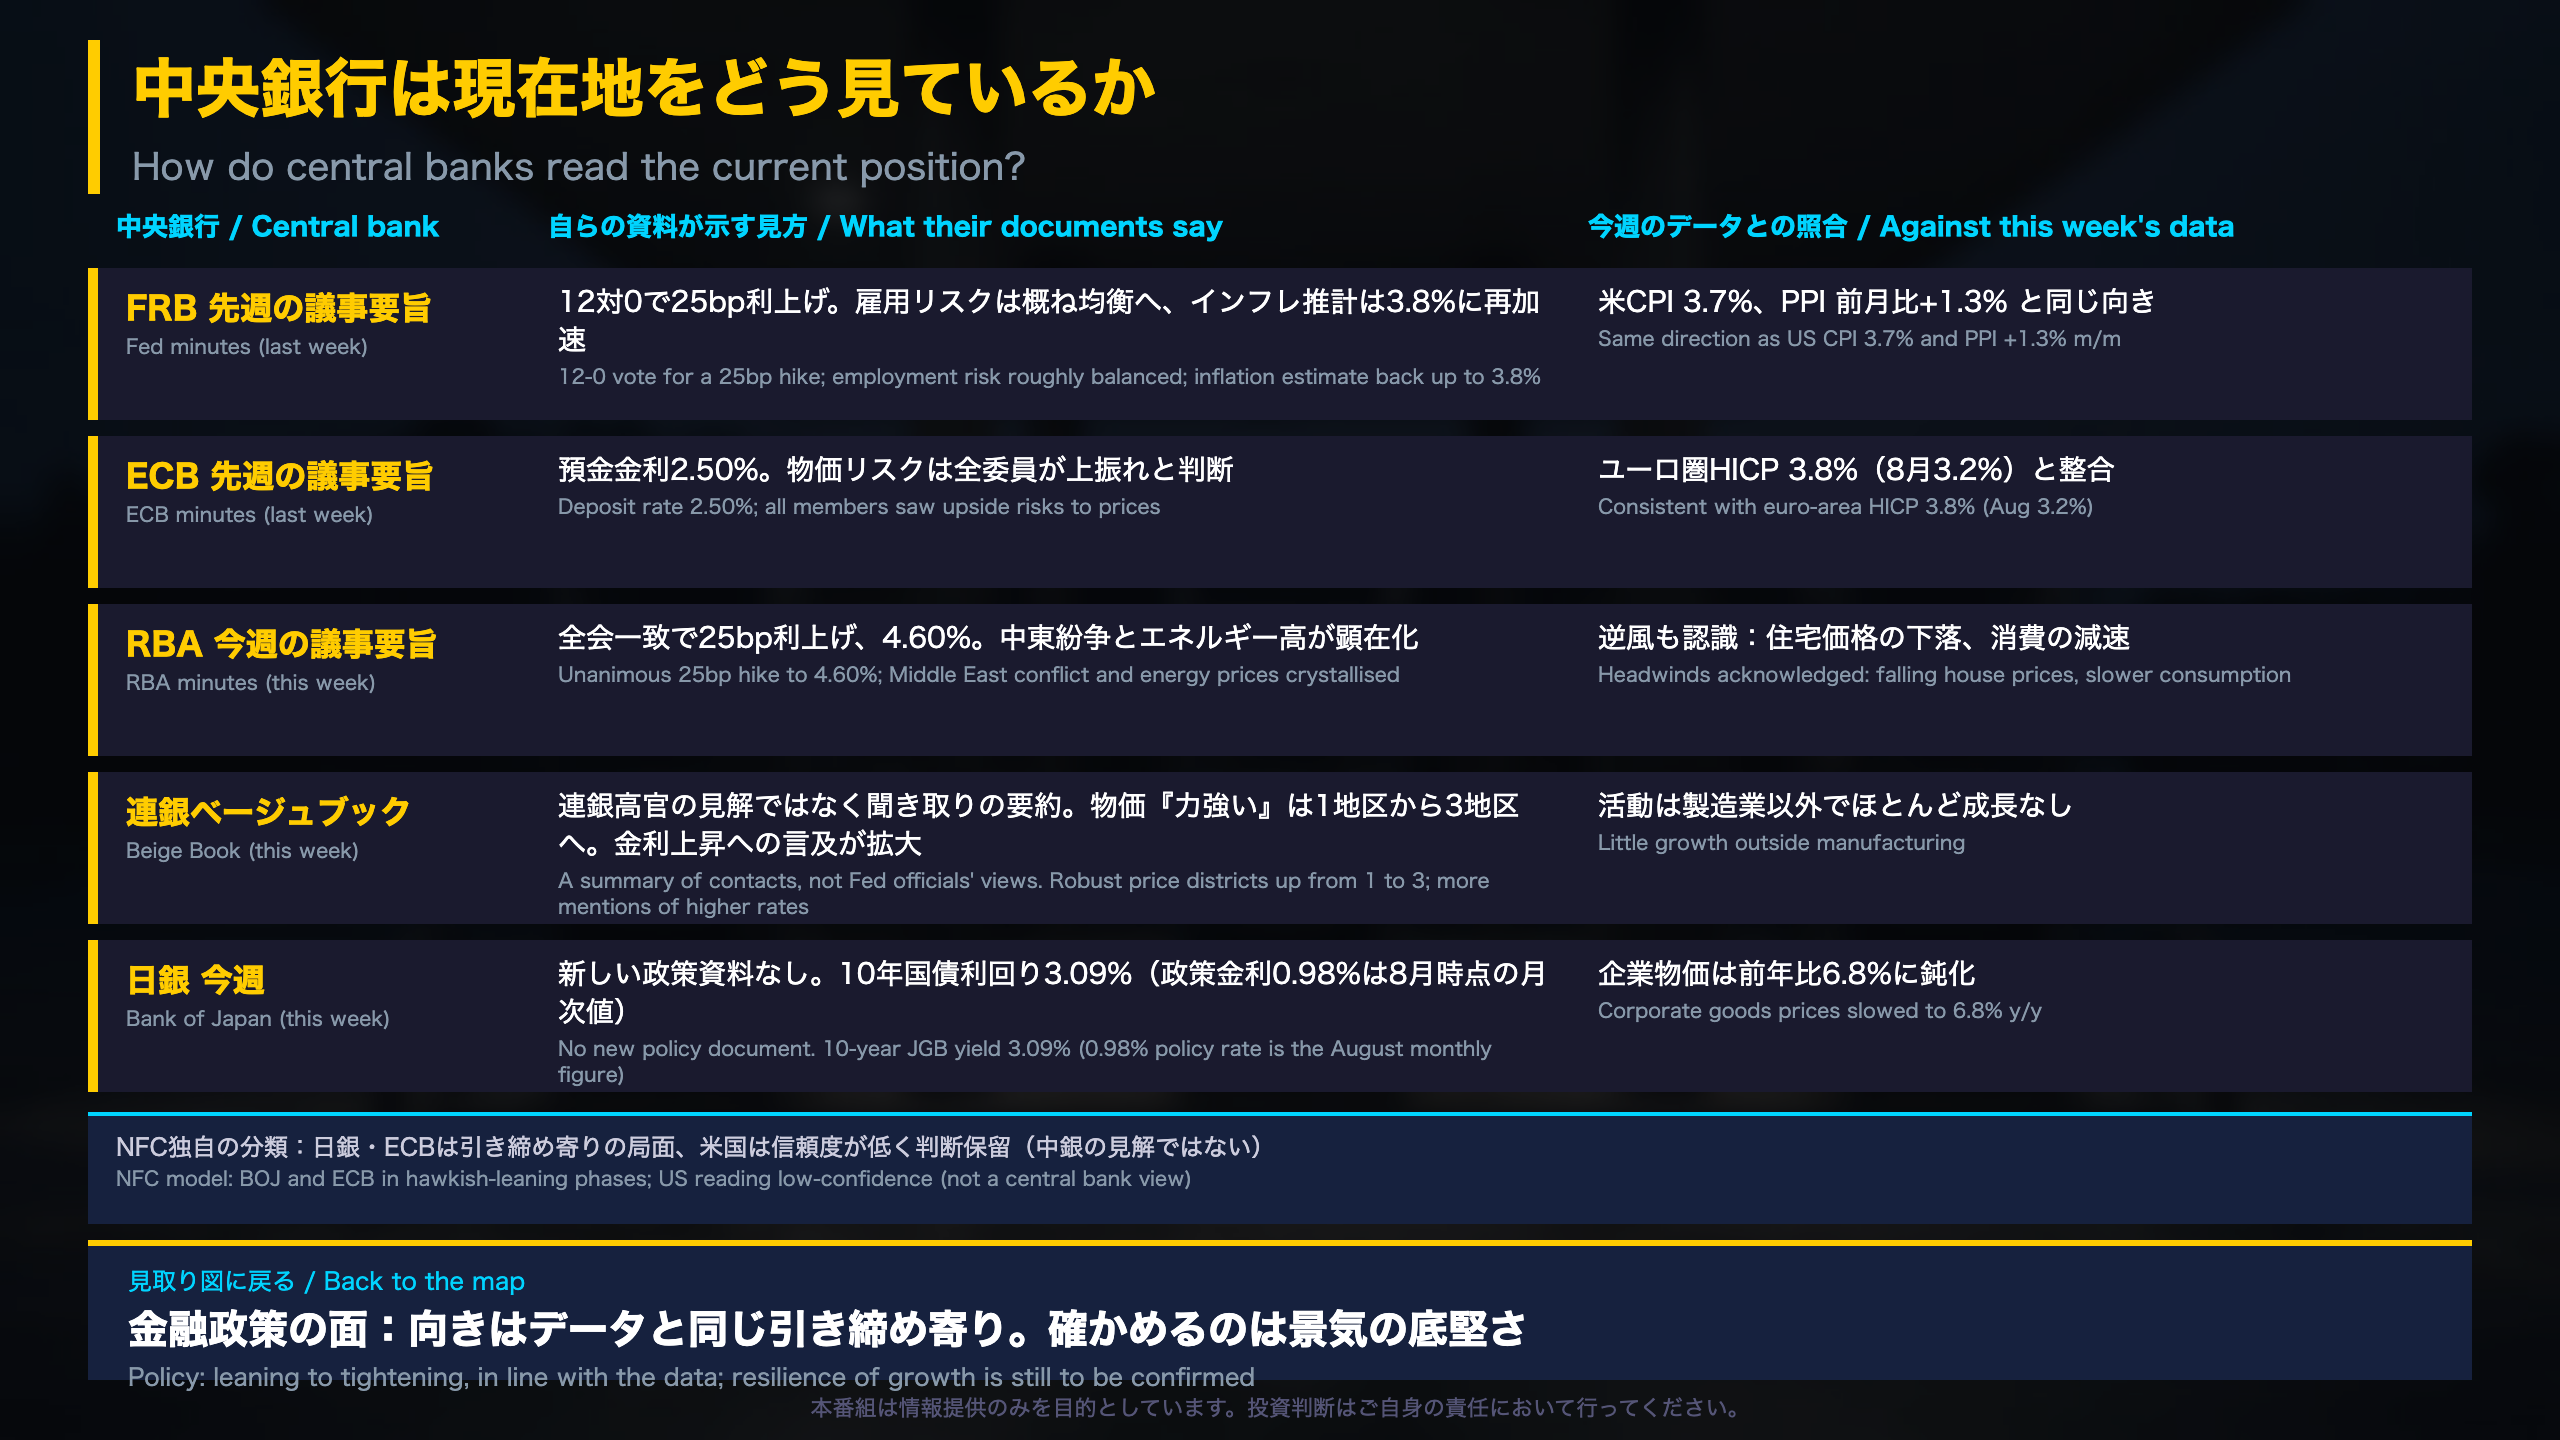
Central banks in their own words
Reserve Bank of Australia (RBA). The minutes of the September 28-29 meeting record a unanimous 25 basis point hike to 4.60%, after a unanimous hold in August. The board says several upside risks flagged in August had crystallised: the Middle East conflict re-escalated, global energy prices overshot, and domestic capacity pressure looked stronger. The same minutes admit headwinds, namely steeper house-price falls, a sharp drop in new mortgage lending and slower household consumption. They add that spillovers from energy to other consumer prices abroad have so far been limited.
Federal Reserve and ECB (last week’s documents). The FOMC minutes show a 12-0 vote for a 25bp hike versus 9-3 for a hold in July. The employment risk assessment moved from ‘tilted to the downside’ to ‘broadly balanced’, and the inflation estimate for August rose to 3.8%. The ECB minutes record that all members supported the proposal to raise the deposit rate to 2.50% and judged price risks to be on the upside.
The Beige Book, explained
Published by the Fed roughly eight times a year, it compiles anecdotal reports from businesses in each of 12 districts. It is not the view of policymakers. In this edition, three districts describe price growth as robust (one in August), and several mention rising interest rates as a concern for banks and borrowers.
Bank of Japan
No new BOJ document was released this week. JGB 10-year yields are 3.09%. The 0.98% policy rate in our data is the OECD monthly figure for August, so it may not reflect the latest decision.
Regime model note
NFC’s proprietary hidden Markov model classifies the BOJ and ECB in hawkish-leaning phases, while the US reading has low confidence. It is a descriptive tool, not a forecast or a central bank view.
来週、見取り図のどこが更新されるか
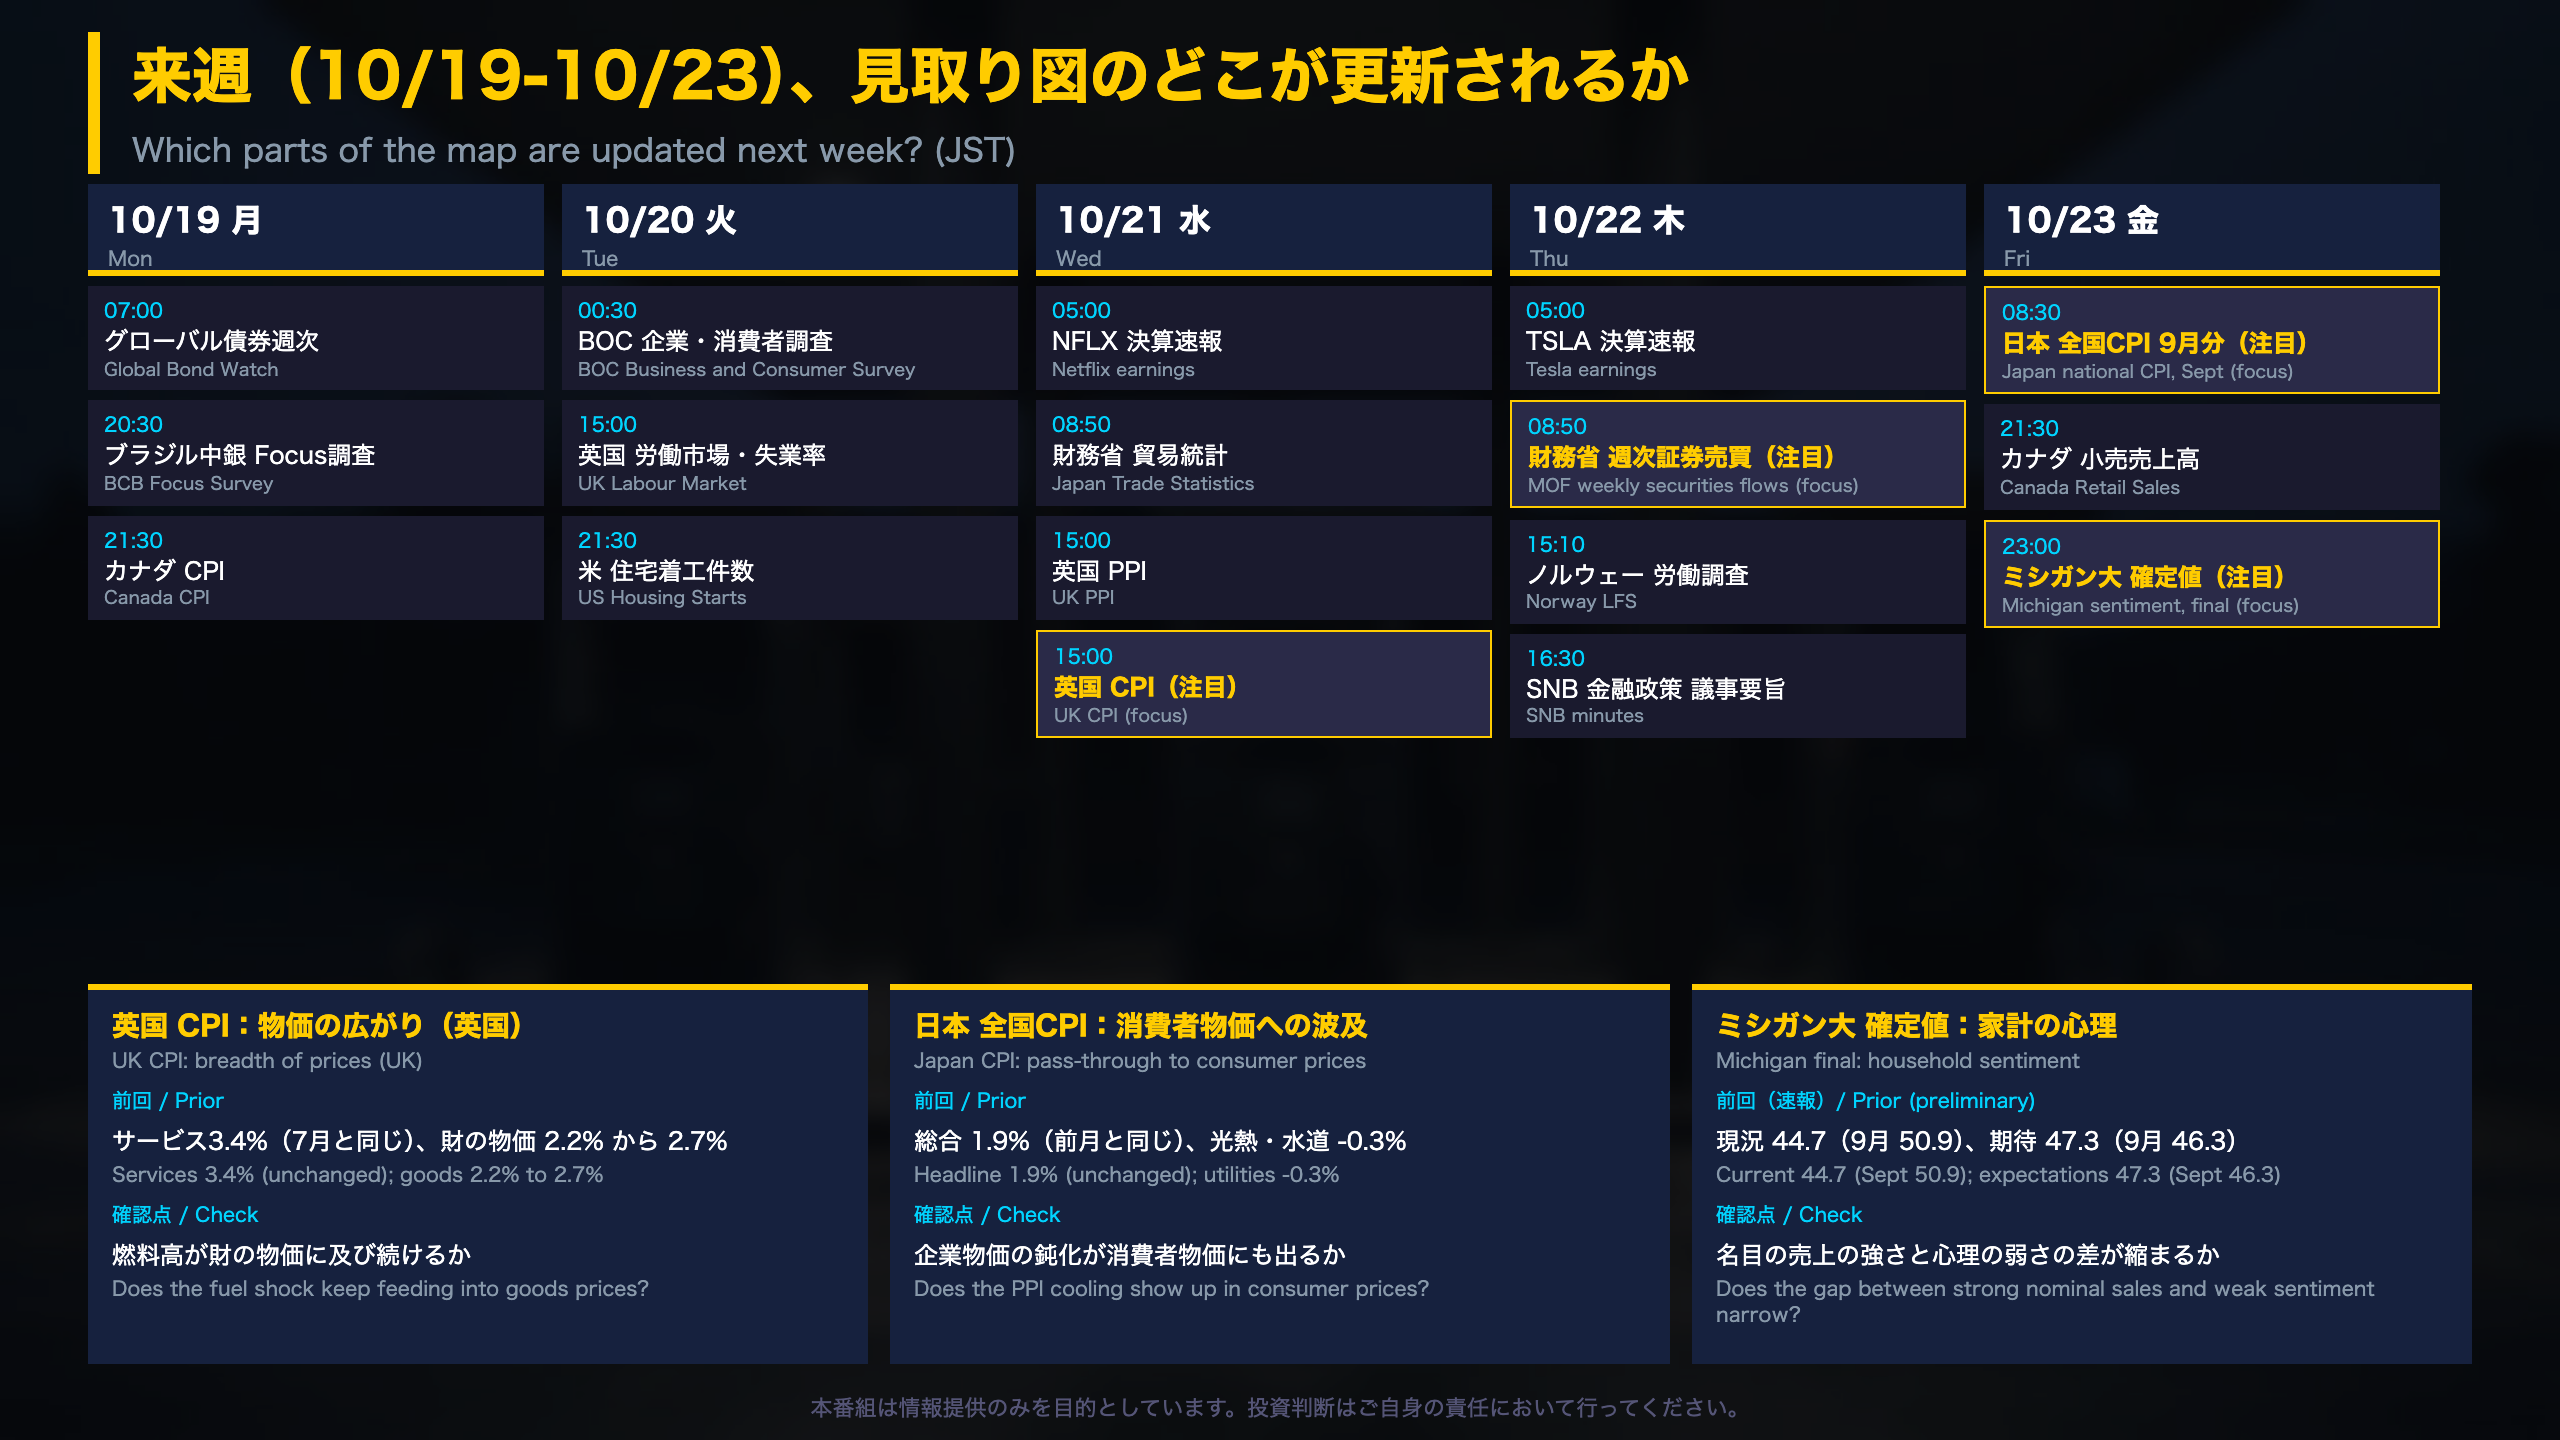
Next week’s calendar and what each release tests
All times are Japan Standard Time. The key checkpoints for our map are:
- UK CPI (Wed 21, 15:00): The UK is a backbone economy with no new releases this week. In the previous report (August data), petrol reached 161.3 pence per litre, the highest since November 2022, and goods inflation rose from 2.2% to 2.7%, the highest since September 2025, while services inflation held at 3.4%. The Office for National Statistics (ONS) publishes CPI; watch whether the fuel shock keeps feeding into goods prices.
- Japan national CPI, September (Fri 23, 08:30): Published by the Statistics Bureau. The prior reading was 1.9% for the headline, unchanged, with utilities at -0.3% after +0.7% in July. With Japan’s producer prices slowing, this tests whether consumer prices follow.
- University of Michigan final sentiment (Fri 23, 23:00): The preliminary October reading showed current conditions at 44.7 (50.9 in September) and expectations at 47.3 (46.3). The final reading tells us whether the weak household mood persists alongside solid nominal retail sales.
- Japan weekly securities flows (Thu 22, 08:50): The Ministry of Finance data showed foreign buying of Japanese stocks at 3.52 trillion yen. A third straight week of net buying would match a precedent from March-April, but it is not a forecast.
Outside next week’s window
The next FOMC meeting is October 27-28, euro-area October flash HICP is on November 4, US CPI on November 10 and Japan’s producer price index on November 12.
Disclaimer: This article is for informational purposes only. All investment decisions are made solely at your own risk.