
📺 Watch the Full Video Analysis
This article was automatically generated by the NFC Market Live AI analysis system. (Updated: 2026-10-19 07:13 JST)
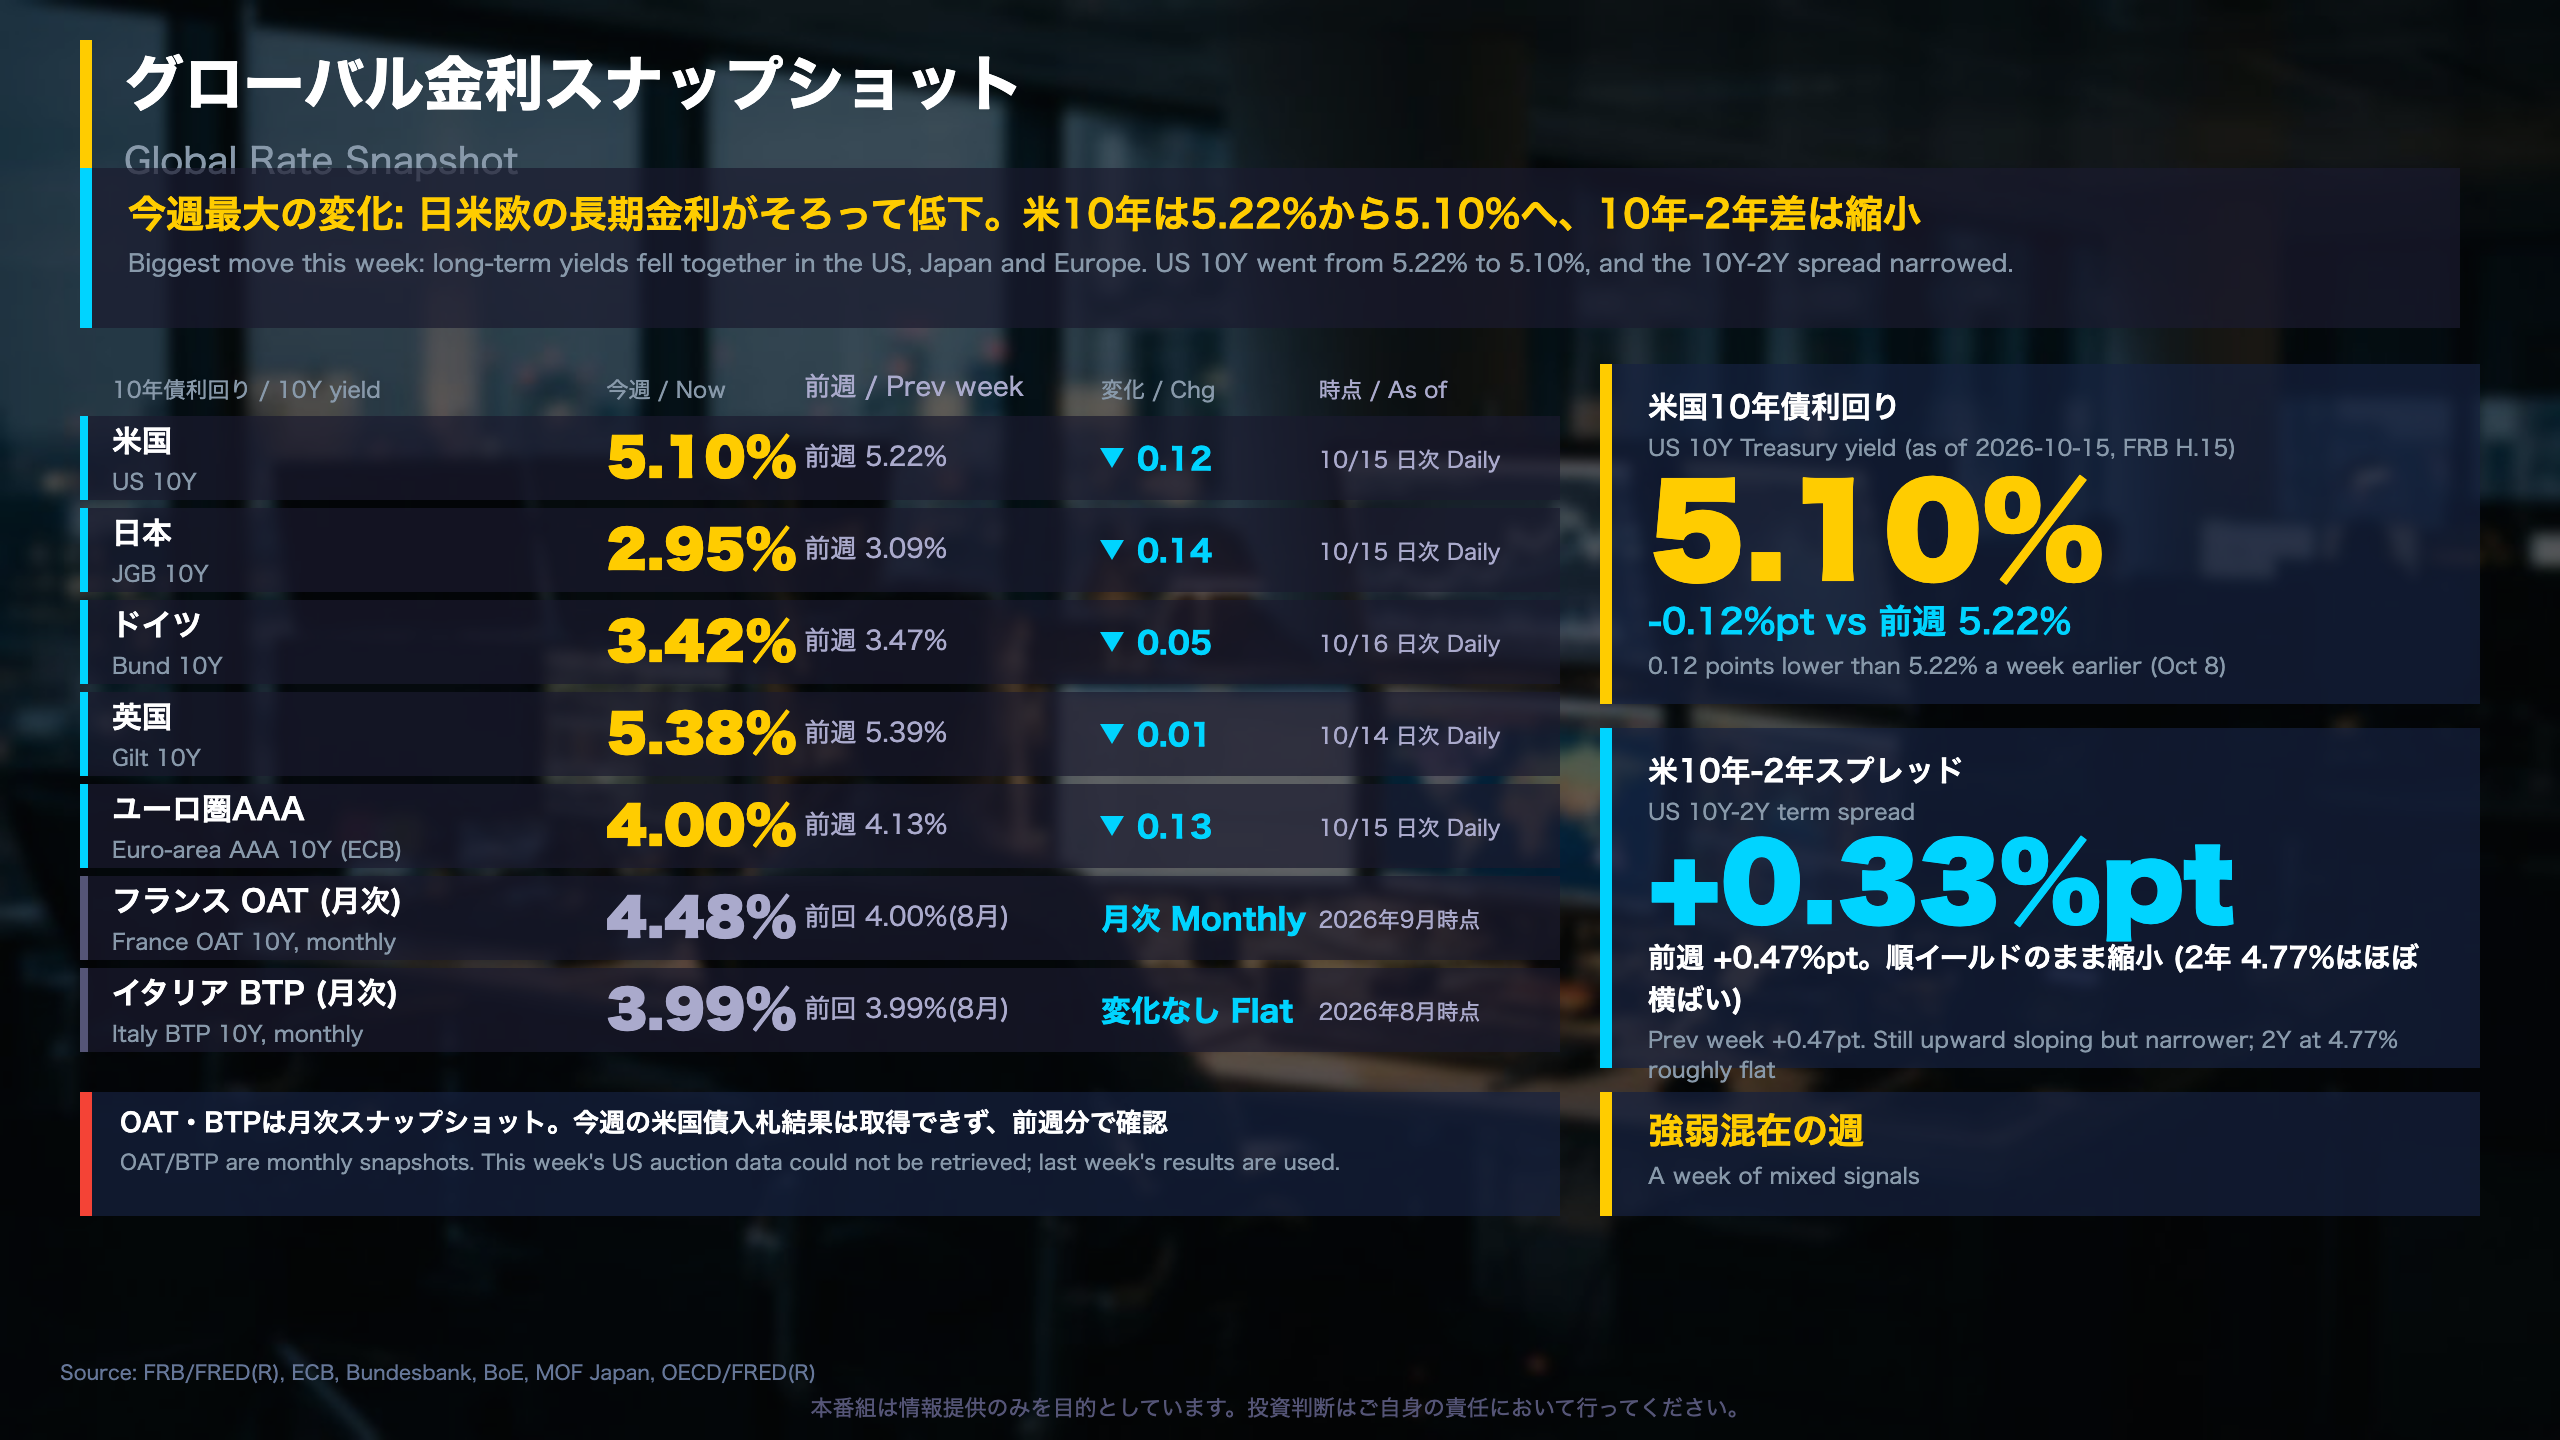
📊 Weekly Global Bond Watch. The US 10-year yield fell to 5.10% from 5.22% a week earlier, with Japan, the euro-area AAA curve and Germany also lower.
📉 The 2-year was flat, so the US 10s-2s spread narrowed from +0.47 to +0.33 points.
💡 Japanese government bond auctions showed higher bid-to-cover ratios and narrower tails across all maturities.
⚠️ This week’s US Treasury auction data was unavailable, and French/Italian figures are monthly with timing gaps.
🔎 We also cover NFC HMM regimes and US-Japan / US-Germany yield gaps.
グローバル金利スナップショット
Global Yield Snapshot: A Synchronized Decline
Long-term government bond yields fell almost everywhere in this week’s data. The US 10-year Treasury yield was 5.10% as of October 15, 2026, down 0.12 points from 5.22% a week earlier (Oct 8). Japan’s 10-year JGB yield eased to 2.95%, the ECB’s euro-area AAA 10-year to 4.00%, Germany’s Bund to 3.42% and the UK gilt to 5.38%.
Why the curve matters
The US 10-year minus 2-year spread, often called the ‘term spread’, narrowed from +0.47 to +0.33 points because the 2-year yield barely moved (4.75% to 4.77%) while 10- and 30-year yields fell. The curve still slopes upward, so this is flattening, not inversion.
Where the numbers come from
US yields come from the Federal Reserve’s H.15 release via FRED, Japan’s from the Ministry of Finance, Germany’s from the Bundesbank, the UK’s from the Bank of England and the euro-area AAA curve from the ECB. French and Italian yields are monthly OECD data and serve as reference only.
Two readings
- Constructive: buyers appear to be returning to long bonds, and auctions are being absorbed.
- Cautious: a US 10-year near 5% is still a high level, and one week does not make a trend. Observation dates also differ by country (Oct 14-16).
What to watch
This week’s US auction results were not retrieved, so confirmation of long-end demand awaits the next report.
米国債入札 Deep Dive
US Treasury Auctions: Reading Last Week’s Results
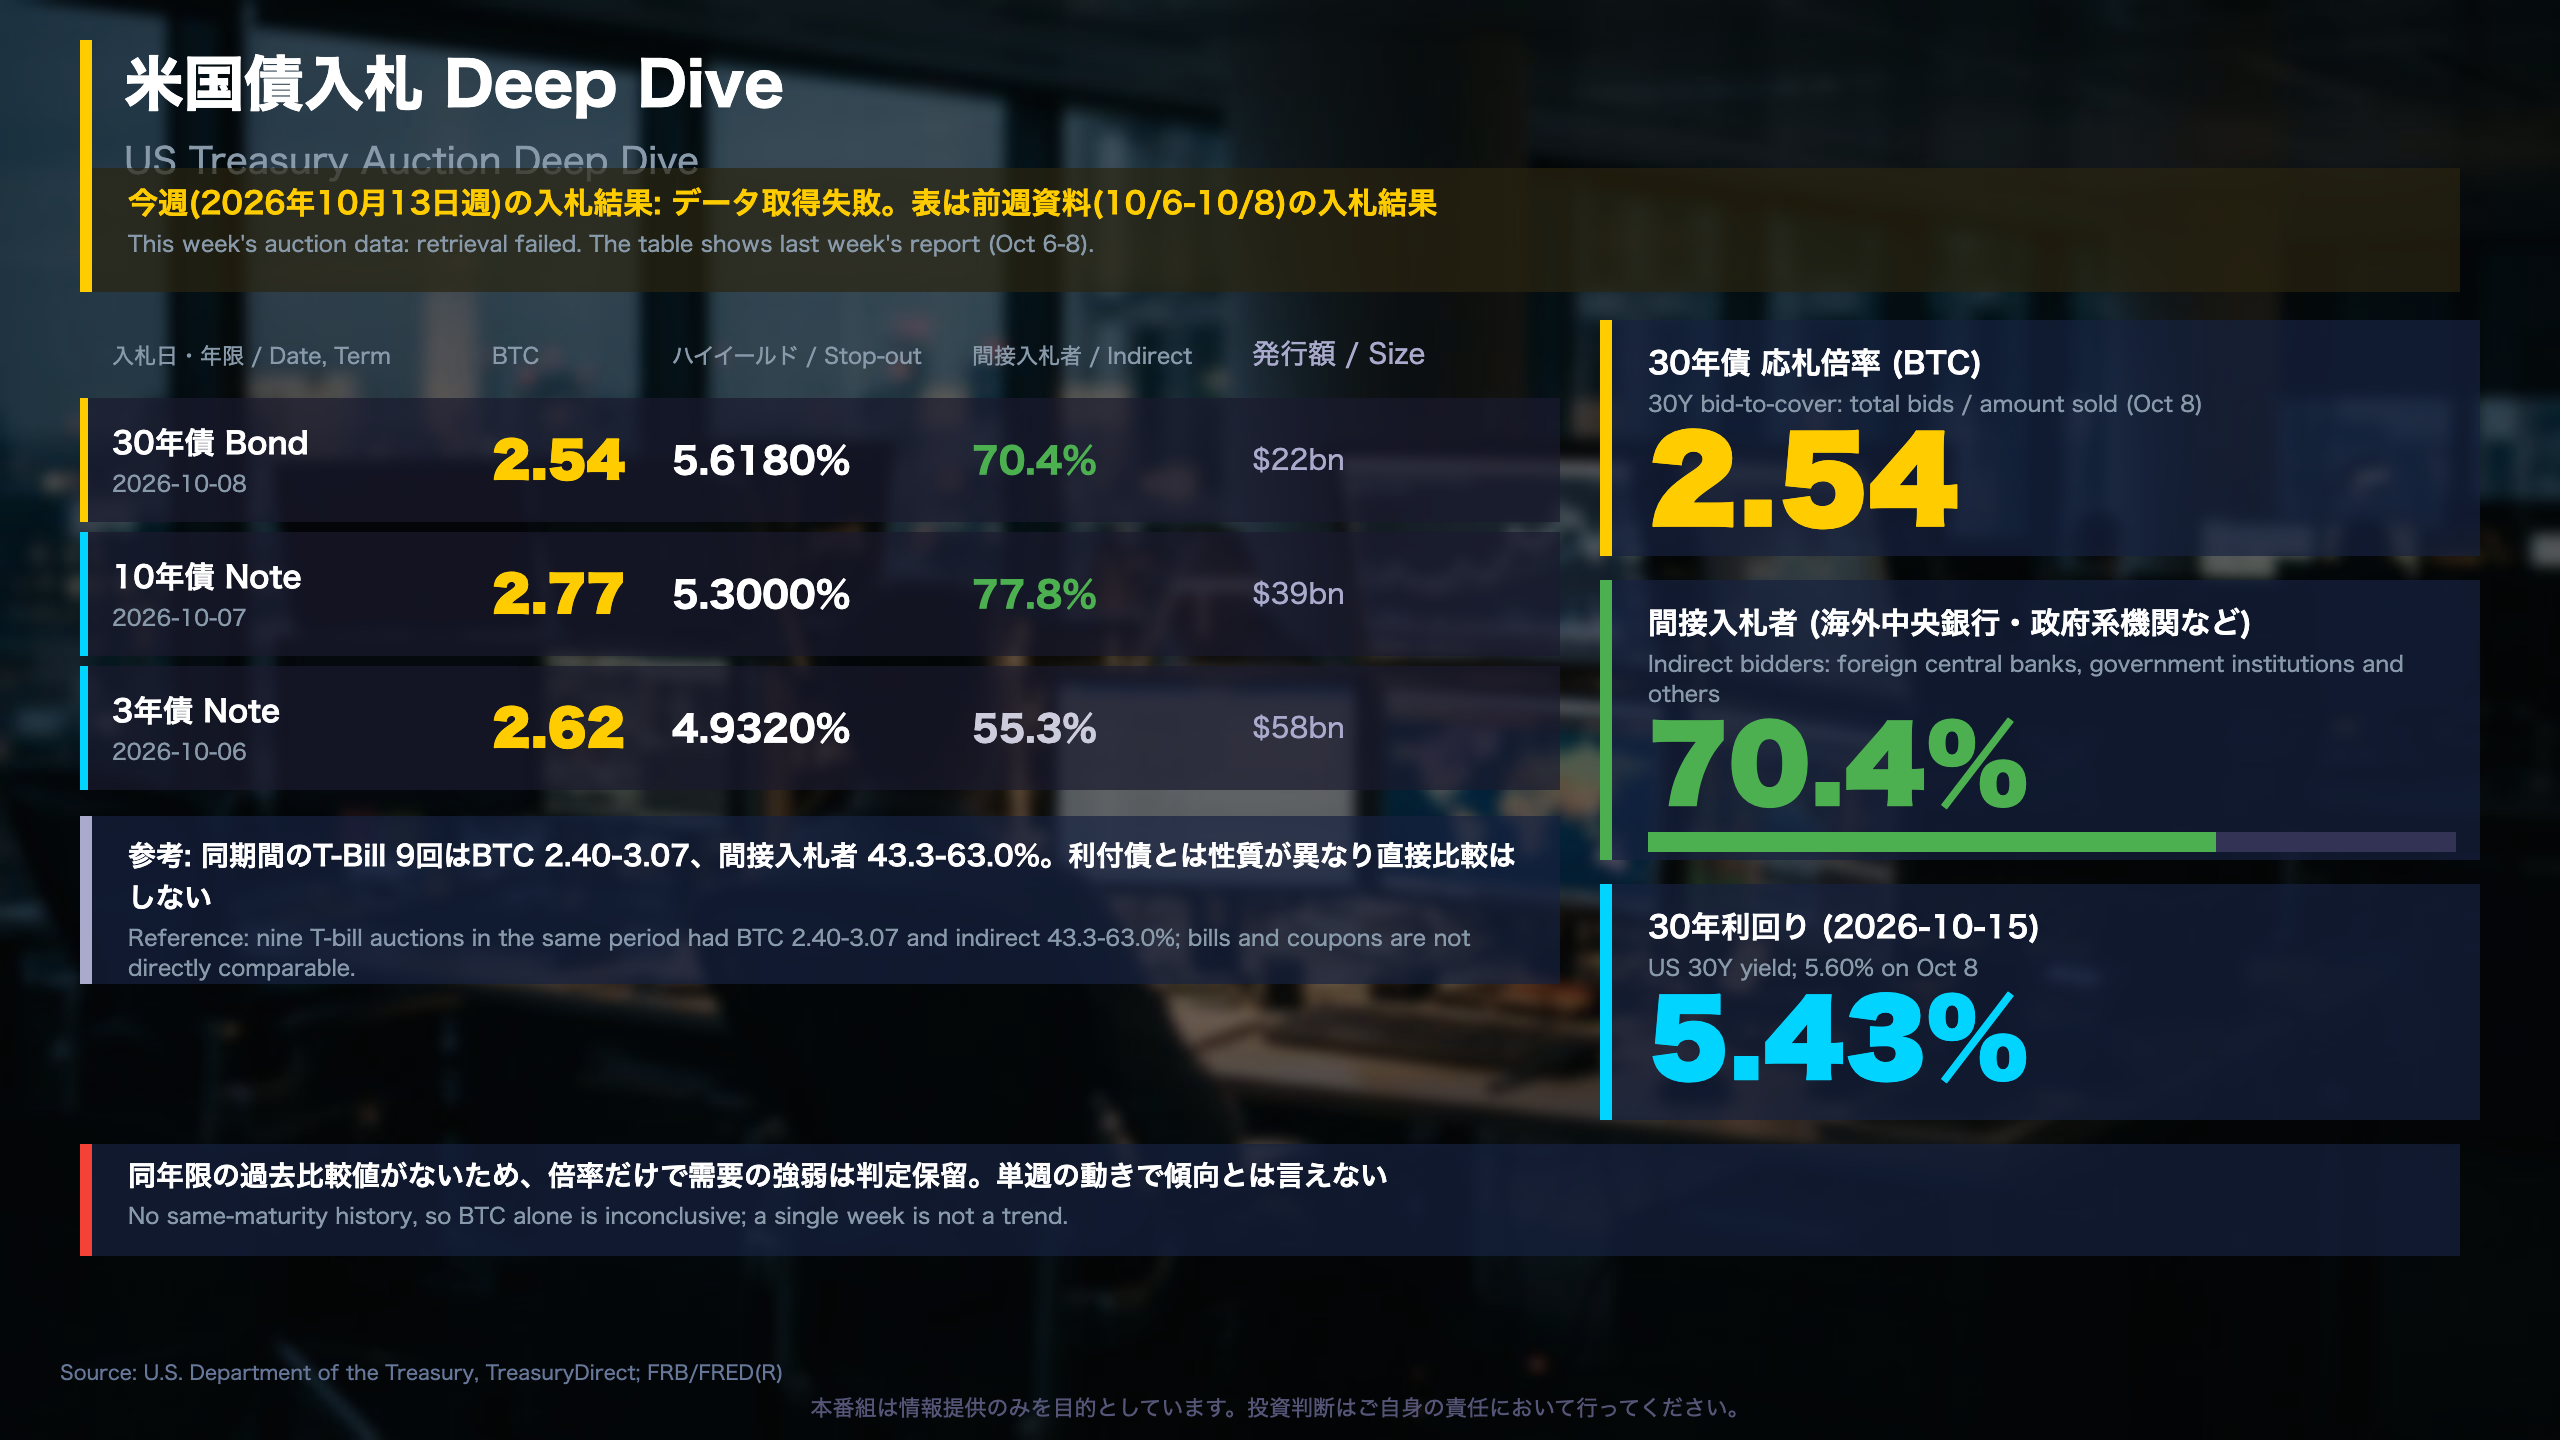
This week’s auction table could not be retrieved, so the data below comes from the previous report (Oct 6-8, 2026).
| Date | Term | Bid-to-cover | Stop-out | Indirect | Size |
|---|---|---|---|---|---|
| Oct 8 | 30Y bond | 2.54 | 5.6180% | 70.4% | $22bn |
| Oct 7 | 10Y note | 2.77 | 5.3000% | 77.8% | $39bn |
| Oct 6 | 3Y note | 2.62 | 4.9320% | 55.3% | $58bn |
Key terms
Bid-to-cover is total bids divided by the amount sold; higher generally means stronger demand. Indirect bidders are, in the report’s definition, ‘foreign central banks, government-related institutions and others’, a gauge of overseas appetite. The share was high in both the 10-year and the 30-year.
Caveats
We lack earlier readings for the same maturities, so a bid-to-cover of 2.54 cannot be called strong or weak. Nine T-bill auctions in the same period showed bid-to-cover of 2.40-3.07, but bills and coupons are structurally different and should not be compared directly.
Market context
The 30-year yield was 5.60% on Oct 8 and 5.43% on Oct 15. A decline after an auction is consistent with, but does not prove, renewed buying. Compared with Japan, where auctions are published with tail data, US results here lack a tail measure, limiting the analysis.
What to watch
Whether next week’s report restores the auction table, and whether 10- and 30-year bid-to-cover ratios exceed 2.77 and 2.54. Fiscal issuance trends matter for how long-end demand is read.
ヨーロッパ債券市場
European Bonds: Falling Yields and a Monthly-Data Timing Gap
Daily data
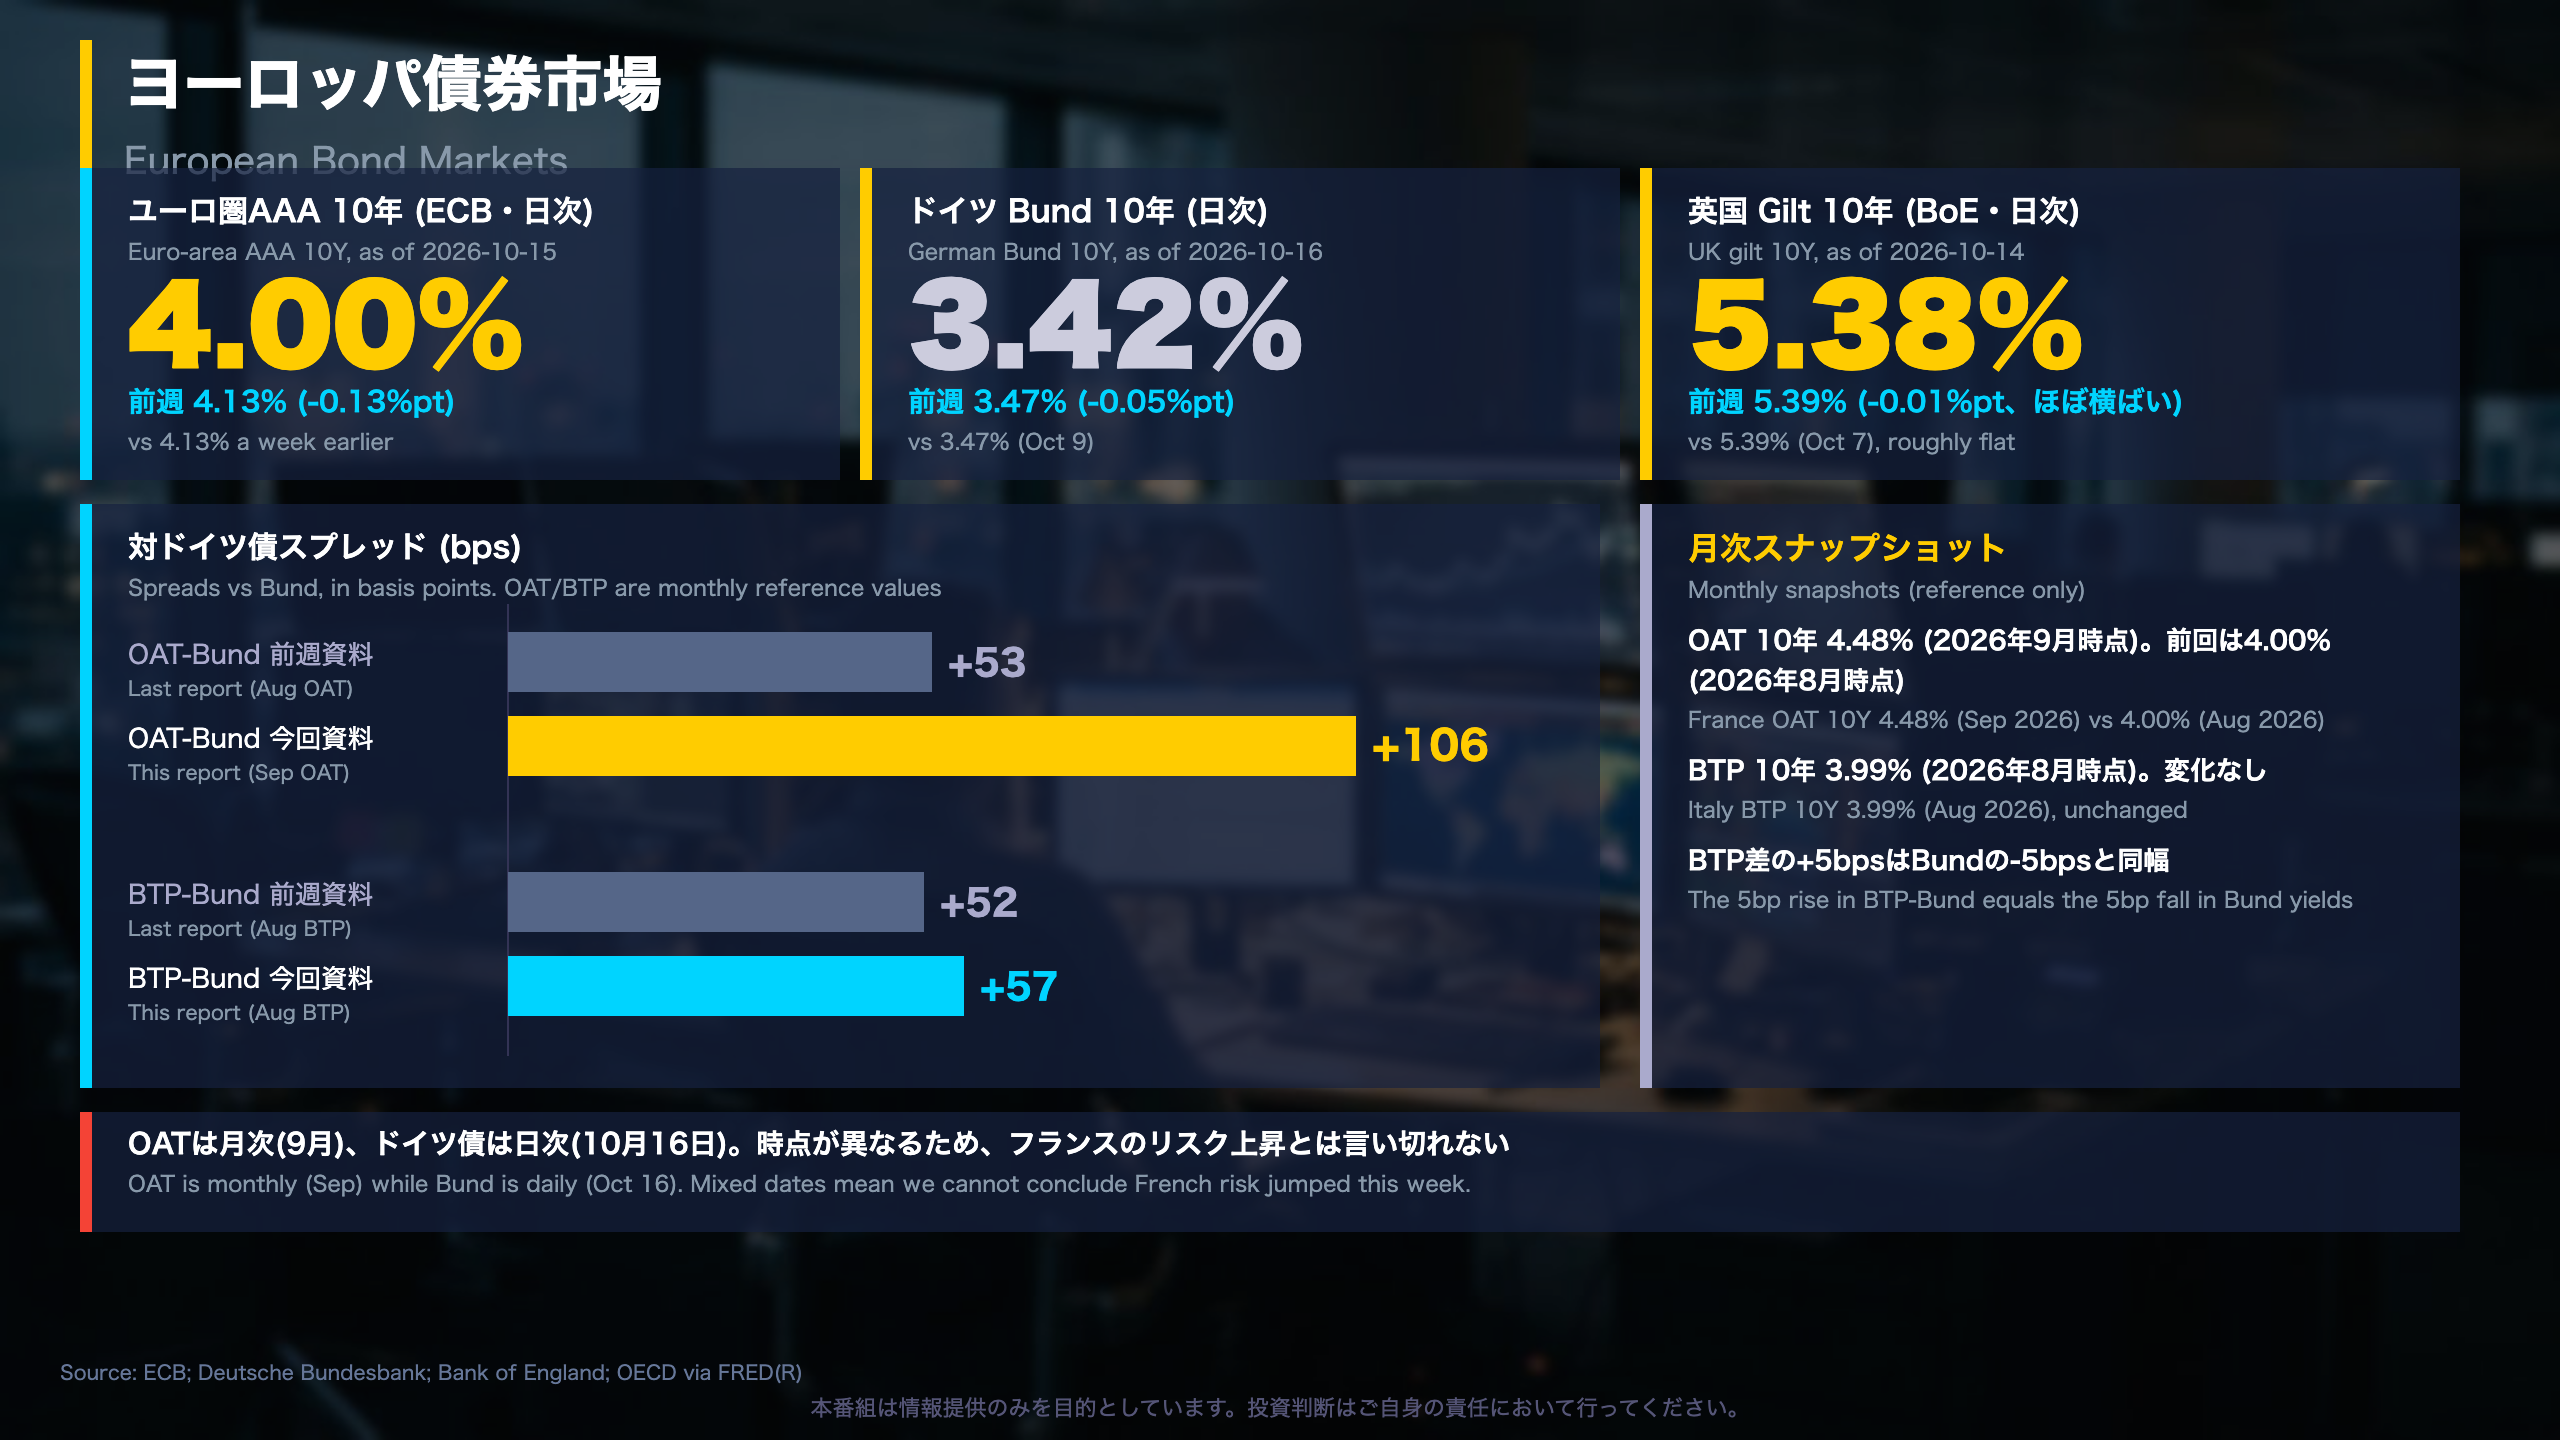
- Euro-area AAA 10Y (ECB, Oct 15): 4.00%, vs 4.13% a week earlier
- German Bund 10Y (Bundesbank, Oct 16): 3.42%, vs 3.47%
- UK gilt 10Y (Bank of England, Oct 14): 5.38%, vs 5.39%
The ECB’s AAA curve is a composite of the highest-rated euro-area issuers, while the Bund is Germany alone, so the two series differ in level and are not interchangeable.
Monthly reference data (OECD via FRED)
| Item | This report | Last report |
|---|---|---|
| France OAT 10Y | 4.48% (Sep 2026) | 4.00% (Aug 2026) |
| OAT-Bund spread | +106bps | +53bps |
| Italy BTP 10Y | 3.99% (Aug 2026) | 3.99% (Aug 2026) |
| BTP-Bund spread | +57bps | +52bps |
The source itself notes that OAT and BTP are monthly figures ‘for reference’.
Why the spread jump is hard to interpret
The OAT moved from an August to a September reading, but the Bund is a daily number from October 16. The apparent 53bp widening therefore mixes different dates. For Italy, the BTP figure is unchanged, and the 5bp rise in the spread equals the 5bp fall in Bund yields.
Two readings
- French fiscal and political risk may indeed be rising, as the spread suggests.
- It may be largely a timing artifact; monthly data cannot settle it.
Why it matters
OAT-Bund and BTP-Bund are watched as gauges of euro-area fragmentation. Compared with US Treasury data, which is daily, European peripherals here are less timely.
What to watch
The next monthly OECD update and daily French data if available.
日本国債・日銀政策金利
JGB Auctions: Stronger Demand Across Maturities
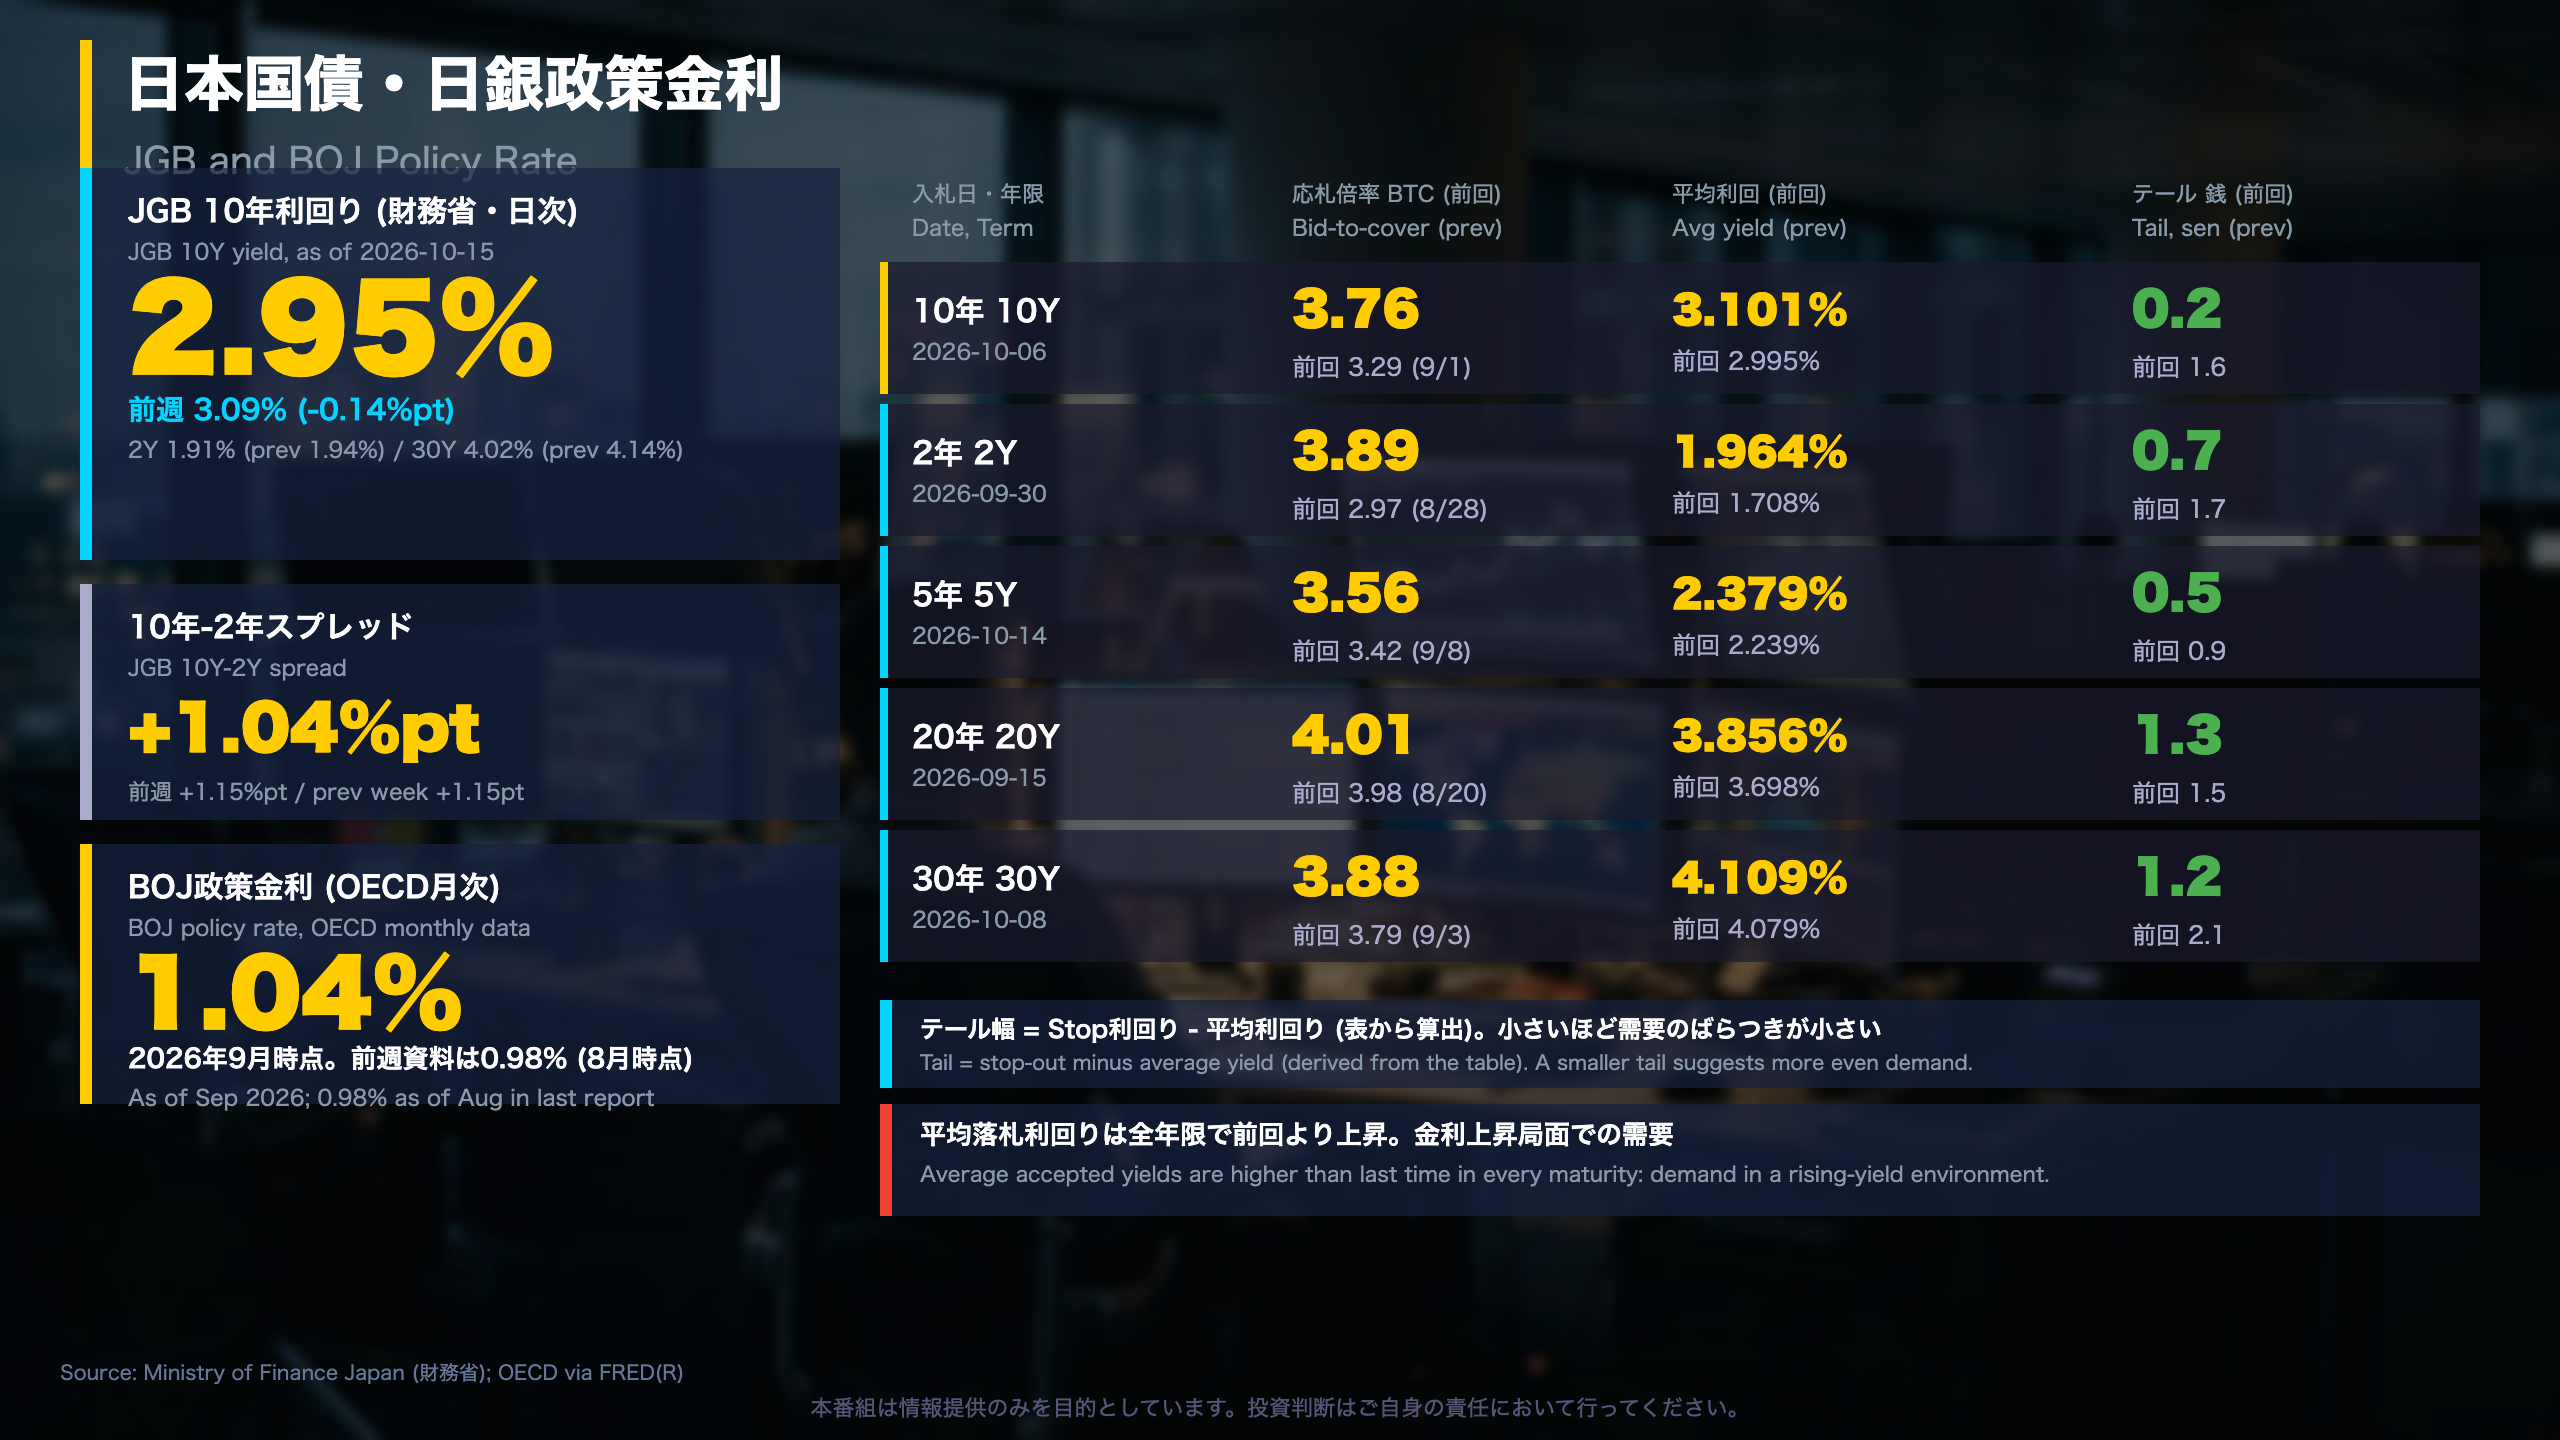
The Ministry of Finance publishes auction results including bid-to-cover (BTC), average and lowest-accepted-price (‘stop’) yields. The ‘tail’ is the stop yield minus the average yield, here derived from the table; a smaller tail suggests more even demand. Compared with the previous auction of each maturity:
| Date | Term | BTC (prev) | Avg yield (prev) | Tail, sen (prev) |
|---|---|---|---|---|
| Oct 6 | 10Y | 3.76 (3.29) | 3.101% (2.995%) | 0.2 (1.6) |
| Oct 14 | 5Y | 3.56 (3.42) | 2.379% (2.239%) | 0.5 (0.9) |
| Oct 8 | 30Y | 3.88 (3.79) | 4.109% (4.079%) | 1.2 (2.1) |
| Sep 30 | 2Y | 3.89 (2.97) | 1.964% (1.708%) | 0.7 (1.7) |
| Sep 15 | 20Y | 4.01 (3.98) | 3.856% (3.698%) | 1.3 (1.5) |
Time-series context
The 10-year BTC rose from 2.56 on Aug 4 to 3.29 on Sep 1 and 3.76 on Oct 6, with applications climbing from 5.06 to 7.40 trillion yen.
Curve and policy rate
The 10-year JGB yield was 2.95% (prev 3.09%), the 2-year 1.91%, and the 30-year 4.02%. The 10s-2s spread narrowed to +1.04 points from +1.15. The BOJ policy rate was 1.04% as of September per OECD monthly data, up from 0.98% in August. The BOJ is the Bank of Japan, Japan’s central bank; unlike the Fed, the data here are monthly and lagged.
Two readings
- Several maturities show higher BTC and narrower tails simultaneously, which suggests resilient demand.
- Every average yield is above the prior auction, so demand is being met at higher yields.
What to watch
Whether BTC holds near current levels at the next auctions and tails stay narrow. Compared with US auctions, JGB results here include tail data that help judge distribution of bids.
FX・CFDへの含意 NFC HMMと金利差
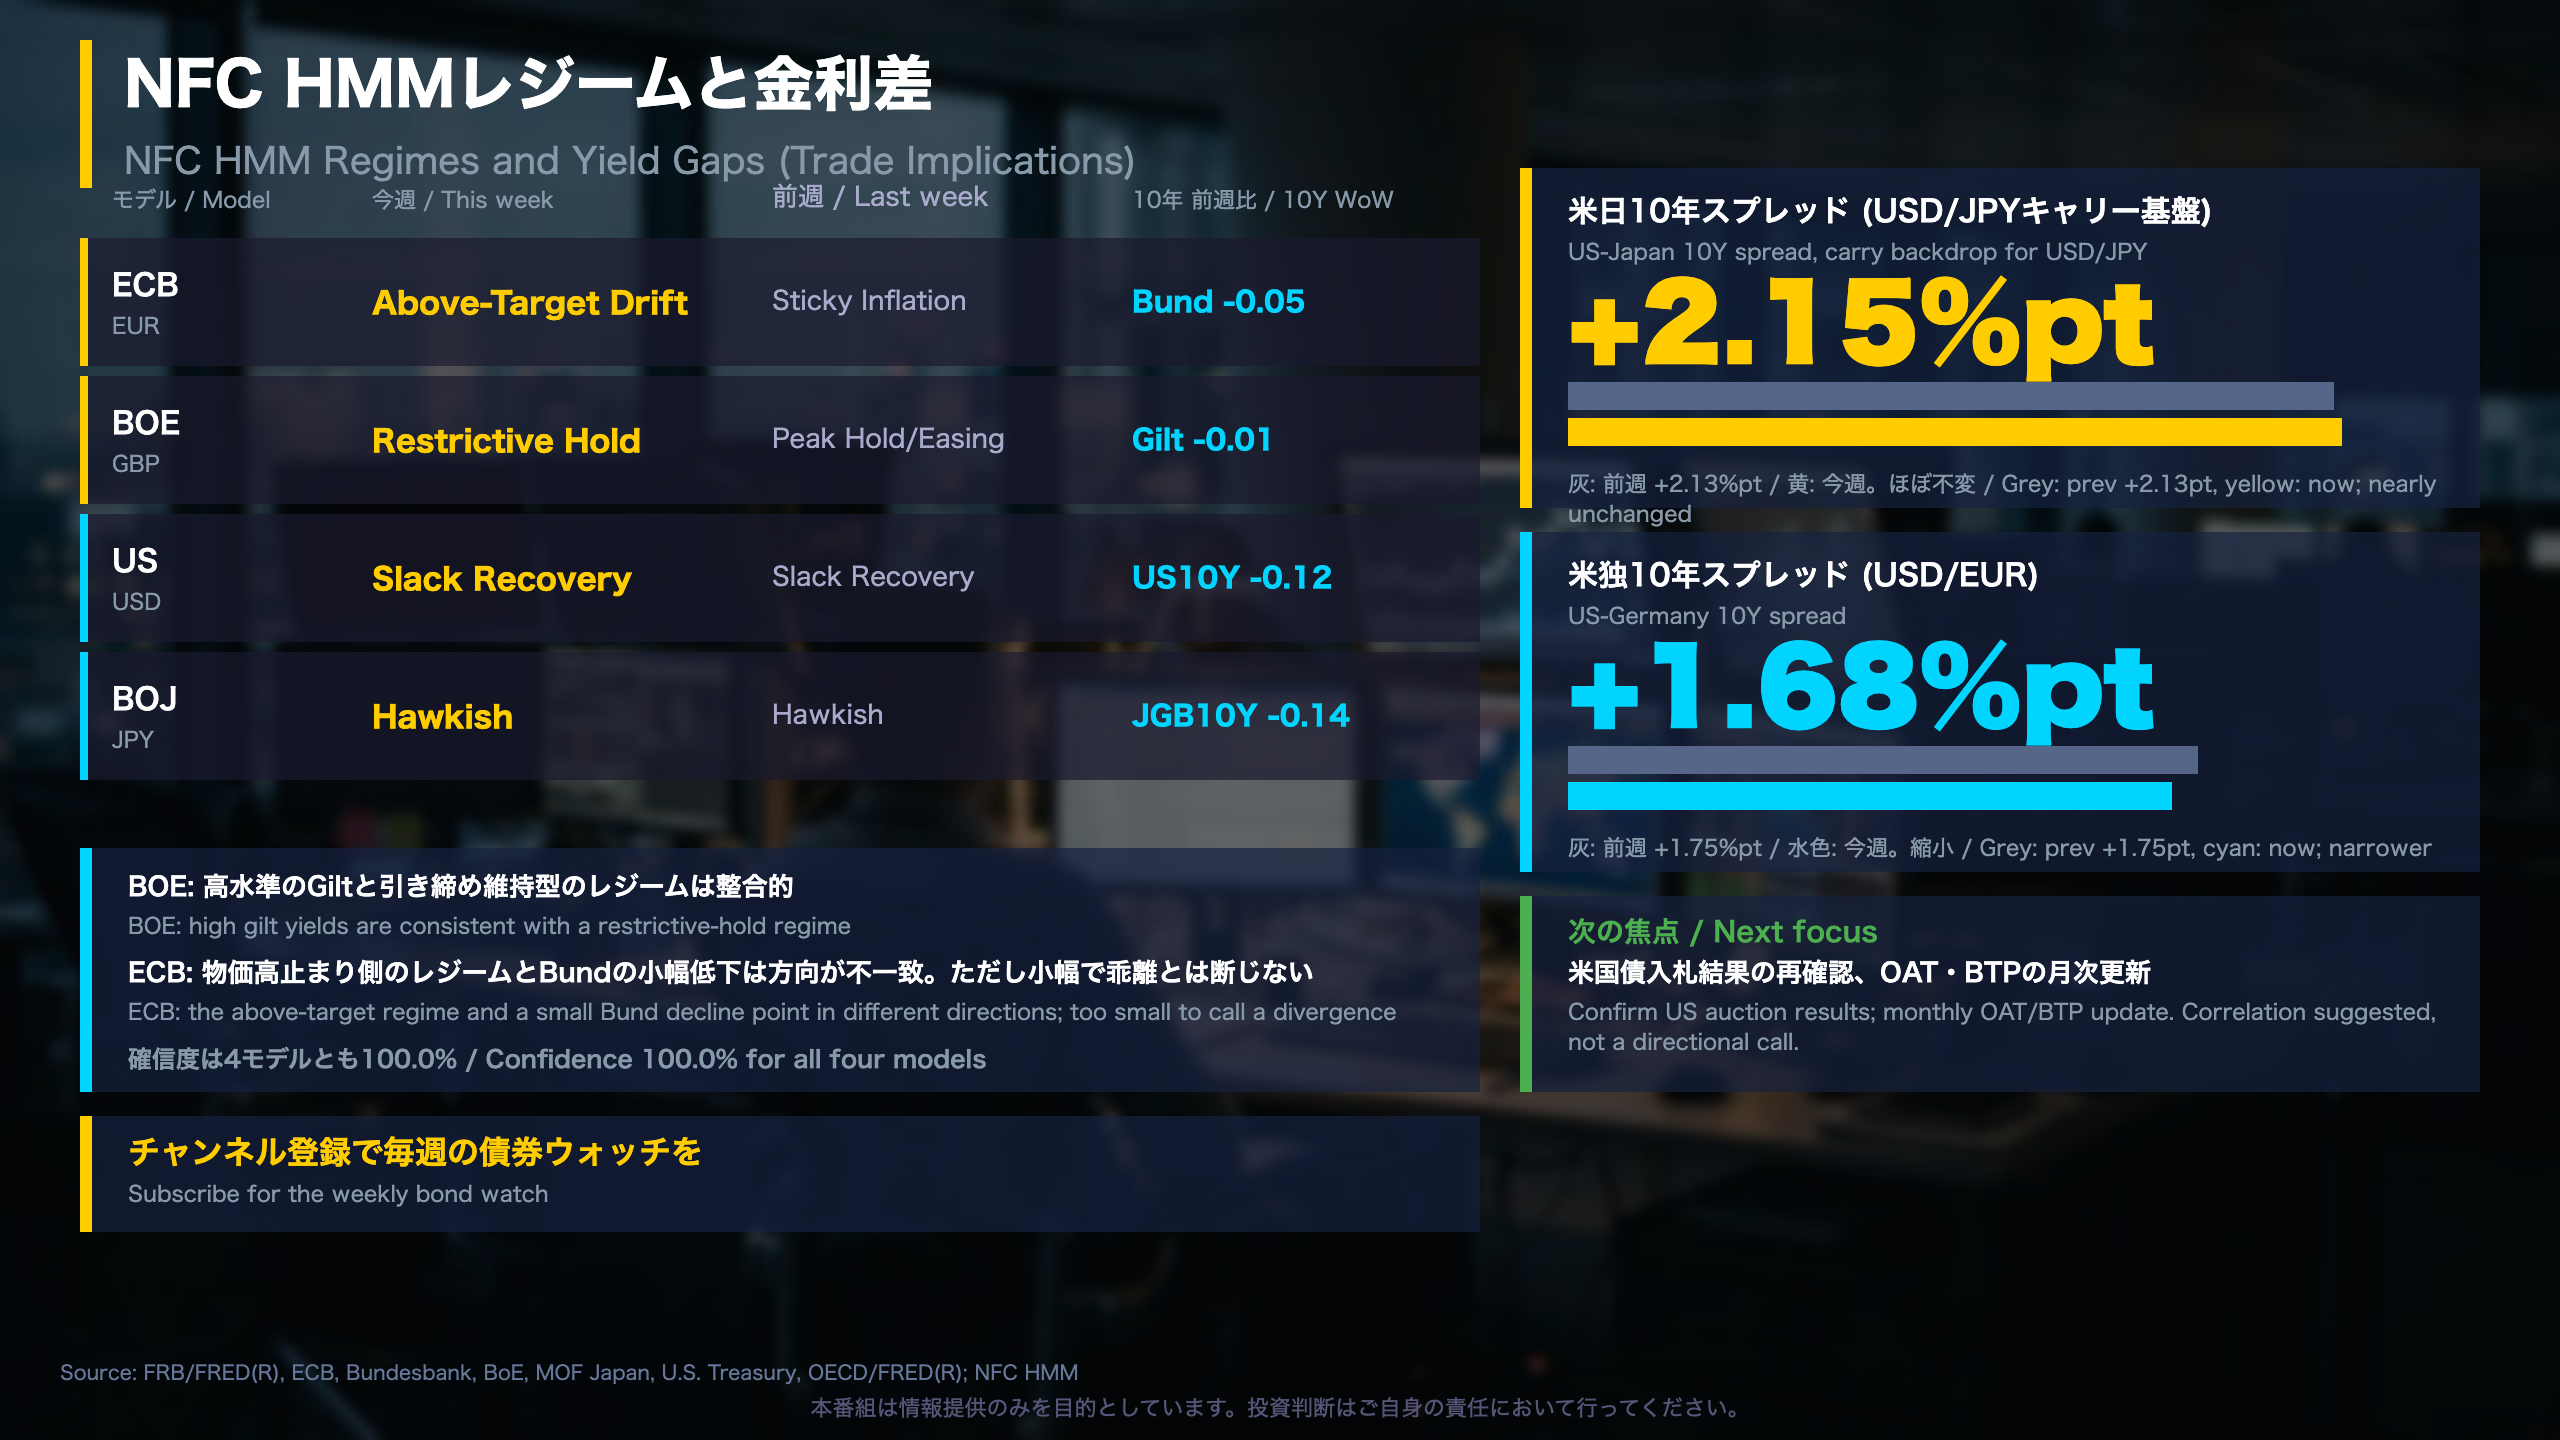
NFC HMM Regimes and Yield Gaps: Separating Consistency from Divergence
NFC’s HMM (hidden Markov model) classifies each central bank’s policy phase. All four models report 100.0% confidence.
| Model | This week | Last week | 10Y yield, WoW |
|---|---|---|---|
| ECB (EUR) | Above-Target Drift | Sticky Inflation | Bund -0.05 |
| BOE (GBP) | Restrictive Hold | Peak Hold/Easing | Gilt -0.01 |
| US (USD) | Slack Recovery | Slack Recovery | US 10Y -0.12 |
| BOJ (JPY) | Hawkish | Hawkish | JGB 10Y -0.14 |
Consistent or not?
- UK: gilt yields at 5.38% sit comfortably with a restrictive-hold label.
- Euro area: an inflation-above-target regime alongside a small Bund decline points in different directions. At 5 basis points, though, the move is too small to call a divergence.
Yield gaps
The US-Japan 10-year gap was +2.15 points (prev +2.13) and the US-Germany gap +1.68 (prev +1.75). A wide US-Japan gap is often associated with USD/JPY carry conditions; the data suggest a link but do not establish direction. The BOJ is the Bank of Japan, and its policy rate rose from 0.98% to 1.04% in monthly OECD data, a counterweight to a simple carry story. The Fed, ECB and BOE comparisons here use different observation dates (Oct 14-16).
Two readings
- A persistent US-Japan gap may remain a supportive factor for the pair.
- A hawkish BOJ and a narrowing US-Germany gap are developments that could point the other way.
What to watch
Restoration of US auction data, the next monthly OAT/BTP update, and whether regimes persist. This is not a directional call.
Disclaimer: This article is for informational purposes only. All investment decisions are made solely at your own risk.