📺 Watch the Full Video Analysis
This article was automatically generated by the NFC Market Live AI analysis system. (Updated: 2026-06-25 05:12 JST)
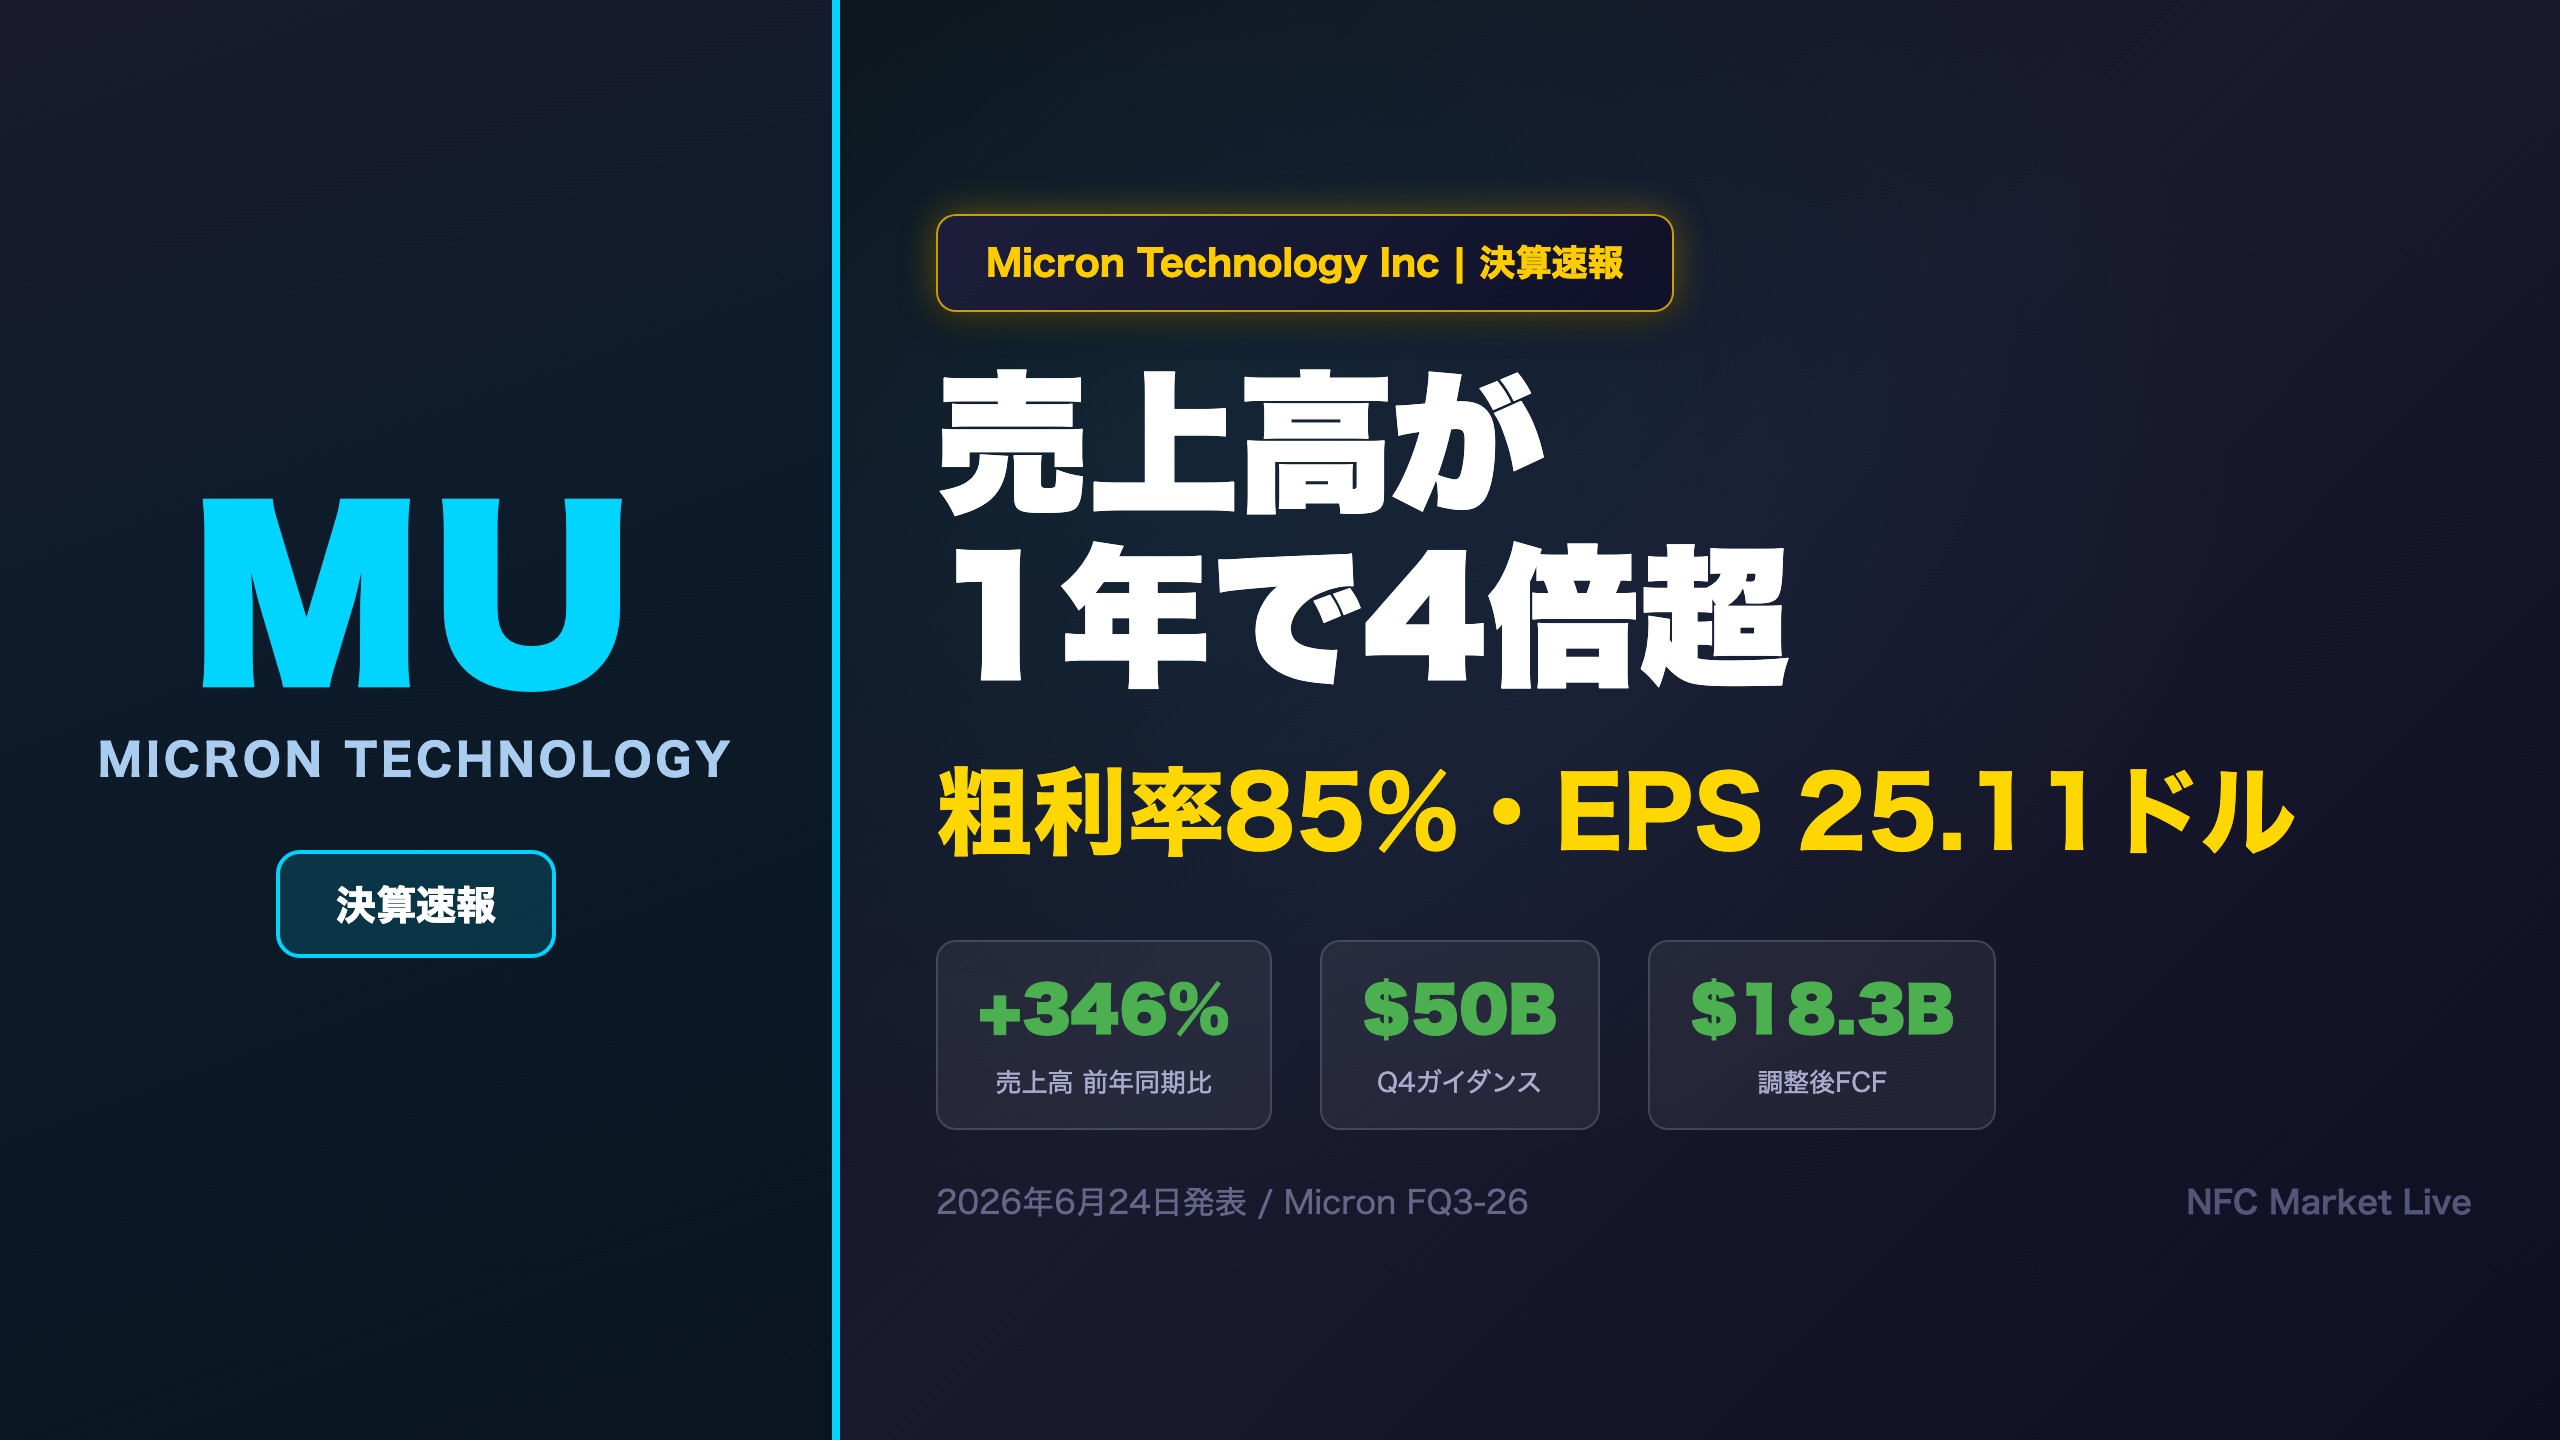
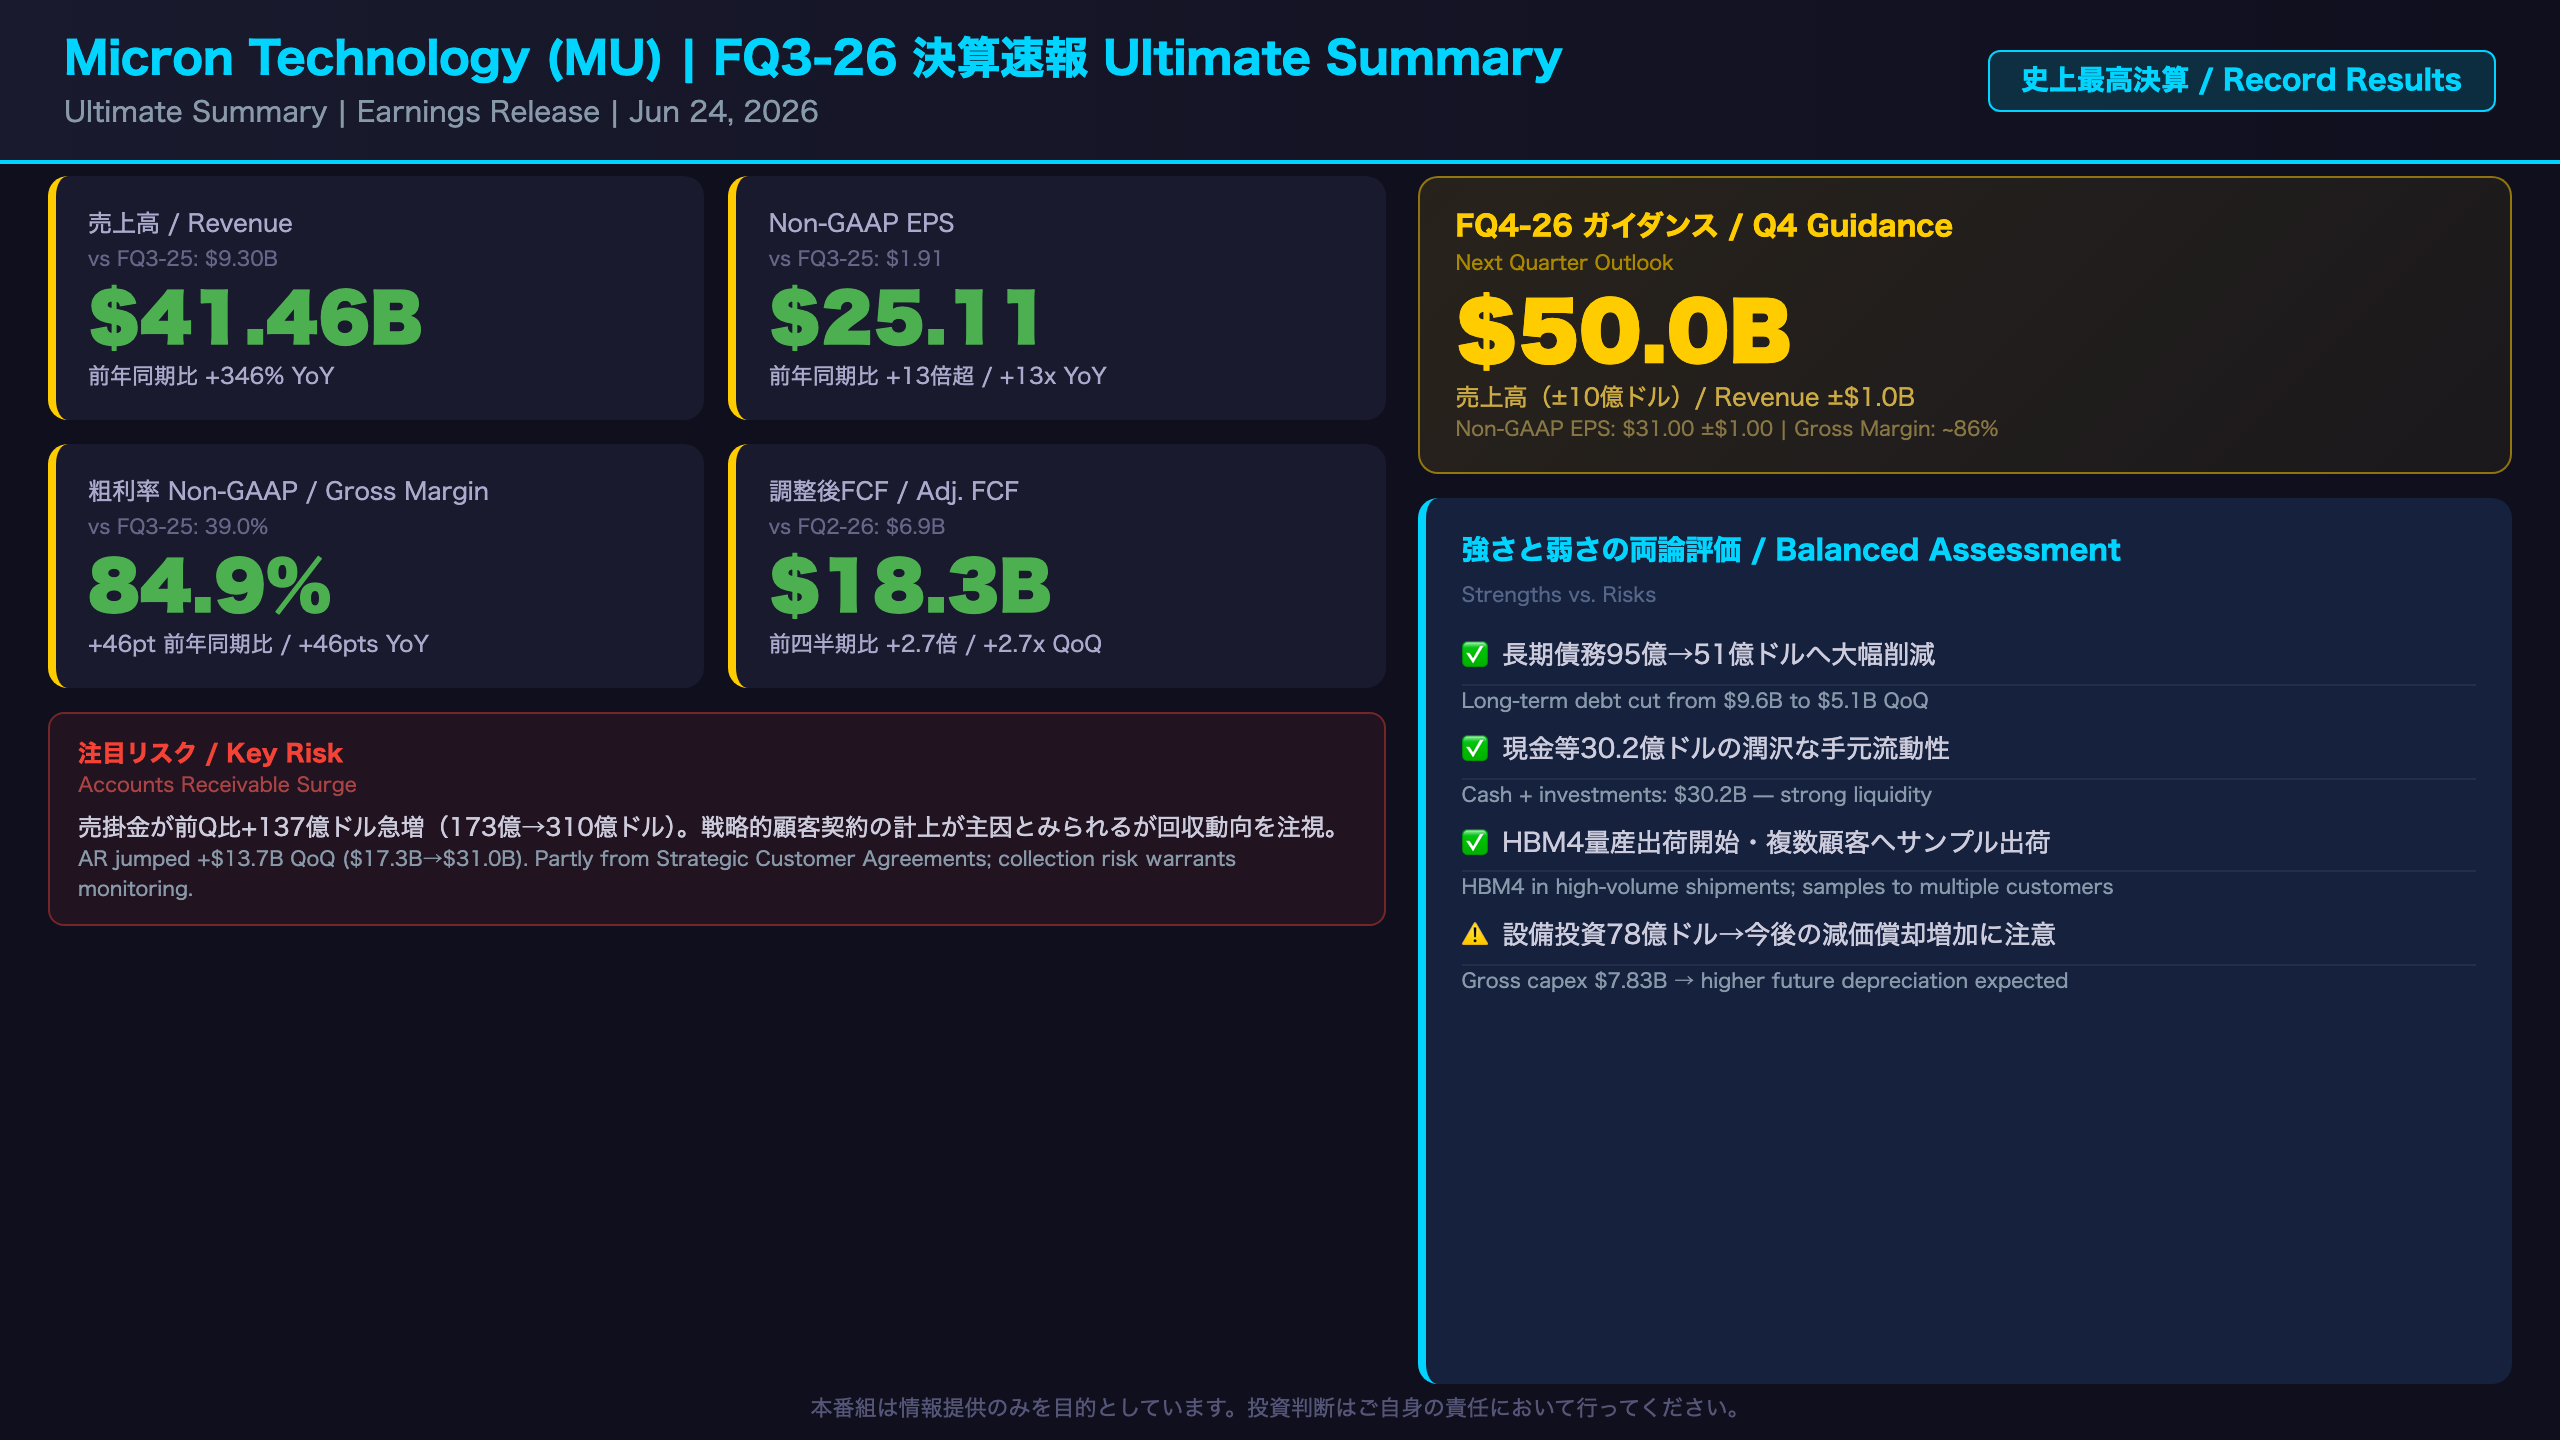
Micron Technology (MU) reported record-shattering FQ3-26 results: revenue of $41.46B (+346% YoY), Non-GAAP EPS of $25.11 (vs $1.91 a year ago), and a gross margin of 84.9%. Q4 guidance of $50B revenue and $31.00 Non-GAAP EPS signals the AI memory supercycle is accelerating. This deep dive covers all four business units, the HBM4 ramp, Strategic Customer Agreements, and what it all means for semiconductor investors.
Ultimate Summary:史上最高決算の全体像
FQ3-26 Earnings: A Structural Transformation in Numbers
Context: What Is Micron?
Micron Technology (Nasdaq: MU) is one of the world’s three major DRAM manufacturers, alongside South Korea’s Samsung Electronics and SK Hynix. The company also produces NAND flash storage. Micron’s fiscal year ends in late August, making FQ3-26 the quarter ending May 28, 2026.
Scale of the Beat: Historical Perspective
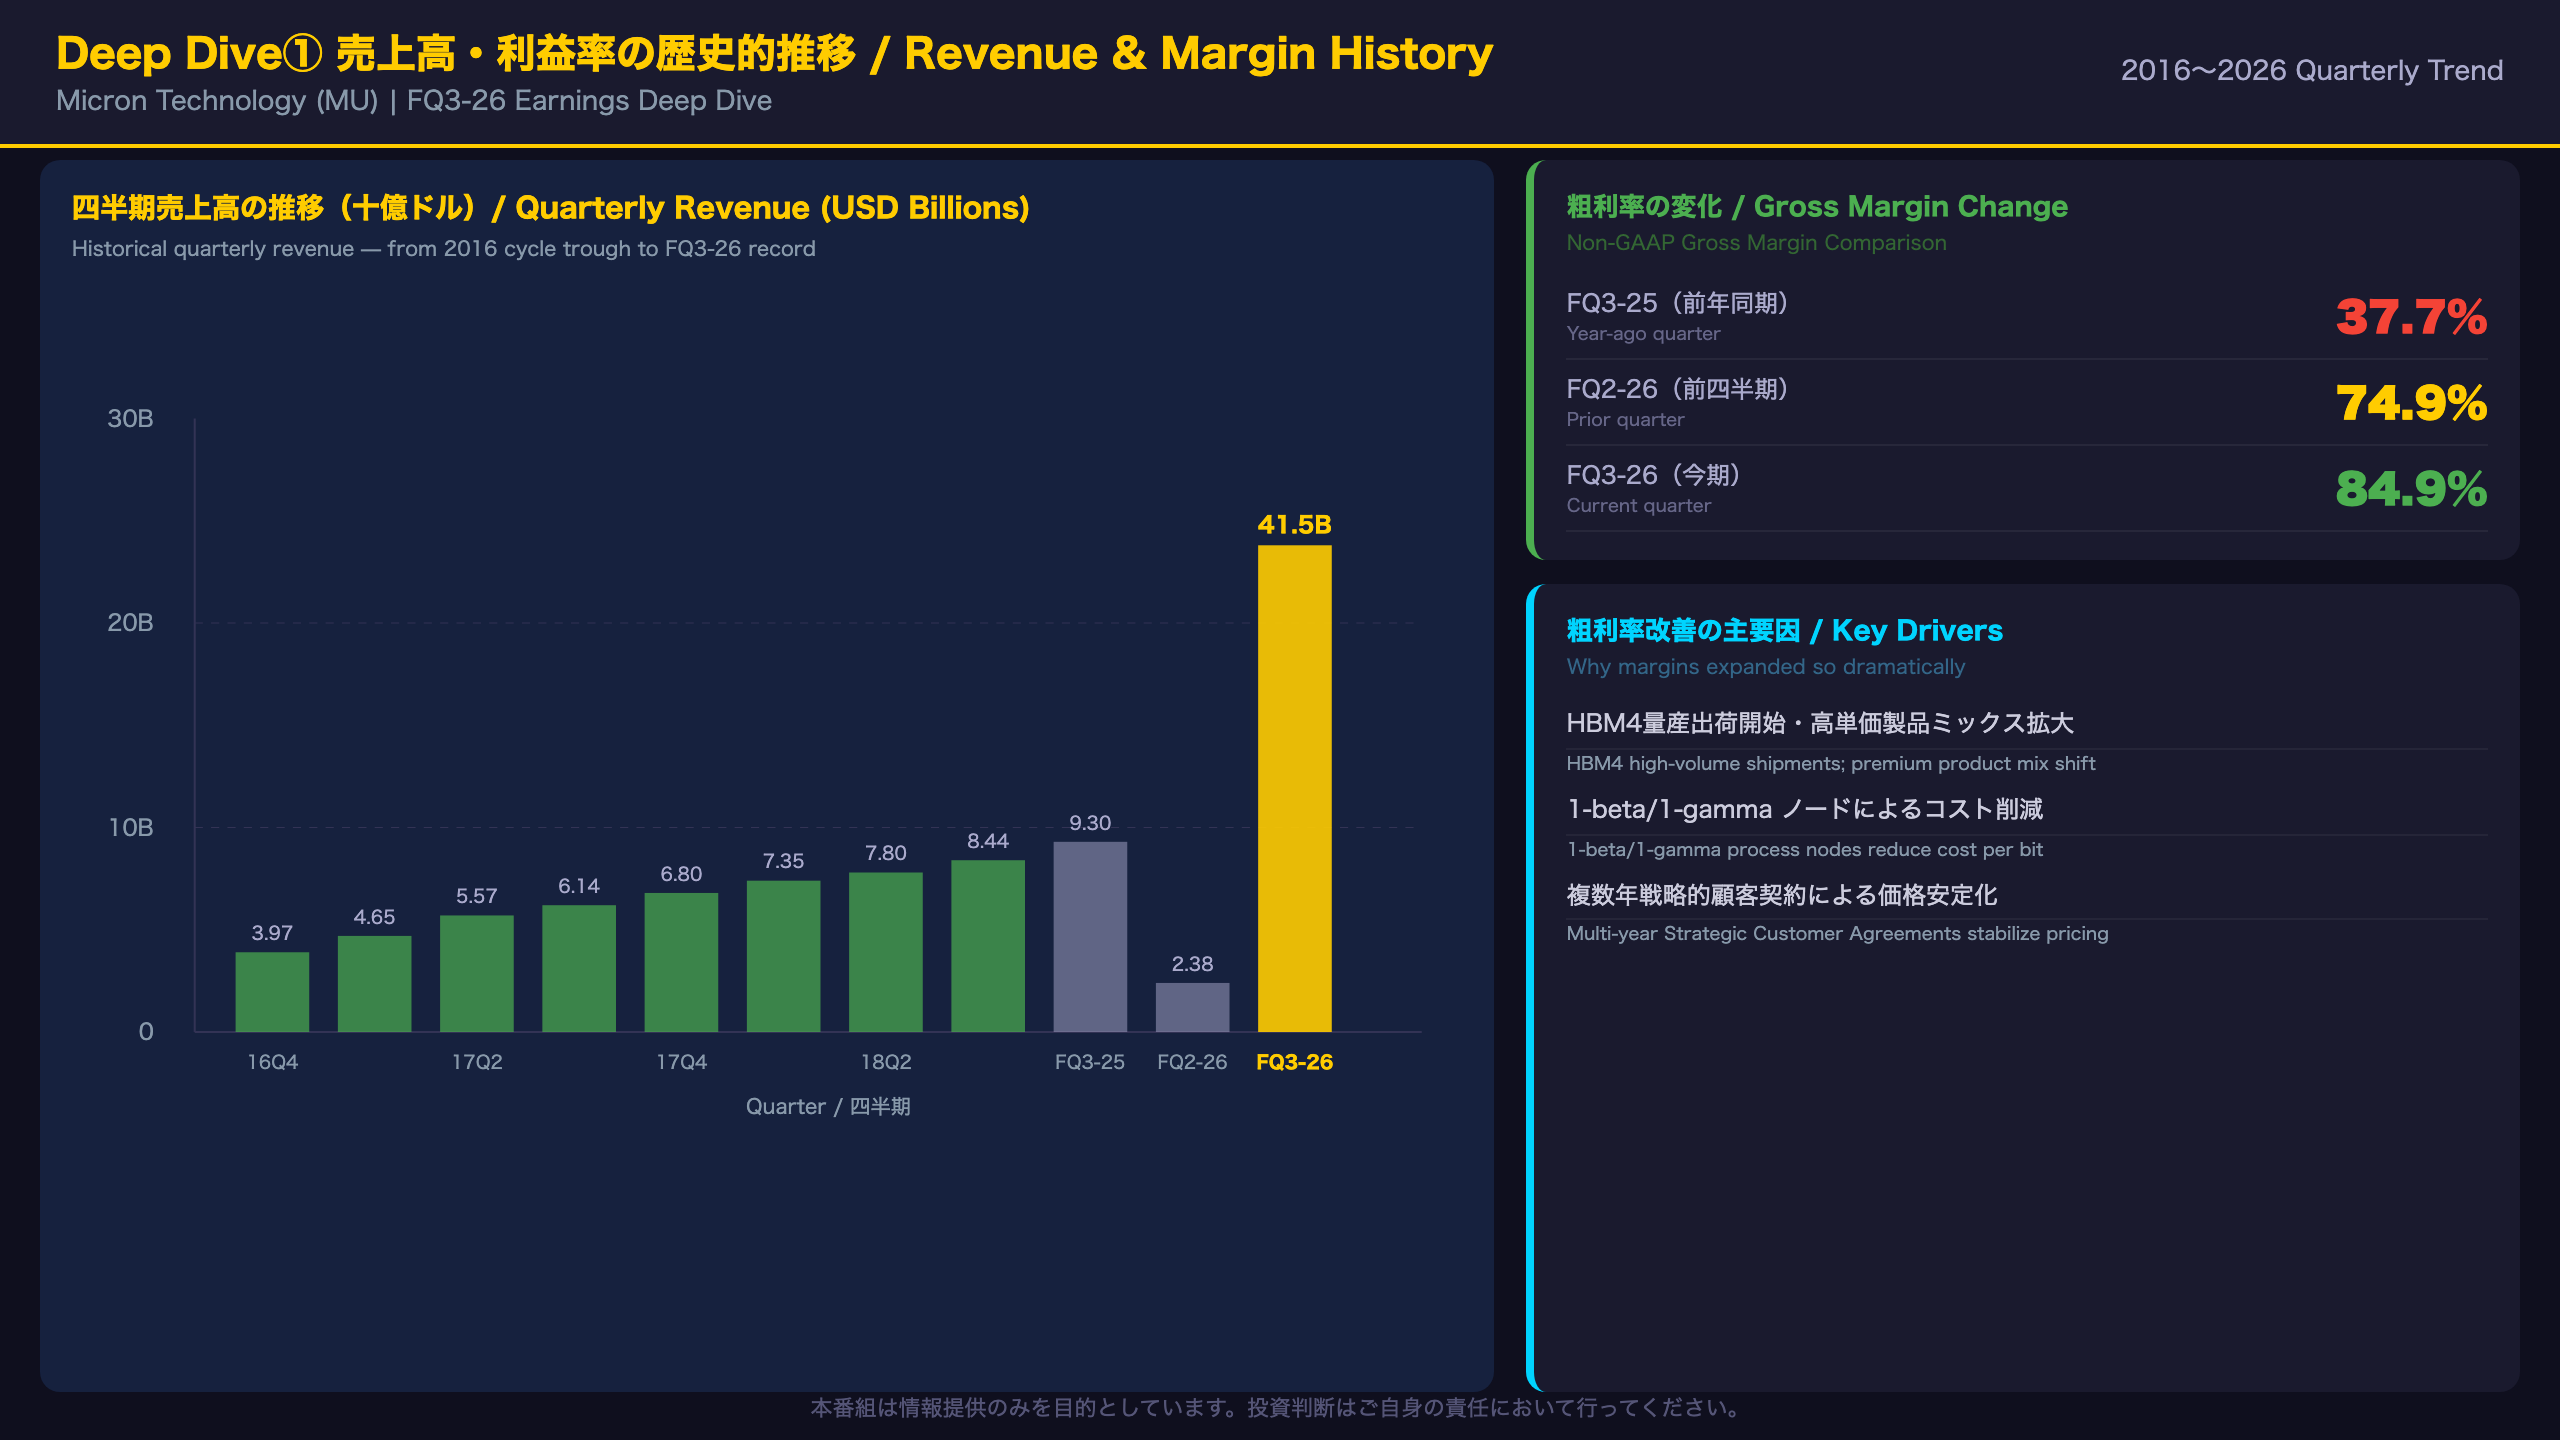
Comparing today’s results to Micron’s own XBRL history is striking. At the peak of the 2018 memory supercycle, Micron’s quarterly revenue reached approximately 8.4 billion dollars. The FQ3-26 figure of 41.46 billion dollars is roughly 5x that prior peak — suggesting this is not a cyclical recovery but a structural step-change driven by AI infrastructure buildout.
Gross Margin at 85%: What It Means
A Non-GAAP gross margin of 84.9% is extraordinary for a memory company. Traditional DRAM/NAND margins typically range from 30% to 60% through the cycle. The near-doubling from 39.0% a year ago reflects:
– Product mix shift toward High Bandwidth Memory (HBM) and high-capacity server DIMMs, which command significant pricing premiums
– Cost structure improvement as newer process nodes (1-beta, 1-gamma DRAM) reduce cost per bit
– Pricing power from constrained supply of leading-edge HBM capacity
Balanced Assessment
Strengths:
– Revenue of $41.46B (+346% YoY); nine-month cumulative revenue of $78.96B vs $26.06B prior year
– Adjusted FCF of $18.3B after $7.1B net capex — exceptional cash generation
– Long-term debt reduced from $9.56B to $5.14B QoQ; balance sheet rapidly strengthening
– Cash + investments + restricted cash of $30.2B provides substantial strategic flexibility
Risks and Cautions:
– Accounts receivable surged from $17.3B to $31.0B QoQ (+$13.7B). Management attributes this partly to new multi-year Strategic Customer Agreements. While strategically positive, the collection timeline and counterparty concentration deserve scrutiny
– Gross capex of $7.83B (up from $6.39B last quarter) will translate into higher depreciation in coming quarters, potentially pressuring future margins
– Other non-operating expense of -$321M (vs -$98M last quarter) warrants further disclosure review
Forward Guidance vs. Consensus
Q4 guidance of $50.0B revenue (±$1.0B) and Non-GAAP EPS of $31.00 (±$1.00) implies ~21% sequential revenue growth and ~23% sequential EPS growth. If achieved, full-year FY2026 revenue would exceed $129B — a figure that would have seemed impossible just 18 months ago.
Deep Dive①:売上高・利益率の歴史的推移
Revenue and Margin History: Decoding the “5x” Milestone
Putting FQ3-26 in Historical Context
Micron’s quarterly revenue history from XBRL data tells a compelling story of structural change:
| Period | Quarterly Revenue | Notes |
|---|---|---|
| Dec 2016 | $3.97B | Post-downturn recovery |
| Aug 2018 (prior peak) | $8.44B | 2018 memory supercycle |
| FQ3-25 (1 year ago) | $9.30B | Early AI ramp |
| FQ3-26 (today) | $41.46B | AI memory supercycle |
The 2018 “memory bubble” was driven by smartphone and PC DRAM shortages. Today’s revenue is 5x that prior peak — suggesting a fundamentally different demand structure rooted in AI infrastructure investment.
Why Gross Margins Reached 85%
The jump from 37.7% to 84.9% gross margin in one year reflects three structural drivers:
- HBM product mix: High Bandwidth Memory for AI accelerators (NVIDIA, AMD, custom ASICs) commands prices several times higher than standard DDR5 DRAM. HBM4 is now in high-volume shipments for Micron’s lead customer.
- Process node advancement: The transition to 1-beta and 1-gamma DRAM nodes increases bits per wafer, reducing cost per gigabyte significantly.
- Strategic Customer Agreements: Multi-year contracts with major hyperscalers likely provide pricing stability and reduce the commodity-like volatility historically associated with memory.
The Counterargument
Sustainability of 85% gross margins is not guaranteed. SK Hynix is aggressively expanding HBM3E capacity, and Samsung is working to improve HBM yields. If leading-edge HBM supply increases materially in 2027, pricing pressure could emerge. The current margin level reflects a supply-constrained environment that may not persist indefinitely.
Nine-Month Cumulative View
For the nine months ended May 28, 2026, Micron generated $78.96B in revenue versus $26.06B in the prior-year period — a 203% increase. If Q4 guidance of $50B is achieved, full-year FY2026 revenue would reach approximately $129B, a figure that would have been unimaginable just two years ago.
Deep Dive②:4セグメント徹底比較
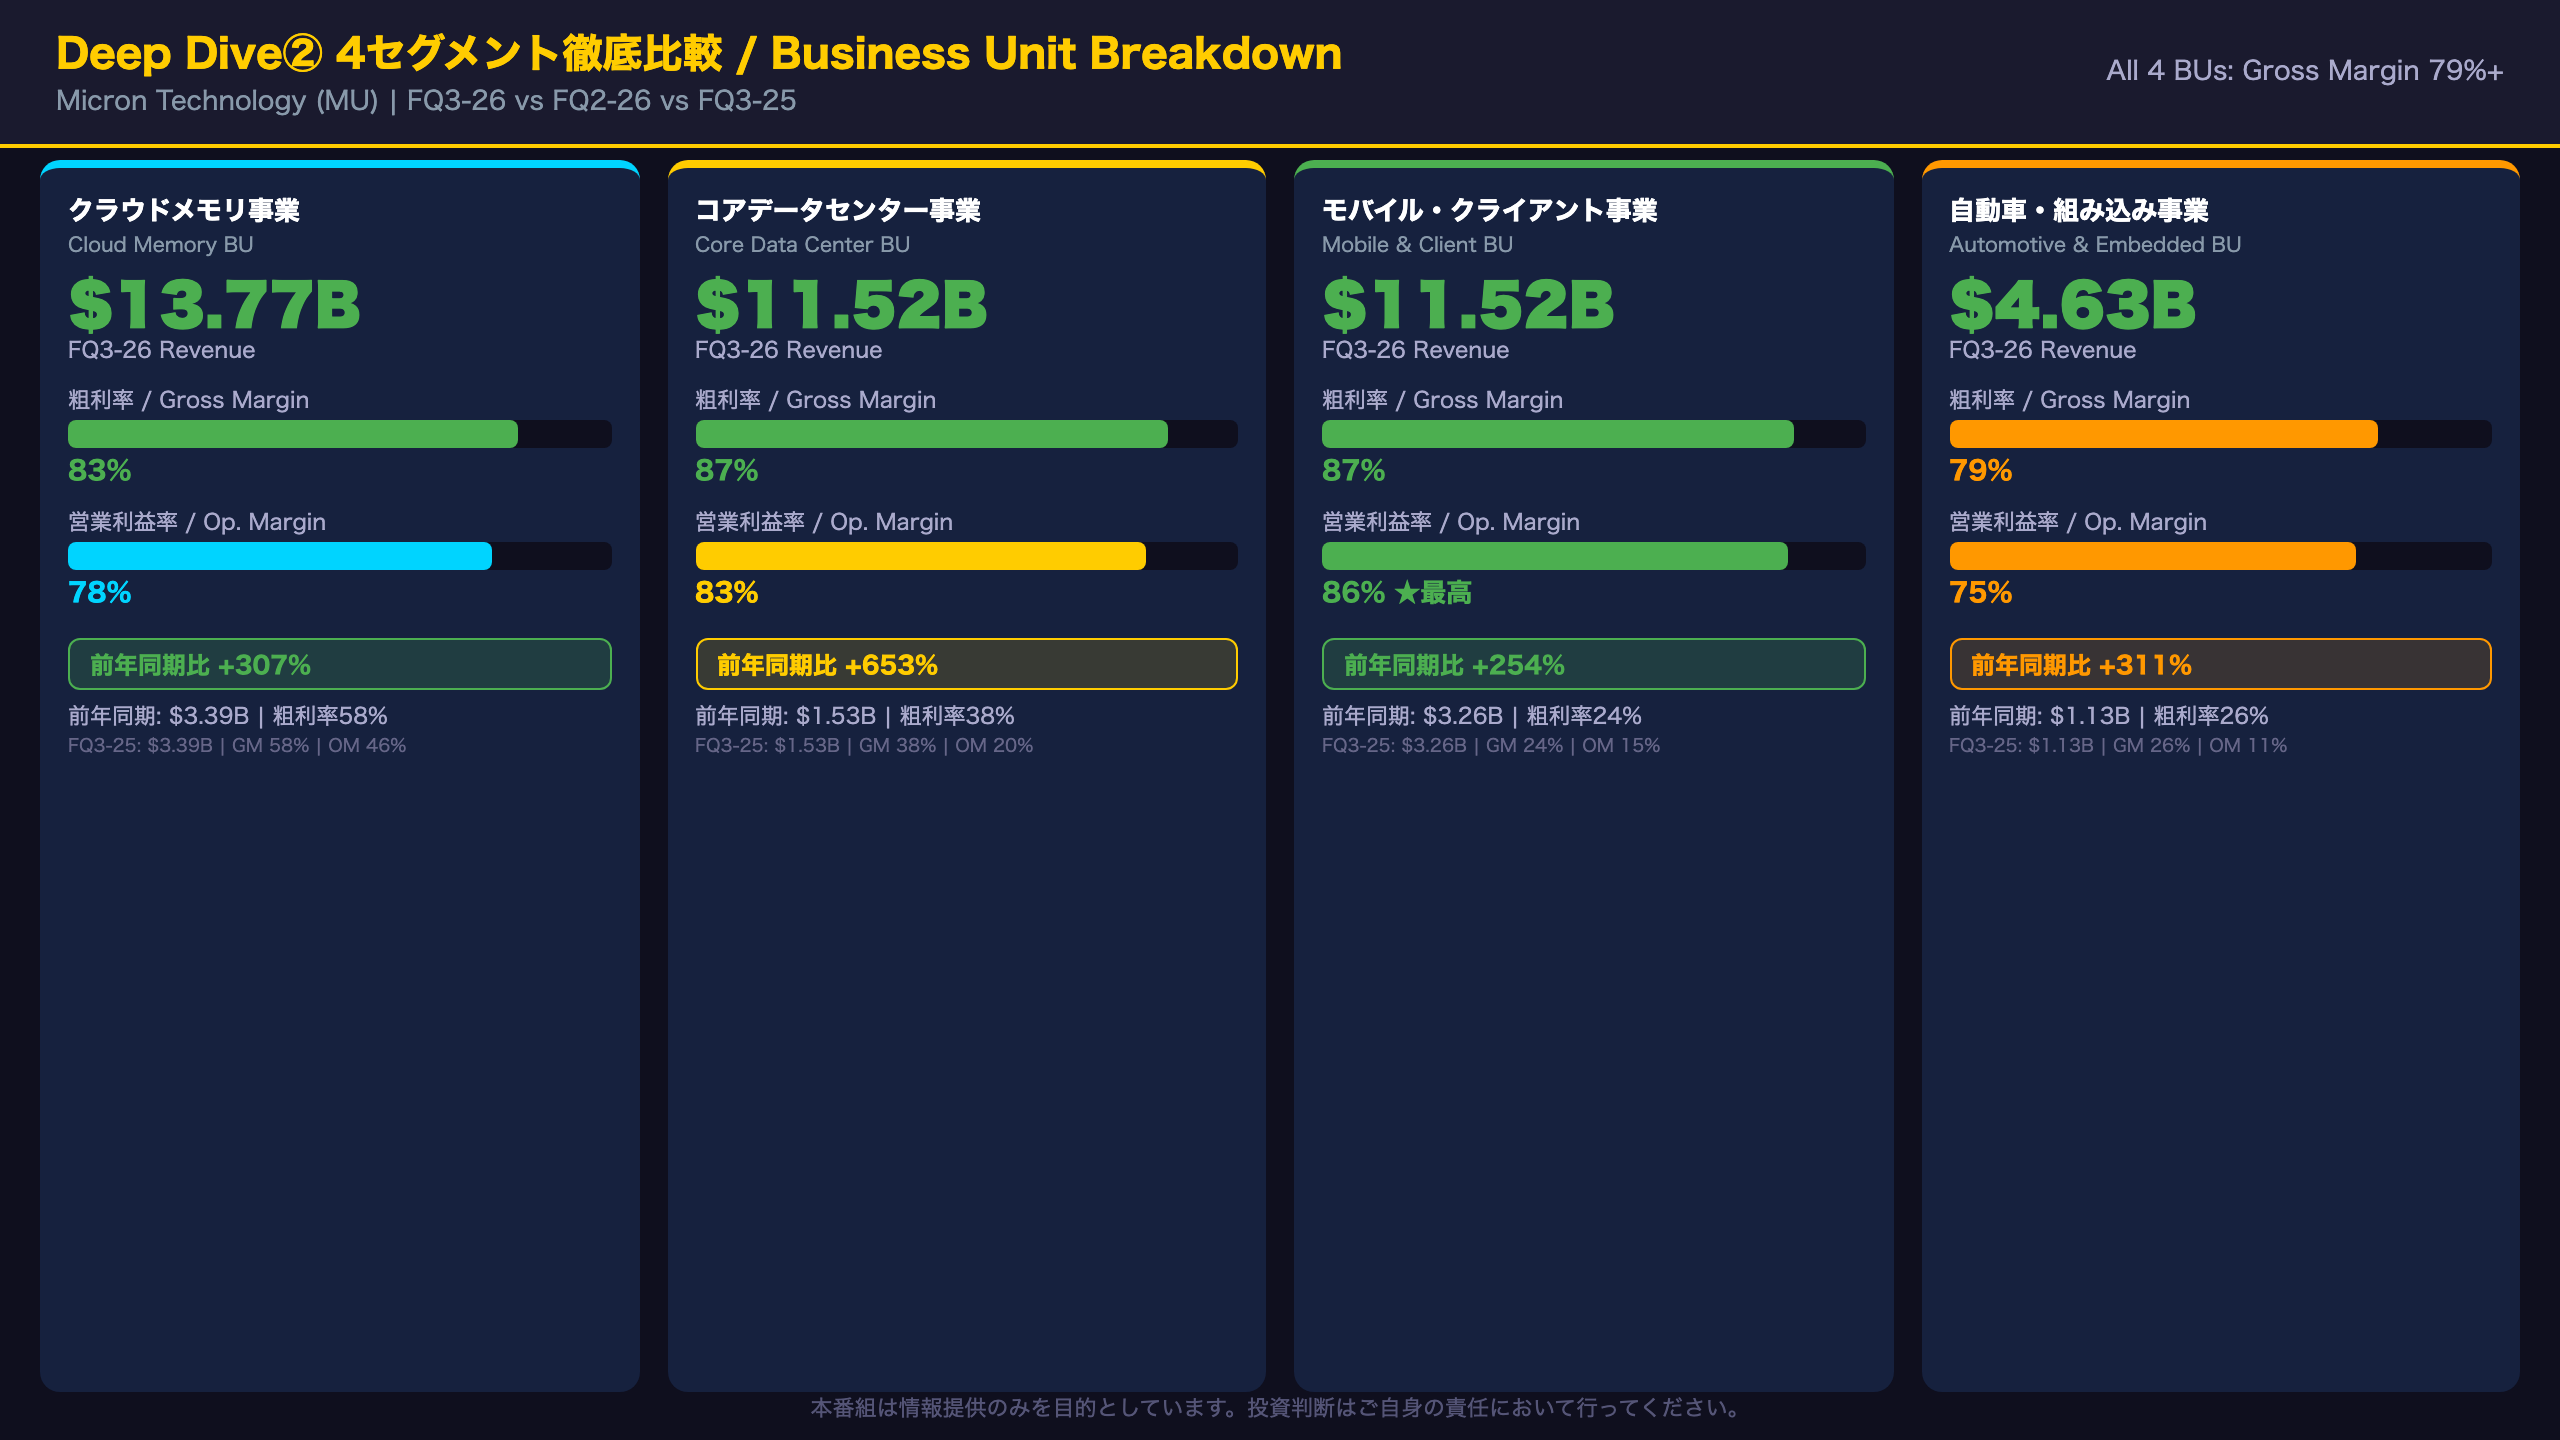
Four-Segment Deep Dive: Strengths and Challenges
Segment Performance Overview
| Segment | FQ3-26 Revenue | YoY Growth | Gross Margin | Operating Margin |
|---|---|---|---|---|
| Cloud Memory | $13.77B | +307% | 83% | 78% |
| Core Data Center | $11.52B | +653% | 87% | 83% |
| Mobile & Client | $11.52B | +254% | 87% | 86% |
| Automotive & Embedded | $4.63B | +311% | 79% | 75% |
Fastest-Growing Segment: Core Data Center
The Core Data Center Business Unit grew 653% year-over-year — from $1.53B to $11.52B — the highest growth rate among all segments. This reflects explosive demand for AI server memory, including high-capacity 256GB DDR5 RDIMMs (qualification samples shipped to key server ecosystem enablers) and HBM. An 83% operating margin signals exceptional pricing power and product differentiation.
Surprising Outperformer: Mobile and Client
The Mobile and Client segment achieved an 86% operating margin — the highest of all four segments — up from just 15% a year ago. This 71-percentage-point improvement reflects the ramp of LP5X SOCAMM2 products and the high-volume production start of 1-gamma 16Gb LPDDR5X at a leading smartphone OEM. This suggests smartphone memory is transitioning from a commodity to a premium, differentiated product category.
Automotive and Embedded: Small but Growing
At $4.63B, Automotive and Embedded is the smallest segment, but its 311% YoY growth and 75% operating margin are impressive. Key milestones include 1-gamma LPDDR5 reaching automotive product readiness and first 1-gamma DDR5 samples shipped to a robotaxi customer. The automotive design cycle is long (typically 3-5 years from sample to volume production), so near-term revenue contribution will remain limited relative to data center segments.
Concentration Risk
The two data center segments (Cloud Memory + Core Data Center) combined for $25.29B in revenue, representing 61% of total company revenue. While this reflects the strength of AI infrastructure demand, it also means Micron’s results are meaningfully exposed to any slowdown in hyperscaler capital expenditure cycles.
Deep Dive③:キャッシュフロー・バランスシートの強化
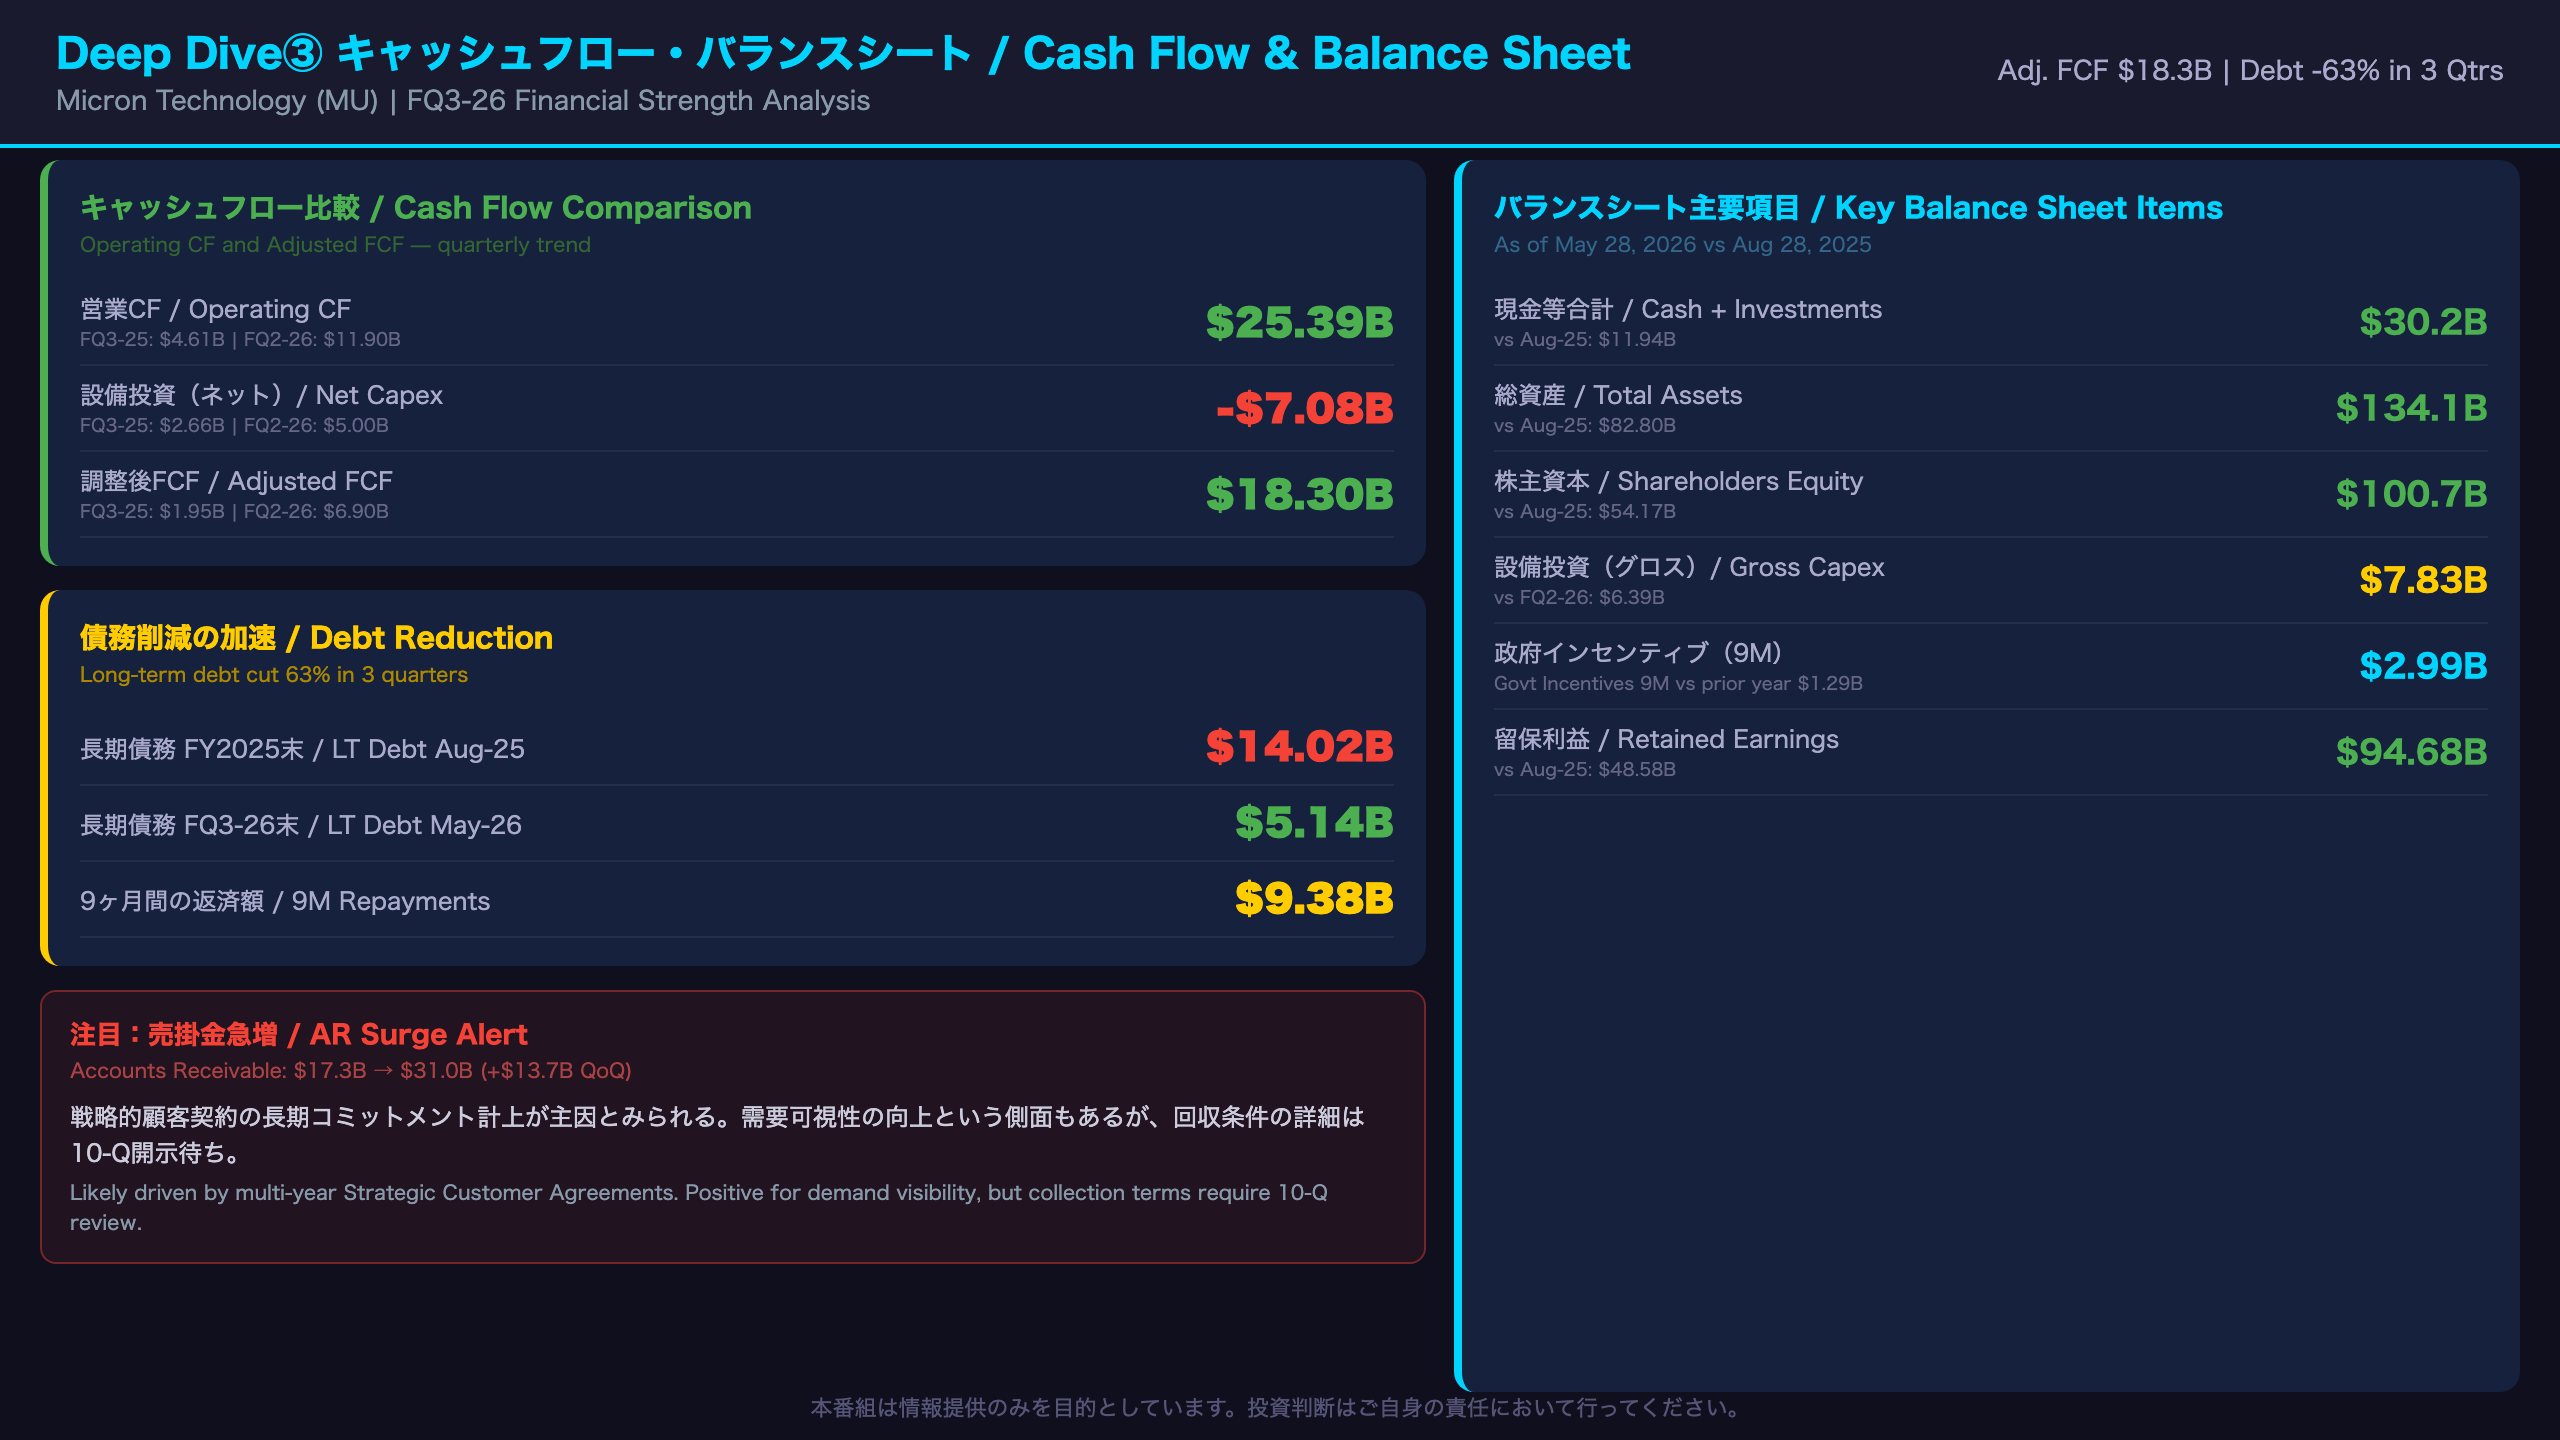
Cash Flow and Balance Sheet: Rapid Financial Strengthening
Free Cash Flow Explosion
| Metric | FQ3-26 | FQ2-26 | FQ3-25 |
|---|---|---|---|
| Operating CF | $25.39B | $11.90B | $4.61B |
| Net Capex | $7.08B | $5.00B | $2.66B |
| Adjusted FCF | $18.30B | $6.90B | $1.95B |
Adjusted FCF of $18.3B — after $7.1B in net capital expenditures — demonstrates that Micron has entered a phase where it can simultaneously invest at record levels and generate substantial cash. This is a qualitative shift from the capital-intensive, low-margin memory business of prior cycles.
Aggressive Debt Reduction
Micron repaid $9.38B in debt over the nine-month period ended May 28, 2026. Long-term debt fell from $14.02B at the end of FY2025 (August 2025) to $5.14B — a 63% reduction in just three quarters. Interest expense, which was $123M in FQ3-25, dropped to zero in FQ3-26. This deleveraging significantly reduces financial risk and increases strategic flexibility.
Interpreting the Receivables Surge
Accounts receivable jumped from $17.3B to $31.0B quarter-over-quarter (+$13.7B). At first glance, this appears concerning. However, CEO Sanjay Mehrotra specifically highlighted “multi-year Strategic Customer Agreements” as a key development this quarter. These agreements likely involve long-term purchase commitments from major hyperscalers, which would be recorded as receivables upon contract execution. If this interpretation is correct, the receivables increase reflects demand visibility rather than collection risk — a positive signal. However, the specific terms, counterparties, and collection schedules are not yet disclosed in the press release and will require review of the forthcoming 10-Q filing.
Government Incentives
Micron received $2.99B in government incentives over the nine-month period (vs $1.29B in the prior year). This likely reflects disbursements under the U.S. CHIPS and Science Act, which provides grants and tax credits for domestic semiconductor manufacturing. These incentives partially offset the capital intensity of Micron’s U.S. fab investments.
Implication:市場・セクターへの示唆
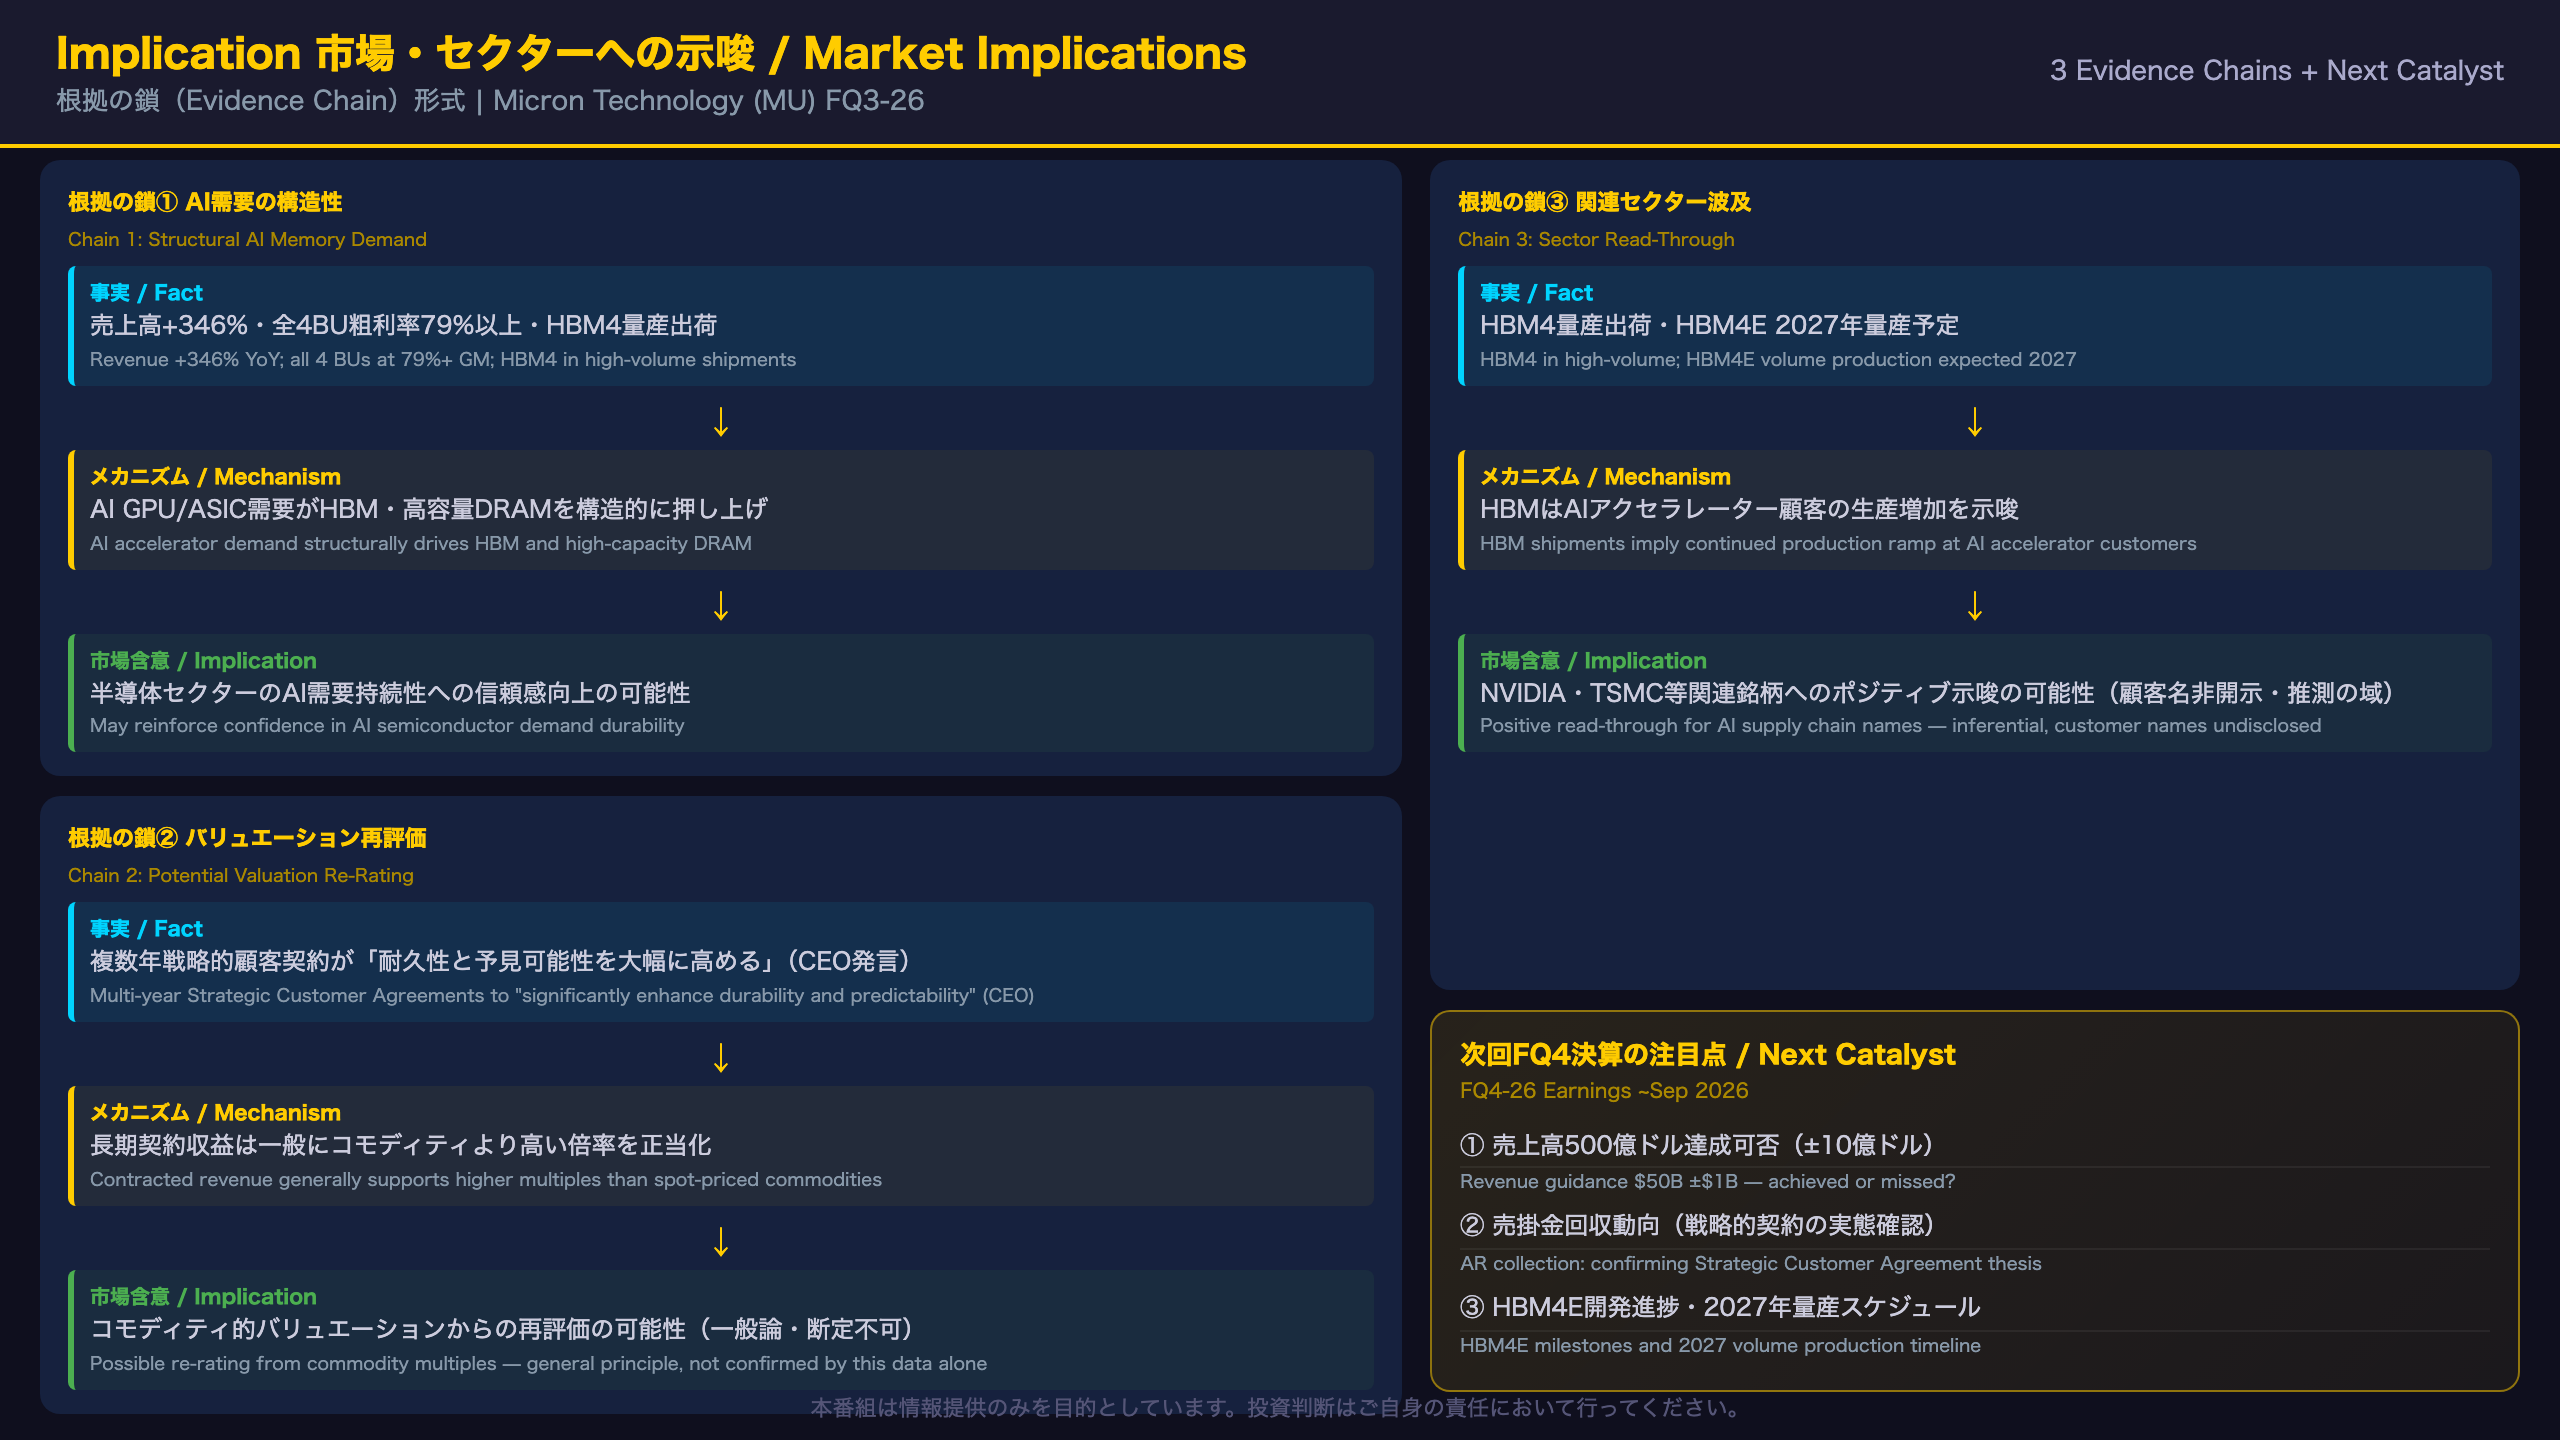
Market and Sector Implications: Evidence Chain Analysis
Chain 1: Structural Nature of AI Memory Demand
[Fact from filing] Revenue +346% YoY; all four segments at 79%+ gross margins; HBM4 in high-volume shipments → [Economic mechanism] AI accelerator demand (GPUs, custom ASICs) is structurally driving demand for HBM and high-capacity DRAM. Supply constraints in leading-edge HBM capacity allow Micron to capture significant pricing premiums → [Market implication] This data may reinforce market confidence in the durability of AI-related semiconductor demand. However, if competitor supply (SK Hynix HBM3E expansion, Samsung yield improvement) increases materially in 2027, pricing dynamics could shift. This chain cannot be confirmed as permanent from a single quarter’s data.
Chain 2: Potential Valuation Re-Rating
[Fact from filing] CEO Mehrotra stated: “We believe our multi-year Strategic Customer Agreements will significantly enhance the durability and predictability of Micron’s strong financial performance” → [Economic mechanism] Long-term contracted revenue generally supports higher valuation multiples than spot-priced commodity businesses, as earnings visibility reduces discount rates → [Market implication] Memory companies have historically traded at low P/E and P/B multiples due to cyclicality. A structural shift toward multi-year contracted revenue could support a re-rating toward higher multiples. However, this is a general principle — whether the market will actually re-rate Micron depends on factors beyond this single press release.
Chain 3: Sector Read-Through
[Fact from filing] HBM4 in high-volume shipments; HBM4E development underway with volume production expected in calendar 2027 → [Economic mechanism] HBM is a critical component in AI accelerators from NVIDIA, AMD, and custom ASIC designers. Micron’s shipment ramp implies continued strong production at these customers → [Market implication] This data may carry positive read-through implications for NVIDIA, AMD, TSMC, and other AI supply chain names. However, specific customer names are not disclosed, so individual stock implications remain inferential.
What to Watch Next
FQ4-26 earnings are expected around September 2026. Key items to monitor: (1) whether $50B revenue guidance is achieved; (2) accounts receivable collection dynamics (confirming the Strategic Customer Agreement thesis); (3) HBM4E development milestones and 2027 volume production timeline specifics.
Disclaimer: This article is for informational purposes only. All investment decisions are made solely at your own risk.