📺 Watch the Full Video Analysis
This article was automatically generated by the NFC Market Live AI analysis system. (Updated: 2026-07-23 06:45 JST)
📄 Primary Source
NFC Market Live
https://www.youtube.com/watch?v=LzExSq9DU9w
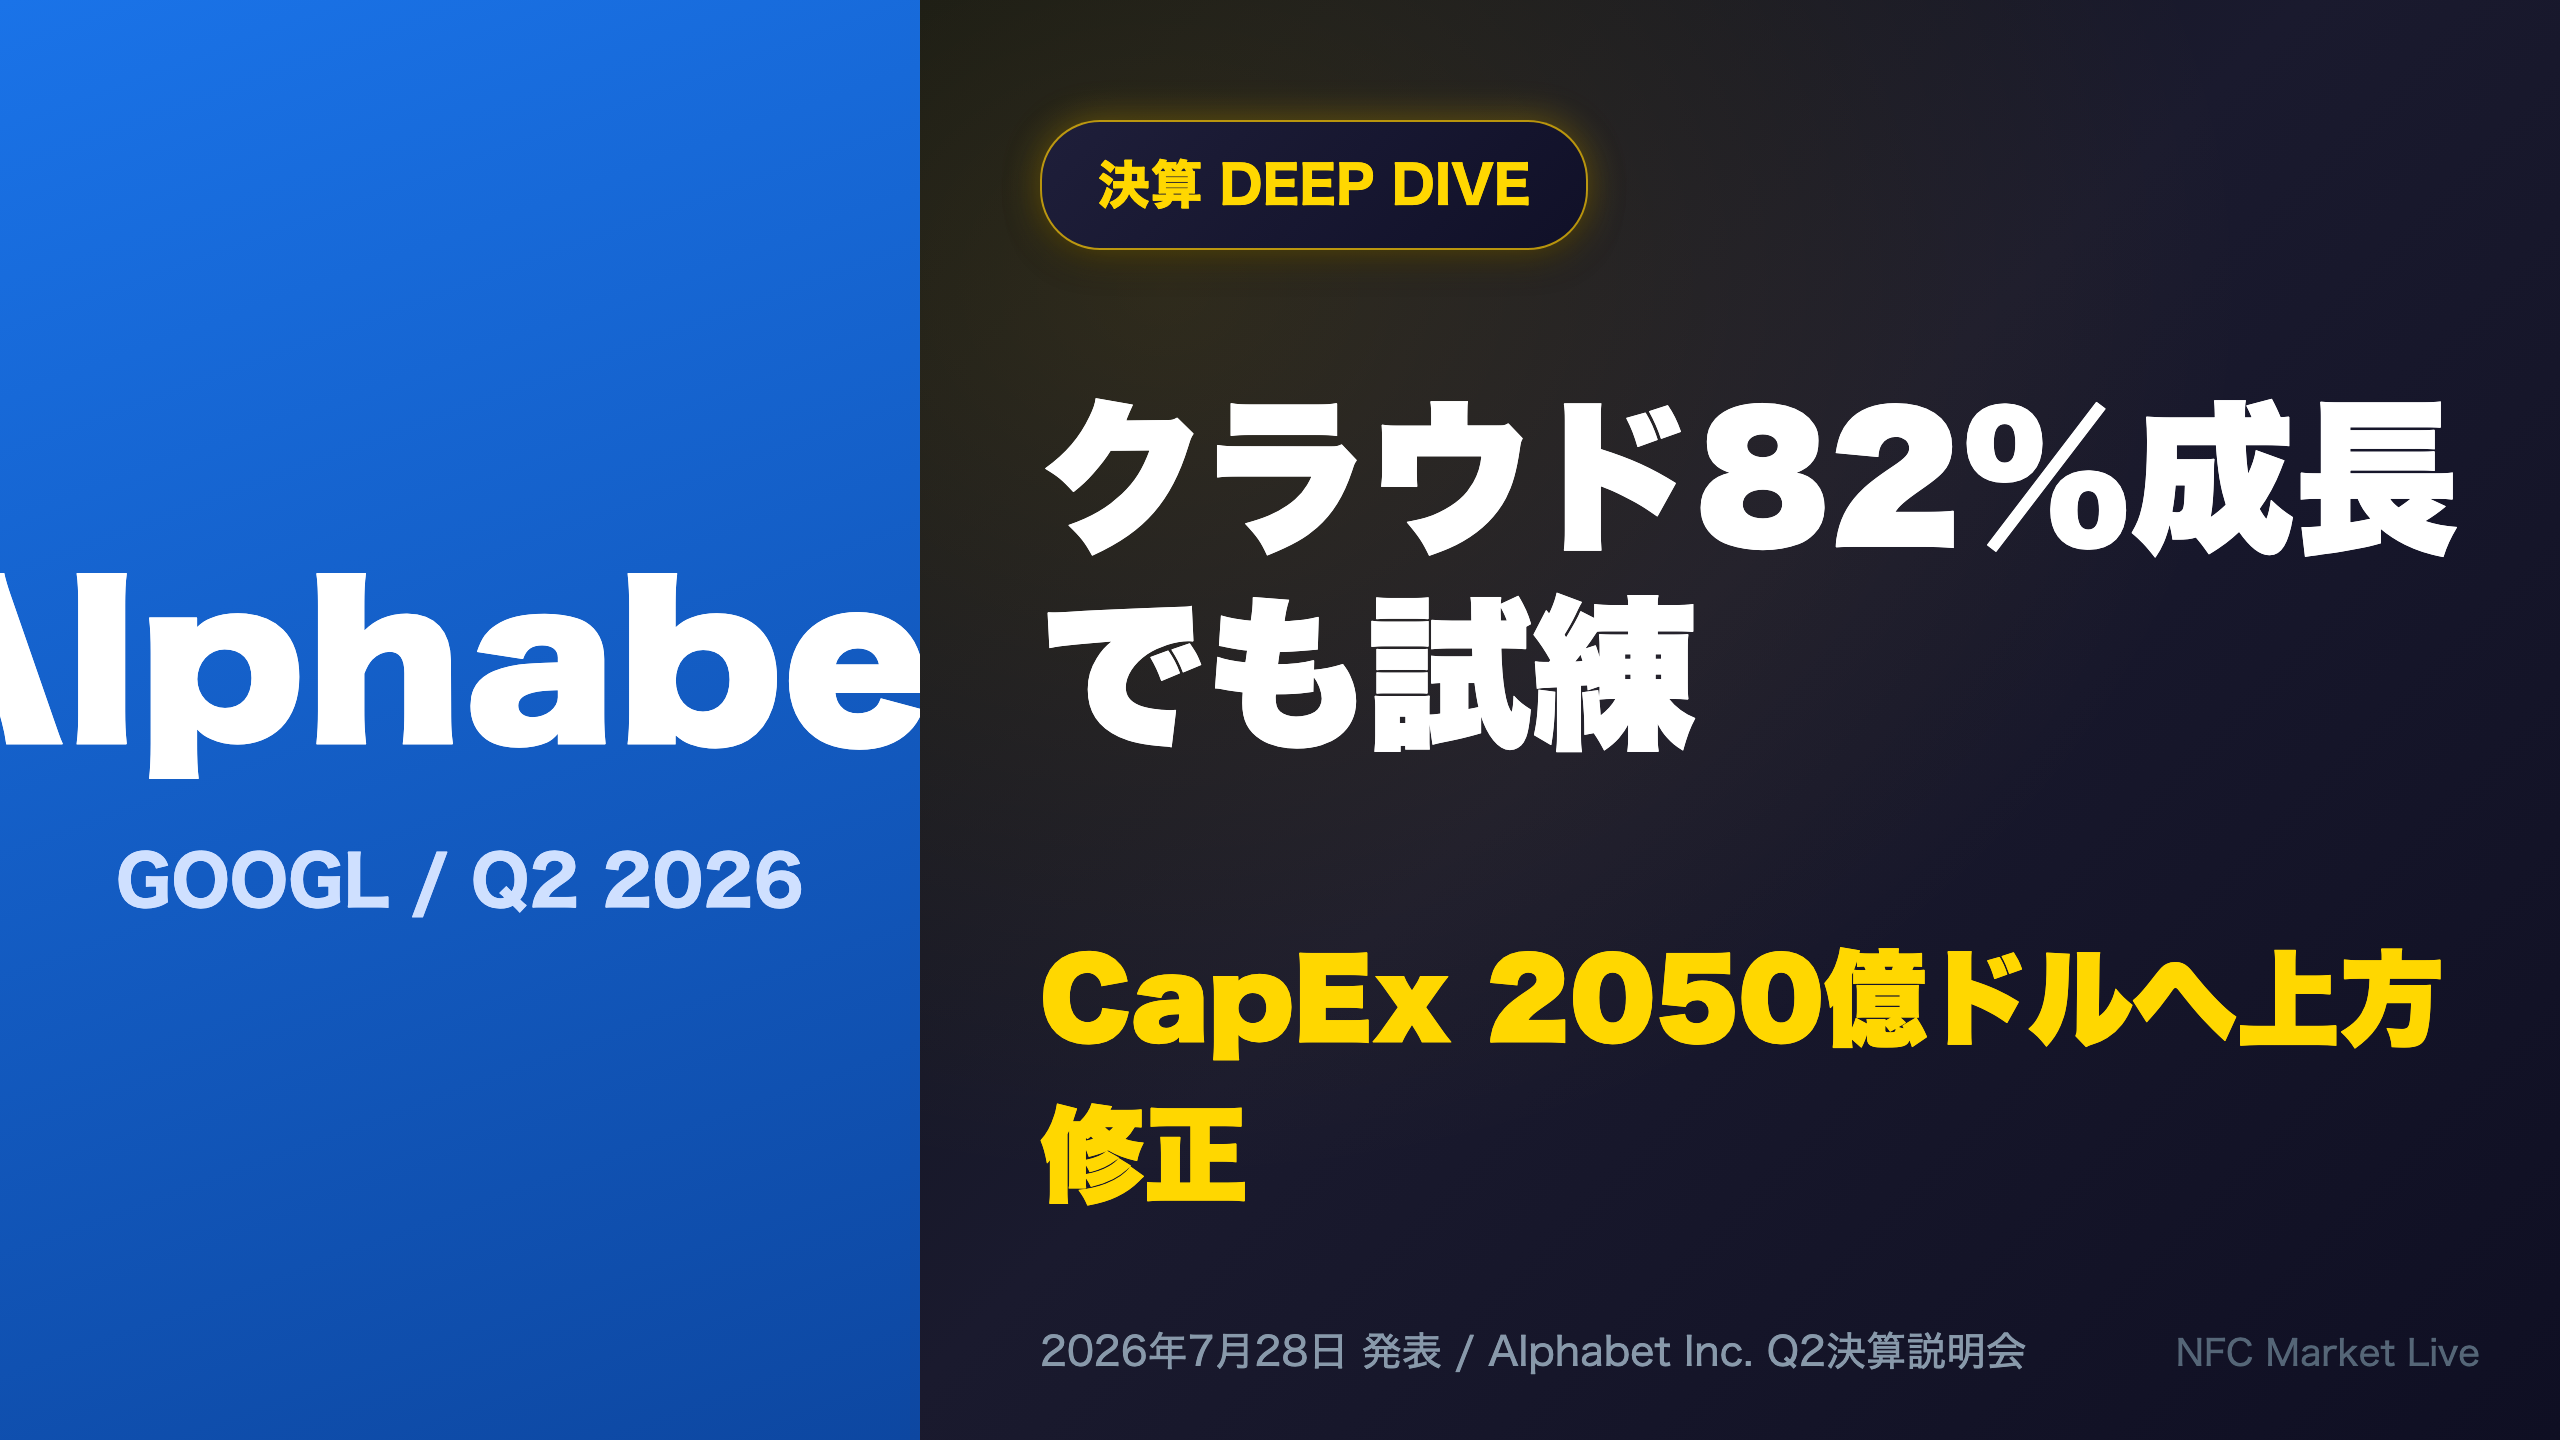
📊 A deep dive into Alphabet’s Q2 2026 earnings.
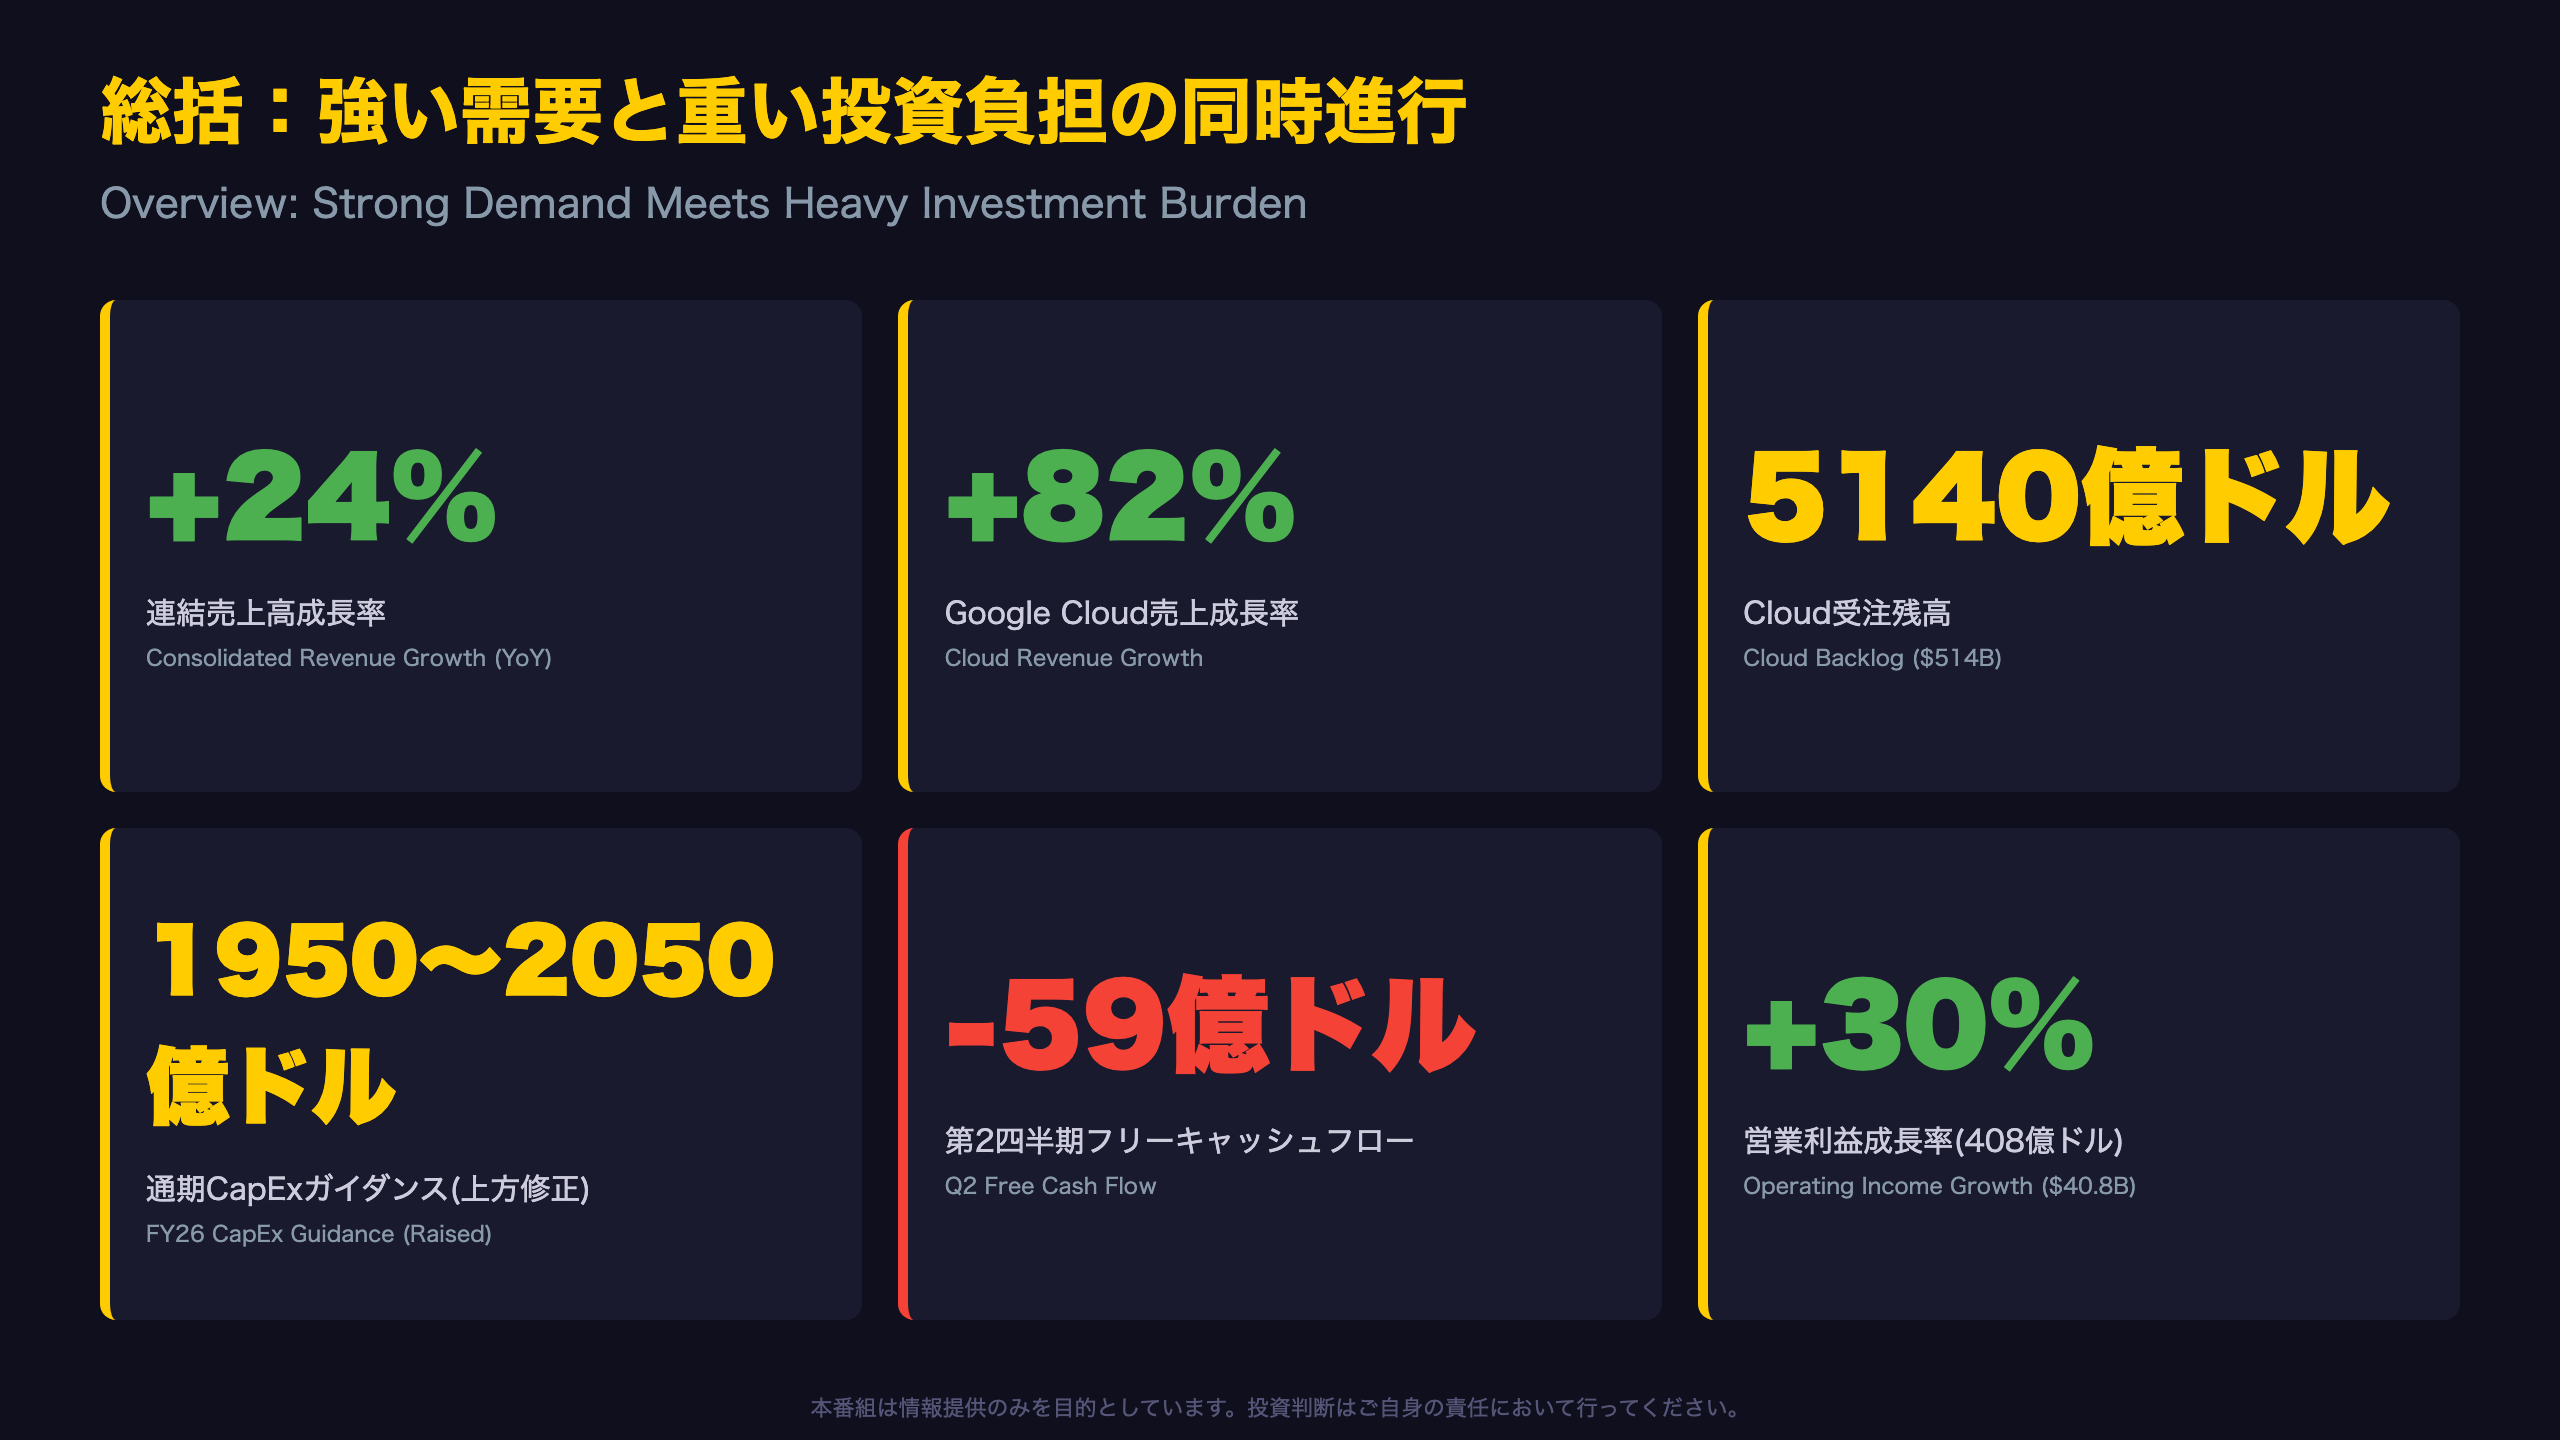
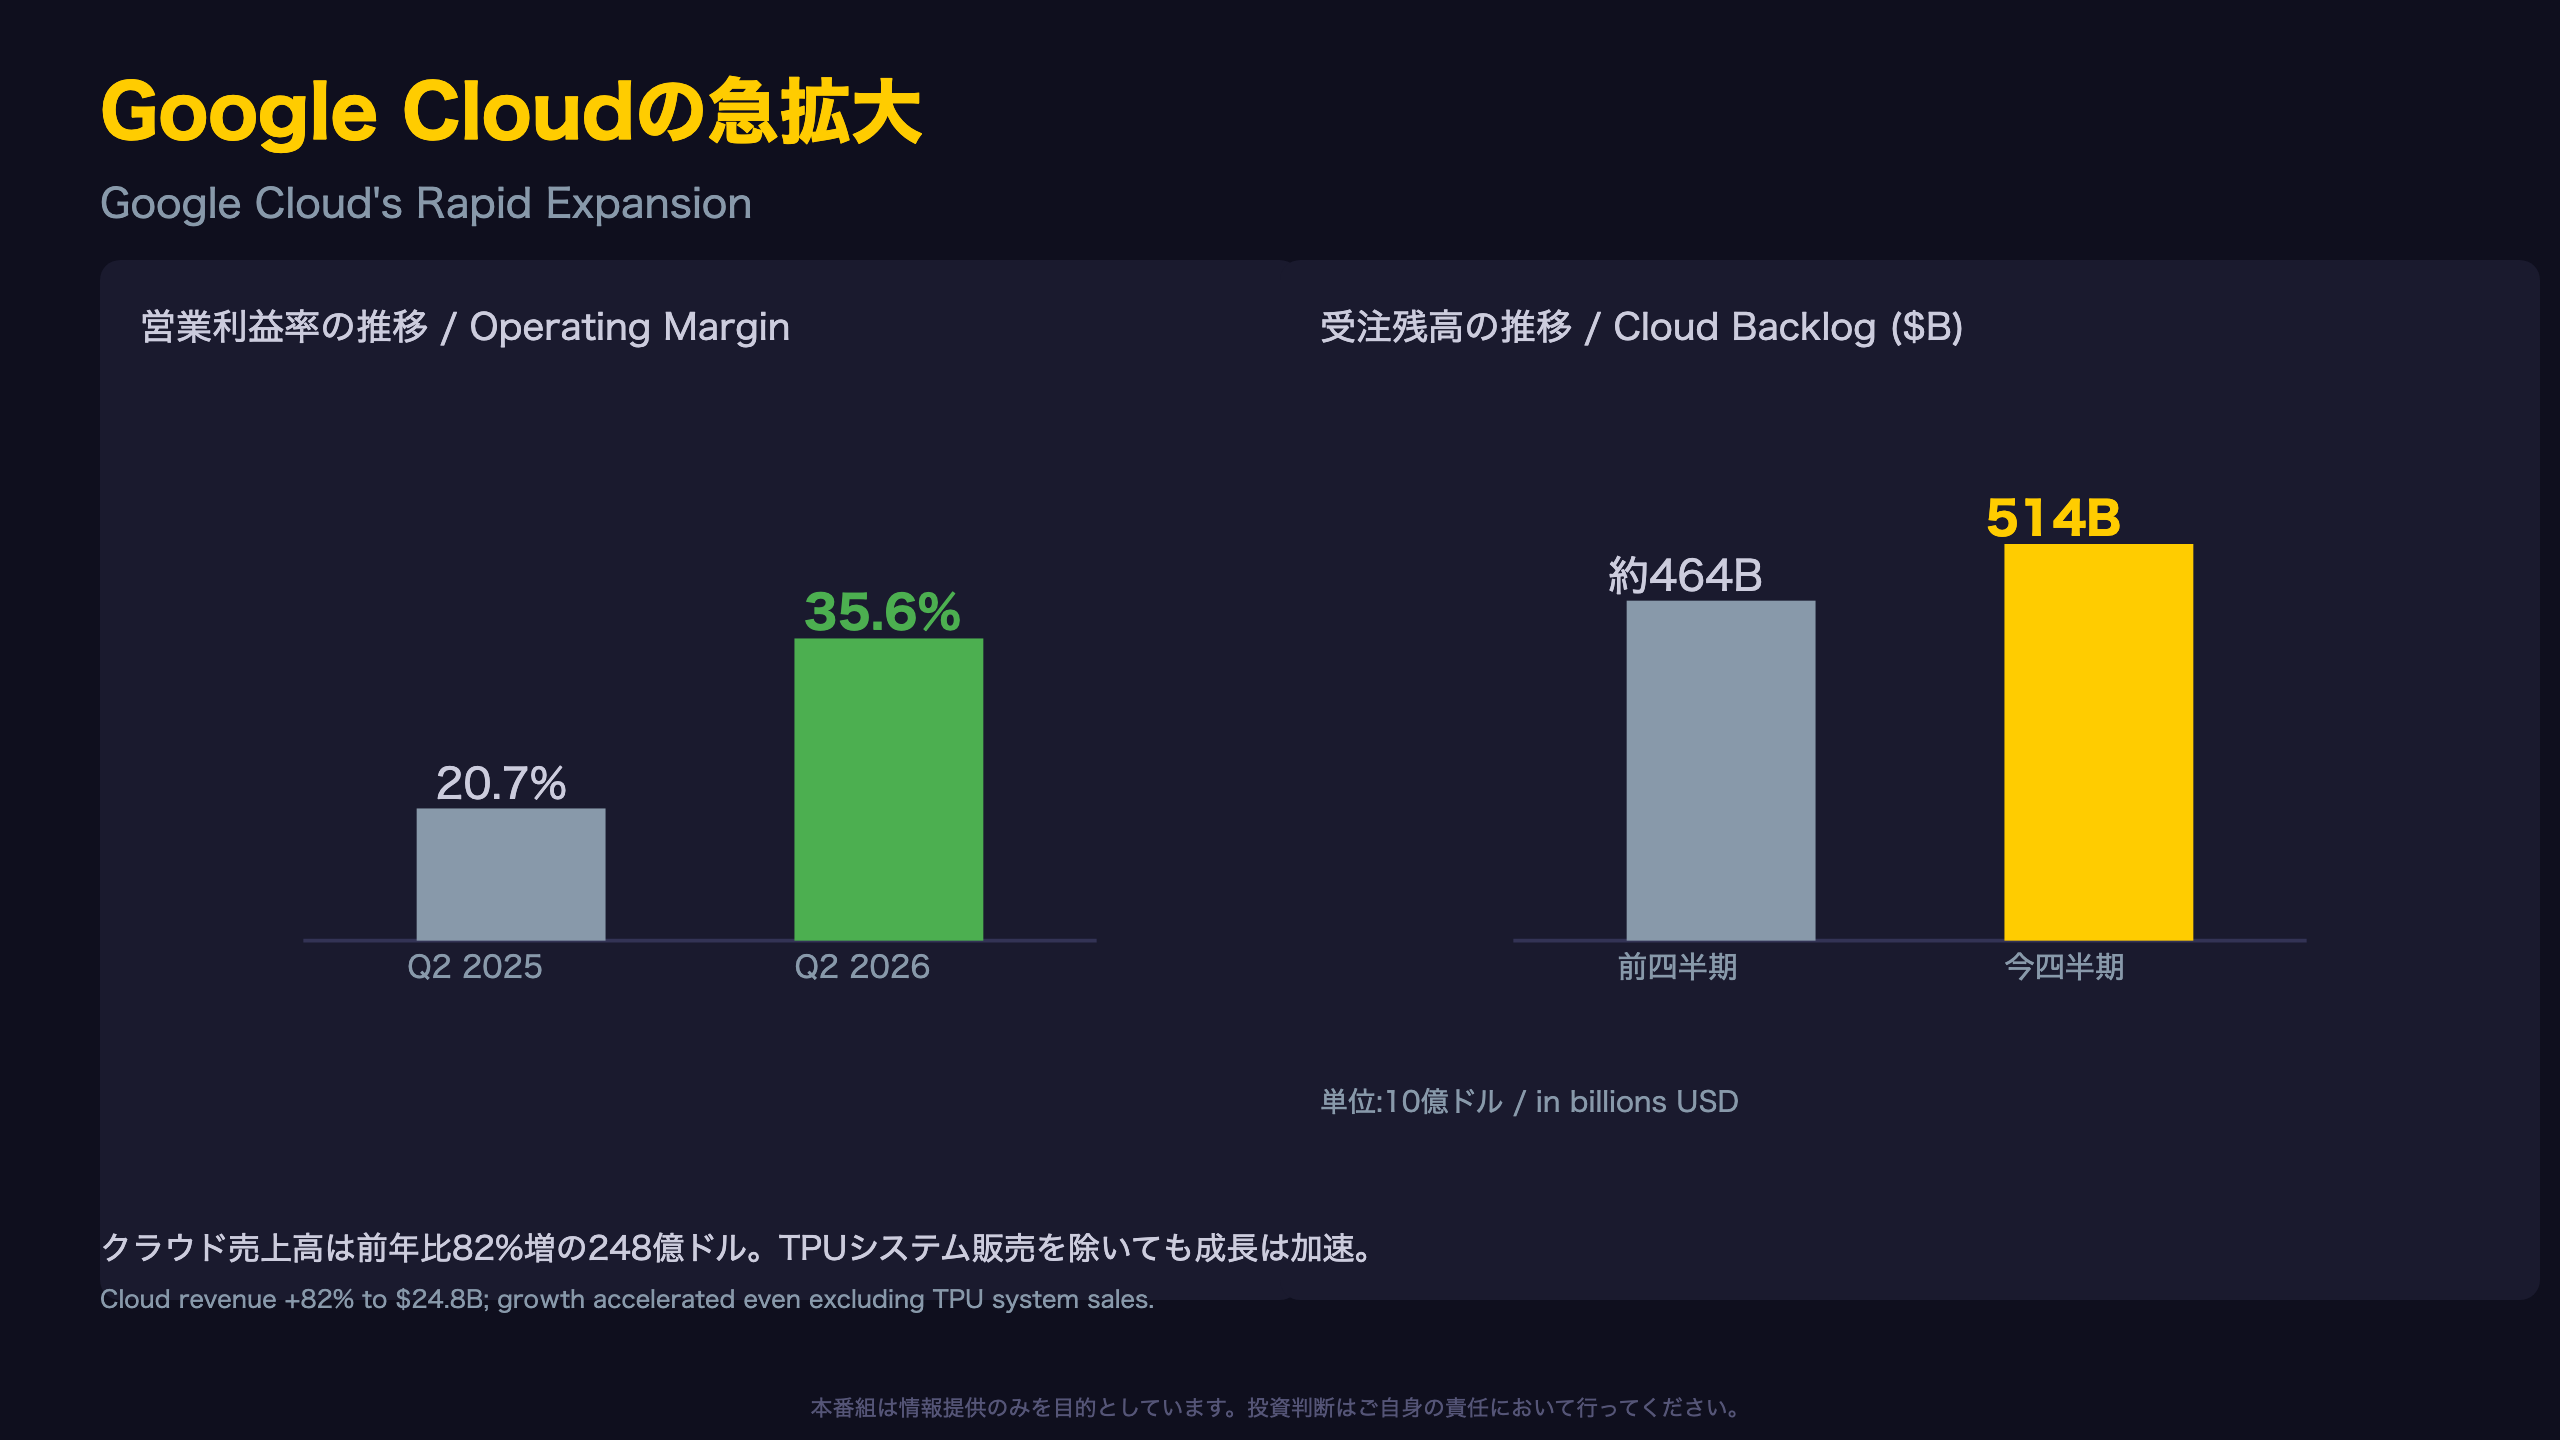
Revenue grew 24% YoY, with Google Cloud surging 82% to $24.8B and backlog expanding to $514B.
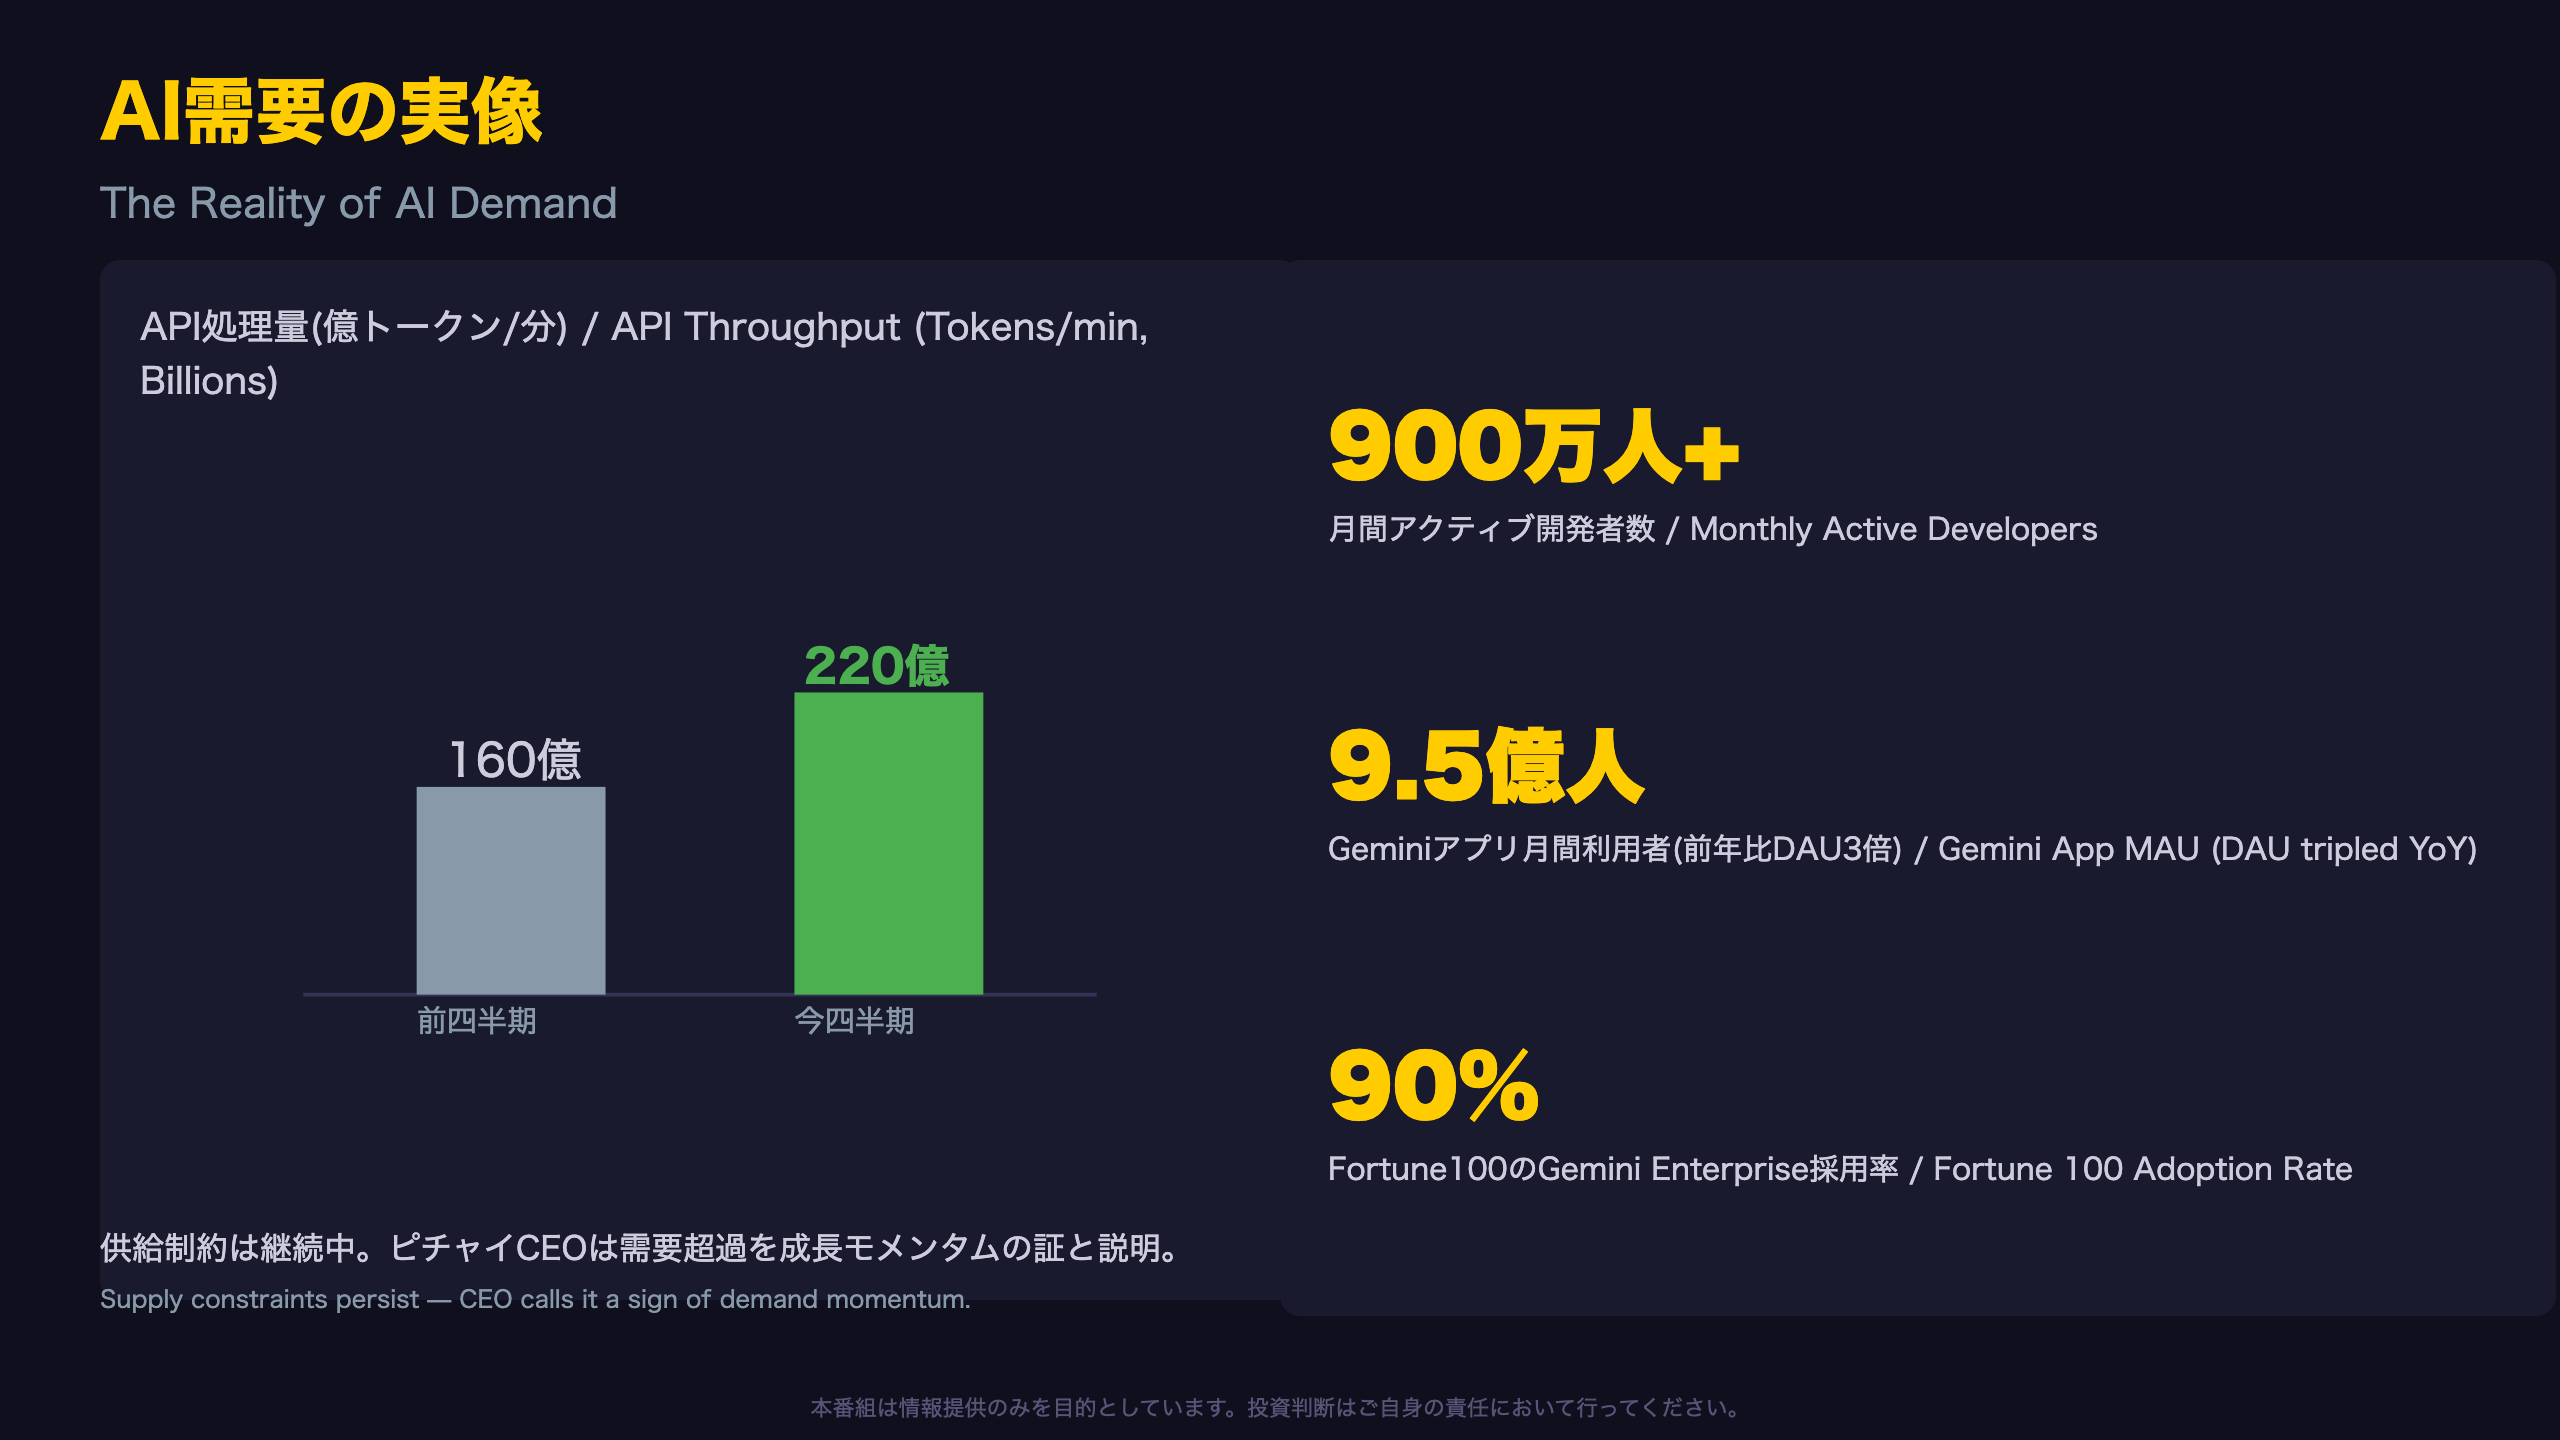
📈 AI demand strength is evident: token processing hit 22B tokens/minute, up ~40% from last quarter.
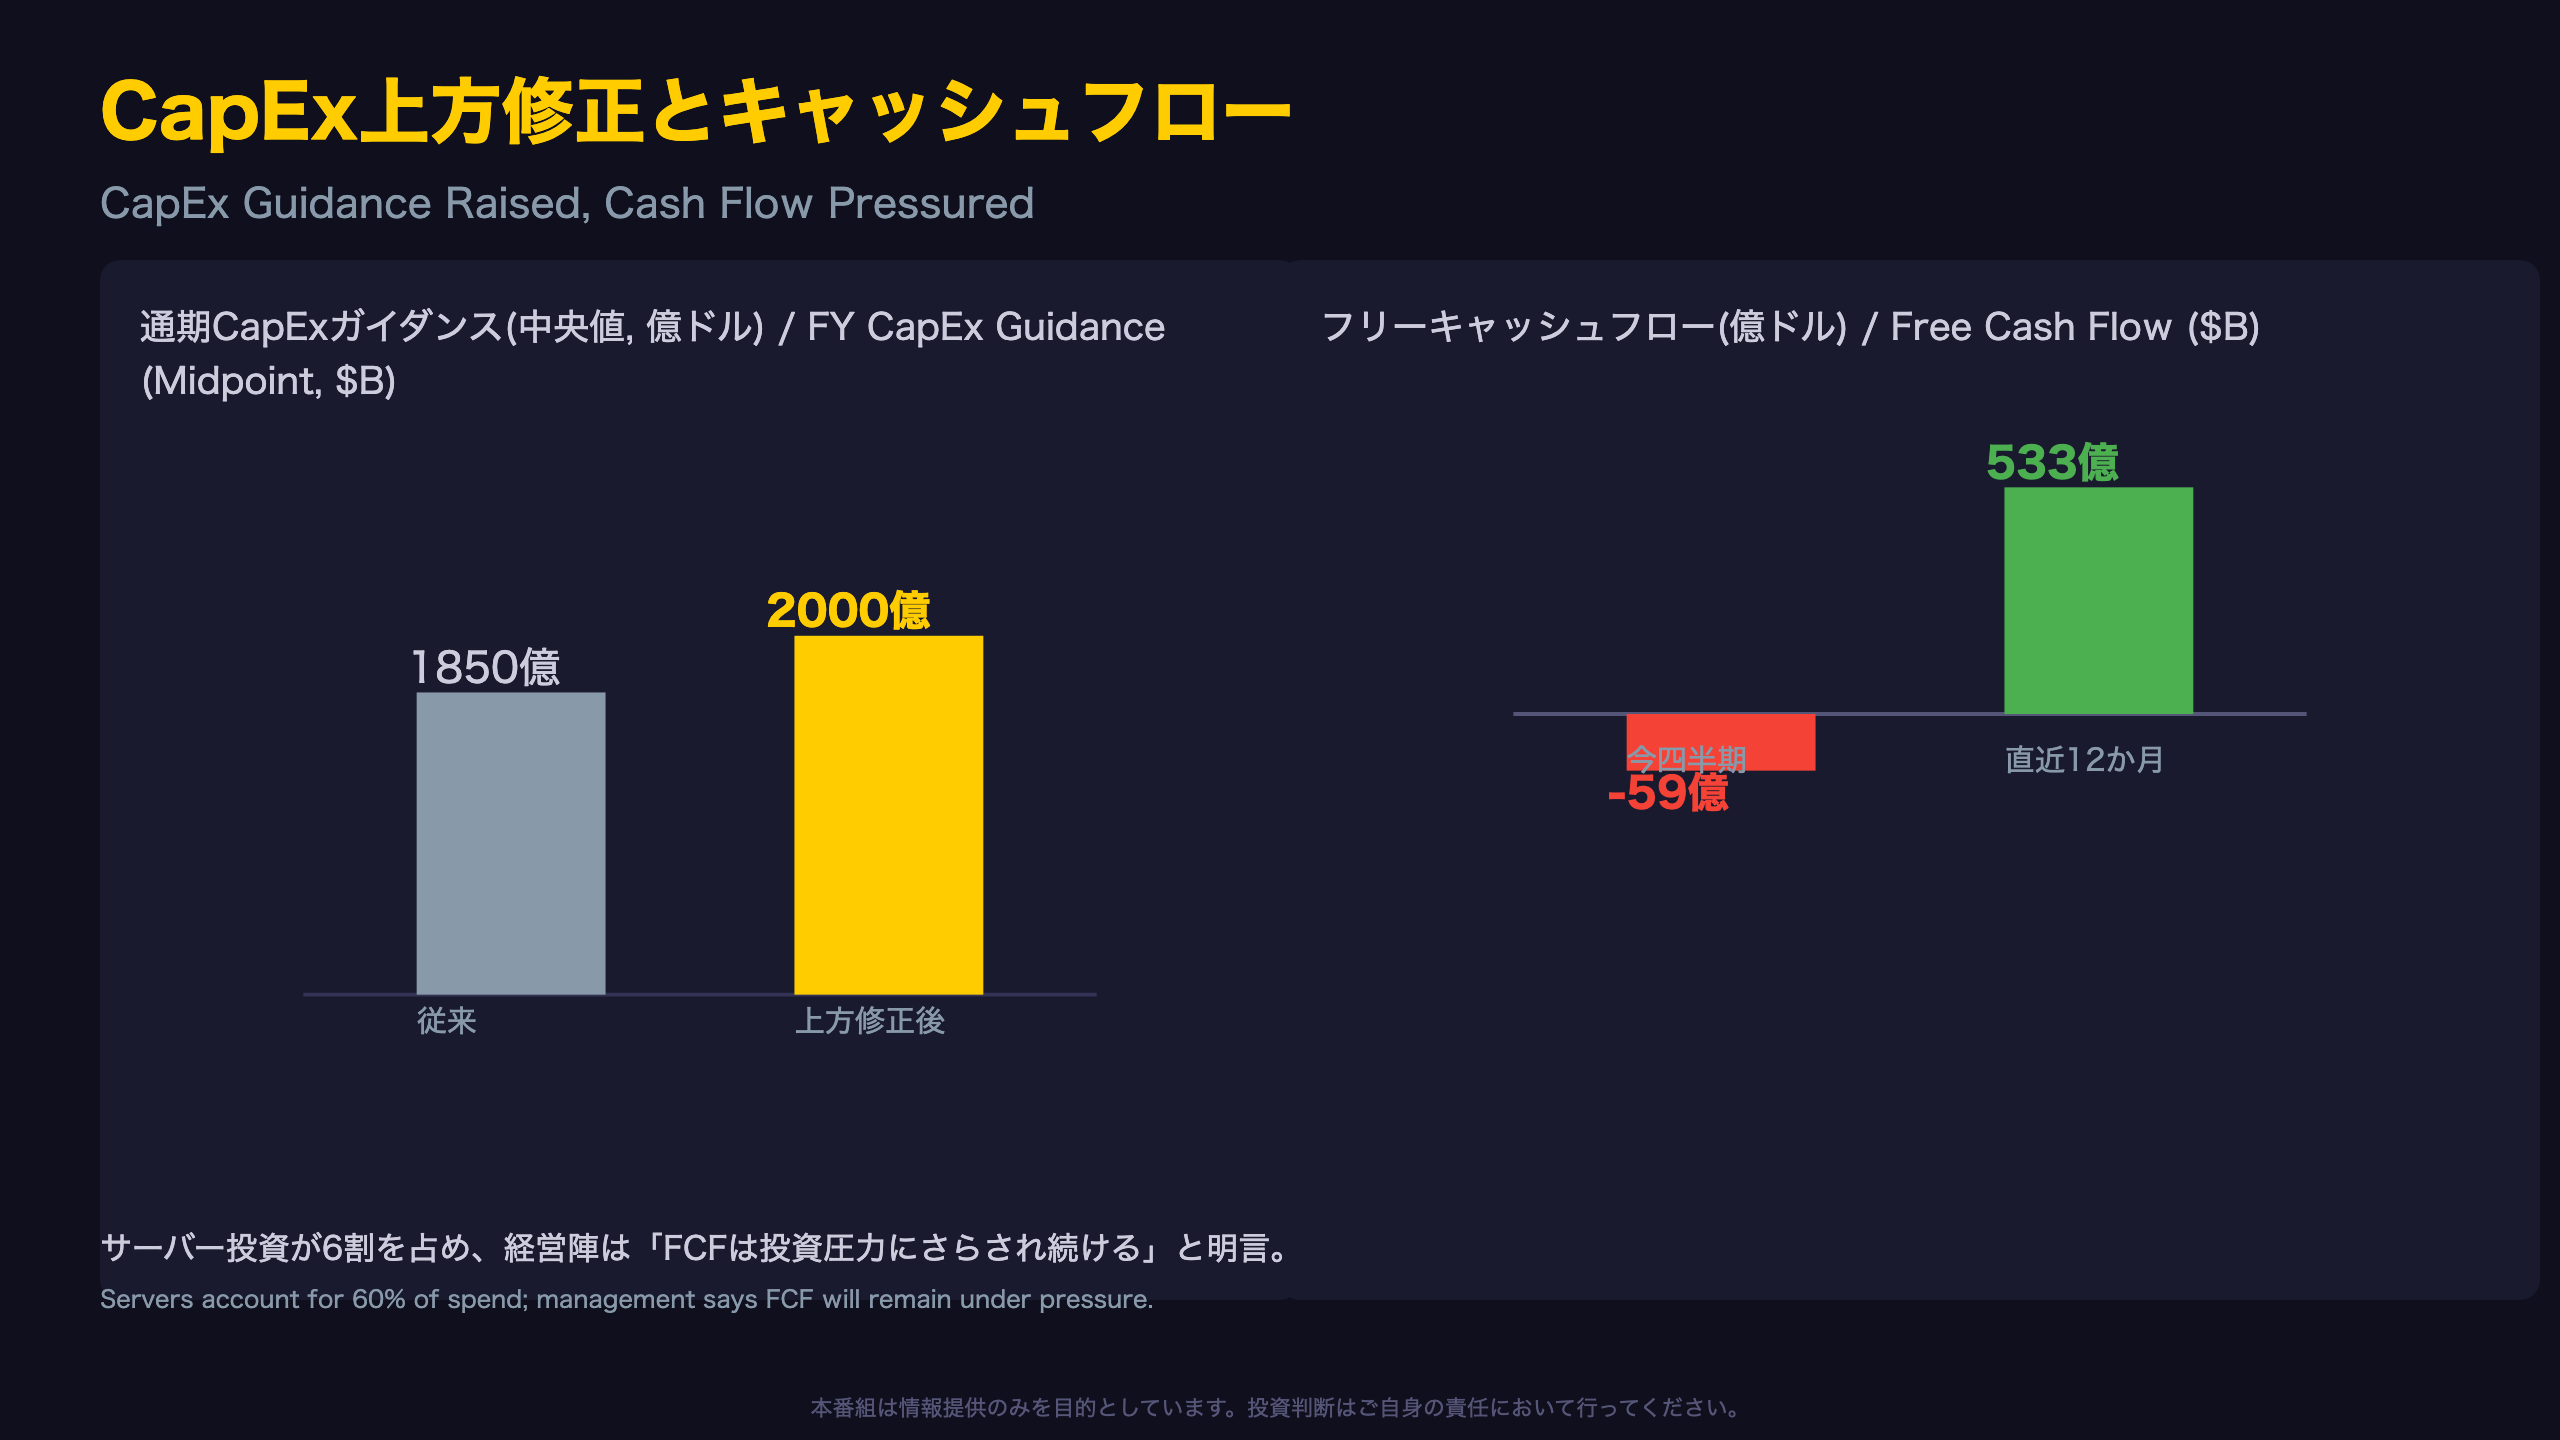
💡 Yet full-year CapEx guidance was raised to $205B, and quarterly free cash flow turned negative at -$5.9B.
⚠️ We break down both the growth story and the cash-flow tension with balanced analysis.
総括:強い需要と重い投資負担の同時進行
Beyond the Headline Numbers
Alphabet’s Q2 2026 results extend a long streak: twelve consecutive quarters of double-digit revenue growth, a trend CFO Anat Ashkenazi called “an outstanding second quarter.” Operating income rose 30% year-over-year to $40.8 billion, lifting operating margin to 34%.
Context for international readers
Unlike the U.S. Federal Reserve’s inflation-targeting framework, Alphabet’s guidance changes are company-specific capital allocation decisions, not monetary policy signals. Still, the scale involved rivals small-nation budgets: the revised CapEx guidance of $195-205 billion for FY2026 (up from $180-190 billion) is larger than the annual government budget of many G20 economies.
Quality-of-earnings caveat
Net income and EPS growth were significantly boosted by unrealized gains in Alphabet’s $87.1 billion marketable equity securities portfolio — a non-operating, mark-to-market item. Investors should weight operating income growth (+30%) more heavily than headline net income when assessing underlying business momentum.
Bridge to Q3
Management flagged a swing from FX tailwind to headwind in Q3, plus a difficult year-over-year comparison against last year’s search acceleration. With 2027 CapEx already flagged for “significant” further increases, the investment cycle shows no signs of peaking.
Google Cloudの急拡大:82%成長と5140億ドルの受注残高
Quantifying Cloud’s Real Strength
A 35.6% operating margin signals genuine operating leverage from scale, not just top-line expansion. The 14.9-point improvement from 20.7% a year ago suggests cost structure efficiency gains are running in parallel with revenue growth — a combination that typically supports valuation multiples for infrastructure businesses.
What’s really inside the backlog
CFO Anat Ashkenazi clarified that “the majority of the backlog is related to typical GCP contracts,” meaning the $514 billion figure is overwhelmingly recurring cloud-service demand rather than one-off TPU hardware sales — an important distinction for investors comparing Alphabet to hardware-cycle-dependent peers like Nvidia.
“Cloud revenue growth accelerated meaningfully even after excluding the impact of TPU system sales,” she said.
Timing matters
Just over 50% of backlog is expected to convert to revenue over the next 24 months — a longer monetization runway than typical SaaS businesses. Management also flagged that the “vast majority” of TPU system sale revenue won’t hit the books until 2027, meaning today’s backlog headline overstates near-term cash conversion speed.
AI需要の実像:トークン利用量とエンタープライズ浸透
What Token Volume Really Tells Us
API processing volume jumping from 16 billion to 22 billion tokens per minute in a single quarter reflects not just user growth but deepening usage intensity among existing customers — a sign of genuine product-market fit rather than one-time trial adoption.
Context: what is a “token” and why it matters
For readers unfamiliar with AI infrastructure metrics, tokens are the basic units of text an AI model processes; token volume is roughly analogous to “compute consumed” and is one of the best proxies for real usage intensity, as opposed to headline user counts which can include inactive accounts.
Developer ecosystem breadth
- Agent Development Kit: ~70 million downloads
- Antigravity (agentic dev platform): 2.4 million weekly active users
- Gemma (open models): 900 million+ cumulative downloads, with Gemma 4 alone exceeding 300 million
The supply constraint caveat
CEO Sundar Pichai said Alphabet remains “supply constrained, a sign of momentum and rapid adoption” — a candid admission that demand currently exceeds available compute capacity. This is a double-edged signal: it confirms robust demand but also implies potential revenue left on the table until capacity catches up in coming quarters.
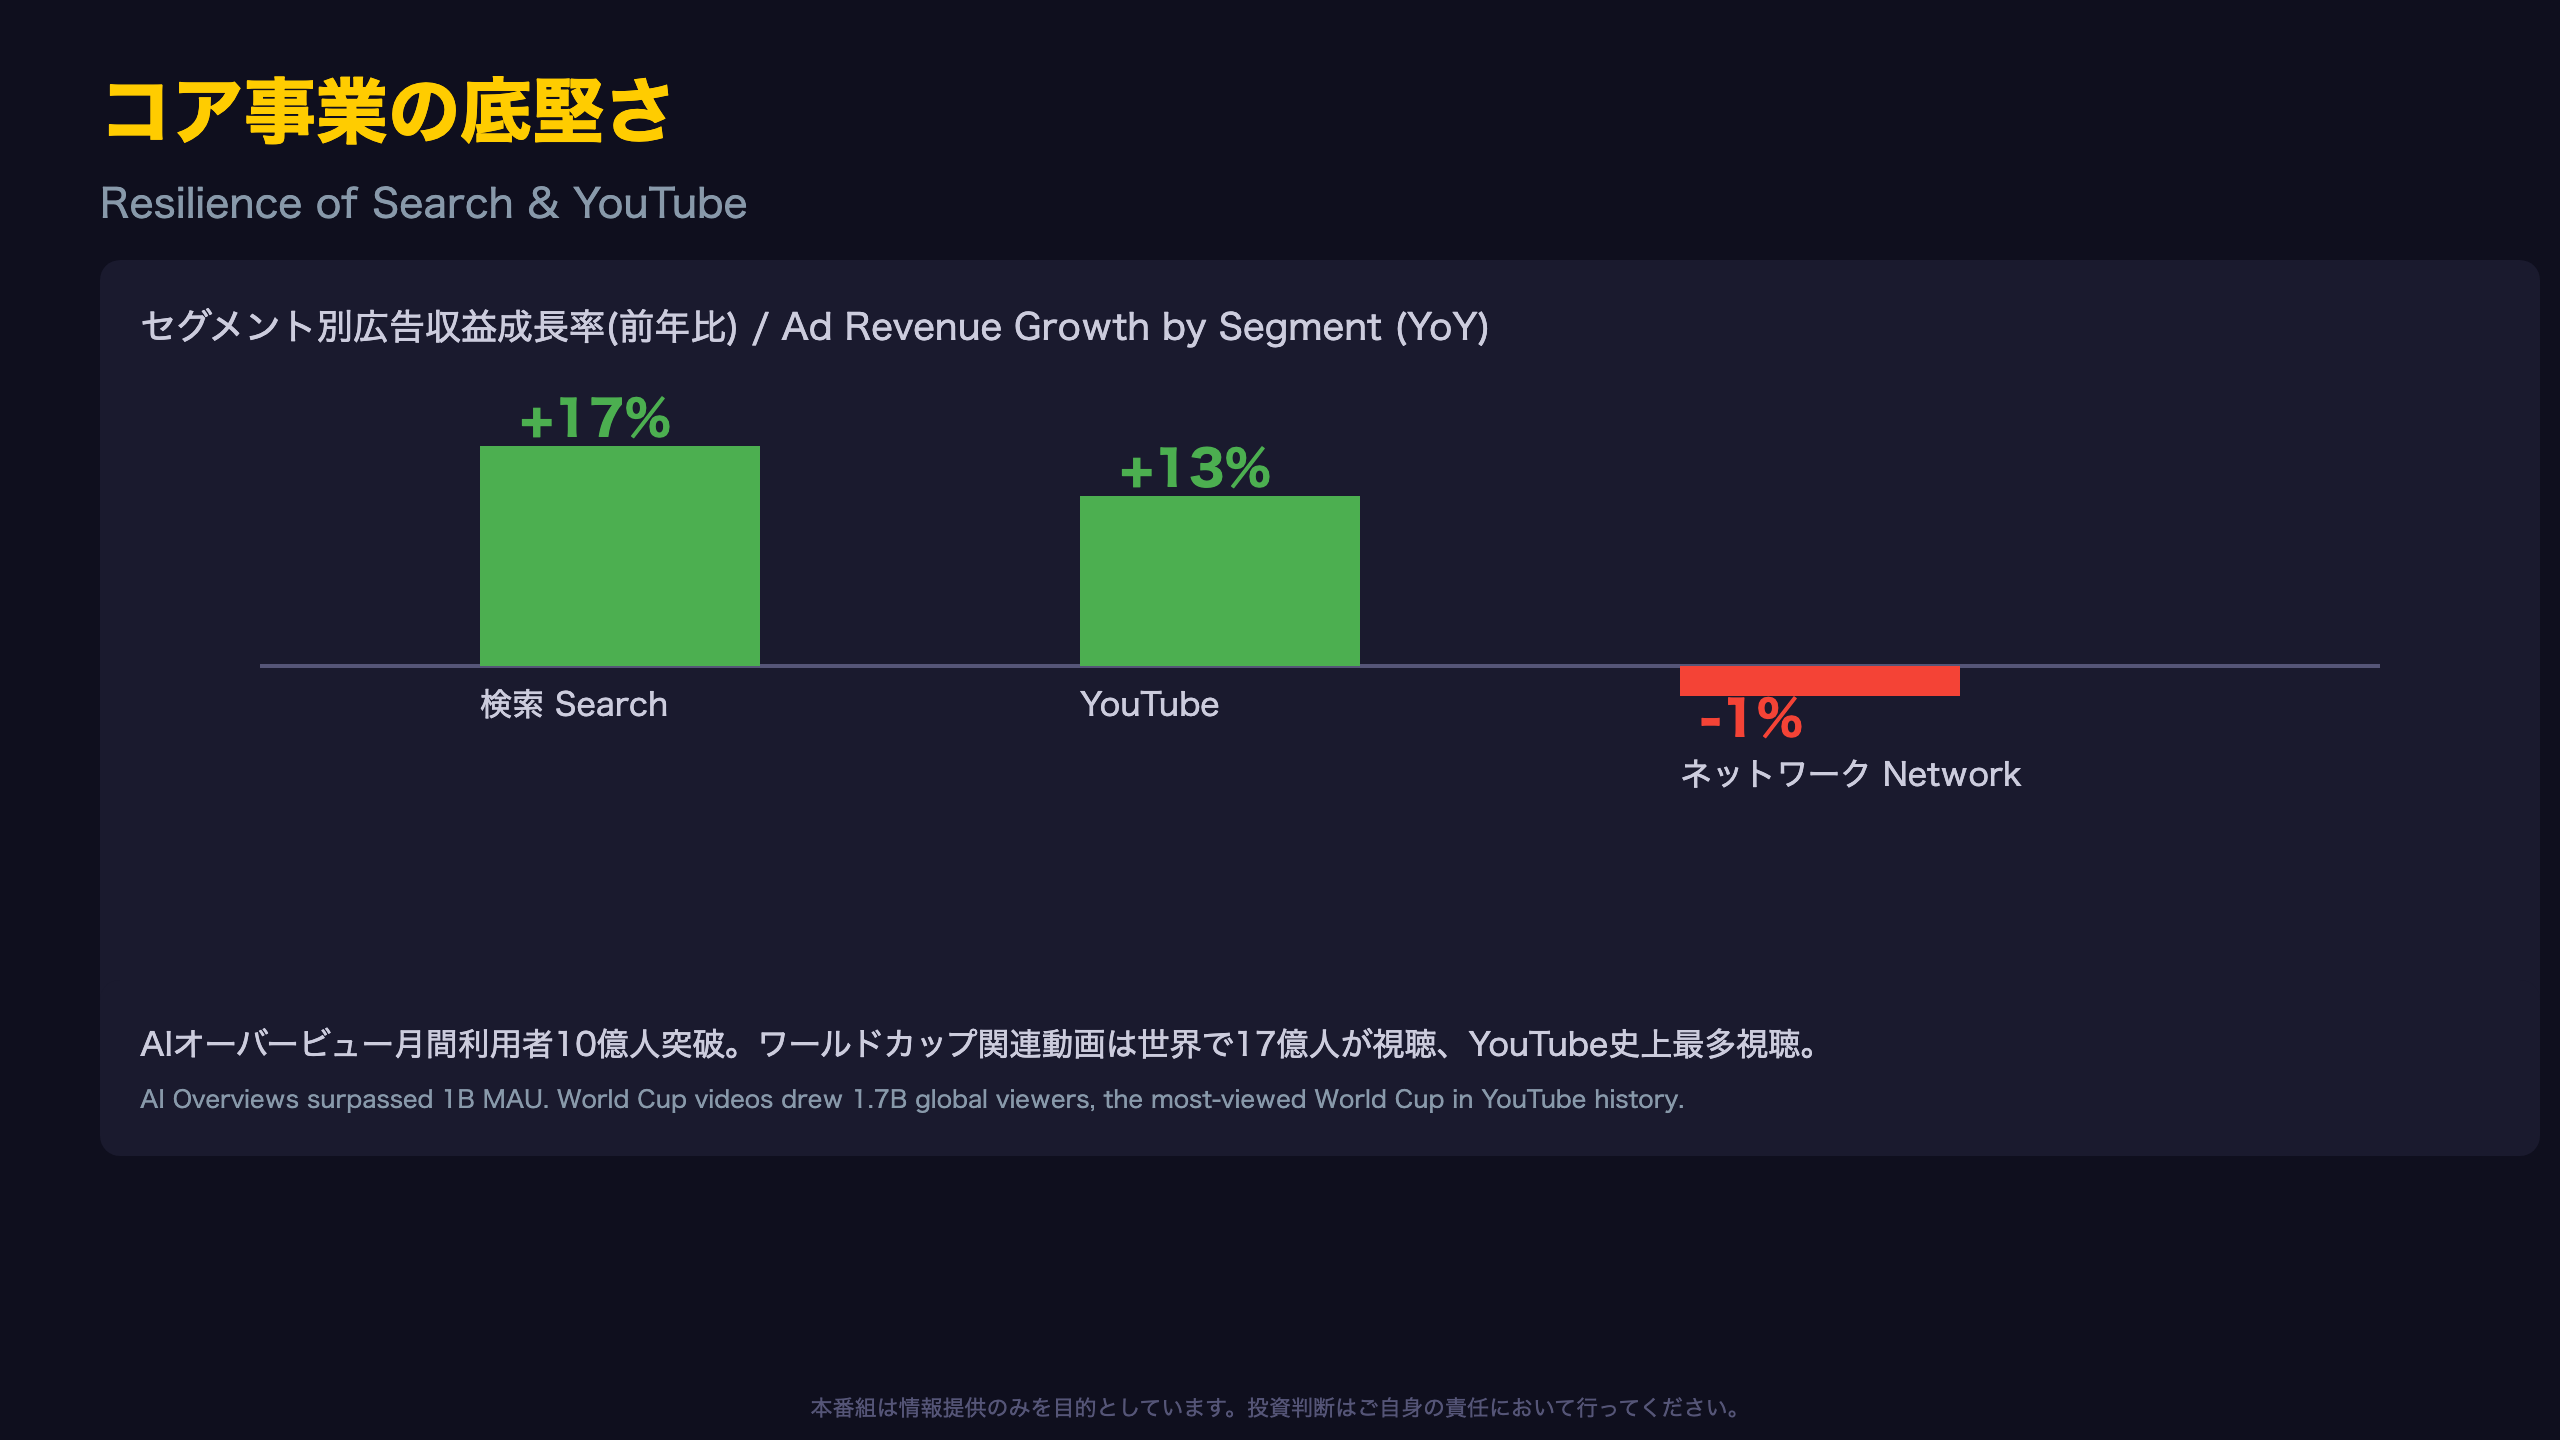
コア事業(検索・YouTube)の底堅さ
Unpacking Search’s Growth Drivers
A 17% growth rate is striking given Search and Other’s scale (over $63 billion in quarterly revenue). CFO-equivalent ad chief Philip Schindler noted “all the major verticals contributed to the growth,” with retail leading, followed by finance, tech, and media/entertainment.
A hidden strength: AI Mode cost efficiency
One easily overlooked detail: “we reduced the cost of AI mode responses to its lowest level since launch,” even while deploying more advanced AI capabilities. This suggests Alphabet has found a technical path to scale AI features without proportionally scaling serving costs — a critical margin-protection lever as AI search adoption grows.
For investors unfamiliar with the ad-channel mix
“Network” advertising refers to third-party publisher inventory monetized through Google’s ad exchange (AdSense/AdMob), distinct from Google’s own properties (Search, YouTube). Its -1% decline versus +13% YouTube growth and +17% Search growth suggests advertiser budgets are migrating toward Google’s owned-and-operated, AI-enhanced surfaces.
“Over 1.7 billion unique viewers globally watched World Cup-related videos on YouTube,” management noted — the most-viewed World Cup in YouTube’s history.
Notably, YouTube’s subscription business (Music/Premium) is growing faster than its ad business, adding a second, less cyclical revenue stream.
CapEx上方修正とキャッシュフローの構造変化
What’s Actually Inside the CapEx Increase
CFO Anat Ashkenazi specified that “approximately 60% of our investment in technical infrastructure this quarter was in servers and 40% was in data centers and networking equipment.” The server-heavy mix suggests the spending is concentrated on compute assets (GPUs/TPUs) rather than pure real-estate buildout — arguably a higher-quality form of CapEx since compute assets can be redeployed and monetized more flexibly than physical buildings.
Reading the negative free cash flow correctly
A negative quarterly free cash flow is unusual for Alphabet, but the trailing twelve-month figure remained solidly positive at $53.3 billion. This is best read as a single-quarter cash-timing issue rather than a deterioration in underlying business economics — the business is still generating substantial operating cash flow ($39.1B in Q2 alone); it’s simply being outpaced by capital deployment.
Comparison to U.S. mega-cap peers
For context, Alphabet’s raised CapEx range ($195-205B) places it alongside Microsoft, Amazon, and Meta in the small group of companies now spending more on AI infrastructure annually than most countries’ entire national R&D budgets — underscoring how central this capital cycle has become to the broader U.S. equity market’s earnings trajectory.
Looking ahead to 2027
Management reiterated that “CapEx [will] increase significantly in 2027,” with further details promised “at a later date” — meaning the investment cycle’s peak likely still lies ahead, a key variable for future free cash flow projections.
マージン逆風と資本構成の変化
Why Lease Third-Party Capacity?
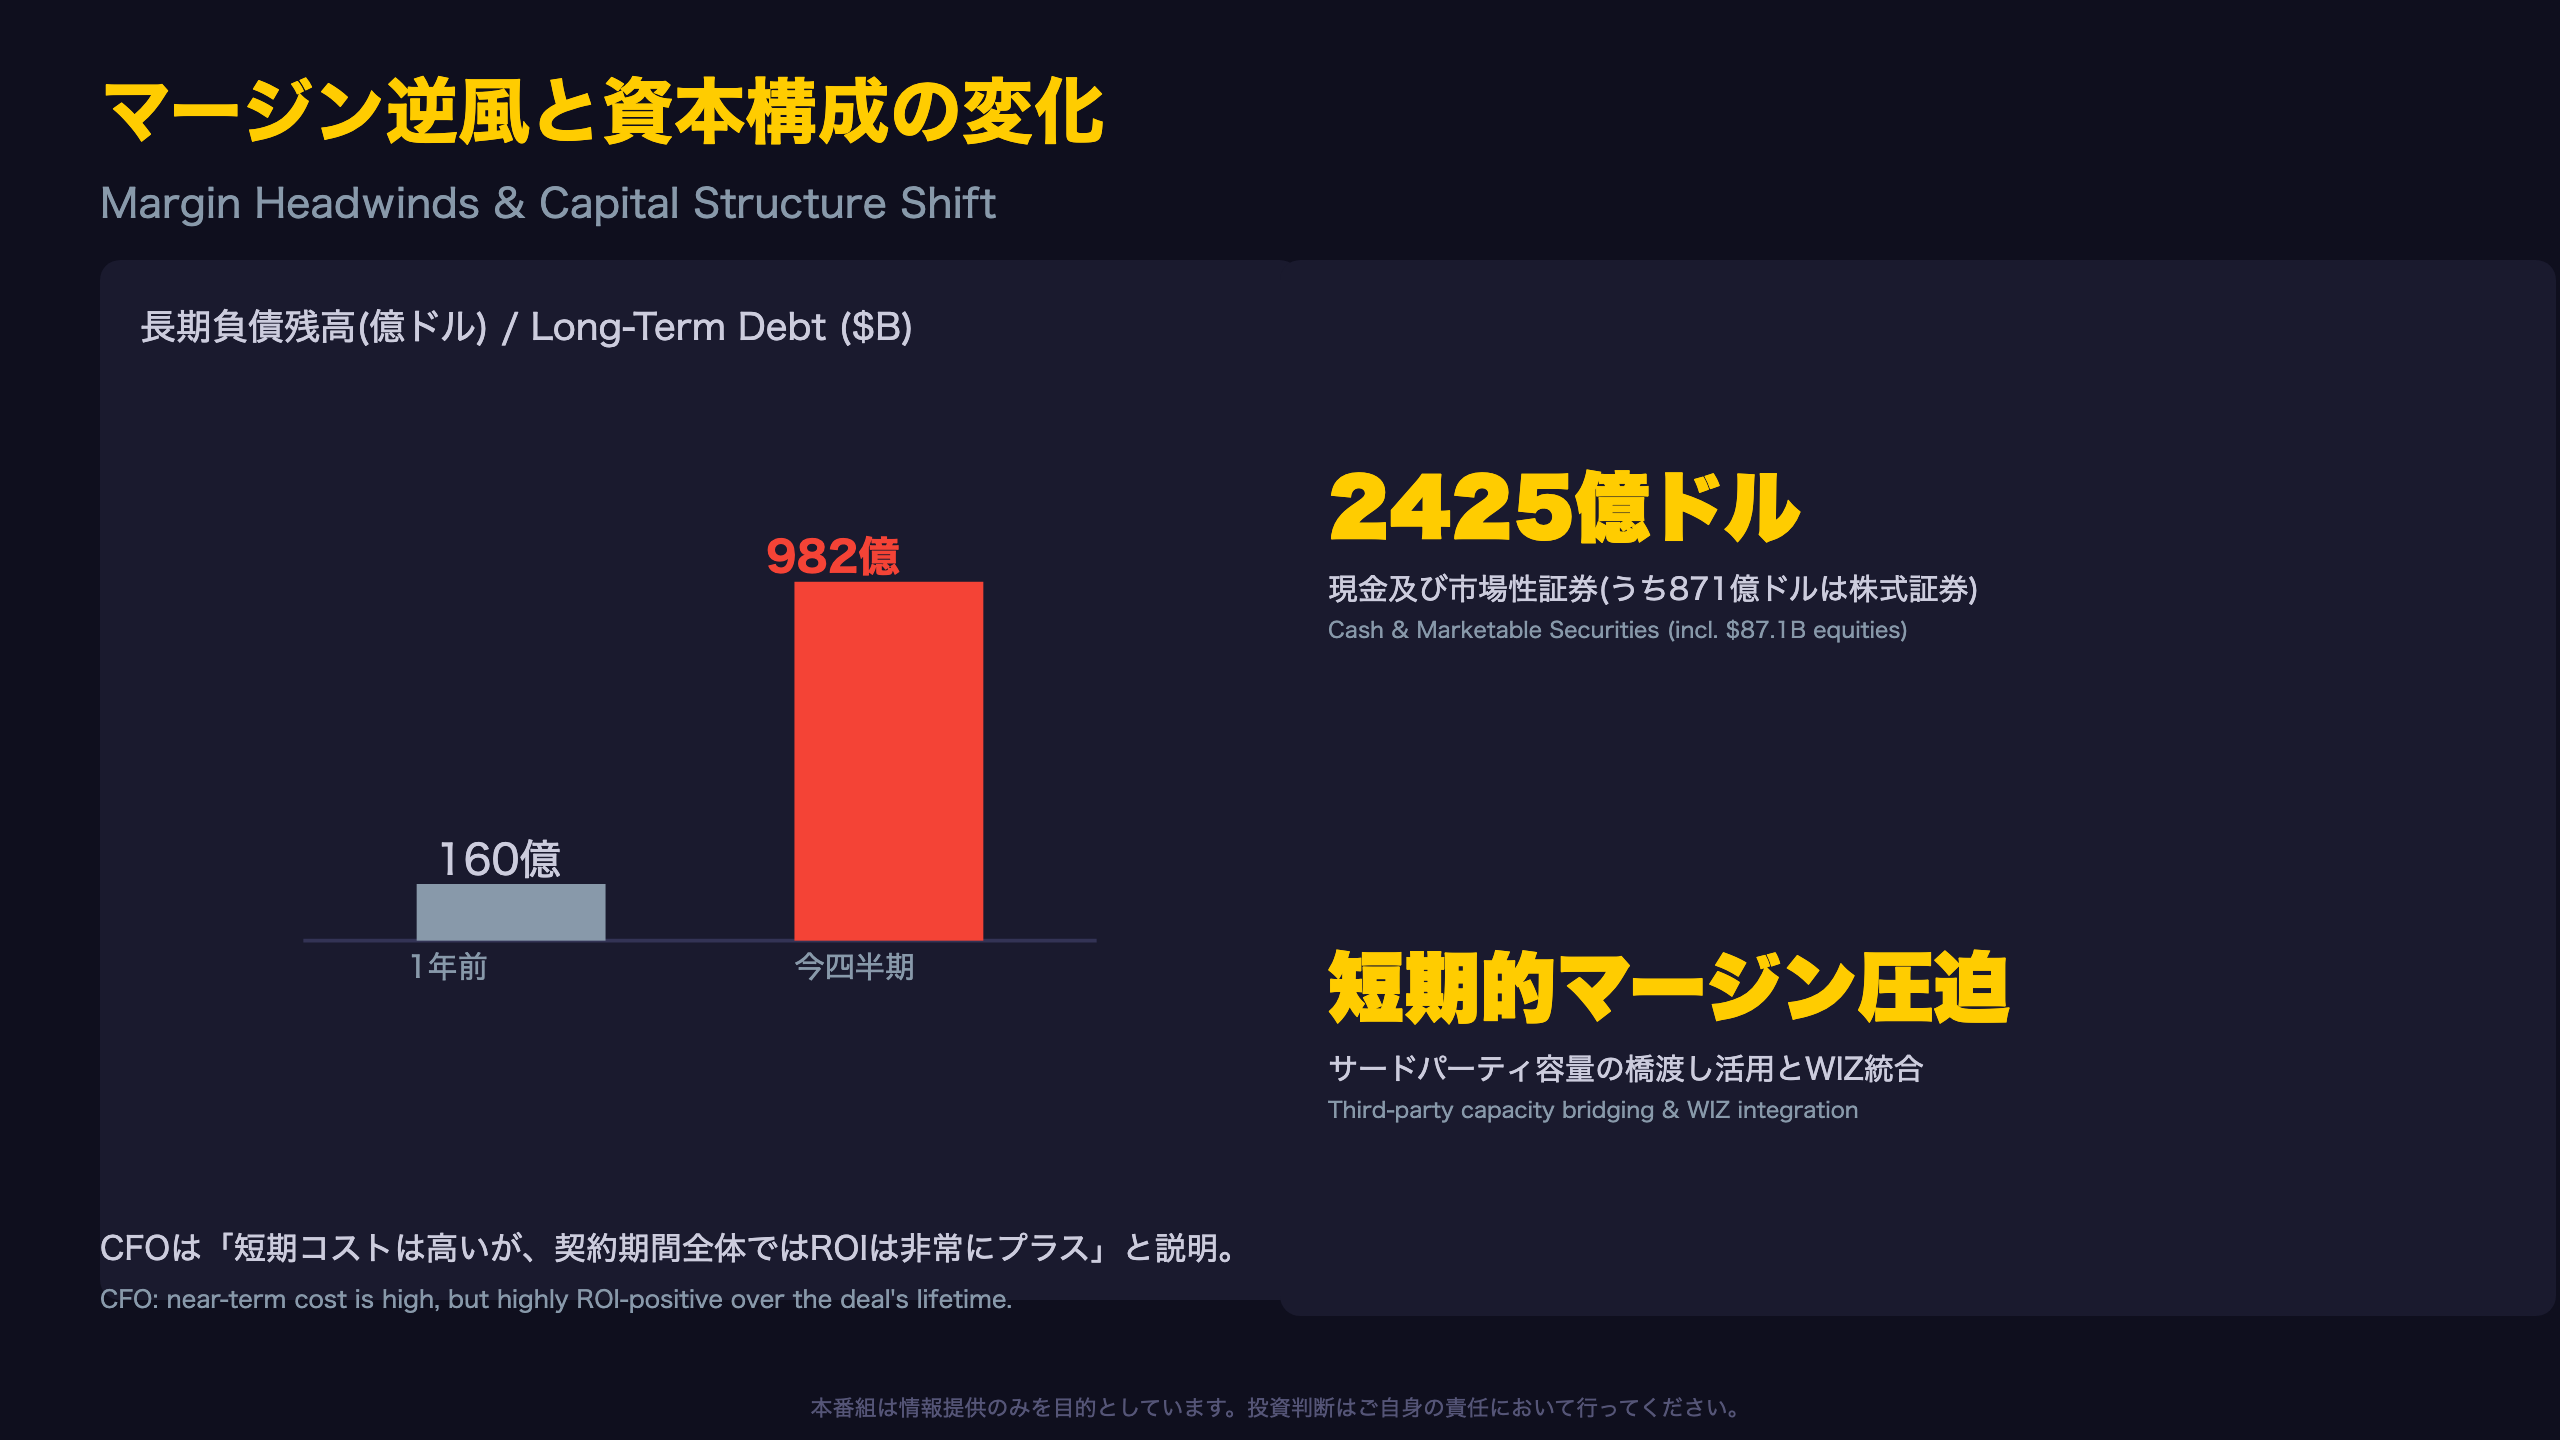
CFO Anat Ashkenazi acknowledged that “a short-term cost over a few months may be very high,” but stressed that “in the lifetime of the deal… [it is] highly ROI positive.” In other words, the near-term margin compression is a deliberate trade-off made to capture long-term, high-value customer relationships rather than a sign of cost discipline slipping.
The debt story, in context
On capital structure, Ashkenazi explained the funding hierarchy: “we first look at how much we can support based on cash from operations,” then debt, then equity. She revealed debt expanded from “about 16 billion” a year ago to “about 100 billion” now — roughly a six-fold increase in twelve months. For context, this pace of leverage growth is unusual even among capital-intensive tech peers, and it puts Alphabet’s bond issuance calendar squarely on investors’ radar for signs of rising financing costs.
The equity raise, demystified
Management clarified it is “not planning to go back to the equity markets,” except for a continuing at-the-market (ATM) offering specifically to offset stock-based compensation dilution — not a broad capital raise. This suggests operating cash flow and debt remain the primary funding levers, with equity issuance playing only a targeted, technical role.
What to watch next
The WIZ cybersecurity acquisition integration was explicitly flagged as a margin headwind “in the near term in 2026” — whether this drag fades as expected in 2027 will be a key confirmation point in upcoming quarters.
市場へのインプリケーション
Reading Market Implications Through Chains of Logic
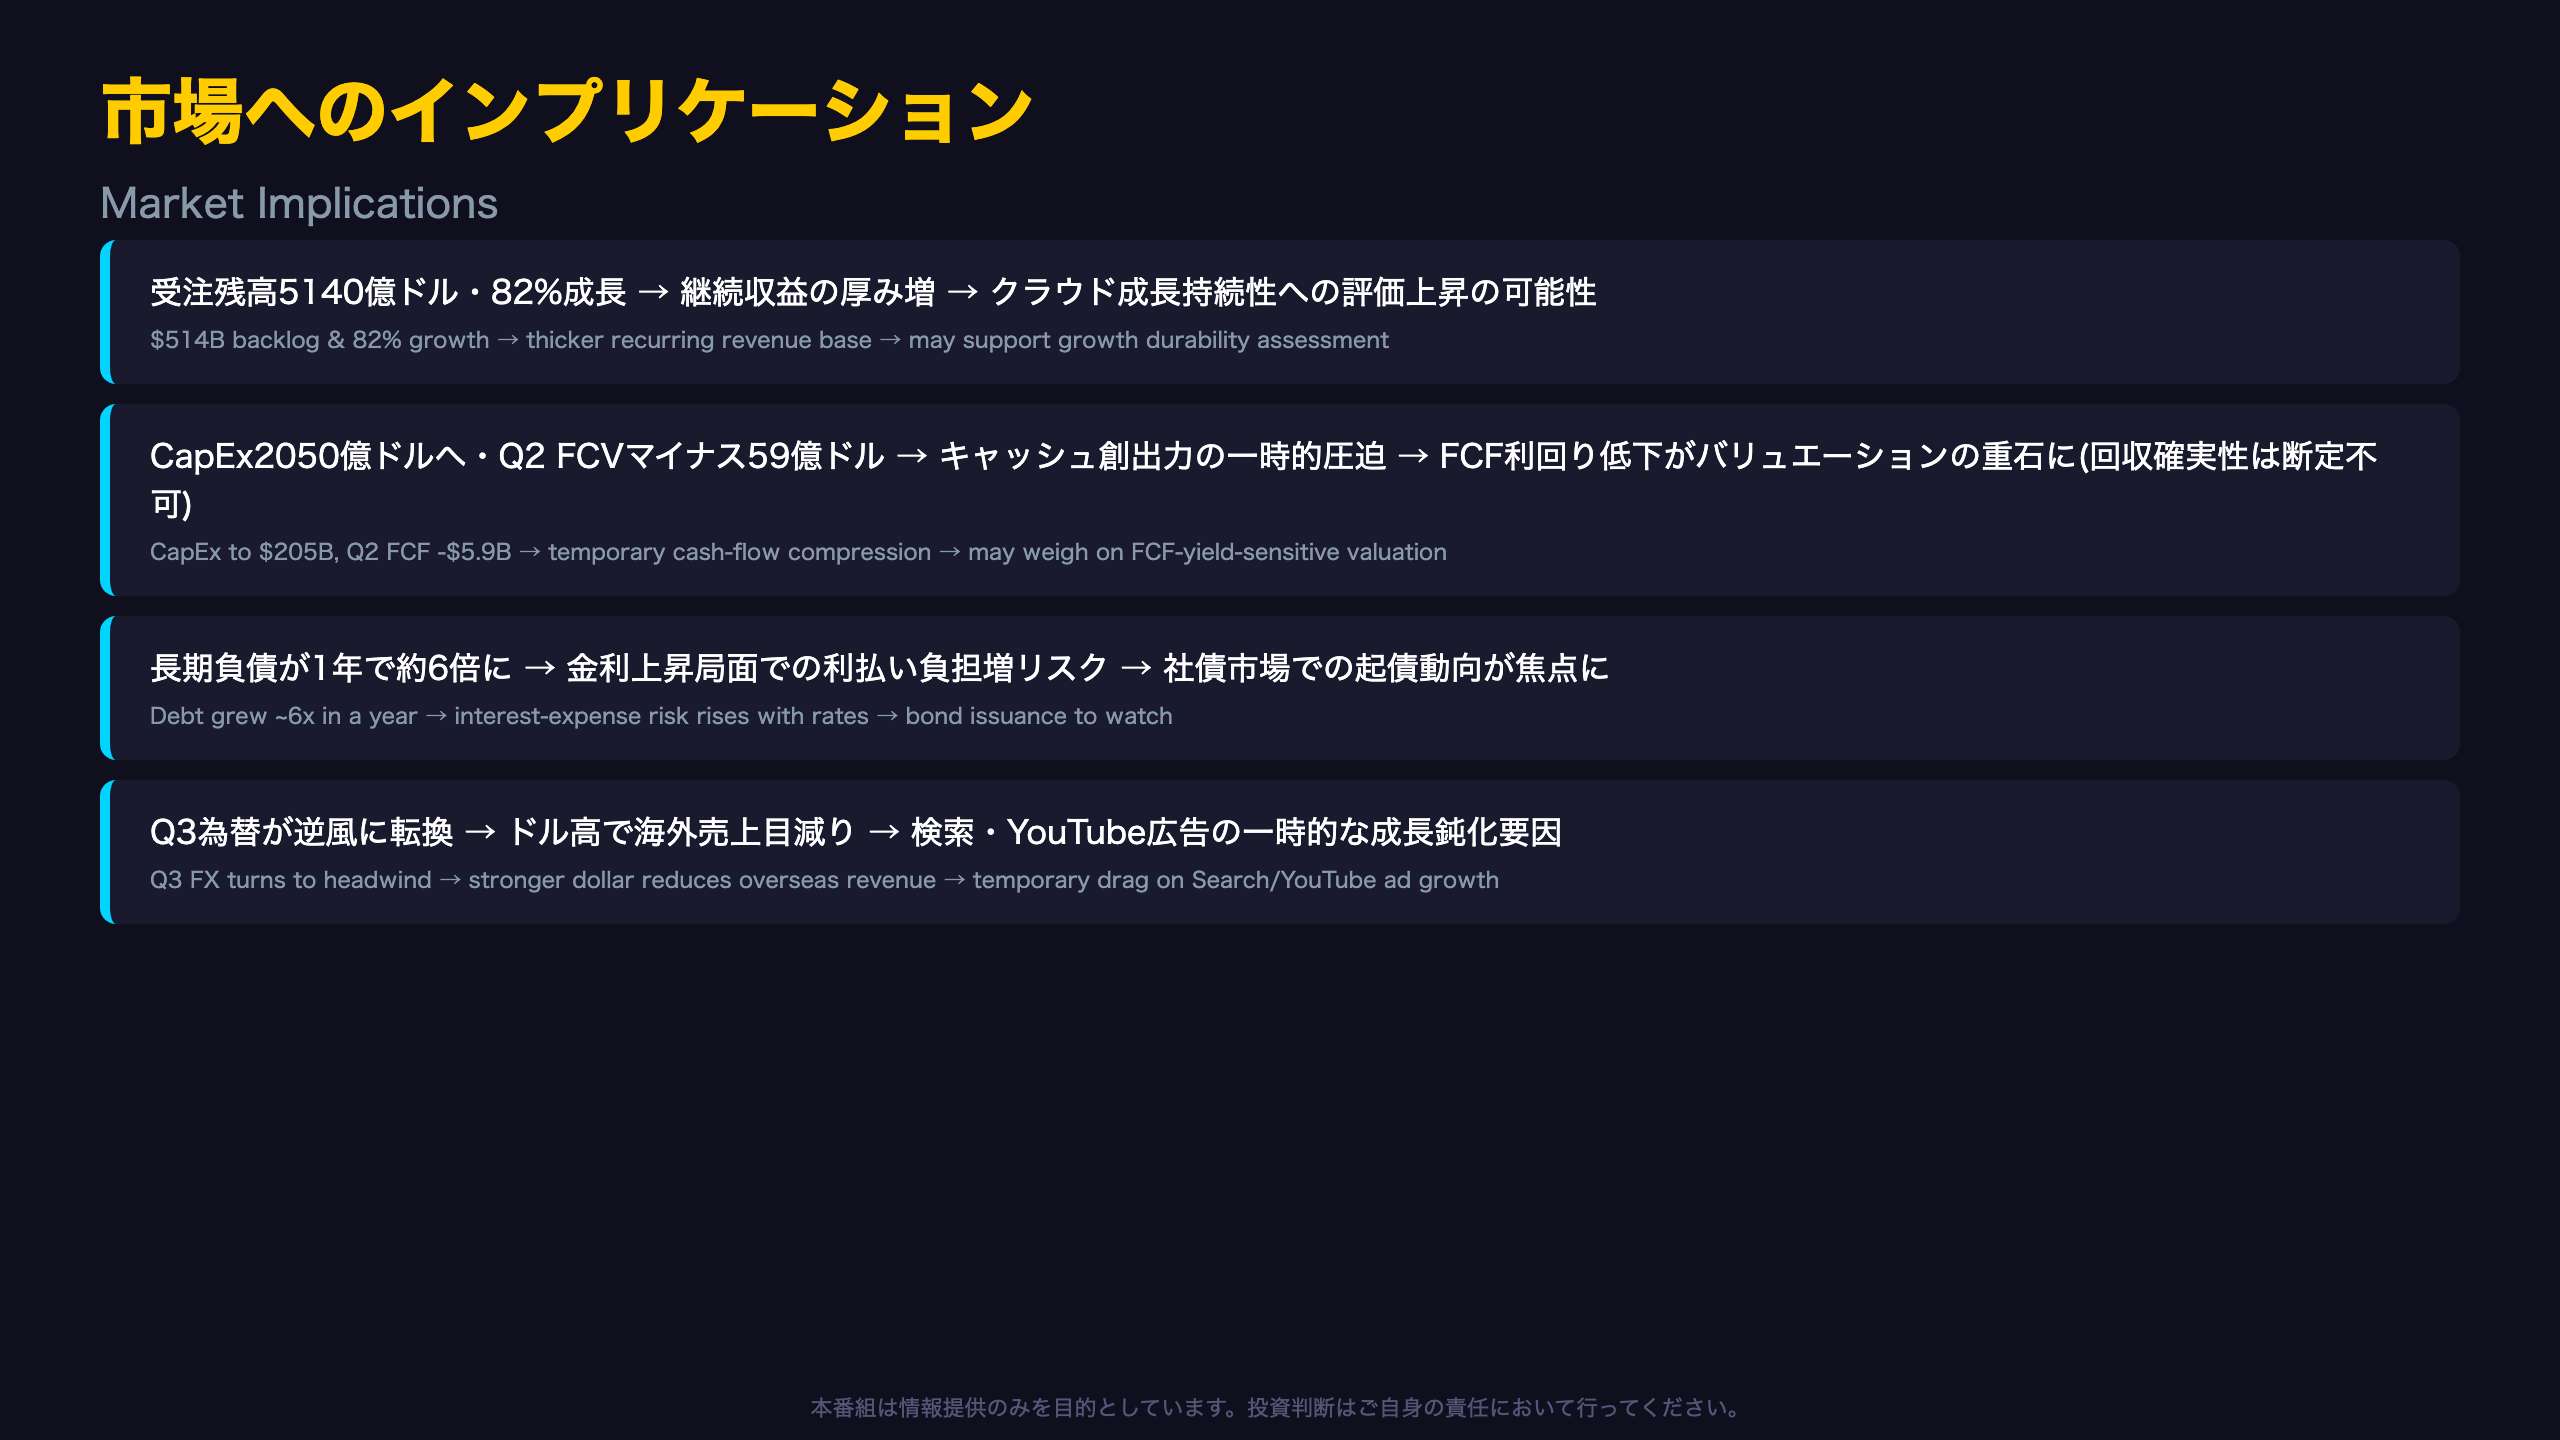
Chain 1: A $514 billion cloud backlog with 82% YoY growth → thickens the base of recurring GCP-contract revenue → could support the market’s assessment of medium-term cloud growth durability, since backlog visibility reduces forecasting uncertainty for analysts.
Chain 2: FY CapEx guidance raised to $205 billion and Q2 free cash flow at -$5.9 billion → large upfront capital spending mechanically compresses near-term cash generation → this could weigh on valuation multiples sensitive to free cash flow yield in the short run. However, whether this investment ultimately pays off cannot be confirmed from this data alone.
Chain 3: Long-term debt roughly sextupled in a year, from ~$16 billion to ~$100 billion → rising leverage increases interest-expense sensitivity in a higher-rate environment → Alphabet’s future bond issuance and credit spreads become a data point worth monitoring, especially relative to peers like Microsoft and Amazon who are also raising debt for AI capex.
Chain 4: Q3 FX is expected to swing from a tailwind to a headwind → a stronger dollar mechanically reduces the dollar value of overseas revenue → this could act as a temporary drag on reported (though not necessarily underlying) Search and YouTube ad growth rates.
What to watch at the next earnings call
Three items should anchor the Q3 review: (1) the actual magnitude of cloud margin pressure from third-party capacity leasing, (2) the realized size of the FX headwind, and (3) further detail on 2027 CapEx plans, which management explicitly deferred to “a later date.”
Disclaimer: This article is for informational purposes only. All investment decisions are made solely at your own risk.