
📺 Watch the Full Video Analysis
This article was automatically generated by the NFC Market Live AI analysis system. (Updated: 2026-10-09 21:40 JST)
📄 Primary Source
Statistics Canada
https://www150.statcan.gc.ca/n1/daily-quotidien/261009/dq261009a-eng.htm
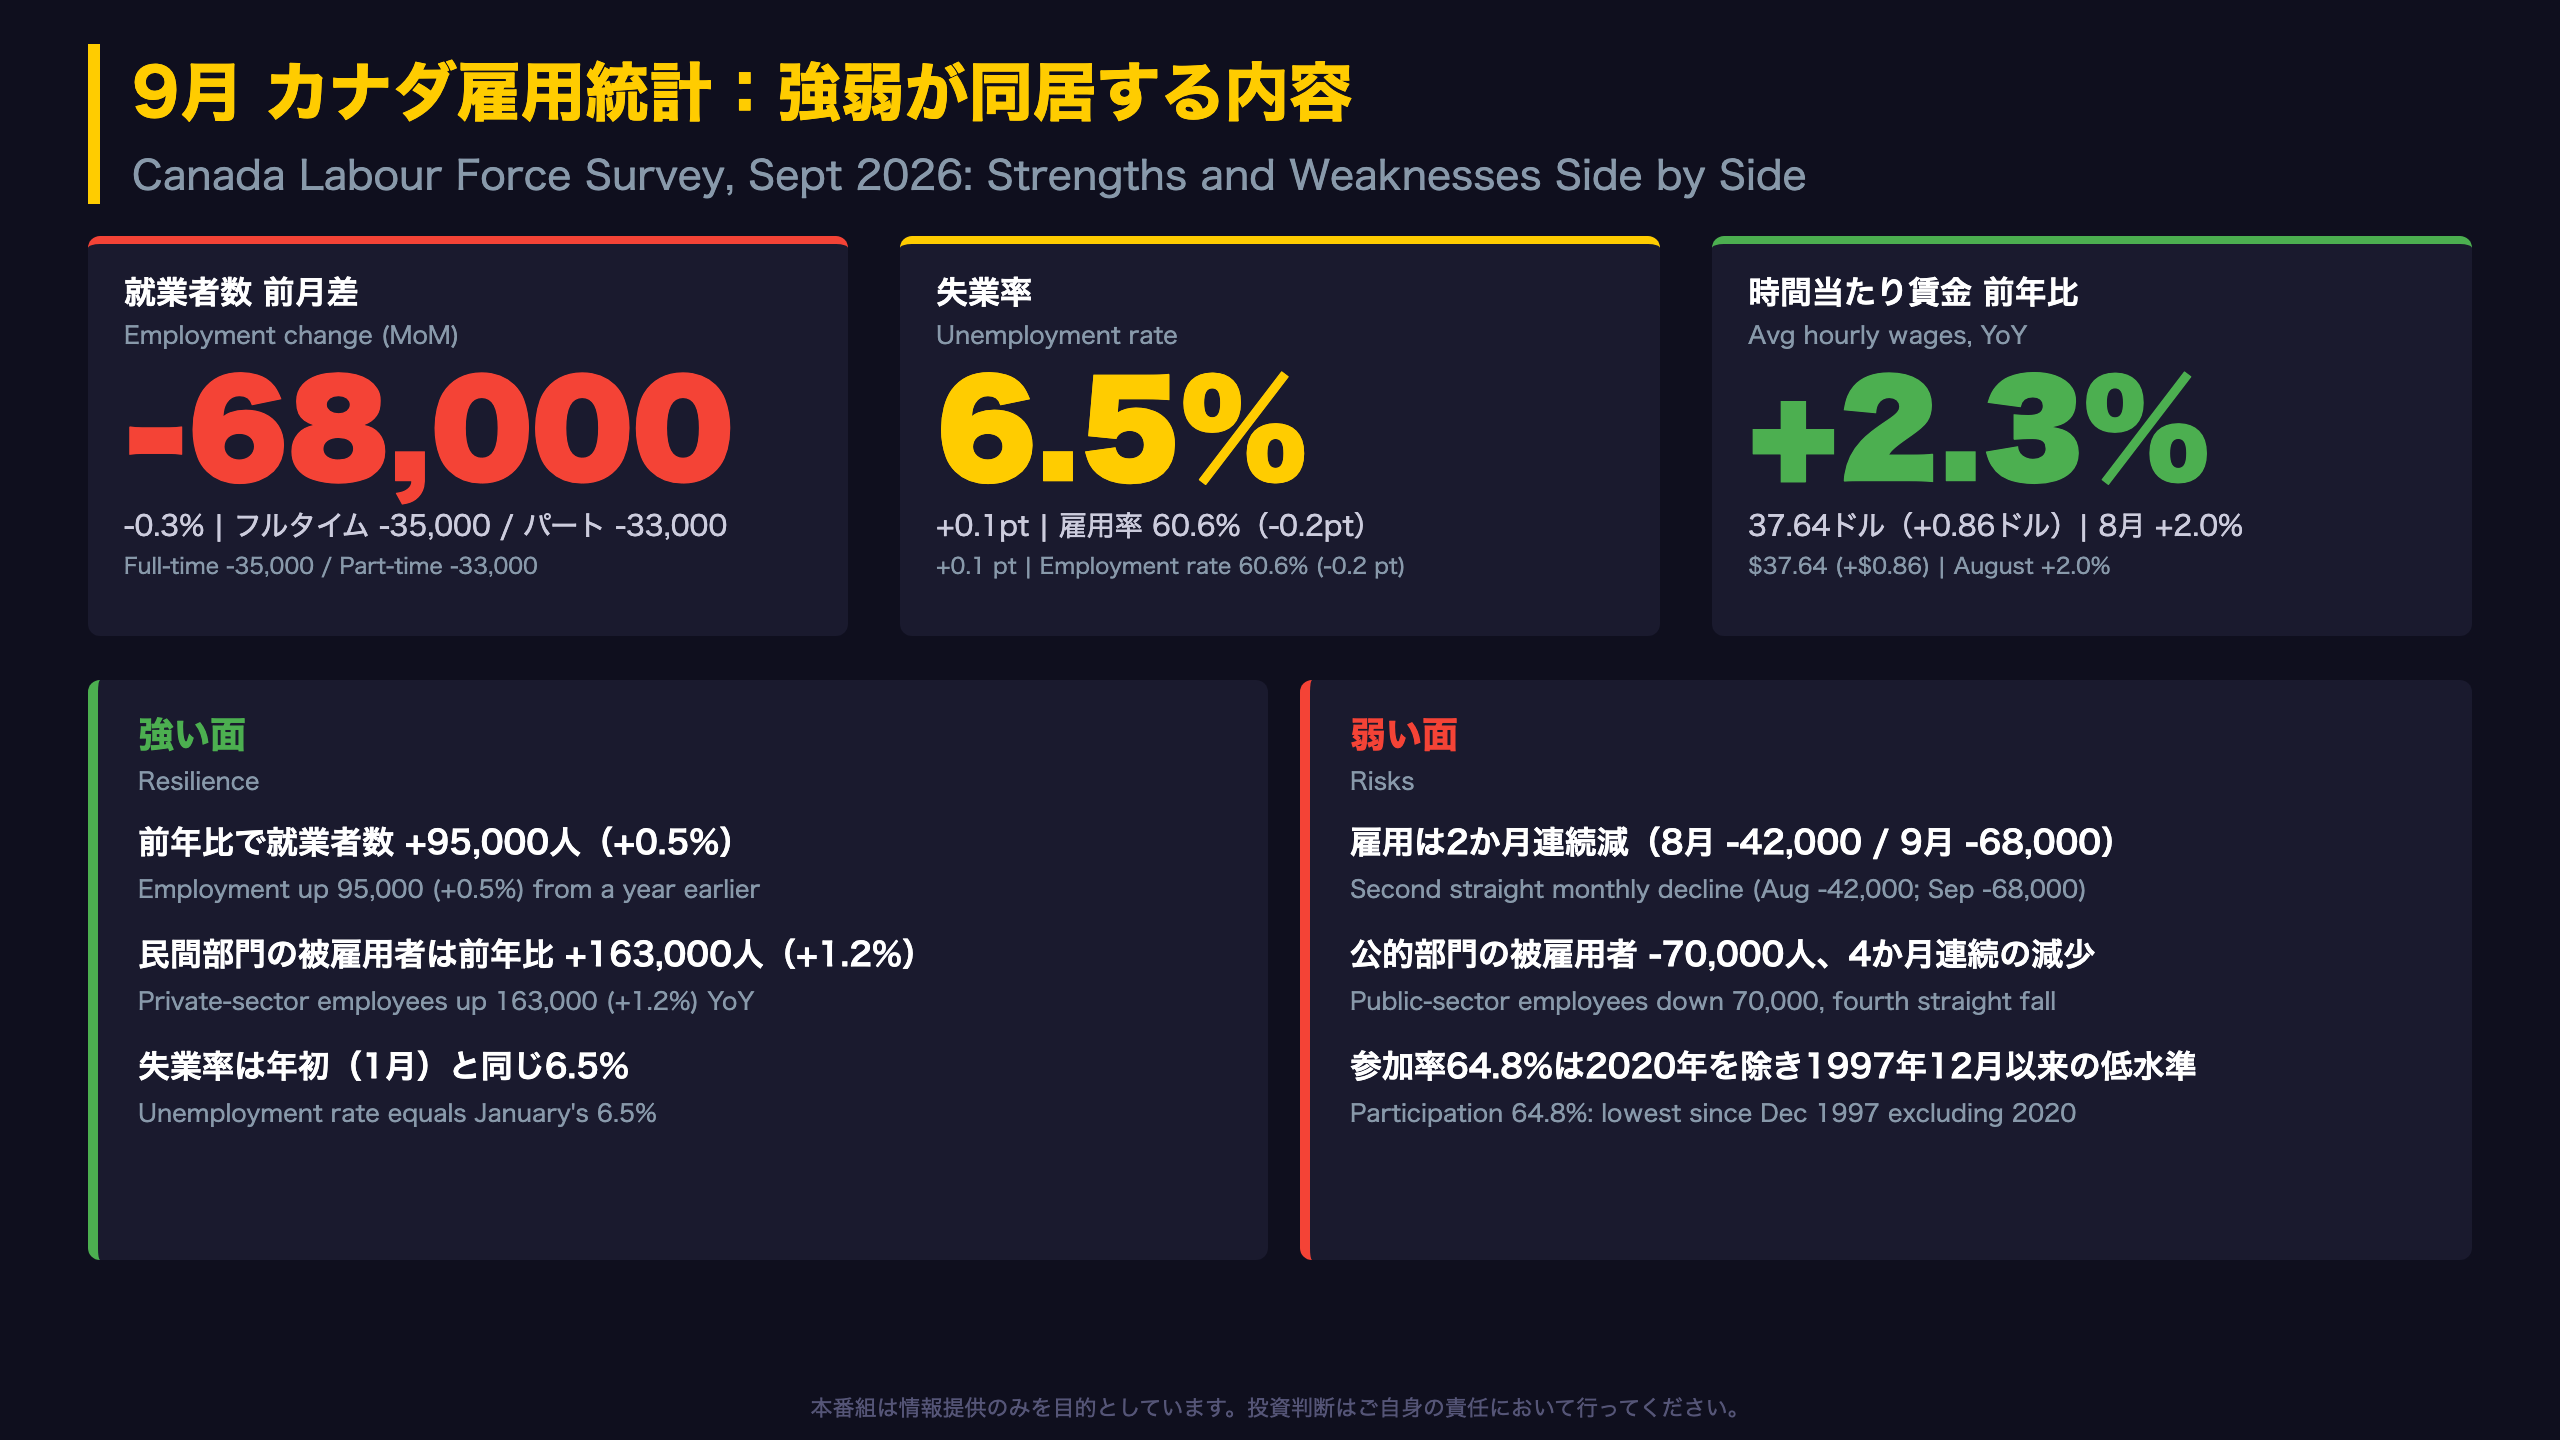
📊 Statistics Canada’s September Labour Force Survey (Oct 9): employment fell 68,000 (-0.3%), a second straight monthly decline, and the unemployment rate rose 0.1 pt to 6.5%.
📈 Yet employment is still up 95,000 year over year, private-sector employees are up 1.2%, and average hourly wages rose 2.3% to $37.64.
⚠️ Public-sector employment fell for a fourth month and participation (64.8%) is the lowest since Dec 1997 excluding 2020, largely due to population aging.
💡 Quebec dropped sharply while Alberta gained. Next release: Nov 6 (October data).
The Ultimate Summary:雇用は2か月連続減、前年比の底堅さは維持
September LFS: Soft Month, Resilient Year
What is the LFS? The Labour Force Survey is Statistics Canada’s monthly household survey (about 65,000 households) and the first labour-market release each month. It is the Canadian counterpart of the US nonfarm payrolls and household survey, but Canada’s headline is the household-based employment change rather than an establishment survey.
Key numbers
- Employment: -68,000 (-0.3%), after -42,000 in August
- Unemployment rate: 6.5% (+0.1 pt), equal to January
- Employment rate: 60.6% (-0.2 pt), unchanged from a year ago
- Average hourly wages: +2.3% YoY ($37.64), versus +2.0% in August
Context
Employment had risen by 181,000 (+0.9%) between April and July, so the two-month slide partly retraces that gain. Year over year, employment is still up 95,000 (+0.5%) and private-sector employees are up 163,000 (+1.2%).
Caveat
Statistics Canada flags results at a 68% confidence level, a looser bar than the 90% level common in US releases. Monthly moves are noisy, so the two-month pattern and year-over-year figures matter more than any single print.
Why it matters internationally
The report contains no reference to the Bank of Canada. For readers tracking CAD, the facts to monitor are the unemployment rate, wage growth and the pace of job changes in the October release on November 6.
雇用の内訳:フルタイム・パート・部門別
Anatomy of the September Employment Decline
Full-time versus part-time
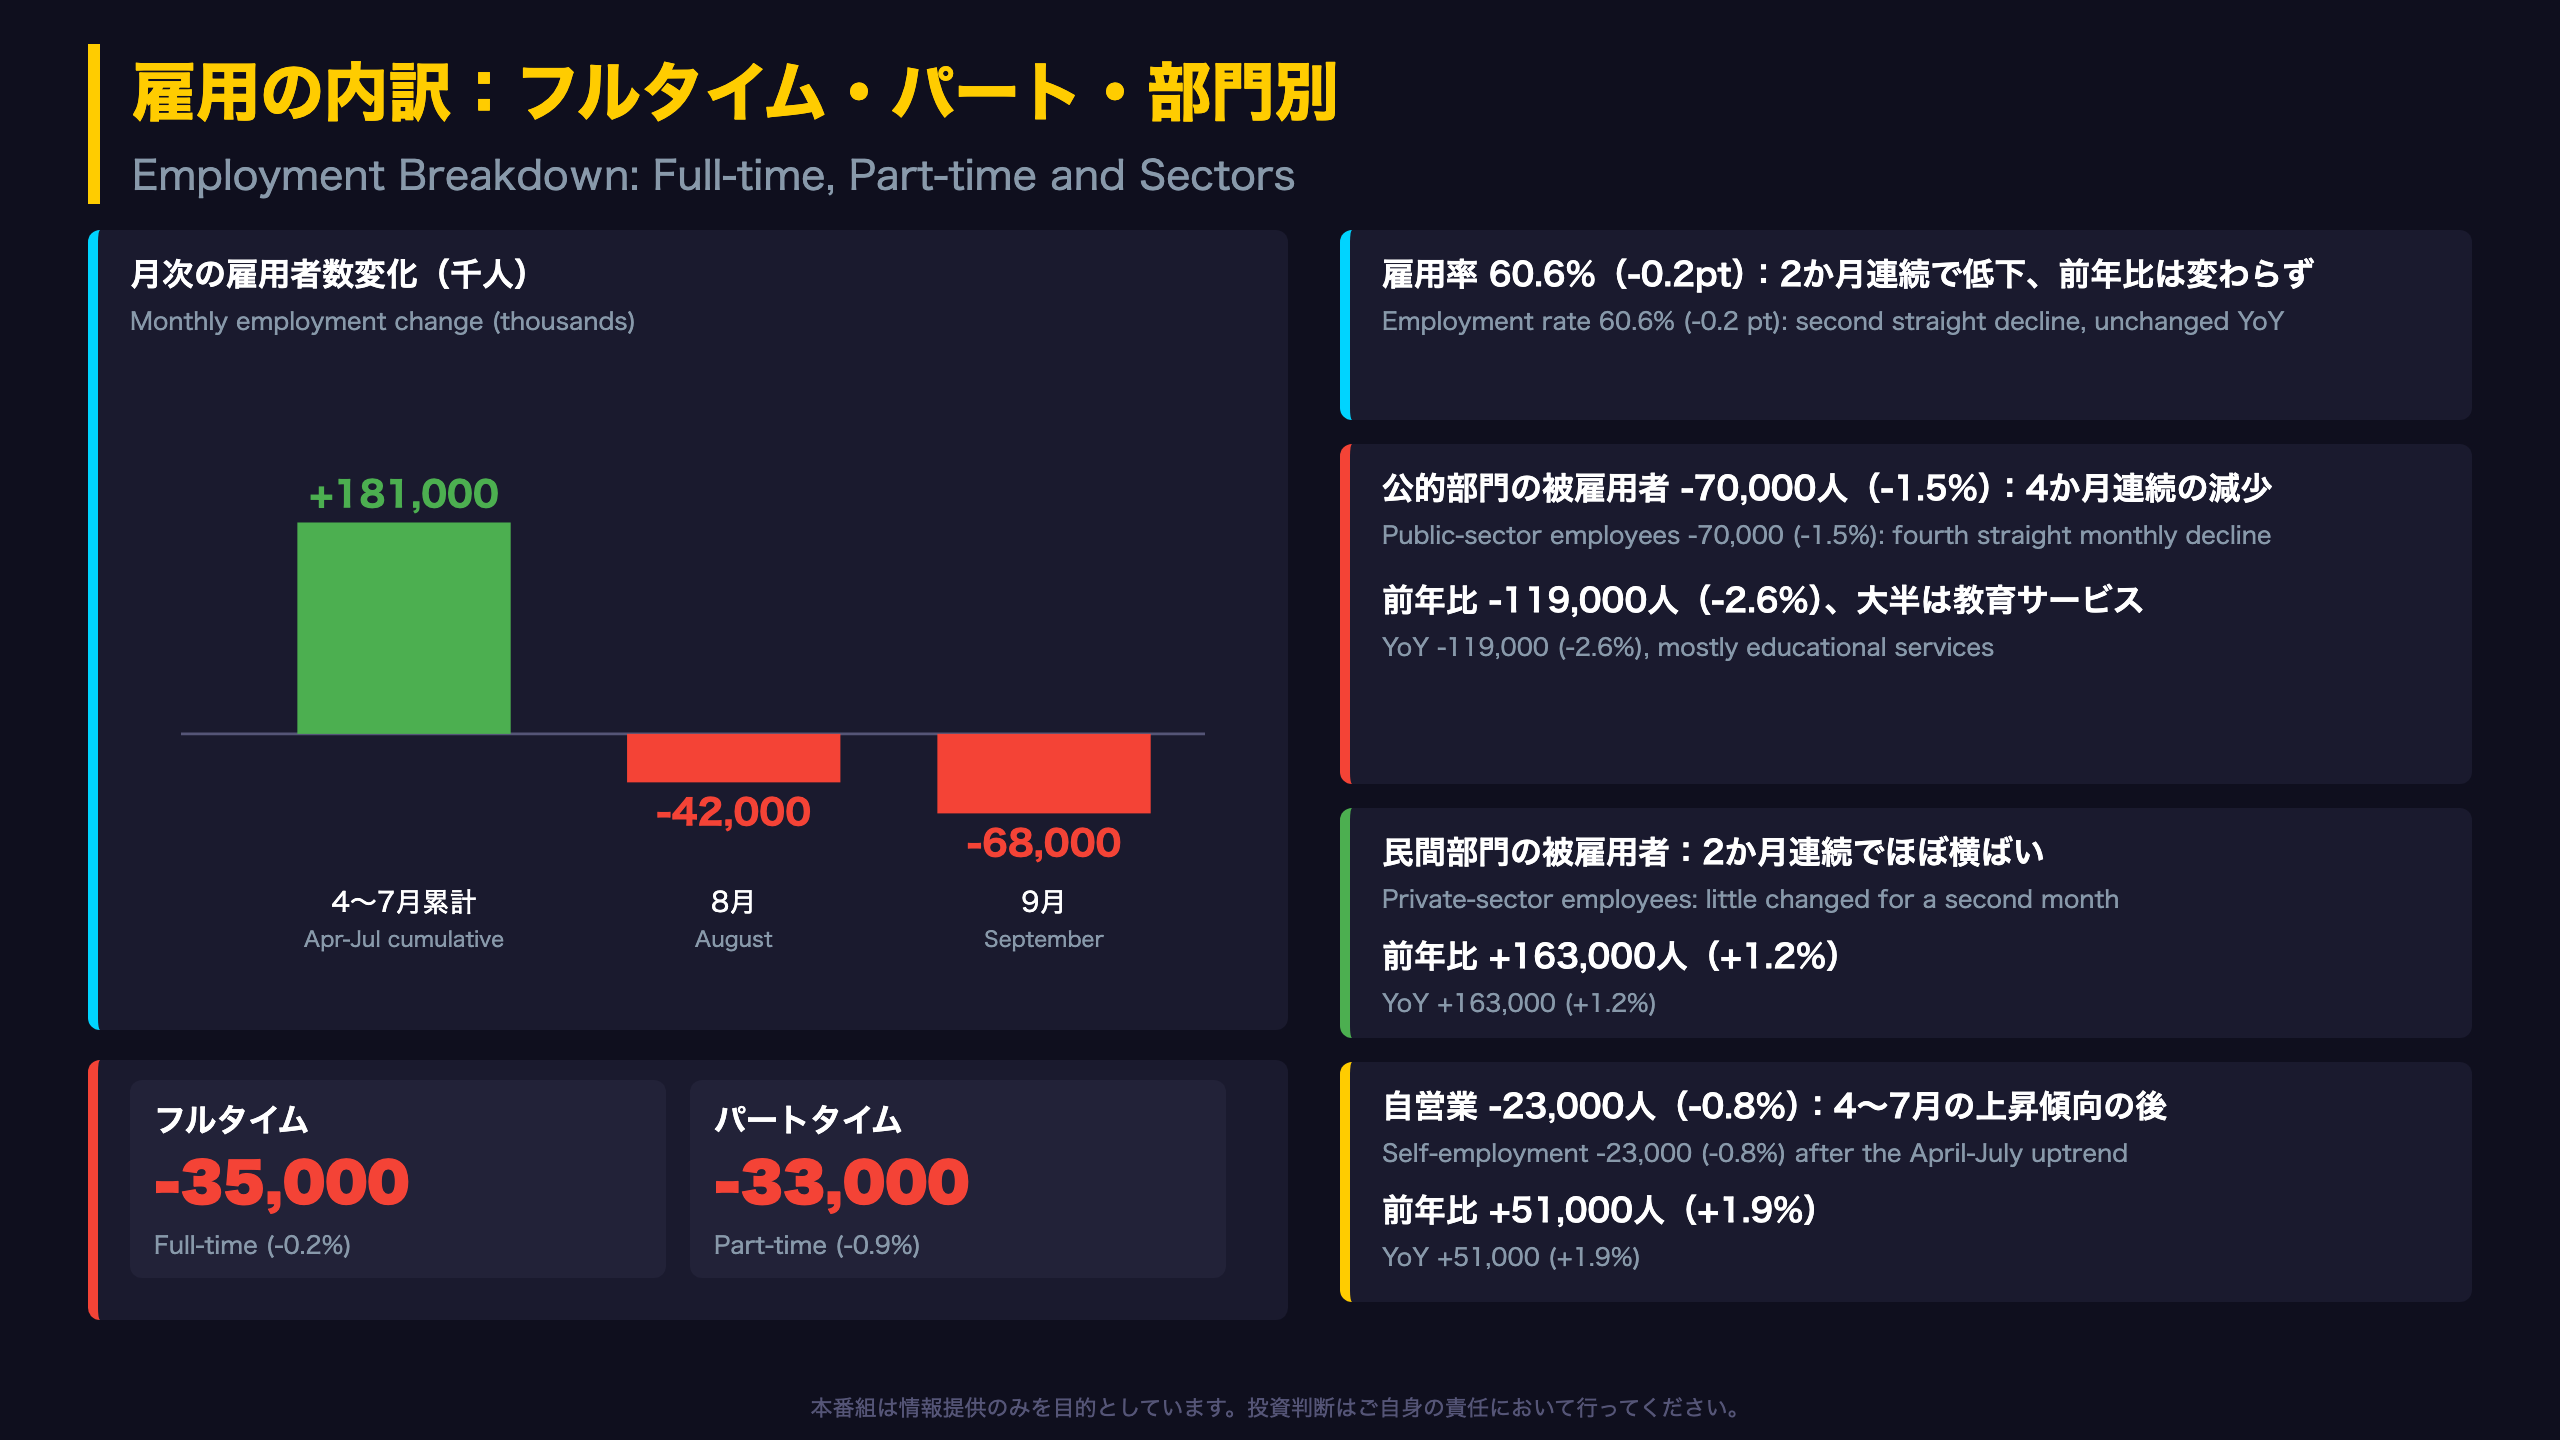
The 68,000 decline was split between full-time (-35,000, -0.2%) and part-time (-33,000, -0.9%) work. Statistics Canada defines full-time as usually working 30 hours or more per week. Because part-time employment is a smaller base, the percentage drop is larger even though the headcounts are similar.
Timeline
- April-July: +181,000 (+0.9%)
- August: -42,000 (-0.2%)
- September: -68,000 (-0.3%)
The two-month slide of about 110,000 erases part of the spring and summer gains, yet employment is still +95,000 (+0.5%) year over year.
Public versus private
Public-sector employees fell 70,000 (-1.5%), the fourth straight monthly decline, and are down 119,000 (-2.6%) from a year ago, mostly in educational services. Private-sector employees were little changed for a second month but are up 163,000 (+1.2%) year over year. Self-employment fell 23,000 (-0.8%) but is up 51,000 (+1.9%) on the year.
Two readings
- Constructive: the year-over-year private-sector gain persists, and the weakness is concentrated in the public sector.
- Cautious: the employment rate has now declined two months in a row to 60.6%, and private-sector gains have stalled.
What to watch
The October release on November 6 will show whether public-sector declines extend to a fifth month and whether private employment resumes growth. For international readers, note that the Canadian public sector here includes education and health institutions, which makes it larger relative to total employment than a narrow government-payroll definition.
失業率・参加率と人口高齢化の影響
Unemployment, Participation and the Aging Effect
Unemployment path
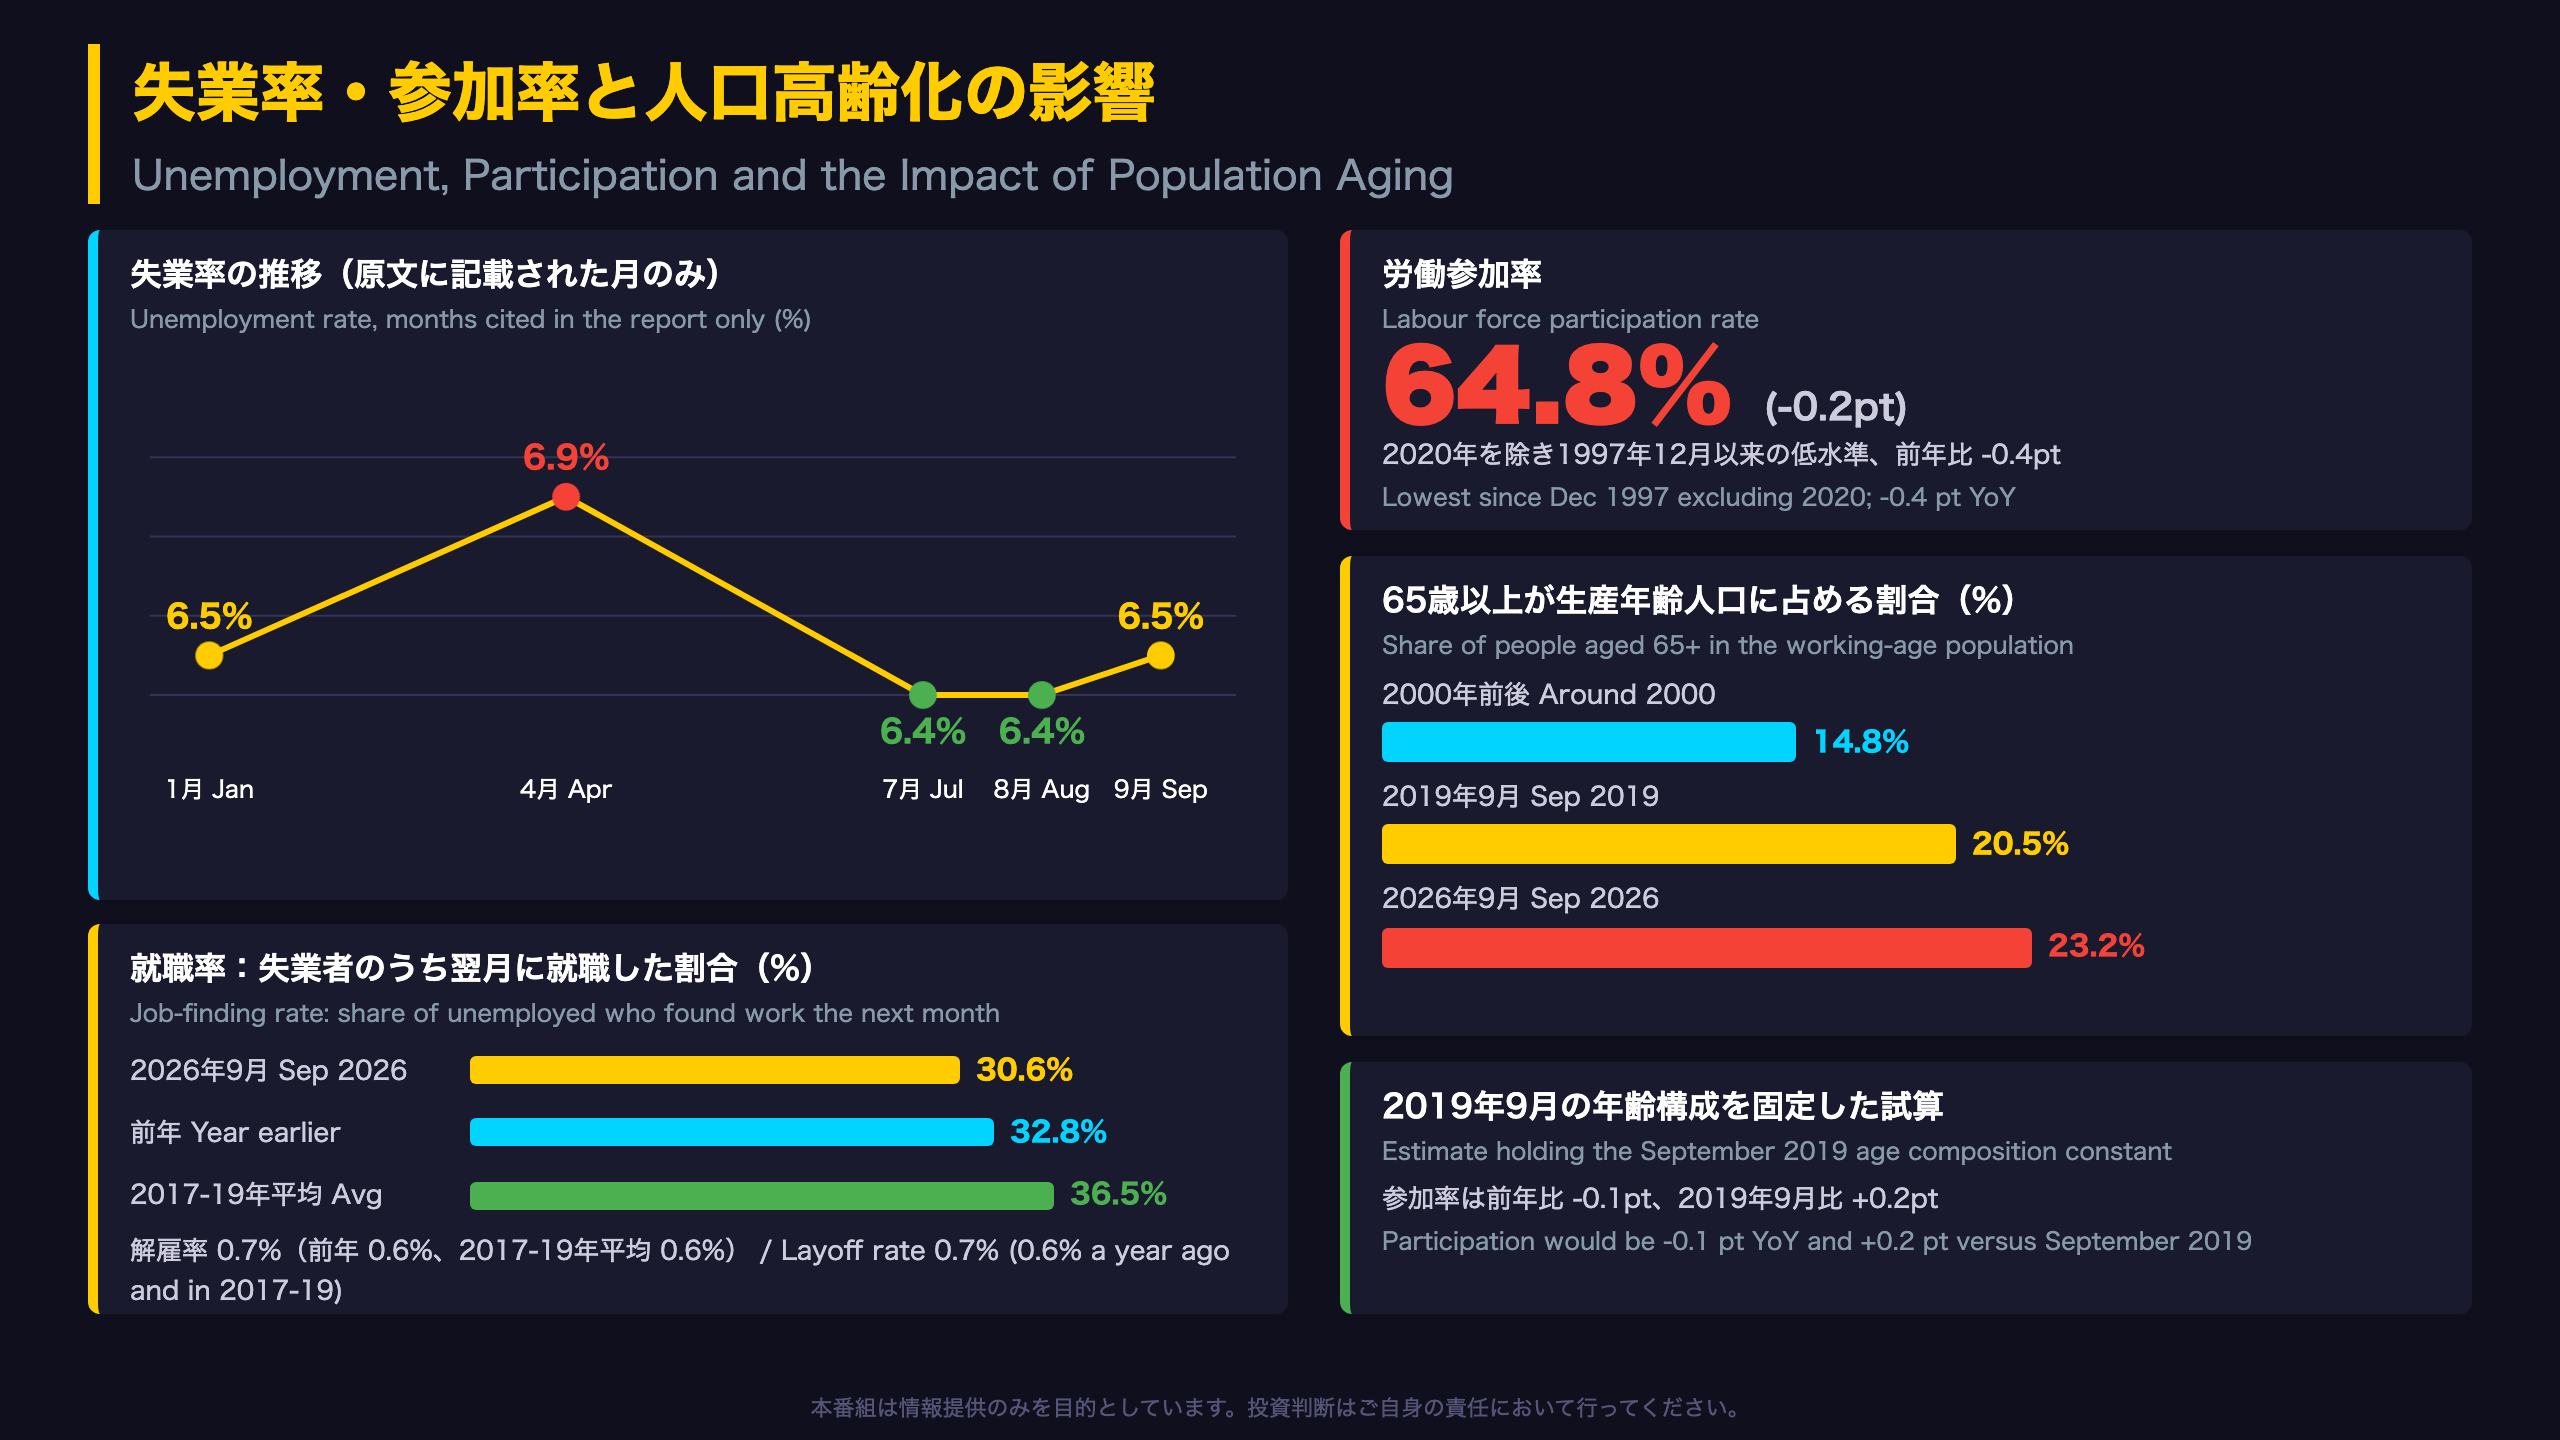
The report cites 6.5% in January, a recent peak of 6.9% in April, 6.4% in July and August, and 6.5% in September. A 0.1-point move is small relative to sampling variability in a monthly household survey, so the safest reading is that the rate is back where it started the year.
Flow indicators
- Layoff rate: 0.7% (0.6% a year earlier and in 2017-2019), not seasonally adjusted
- Job-finding rate: 30.6%, versus 32.8% a year ago and a 36.5% pre-pandemic average
Layoffs are not elevated, but unemployed people are finding work more slowly than before the pandemic.
Participation: headline versus composition
Participation fell 0.2 points to 64.8%, the lowest since December 1997 excluding 2020, and is down 0.4 points YoY. Statistics Canada argues the decline is largely demographic. Keeping the September 2019 age structure fixed, participation would be only 0.1 point lower than a year ago and 0.2 point higher than in September 2019.
Why aging matters
People 65 and older are 23.2% of the working-age population, versus 20.5% in September 2019 and 14.8% around 2000. Rapid immigration in 2023-2024 briefly offset aging, but the trend resumed in 2025.
International comparison
The US also faces an aging-related drift in participation, but Canada’s figure is distinctive because the survey population includes temporary residents, whose numbers have been volatile. For investors, a falling headline participation rate can lower unemployment mechanically, so the composition-adjusted view is a useful cross-check.
年齢・性別・業種別:若年層と教育サービスに偏る減少
Who Lost Jobs, and in Which Industries
Youth: exit rather than unemployment
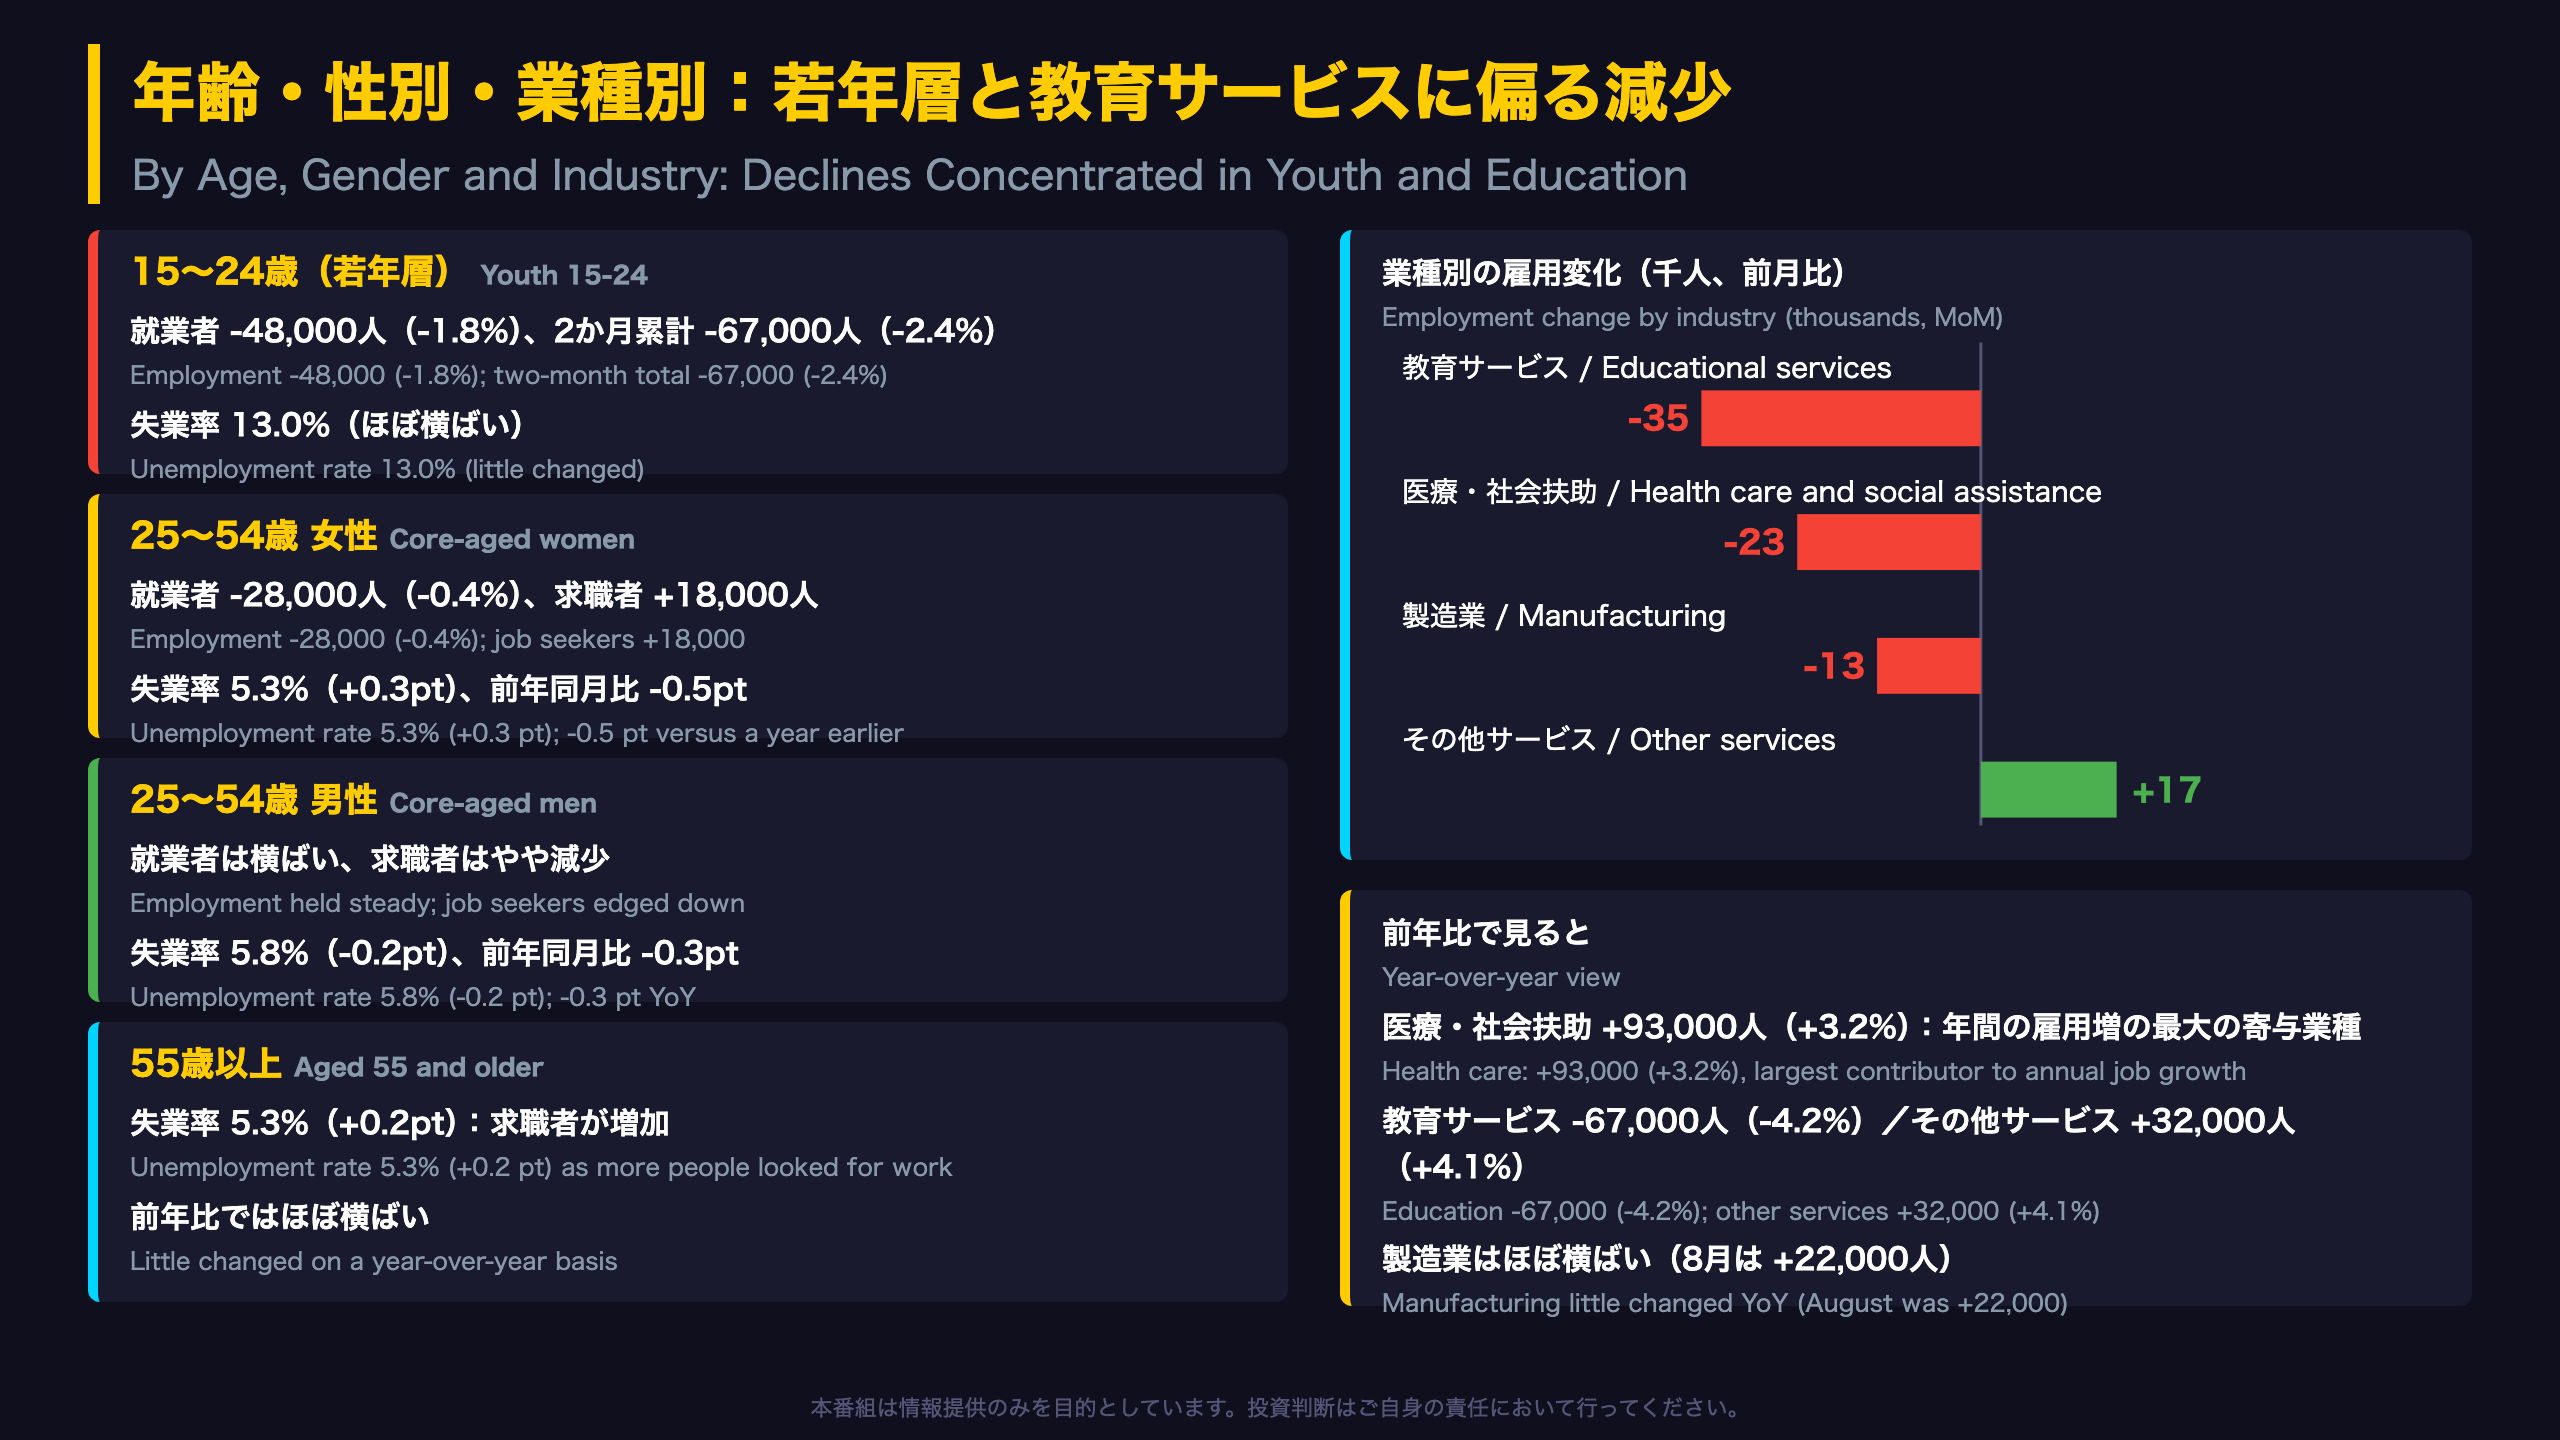
Employment among 15-to-24-year-olds fell 48,000 (-1.8%), while the youth labour force also fell 50,000 (-1.6%). Because people left the labour force rather than joining the jobless count, the youth unemployment rate stayed near 13.0%. The two-month drop of 67,000 (-2.4%) offsets the April-July gains.
Core-aged adults (25-54) and older workers
- Women: unemployment rate 5.3% (+0.3 pt), yet 0.5 pt lower than a year ago and 0.6 pt below April’s 5.9% peak
- Men: 5.8% (-0.2 pt), with employment steady
- Aged 55+: 5.3% (+0.2 pt), little changed YoY
Industry detail
| Industry | September (MoM) | YoY |
|---|---|---|
| Educational services | -35,000 (-2.2%) | -67,000 (-4.2%) |
| Health care & social assistance | -23,000 (-0.8%) | +93,000 (+3.2%) |
| Manufacturing | -13,000 (-0.7%) | little changed |
| Other services | +17,000 (+2.1%) | +32,000 (+4.1%) |
The year-over-year decline in education is concentrated in Quebec (-7.0%), Ontario (-3.2%) and Alberta (-9.0%).
Balanced reading
Health care’s September decline is its first monthly fall since December 2022 and it remains the largest contributor to the past year’s job growth. Manufacturing fell after a 22,000 gain in August. “Other services” covers repair, maintenance and personal or household services, a small but steady category.
Comparison
Unlike the US, where tariffs and goods trade often dominate manufacturing headlines, the Canadian report gives no causal explanation for these moves, so any attribution beyond the data would be speculation.
州別格差・賃金・次回予定
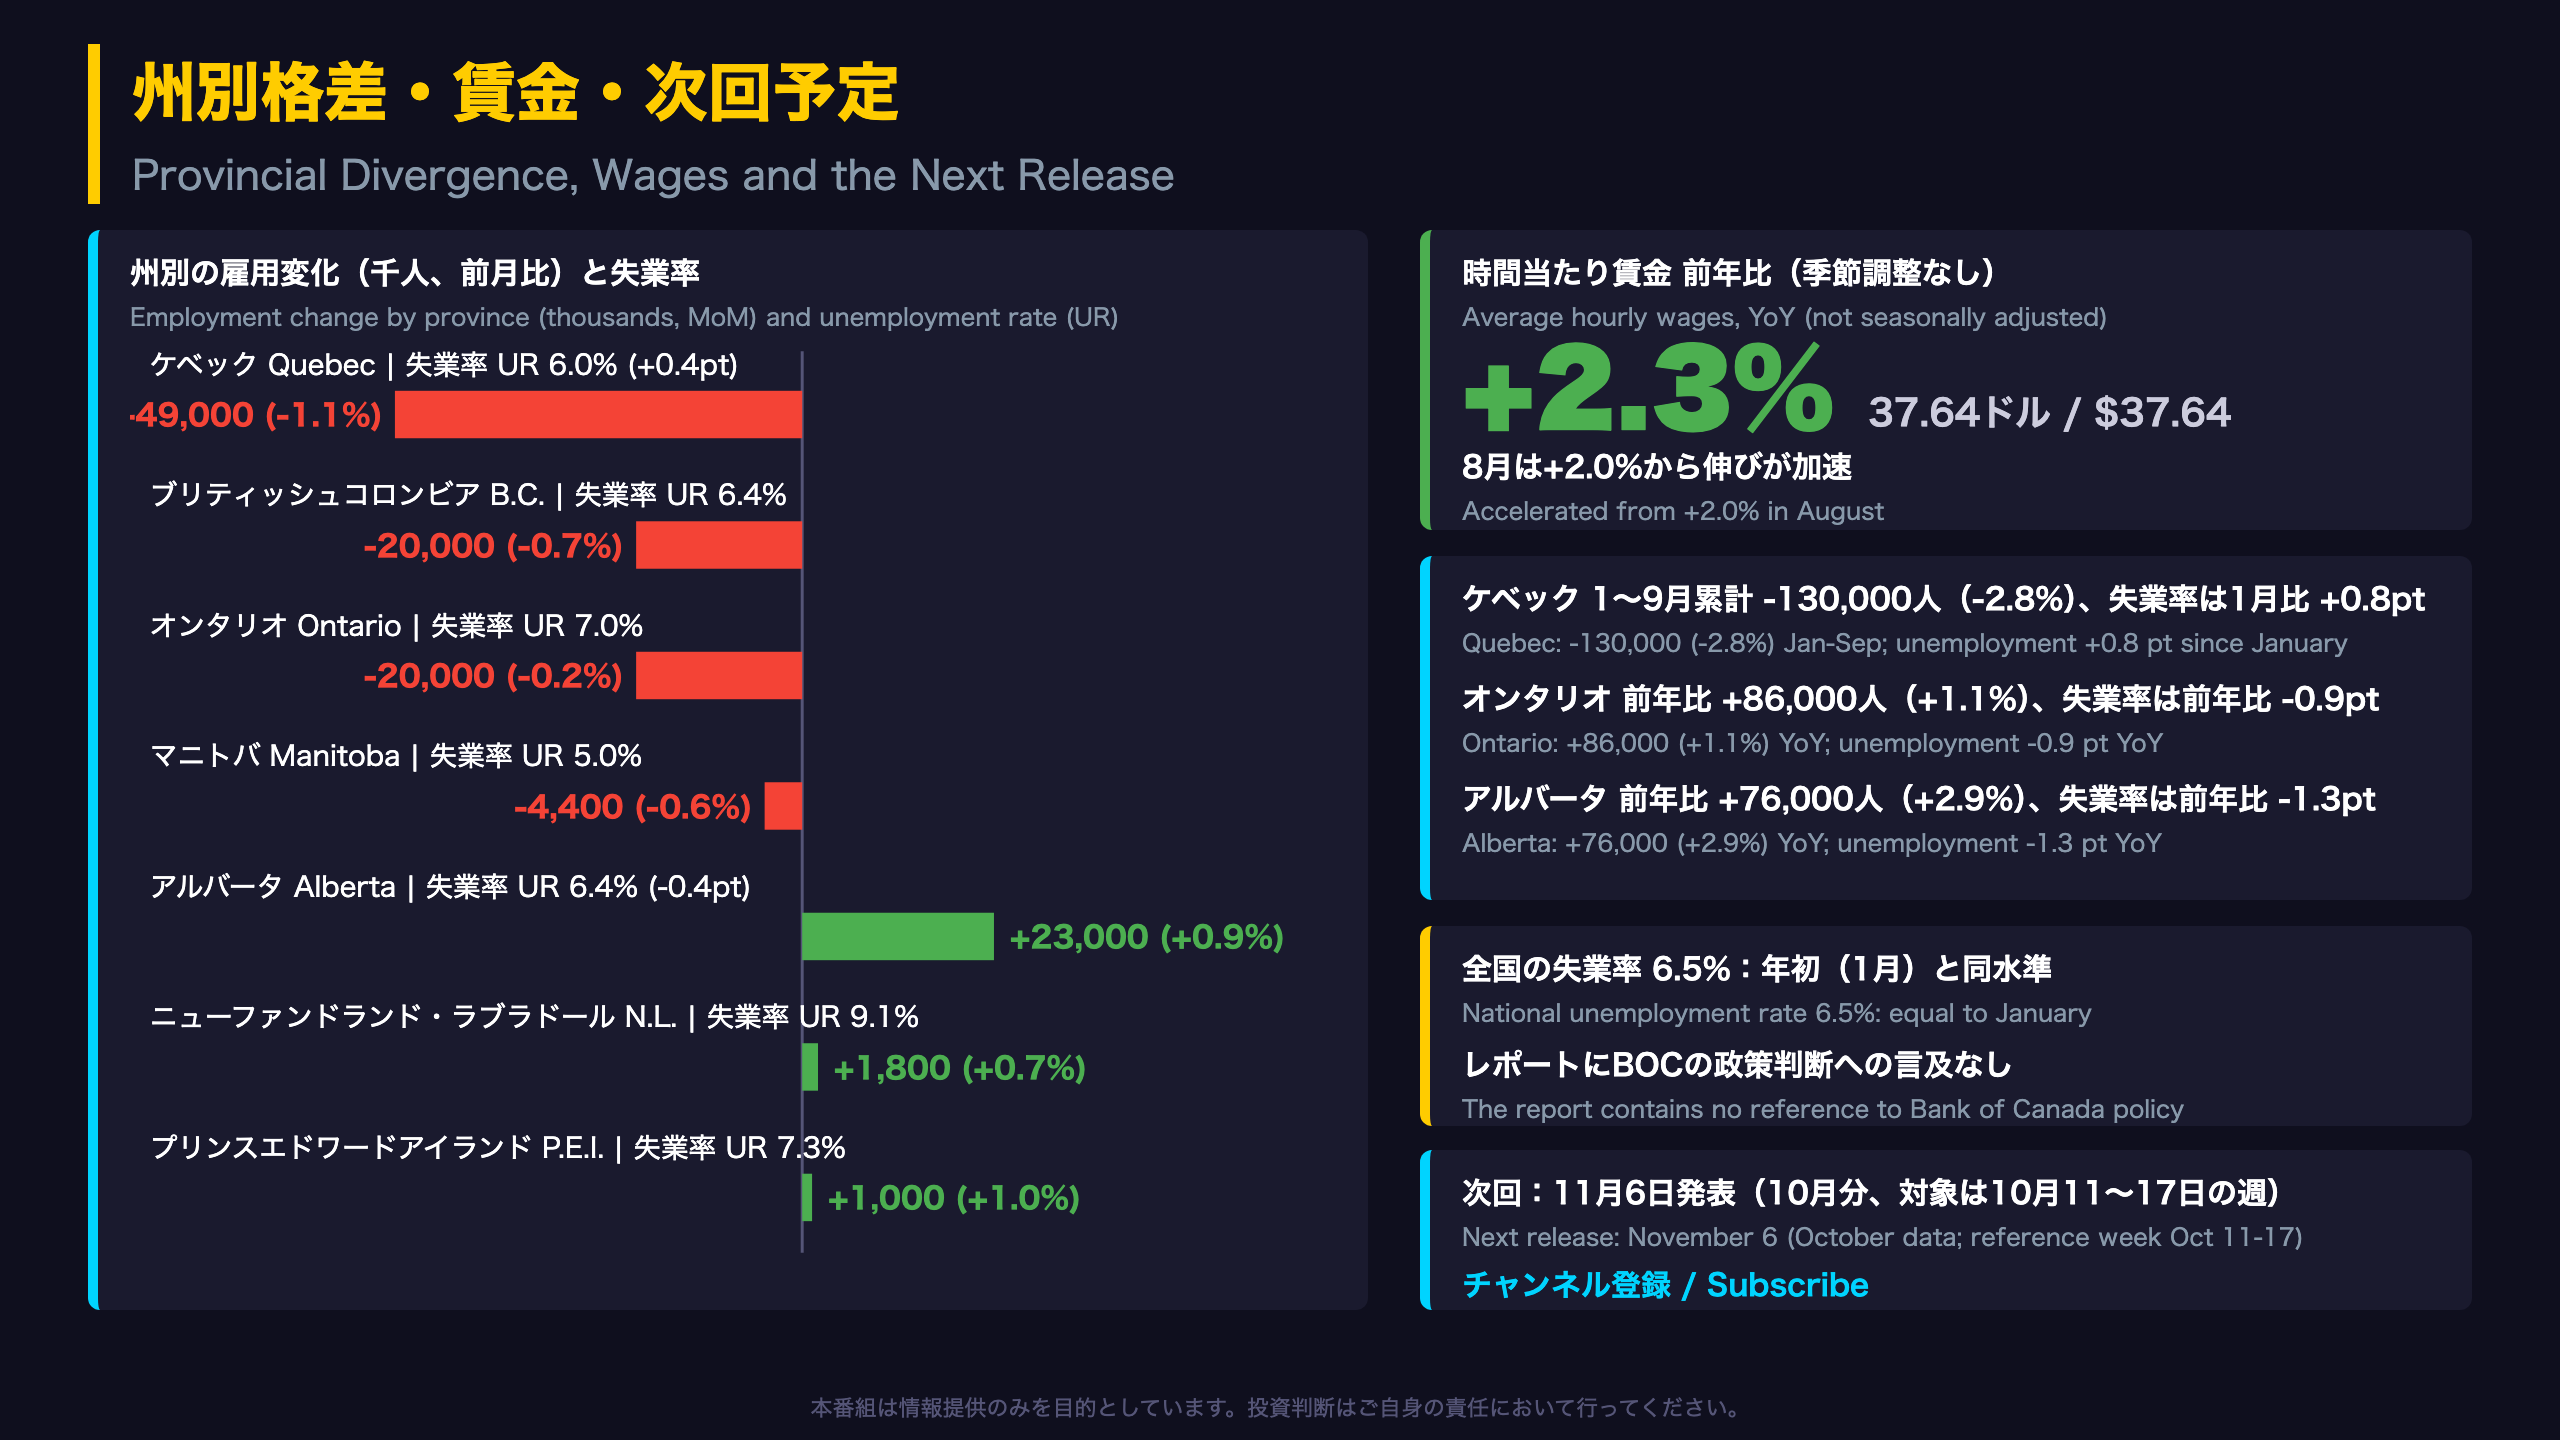
Provincial Divergence, Wages and the BOC Data Angle
Unemployment by province (September, monthly change)
- Newfoundland and Labrador: 9.1% (+0.5 pt)
- Prince Edward Island: 7.3% (-0.6 pt)
- Ontario: 7.0% (+0.1 pt; -0.9 pt YoY)
- Quebec: 6.0% (+0.4 pt; +0.8 pt since January)
- Alberta: 6.4% (-0.4 pt; -1.3 pt YoY)
- Saskatchewan: 5.4% (-0.6 pt); Manitoba: 5.0% (unchanged)
Provincial context
Quebec has lost 130,000 jobs (-2.8%) between January and September. British Columbia’s drop was its first since March, with the employment rate down 0.4 point to 60.5%. Ontario fell 20,000 (-0.2%) on the month but is up 86,000 (+1.1%) year over year. Alberta is up 76,000 (+2.9%) on the year, which is why Western and Central Canada tell different stories.
Wages
Average hourly wages rose 2.3% YoY to $37.64 in September, versus 2.0% in August (not seasonally adjusted). The Bank of Canada watches wage growth alongside core CPI, but this report offers no policy commentary.
For BOC-focused readers
The Bank of Canada is Canada’s central bank. The report does not mention it. What the data establish: unemployment of 6.5% (up from 6.4%), level with January after a 6.9% April peak, and a participation decline that Statistics Canada ties largely to aging. Any inference about the BOC’s stance requires additional sources.
Calendar
The October LFS is due on November 6, covering the week of October 11-17.
Disclaimer: This article is for informational purposes only. All investment decisions are made solely at your own risk.