📺 Watch the Full Video Analysis
This article was automatically generated by the NFC Market Live AI analysis system. (Updated: 2026-10-15 22:08 JST)
📄 Primary Source
Statistics Canada
https://www150.statcan.gc.ca/n1/daily-quotidien/261015/dq261015b-eng.htm
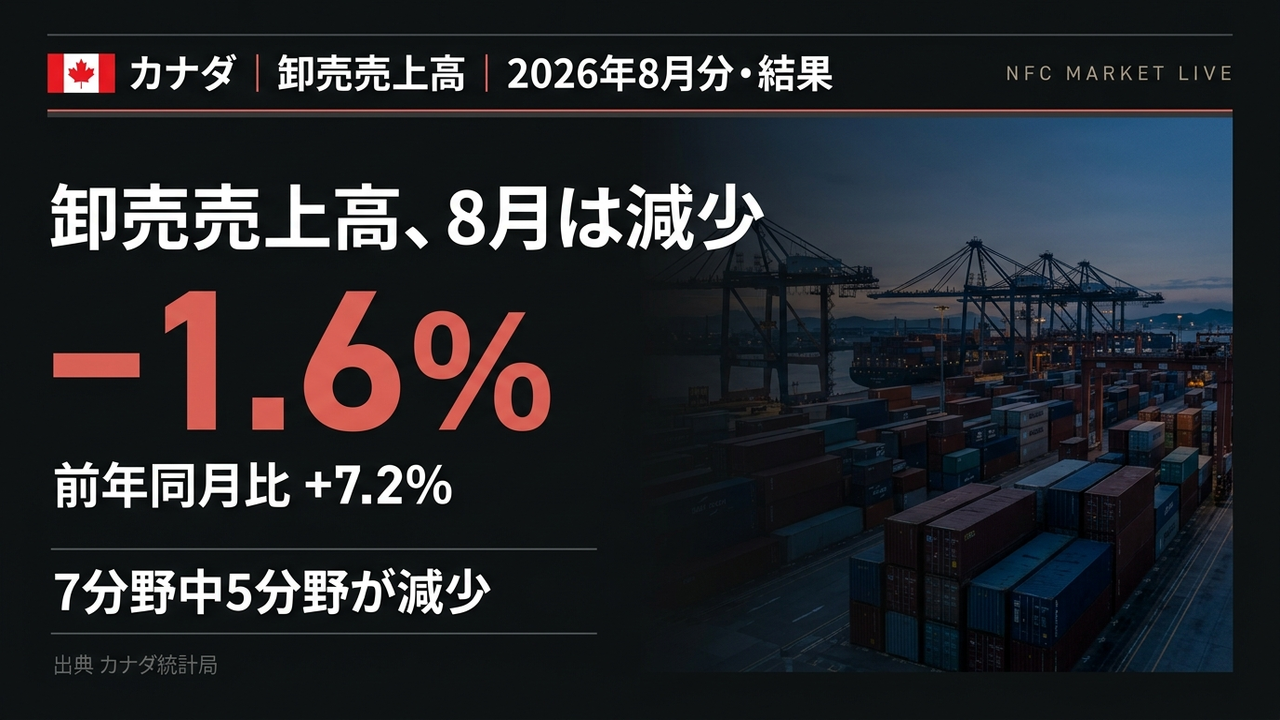
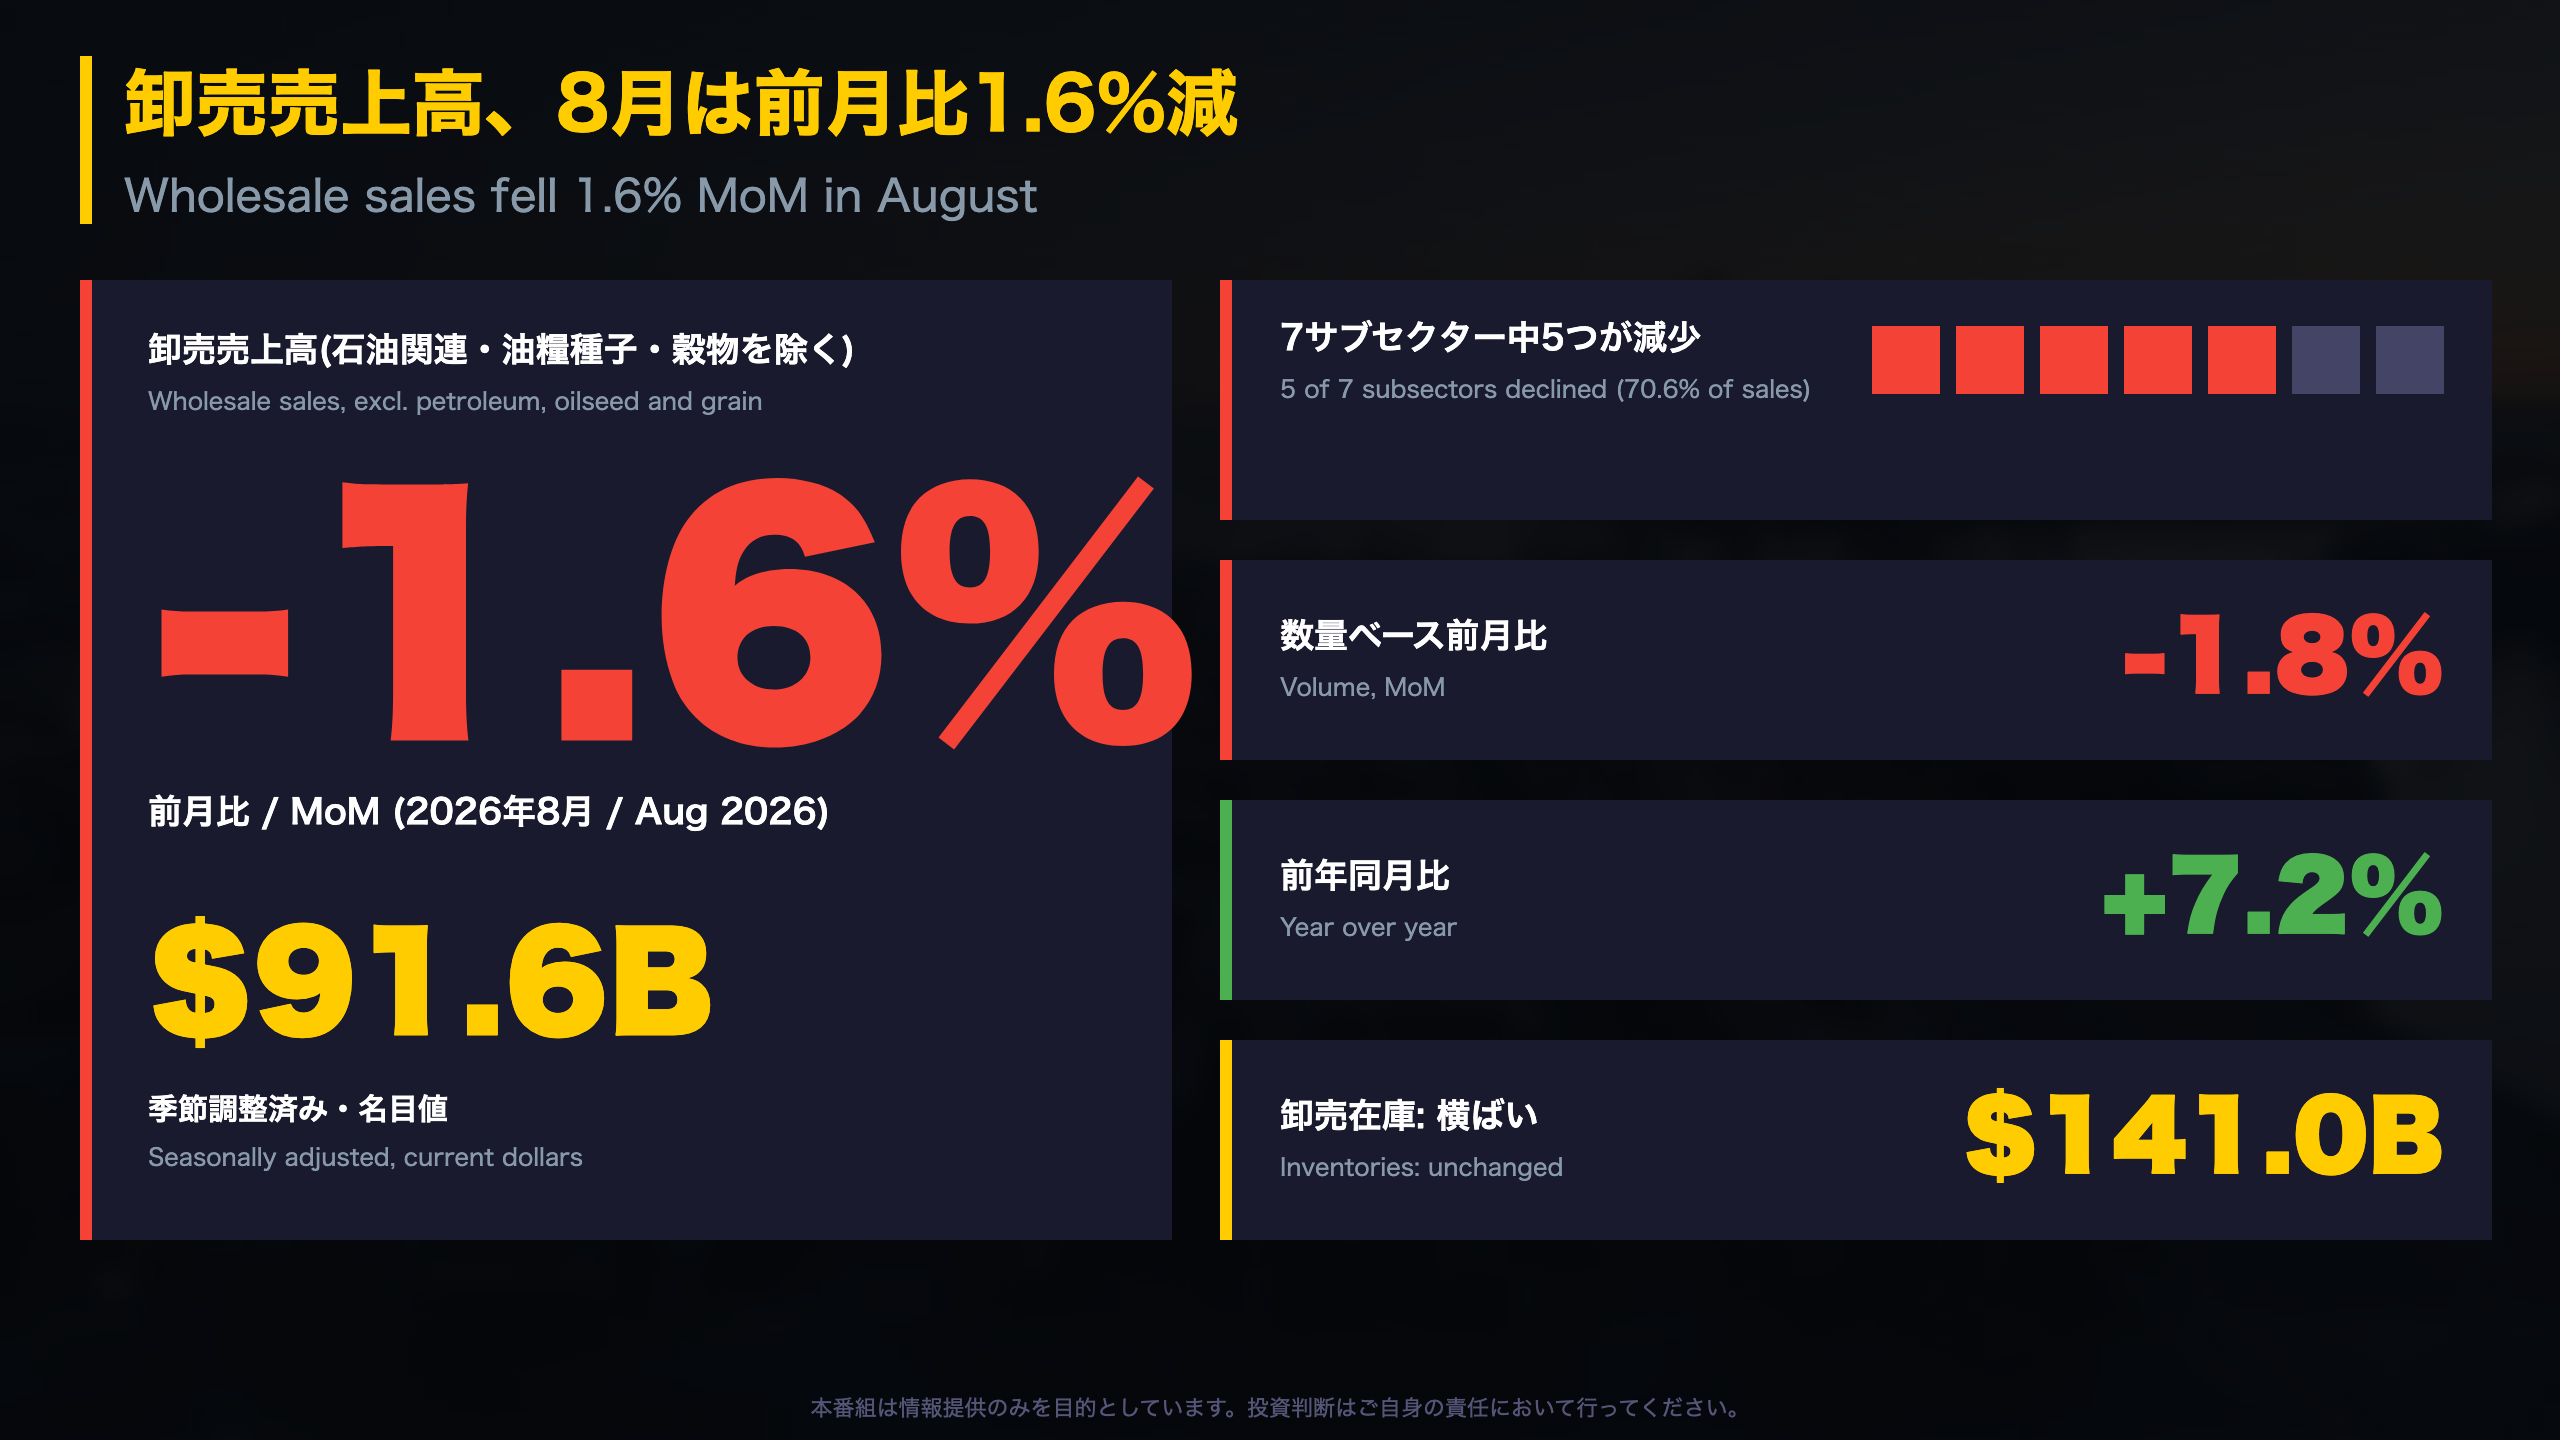
📊 Statistics Canada reported on Oct 15 that August wholesale sales (excl. petroleum, hydrocarbons, oilseed and grain) fell 1.6% m/m to $91.6 billion. Five of seven subsectors declined.
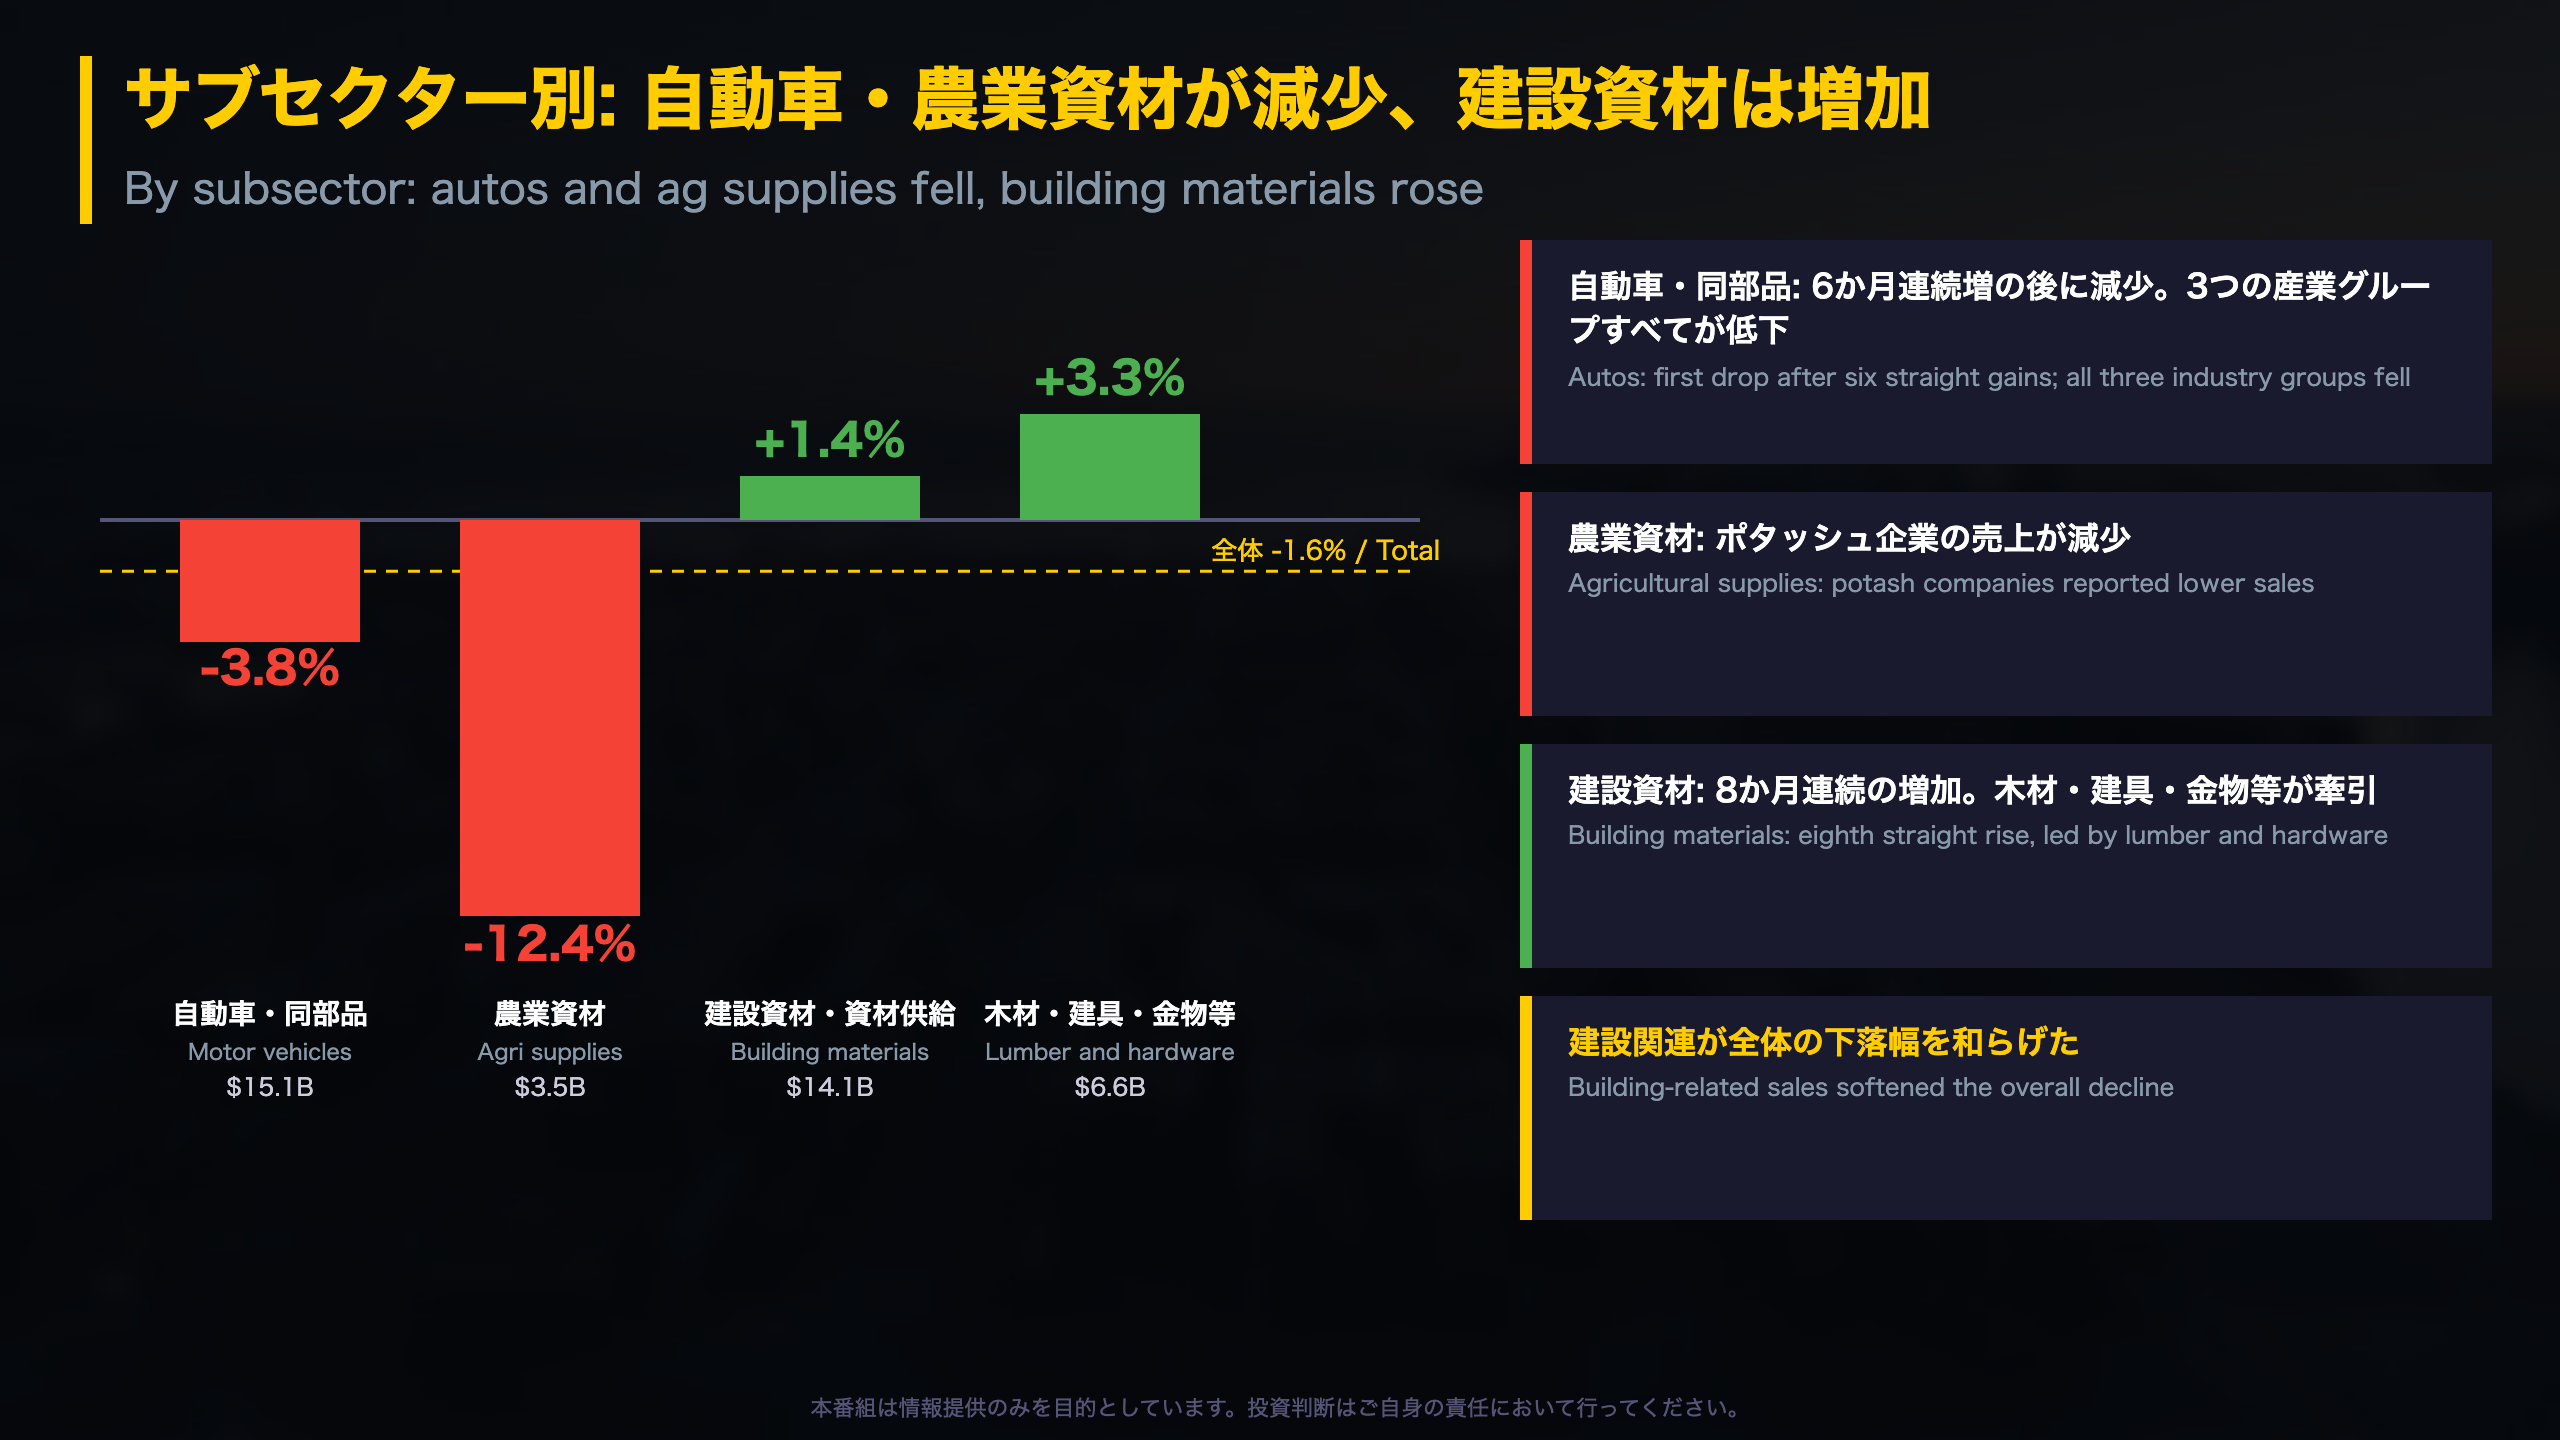
📉 Motor vehicles and parts dropped 3.8%, and agricultural supplies fell 12.4%, with potash companies lower.
📈 Building materials rose 1.4%, an eighth straight increase. Sales remained 7.2% above a year earlier.
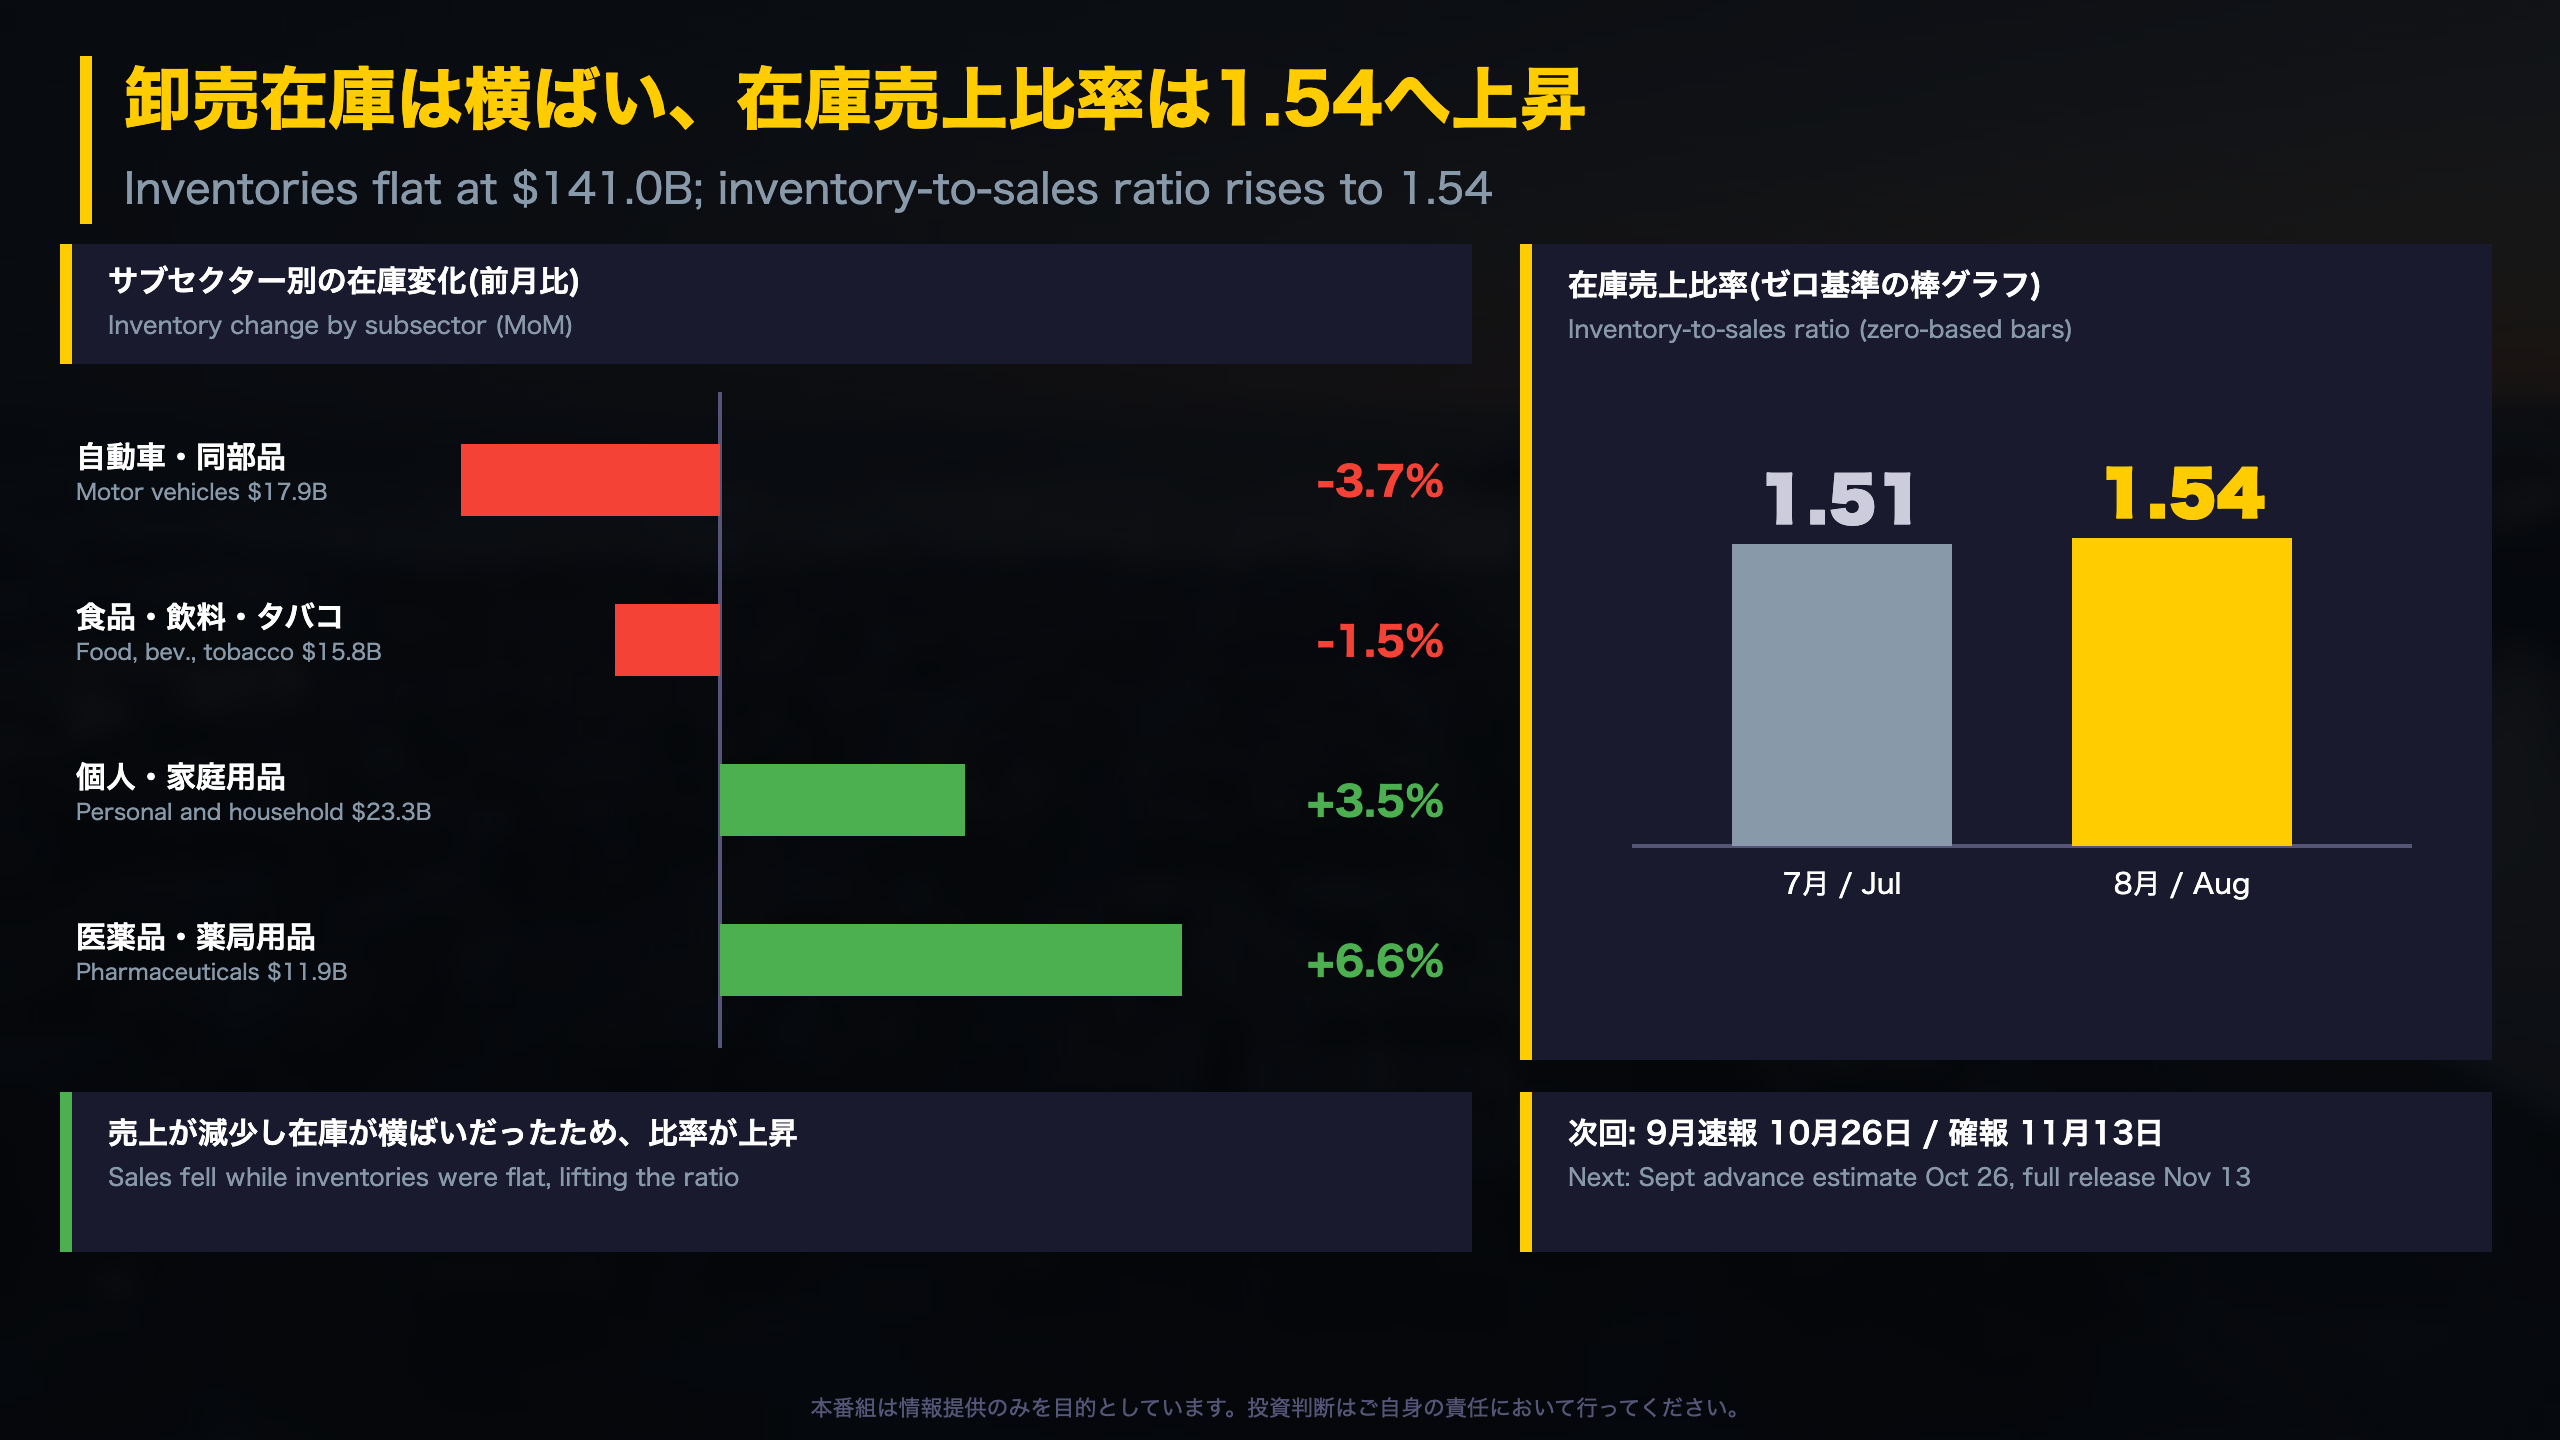
💡 Inventories were unchanged at $141.0 billion, and the inventory-to-sales ratio rose from 1.51 to 1.54.
⚠️ Next: September advance estimate on Oct 26, full release on Nov 13.
カナダ卸売売上高、8月は前月比1.6%減
What this release is
Statistics Canada (StatCan) is Canada’s national statistics agency, and The Daily is its official release bulletin. The Monthly Wholesale Trade Survey tracks sales and inventories of firms that buy goods from producers and sell them on to retailers and other businesses, so it is a business-to-business read-through often followed alongside manufacturing and retail data.
The headline series excludes petroleum, petroleum products and other hydrocarbons, as well as oilseed and grain, and is seasonally adjusted and in current dollars.
August snapshot
- Sales: -1.6% m/m to $91.6 billion
- Volume (chained 2012 dollars): -1.8% m/m
- Year over year: +7.2%
- Subsectors down: 5 of 7, together 70.6% of wholesale sales
- Inventories: unchanged at $141.0 billion
International context
The US Census Bureau publishes a comparable monthly wholesale report that also includes an inventories-to-sales ratio. Coverage and definitions differ, so levels should not be compared directly; direction and composition are the useful points of comparison.
Balanced reading
The monthly drop is broad by subsector count, yet the annual comparison remains positive. StatCan also cautions that seasonally adjusted and trend-cycle estimates are subject to revision, and that revisions “could be large and could even lead to a reversal of movement”, especially near the end of the series.
Market angle
The release does not discuss Bank of Canada policy or the Canadian dollar, so any such link lies outside the report. Next: the September advance estimate on October 26 and the full release on November 13.
サブセクター別: 自動車・農業資材が減少、建設資材は8か月連続増
Reading the subsector breakdown
StatCan sorts wholesalers into seven subsectors under the North American Industry Classification System (NAICS), the standard used across Canada, the US and Mexico. That lets readers see which kinds of goods are driving the headline.
| Group | Aug change | Level |
|---|---|---|
| Motor vehicles and parts | -3.8% | $15.1B |
| Motor vehicle group | -4.6% | $12.1B |
| Agricultural supplies | -12.4% | $3.5B |
| Building materials and supplies | +1.4% | $14.1B |
| Lumber, millwork, hardware | +3.3% | $6.6B |
Streaks matter
- Motor vehicle wholesale ended six straight monthly increases.
- Building materials extended to eight straight increases.
- All three industry groups within motor vehicles fell, so the weakness was not confined to one niche.
“Notably, sales from potash companies were lower in August.”
Two readings
Cautious: five subsectors representing 70.6% of sales fell, and volume dropped 1.8%. The end of the auto streak may point to a loss of momentum.
Constructive: the building-materials streak and a +7.2% annual gain suggest demand remains reasonably firm. Both views rest on single-month data, so neither should be over-read.
Gaps in the report
The release gives no explanation for the auto decline or for the potash weakness. Nothing is said about trade policy, prices or exchange rates, so those links are outside the evidence provided.
What to watch
The September advance estimate on October 26 will show whether autos keep falling and whether building materials reach a ninth consecutive rise.
州別動向: オンタリオ・サスカチュワンが減少を主導
Regional structure
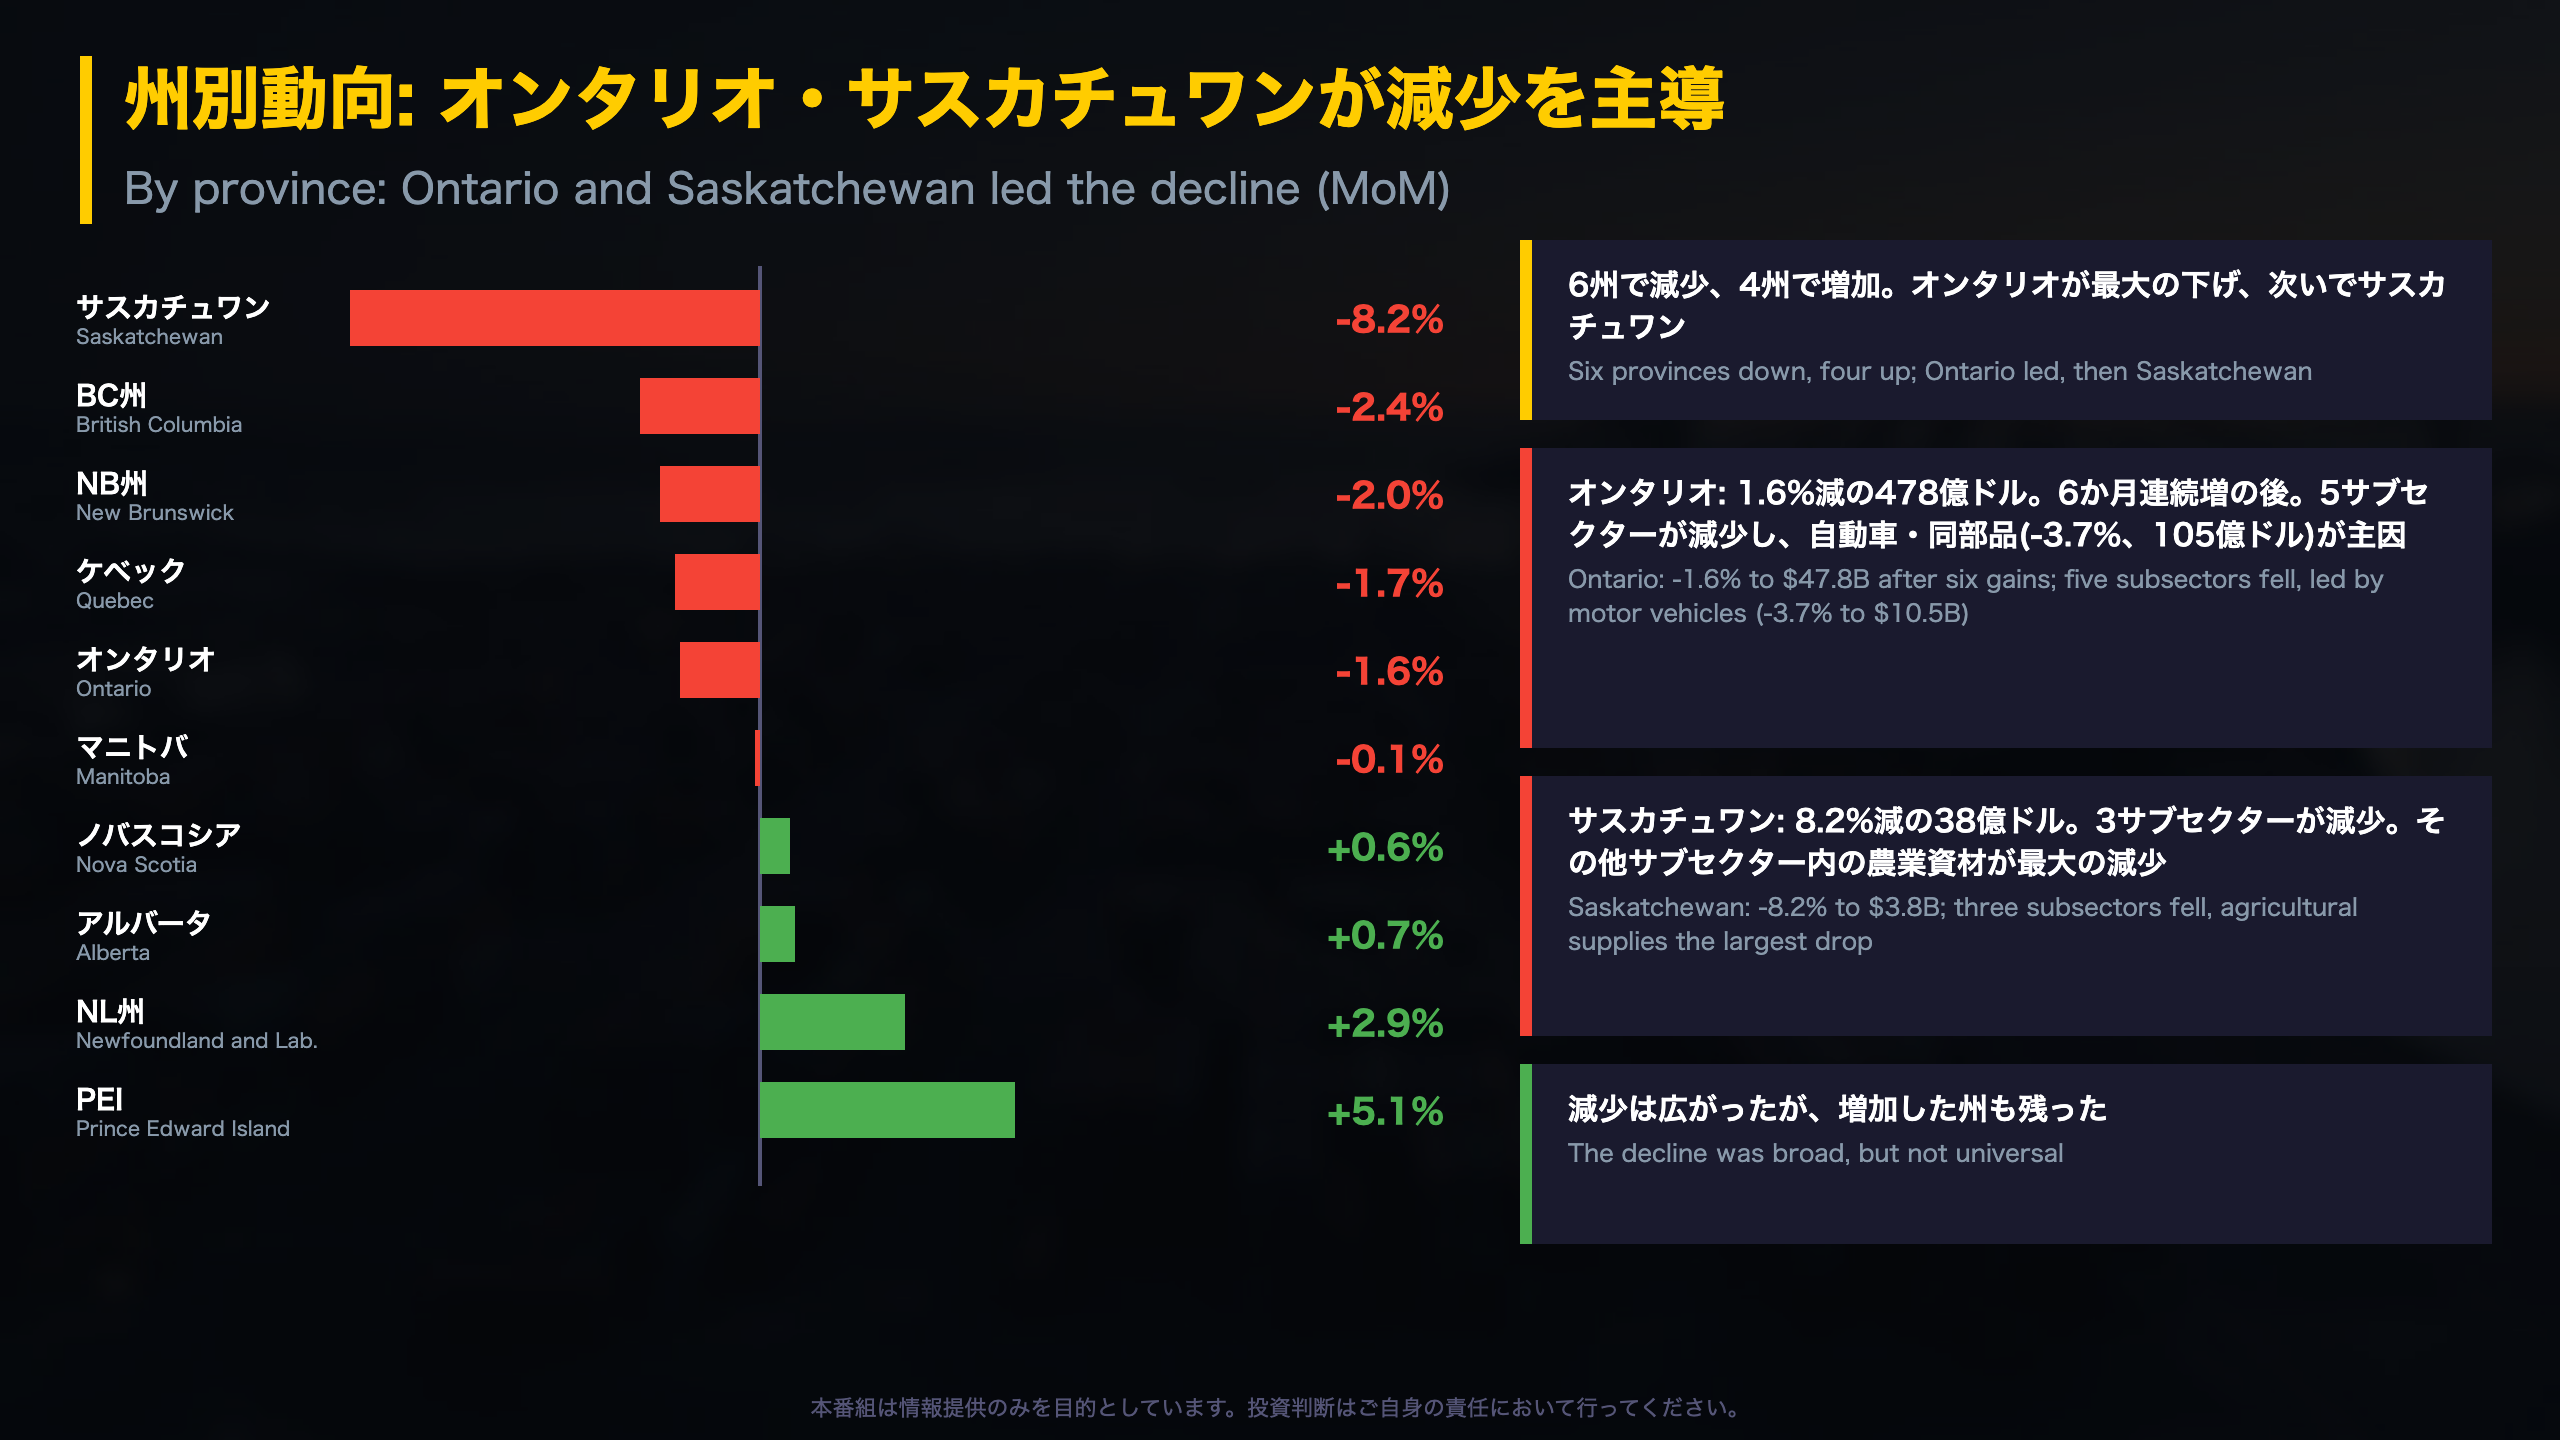
StatCan publishes wholesale sales for all ten provinces and three territories. Ontario is by far the largest wholesale market: its $47.8 billion is roughly 52% of the national $91.6 billion on a simple calculation (our arithmetic, not a StatCan figure), so its direction heavily shapes the national headline.
August by province
| Province | Change | Level |
|---|---|---|
| Ontario | -1.6% | $47.8B |
| Quebec | -1.7% | $15.5B |
| Alberta | +0.7% | $10.4B |
| British Columbia | -2.4% | $8.9B |
| Saskatchewan | -8.2% | $3.8B |
| New Brunswick | -2.0% | $0.9B |
| Manitoba | -0.1% | $2.2B |
Gains came from Alberta, Nova Scotia (+0.6%), Newfoundland and Labrador (+2.9%) and Prince Edward Island (+5.1%).
Drivers named in the report
- Ontario: motor vehicles and parts fell 3.7% to $10.5 billion, ending six consecutive monthly gains for the province.
- Saskatchewan: the largest drop was in the agricultural supplies group within the miscellaneous subsector. Saskatchewan is widely known as a major potash-producing province, and the report separately cites lower potash sales nationally, but it does not explicitly link the two.
Small-base caution
Nunavut (+43.4%) and Yukon (-10.7%) are measured on bases near $14 million and $20 million, so percentage moves can swing widely.
Balanced view
Declines were geographically broad, yet four provinces grew and Manitoba was almost flat. The report offers no commentary on trade policy, exchange rates or monetary policy, so those channels are not assessed here.
Next: the September full release on November 13.
卸売在庫は横ばい、在庫売上比率は1.54へ上昇
Why inventories matter
In wholesale data, sales show current demand while inventories show how much stock sits in the pipeline. Comparing them gives the inventory-to-sales ratio, which StatCan defines as the time, in months, needed to exhaust inventories if sales stayed at current levels. The US Census Bureau publishes the same type of ratio for US wholesalers, though definitions and coverage differ.
August details
| Group | Change | Level |
|---|---|---|
| Total inventories | unchanged | $141.0B |
| Motor vehicles and parts | -3.7% | $17.9B |
| Food, beverage, tobacco | -1.5% | $15.8B |
| Personal and household goods | +3.5% | $23.3B |
| Pharmaceuticals and pharmacy supplies | +6.6% | $11.9B |
Inventories fell in three of seven subsectors but rose in most industry groups.
Reading the ratio
The ratio moved from 1.51 to 1.54. A simple check of $141.0B divided by $91.6B gives about 1.54, consistent with the published figure (our arithmetic). With inventories flat and sales down 1.6%, the arithmetic pushes the ratio up.
Two perspectives
Cautious: if sales stay weak, stocks take longer to clear.
Constructive: inventories did not build; the increase of 0.03 is small, and in autos sales (-3.8%) and stocks (-3.7%) moved by similar amounts.
Beyond the data
The release says nothing about Bank of Canada policy or the Canadian dollar, so those links lie outside the report. Upcoming: the September advance estimate on October 26 and the full release on November 13, which will show whether the ratio keeps rising.
Disclaimer: This article is for informational purposes only. All investment decisions are made solely at your own risk.