📺 Watch the Full Video Analysis
This article was automatically generated by the NFC Market Live AI analysis system. (Updated: 2026-07-20 20:39 JST)
📄 Primary Source
Banco Central do Brasil
https://www.bcb.gov.br/content/focus/focusmarketreadout/R20260717.pdf
📊 Deep dive into BCB’s July 17 Focus Market Readout.
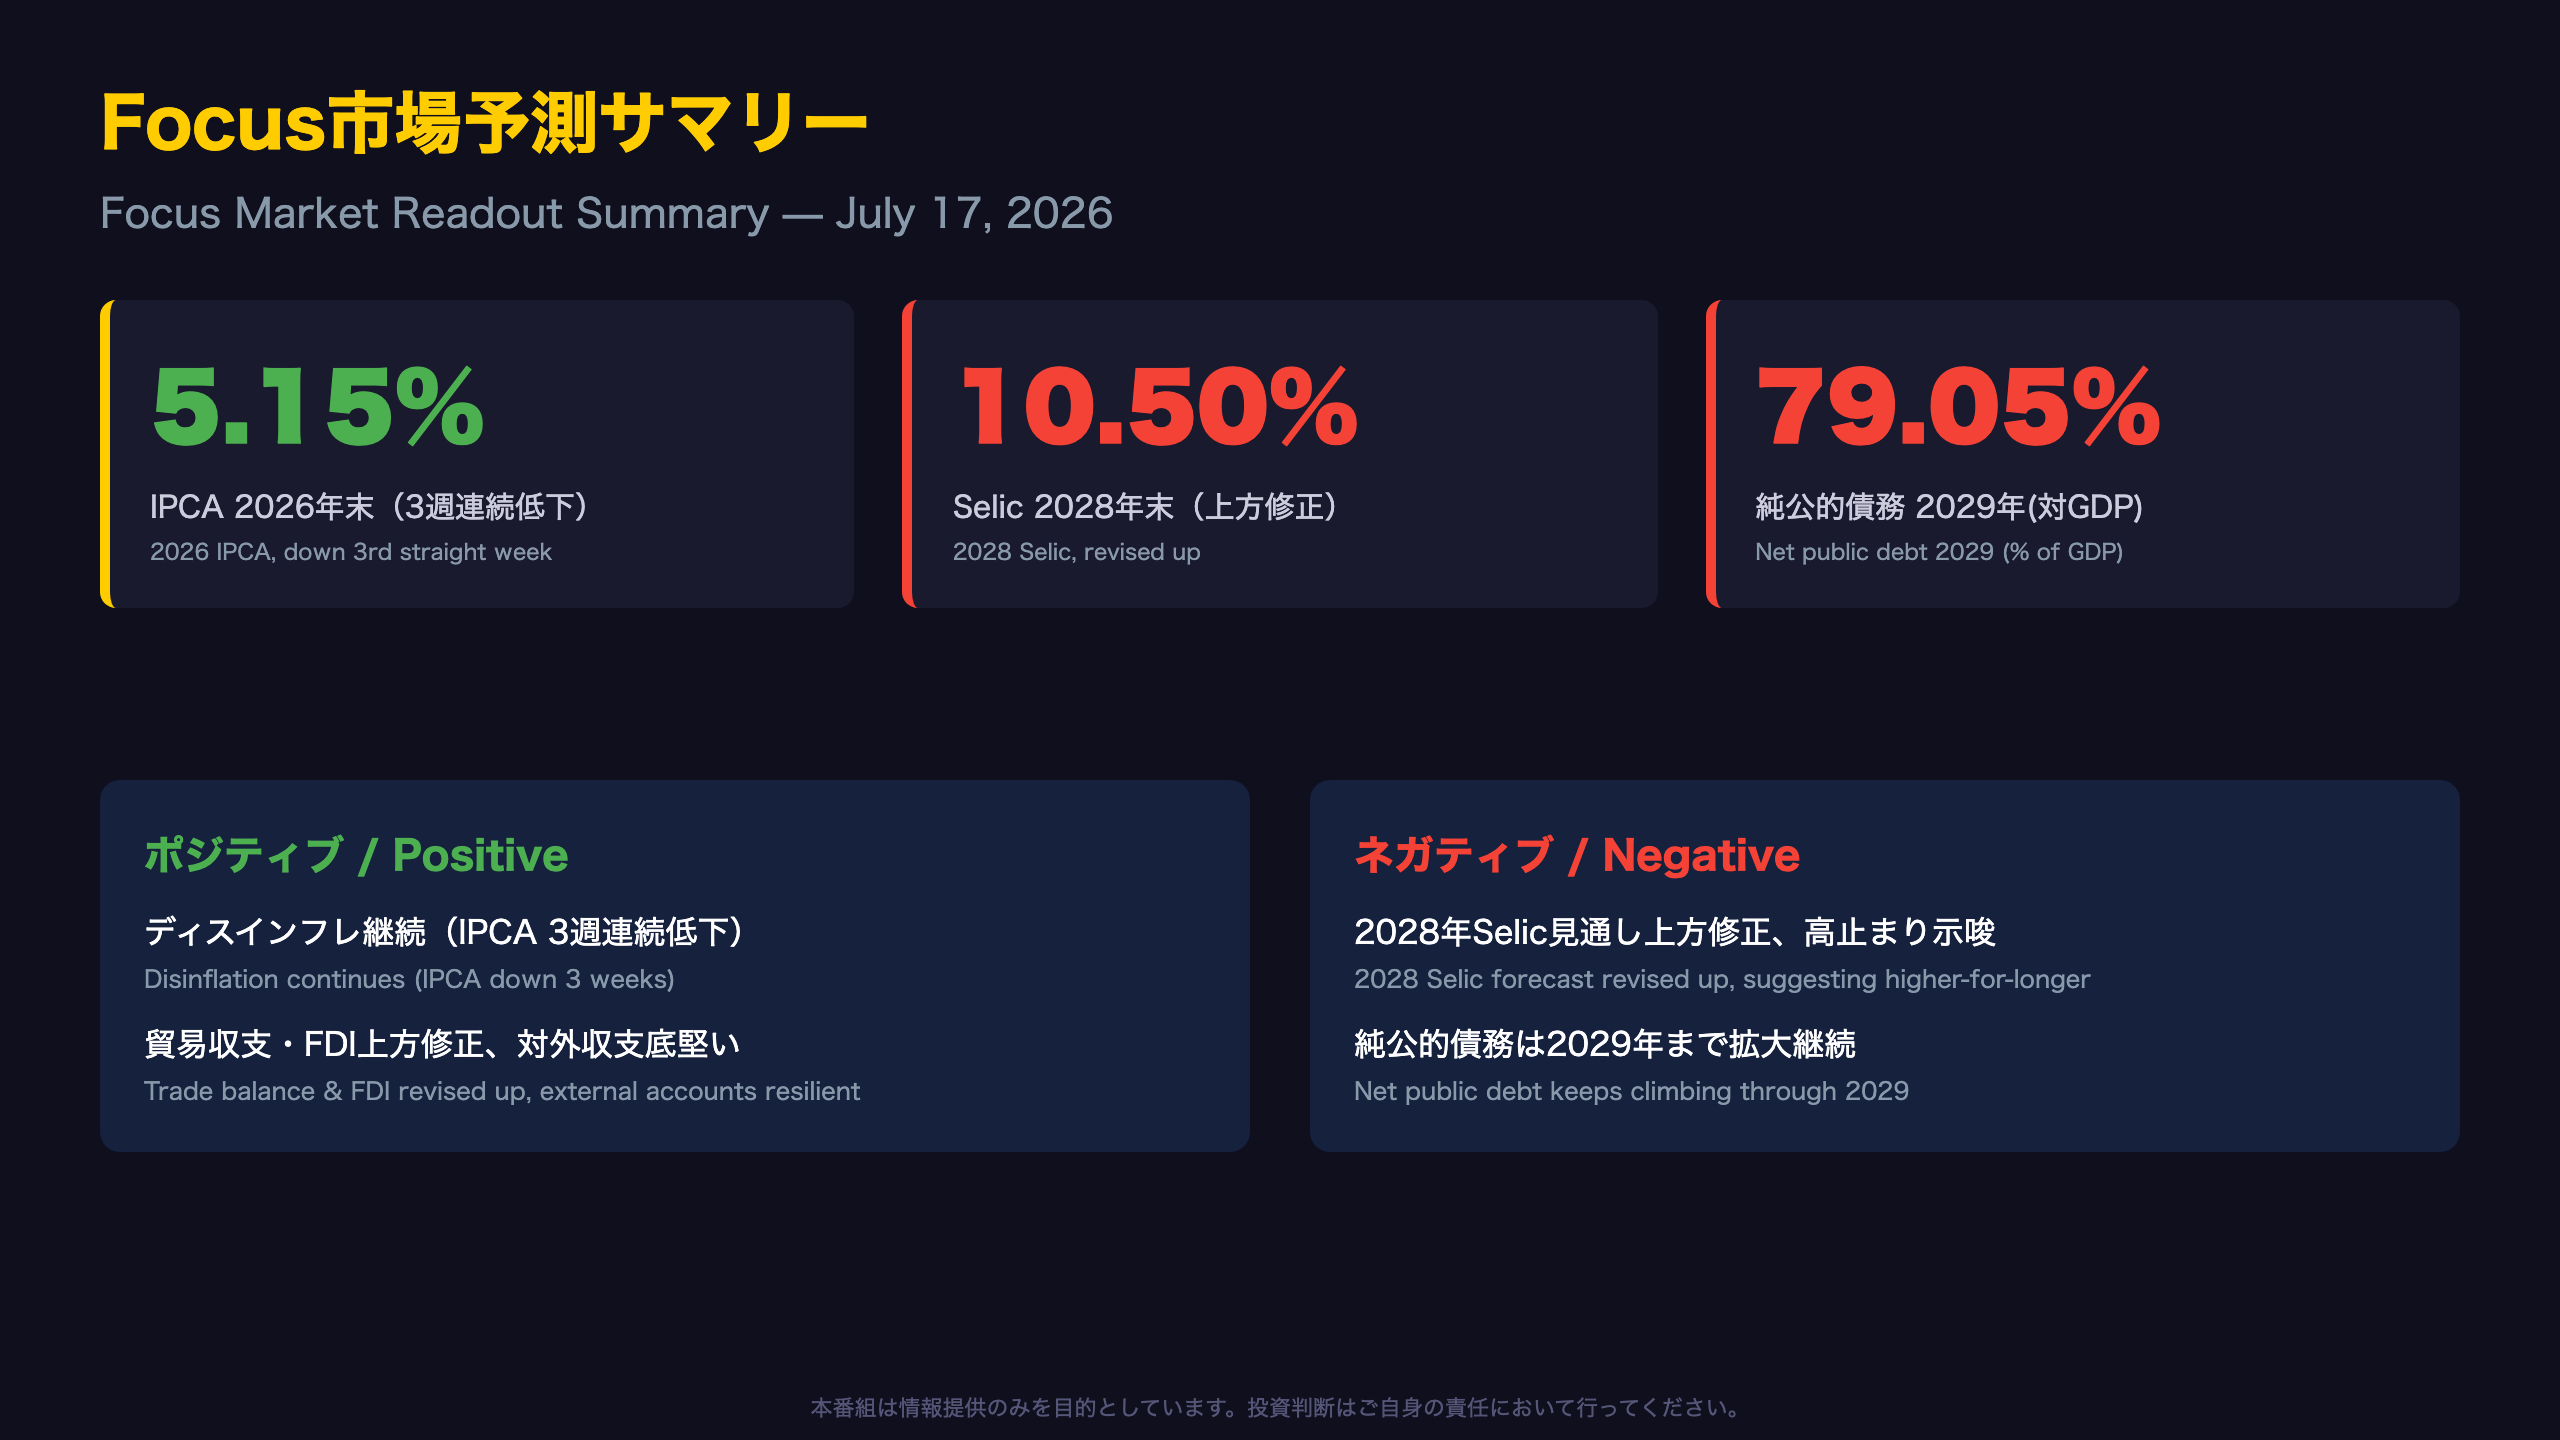
2026 year-end IPCA forecast fell to 5.15%, a third straight weekly decline — disinflation continues.
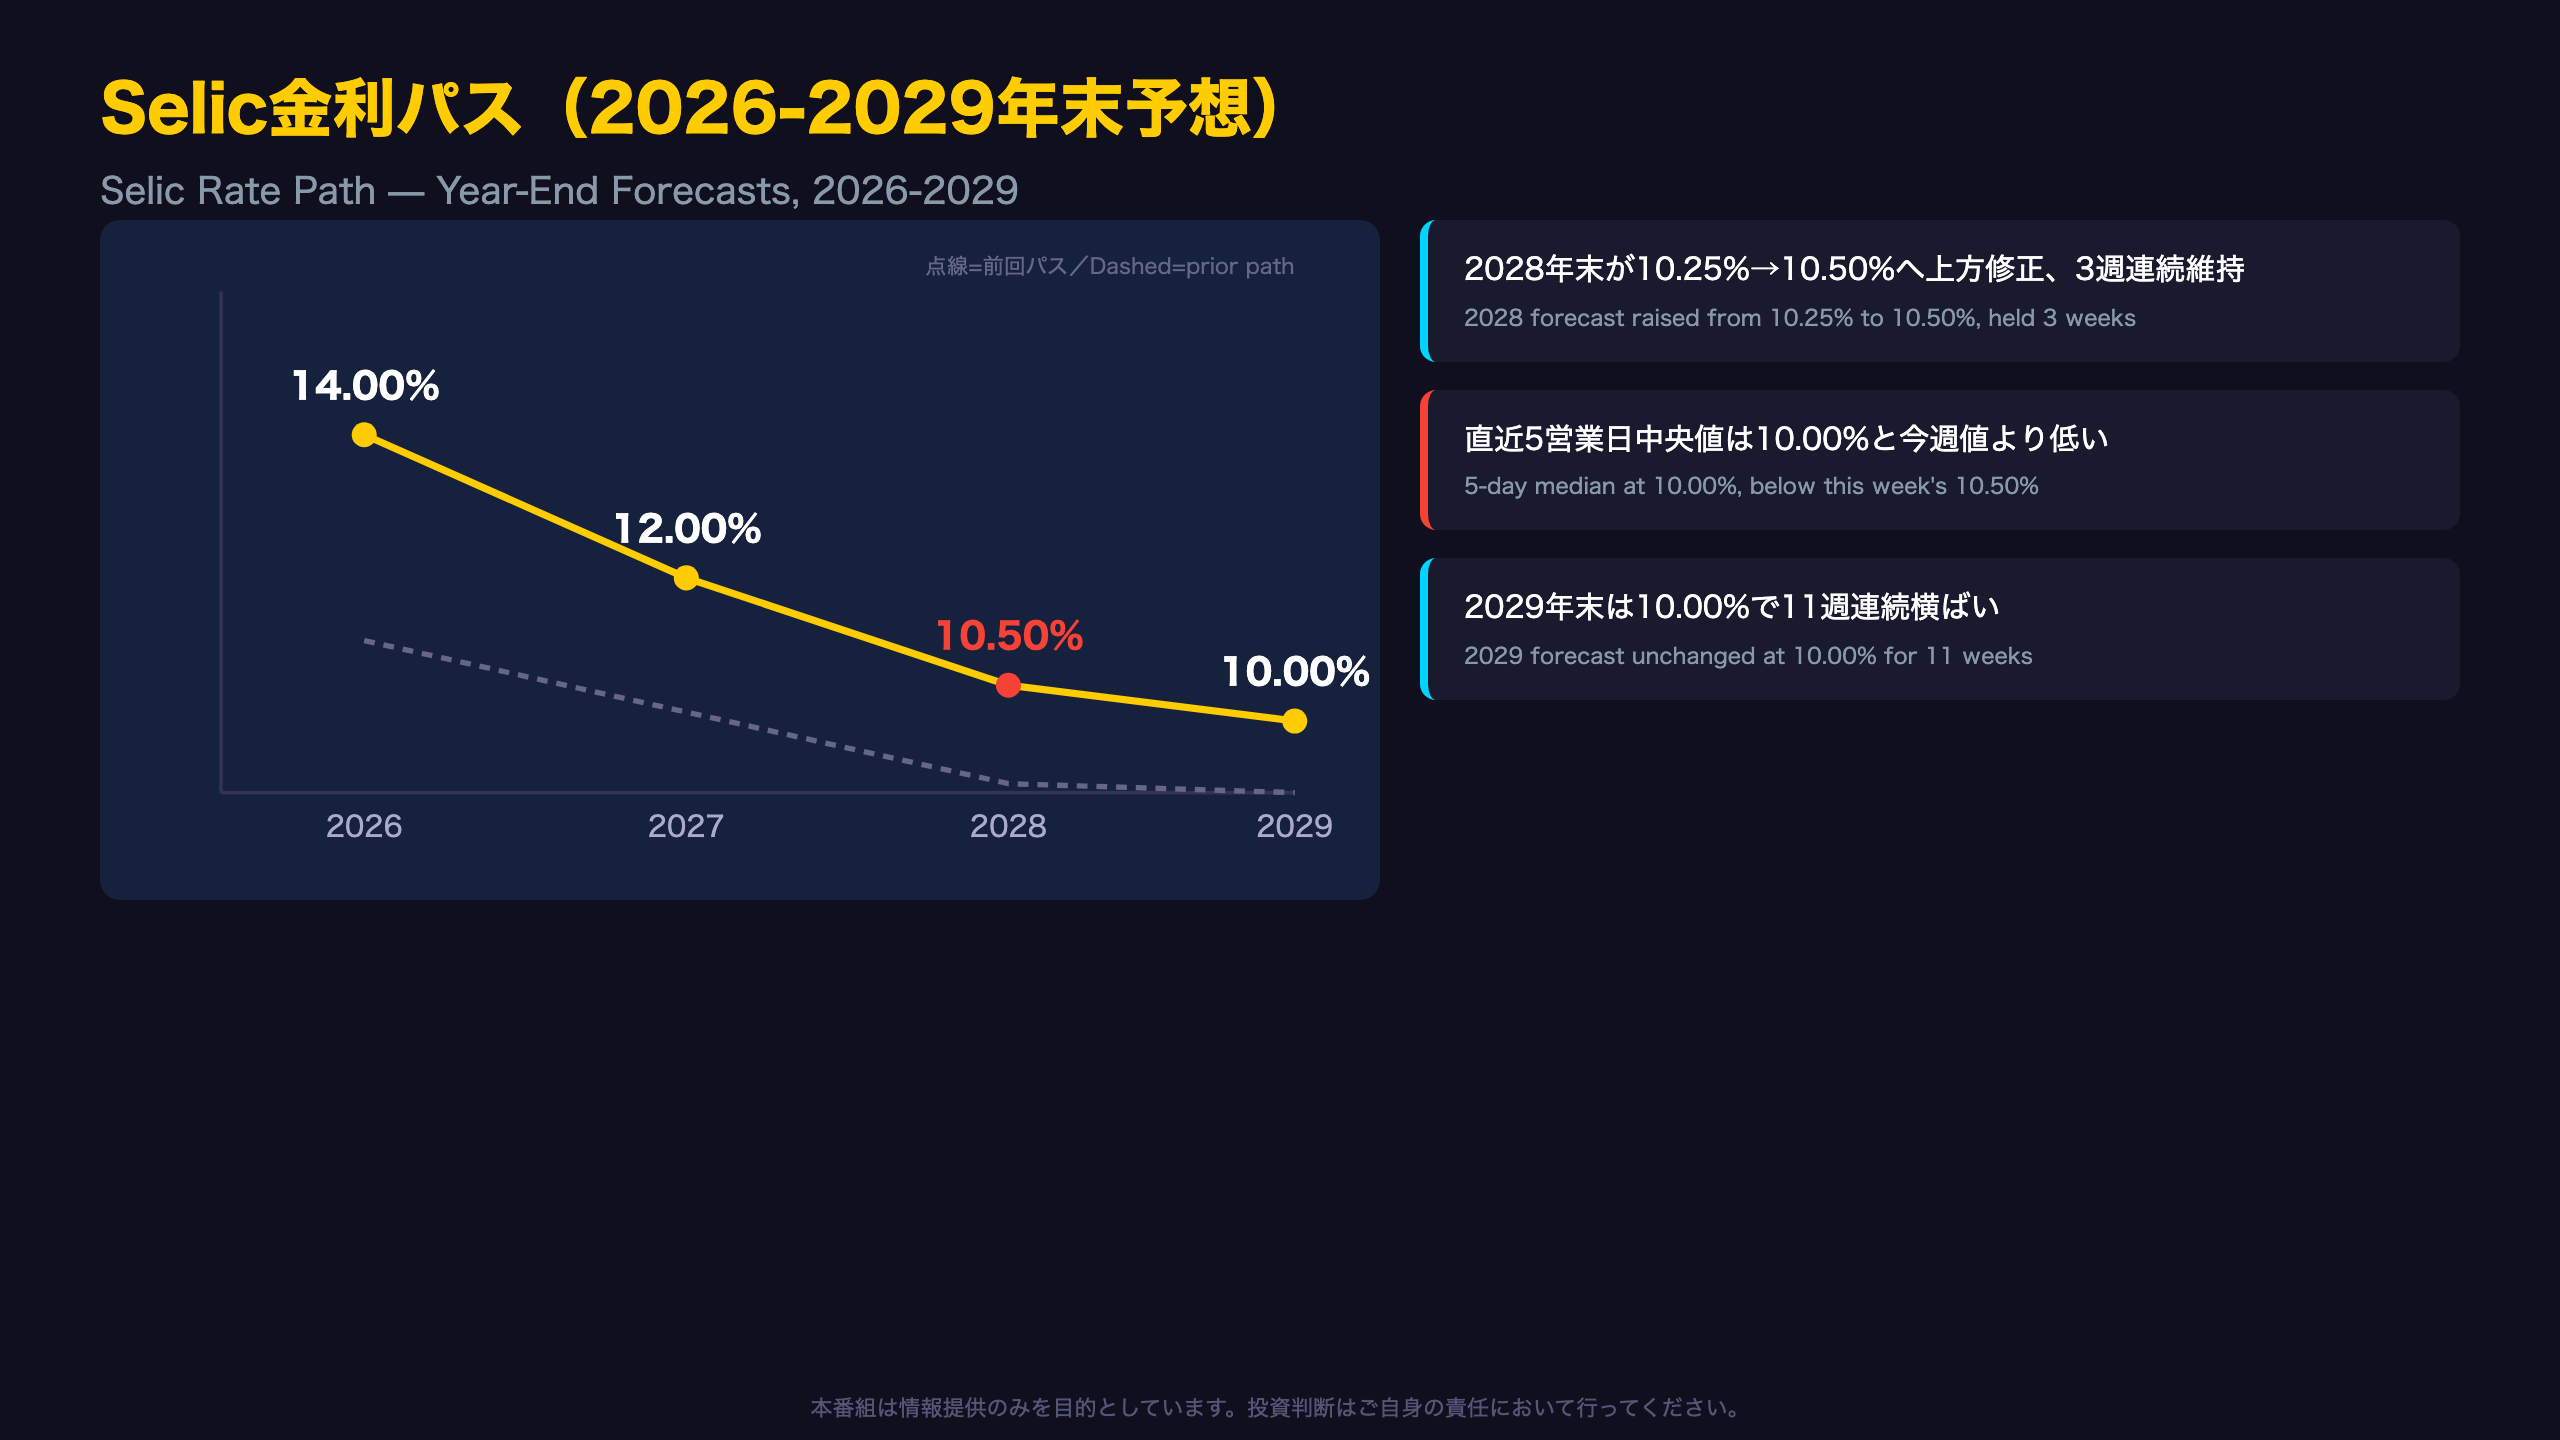
💡 But the 2028 year-end Selic forecast was revised up from 10.25% to 10.50%, holding for 3 weeks.
⚠️ Net public debt now seen at 79.05% of GDP by 2029.
📈 Trade balance & FDI revised upward — external accounts remain resilient.
We break down what this means for BRL/JPY carry trades against Japan’s 0.84% policy rate.
Focus市場予測サマリー:ディスインフレと金利高止まりの綱引き
Decoding the BCB Focus Market Readout
Brazil’s central bank (Banco Central do Brasil, BCB) publishes the Focus Market Readout weekly, aggregating median forecasts from over 130 financial institutions. Unlike the U.S. Federal Reserve’s dot plot, which reflects the Fed’s own committee views, Focus is purely a survey of market participants — though BCB officials reference it directly in COPOM (Monetary Policy Committee) deliberations.
The Bullish Case
- 2026 year-end IPCA (Brazil’s benchmark CPI): revised down to 5.15%, a third straight weekly decline
- Trade balance and FDI forecasts revised upward, signaling resilient external financing
The Bearish Case
- 2028 year-end Selic (policy rate) forecast raised from 10.25% to 10.50%, holding for three weeks
- Net public debt-to-GDP now seen at 79.05% by 2029, extending its upward climb
The report’s own legend distinguishes “▲ Increase” from “▼ Decrease” — this week, both the 2028 Selic path and 2029 debt trajectory carry the upward arrow.
For context, Brazil’s inflation target is 3.0%, with a tolerance band of 1.5%-4.5% — structurally similar to the Fed’s 2% target but wider, given emerging-market volatility. Investors should note these are two distinct time horizons: near-term disinflation doesn’t preclude a structurally higher terminal rate later in the cycle. The next Focus Report, due July 24, will show whether this repricing persists or reverses.
Selic金利パス:2028年ターミナルレートに上方修正の兆し
Reading the Selic Rate Path
The Focus Report presents rate forecasts across four time windows: four weeks ago, one week ago, today, and the median of only the last five business days. This layered structure is what makes Focus valuable — it reveals how “fresh” the consensus really is, something a single headline number can’t show.
What the 2028 Upward Revision Means
The raw data shows “10.25 10.50 10.50 ▲ (3) 116” — four weeks ago the median was 10.25%, and it has now held at 10.50% for three consecutive weeks. This is not a one-off blip but appears to be a persistent shift in view (Level B reasoning: multiple weeks pointing the same direction).
The “Today” vs. “5-Day” Divergence
What’s notable is that the five-business-day median for 2028 comes in at 10.00%, lower than today’s 10.50% median. This may suggest the most recently updated forecasts lean toward a lower rate path (Level C: single-metric, cautious phrasing). Interestingly, 2027 shows the opposite pattern — today’s 12.00% versus a slightly higher 12.25% in the five-day window.
This gap between the full 30-day sample and the most recent five business days should be treated as a soft signal, not a confirmed regime shift, given it comes from a single week’s data.
The next Focus Report on July 24 will show whether this divergence widens or converges — a key data point for anyone tracking Brazil’s terminal rate debate.
IPCA:ディスインフレ継続もターゲット上限は依然突破
Measuring the Distance to Target
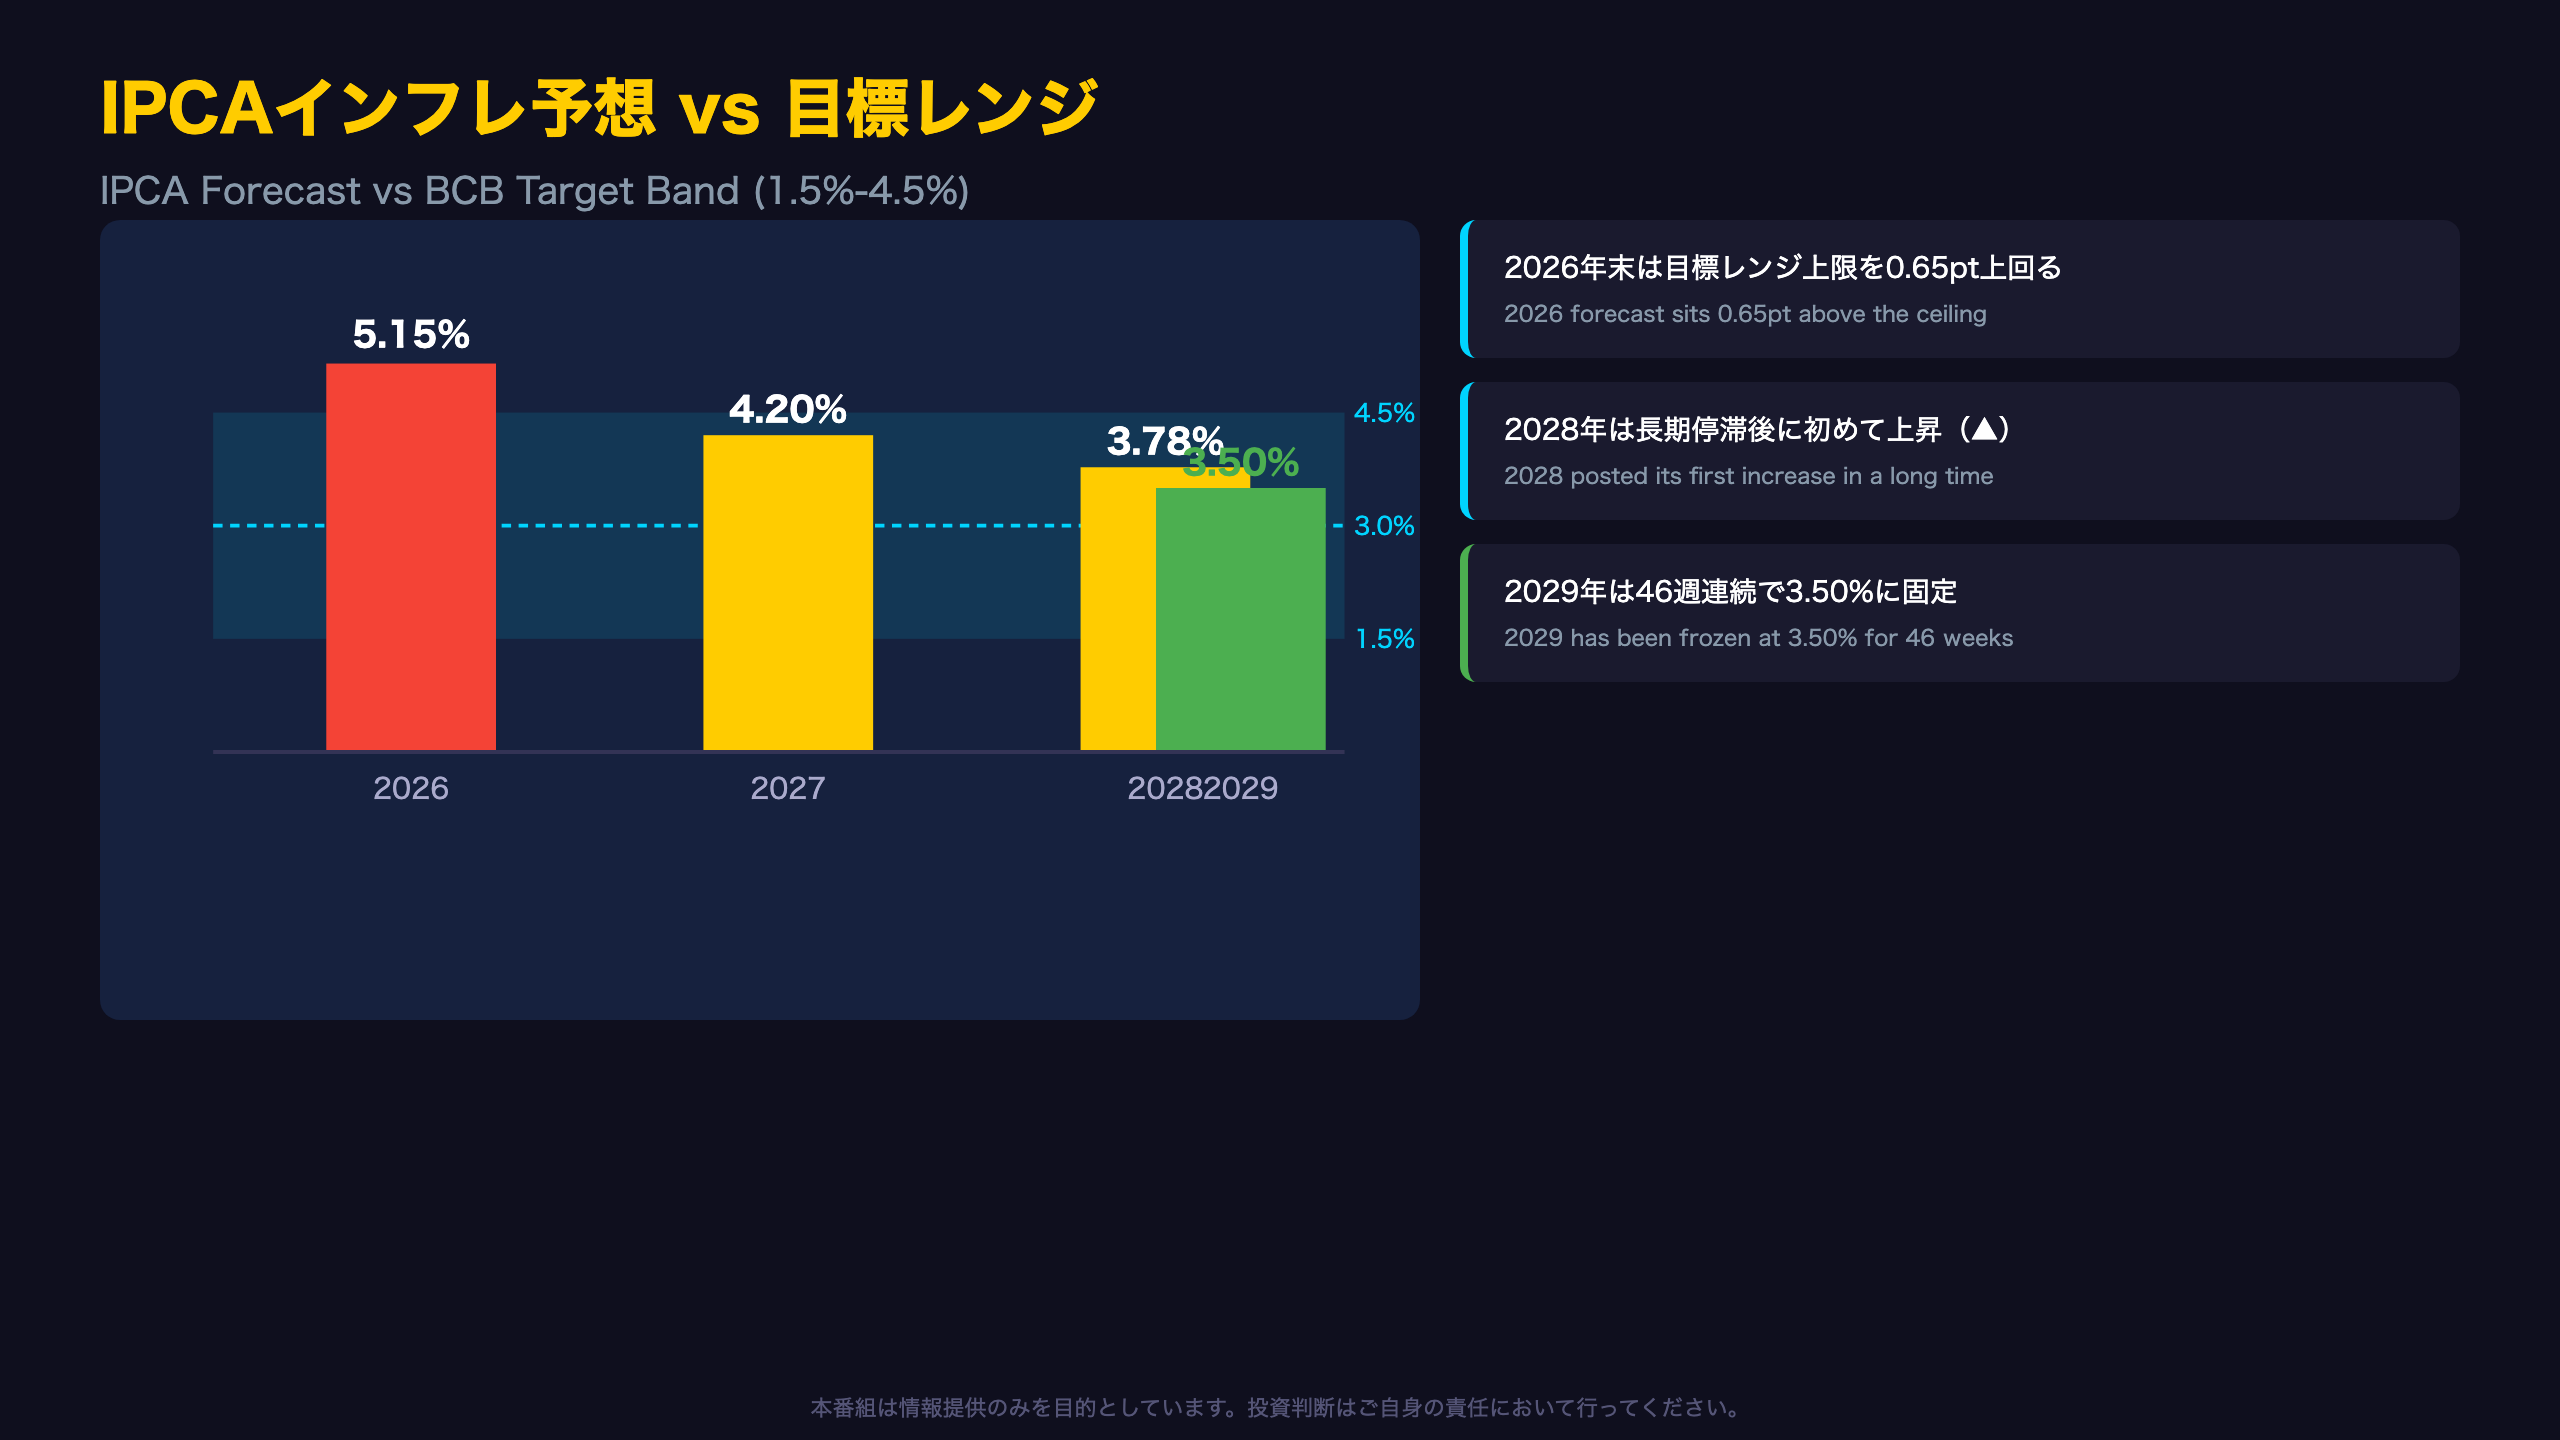
BCB’s inflation target is a 3.0% center point with a tolerance band of 1.5% to 4.5% — conceptually similar to how the Fed anchors expectations around its 2% target, though Brazil’s band is intentionally wider to accommodate emerging-market volatility.
The IPCA Forecast Timeline
- 2026 year-end: 5.33% → 5.16% → 5.15% (third straight weekly decline, still 0.65pt above the tolerance ceiling)
- 2027 year-end: 4.20% (inside the 4.5% ceiling, but 1.2pt above the 3.0% center)
- 2028 year-end: 3.70% → 3.78% (first increase after a long plateau)
- 2029 year-end: 3.50% (unchanged for 46 straight weeks)
What 46 Weeks of Stability Signals
The raw data reads “3.50 3.50 3.50 (46) 110” for 2029 — forty-six consecutive weeks at the same level. This extraordinarily long plateau may suggest the market has priced in that BCB will not fully return inflation to its 3.0% center over the medium term (Level B reasoning, as multiple data points across years point the same direction). This is not, however, a confirmed structural failure — it remains a single time-series observation.
Notably, per the report’s own trend legend, 2028 IPCA is the only maturity marked with an upward “▲” arrow this week, distinguishing it from the broader disinflationary pattern seen elsewhere in the curve.
財政と対外収支:債務膨張と資金流入の綱引き
Two Parallel Fiscal Stories
This week’s Focus Report tells two seemingly contradictory stories at once: rising public debt alongside resilient external capital flows.
Debt Keeps Climbing
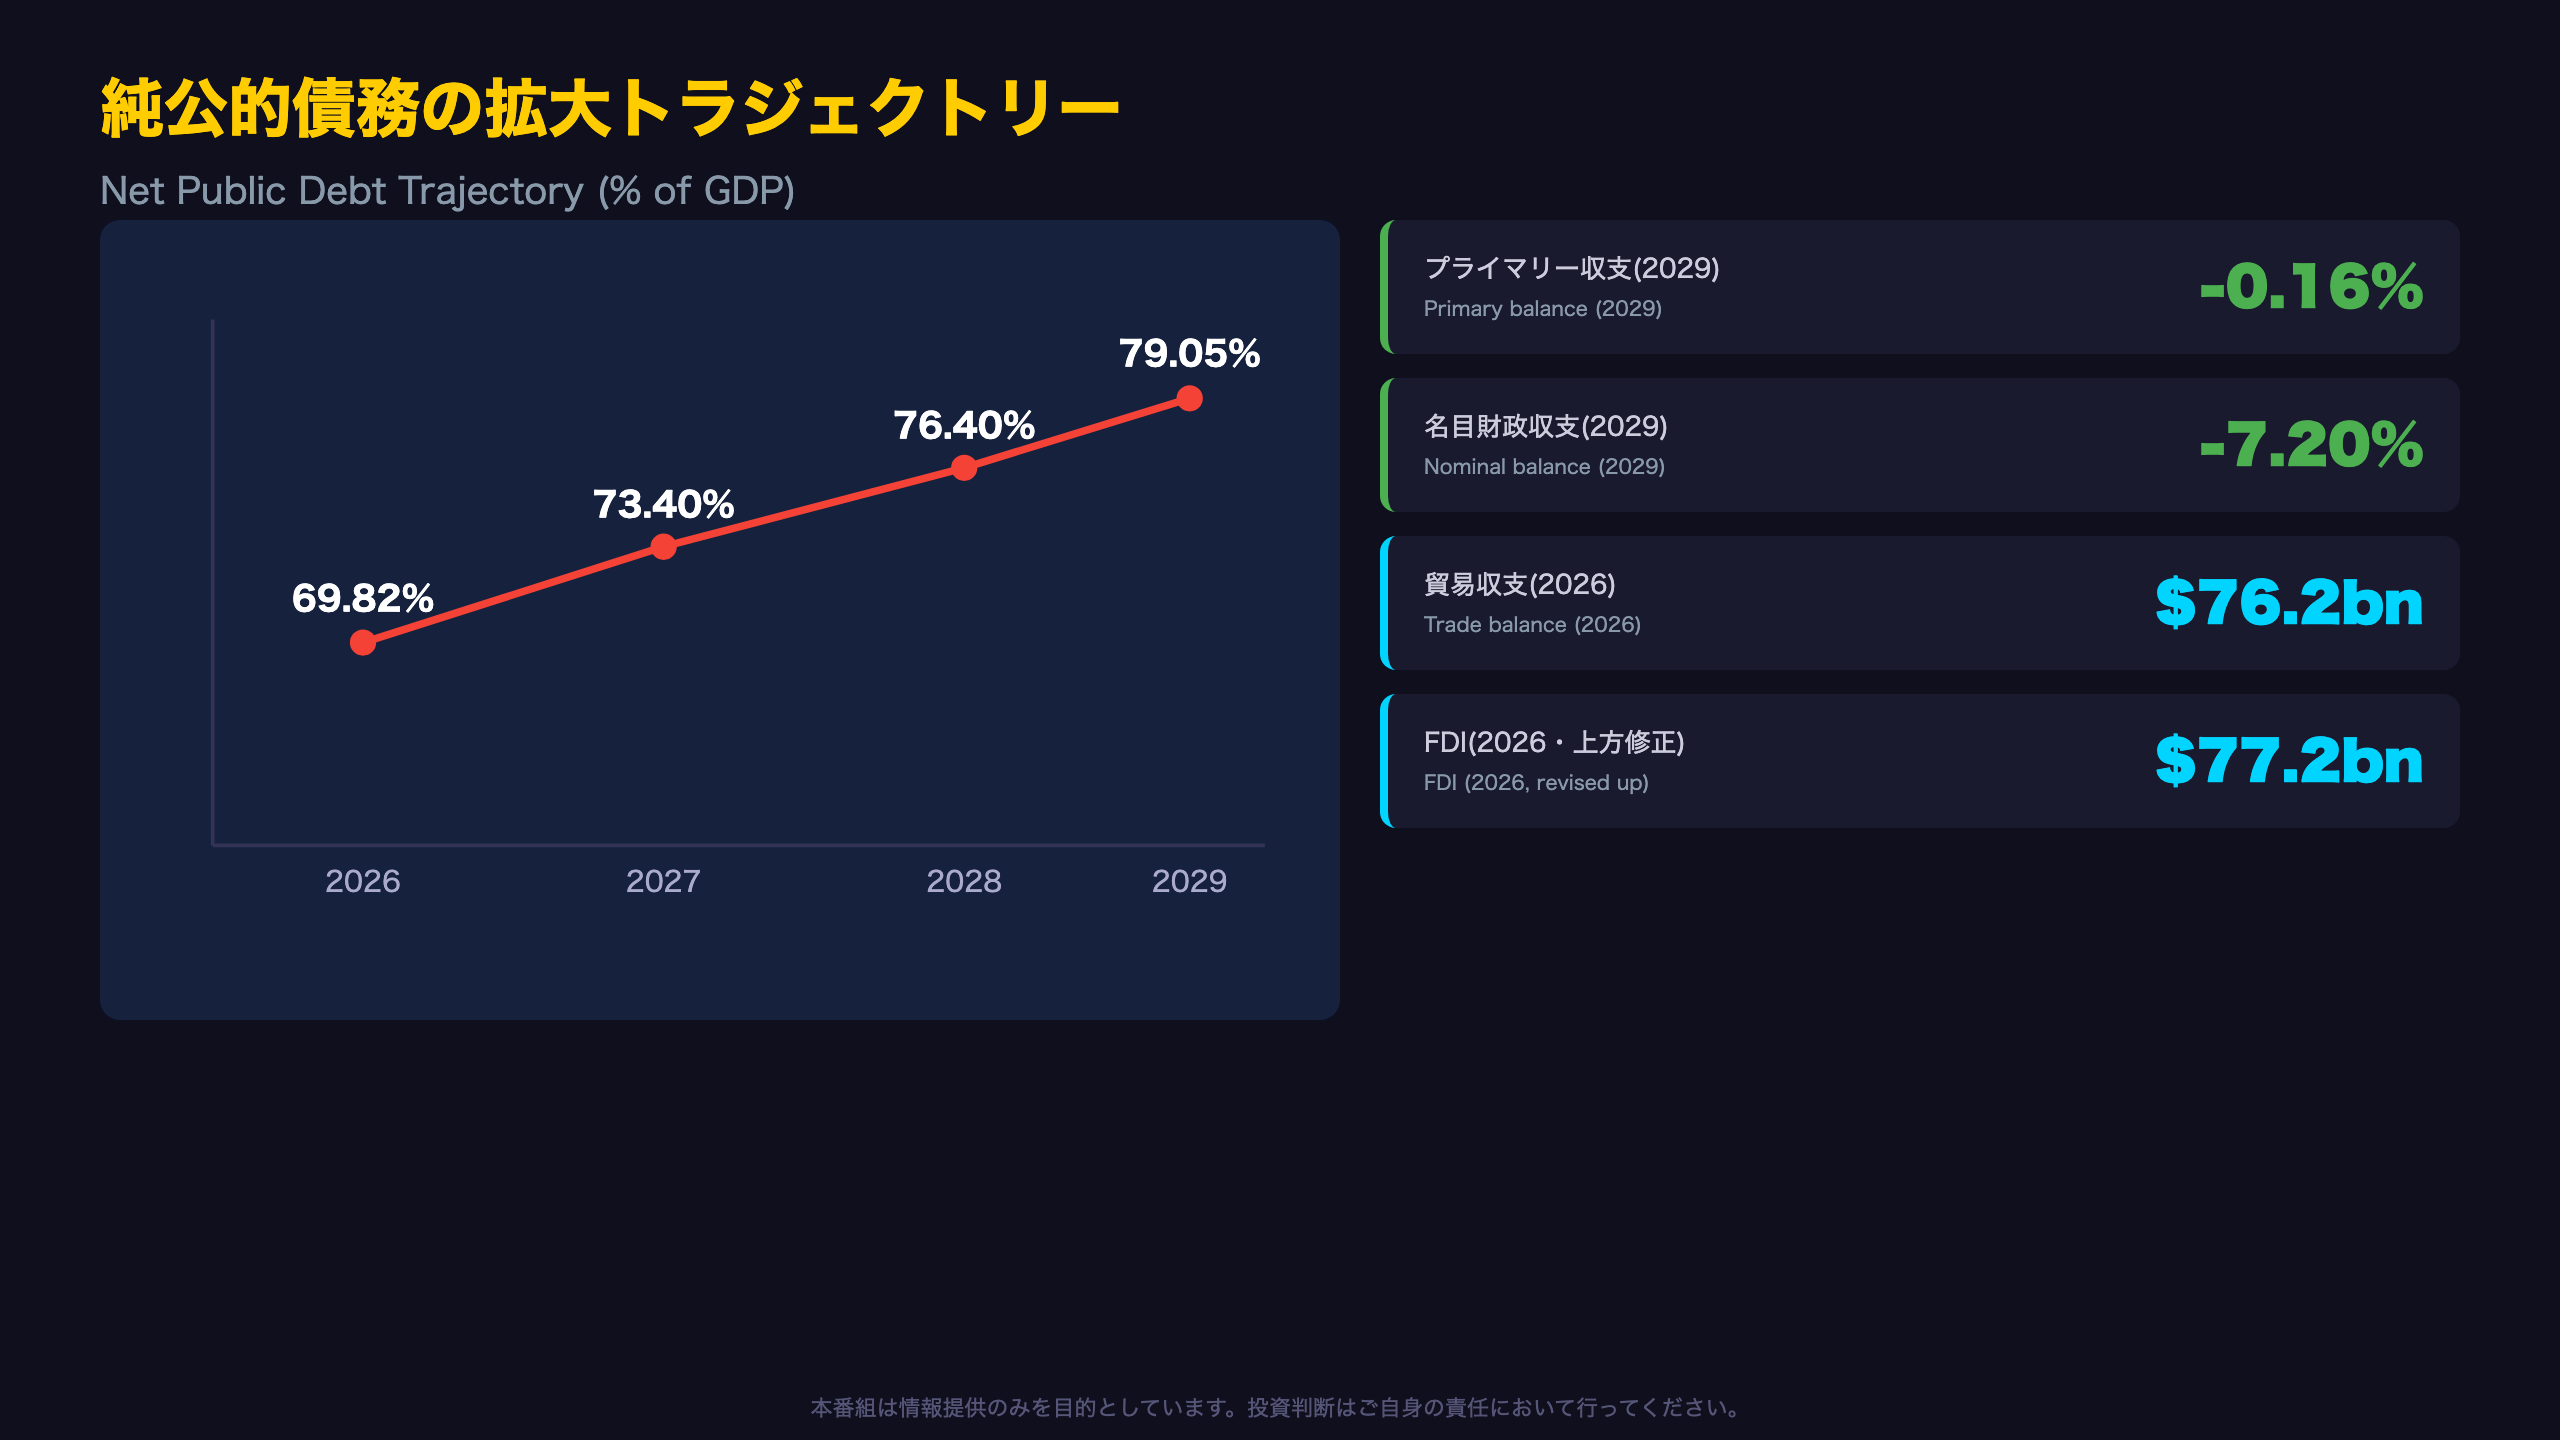
Net public debt (as % of GDP) is projected to rise steadily: 69.82% in 2026, 73.40% in 2027, 76.40% in 2028, and 79.05% by 2029. The raw data for 2029 reads “79.00 79.00 79.05 ▲ (1) 42” — a slight upward revision this week. For context, Brazil’s debt ratio is already well above the roughly 60% threshold often cited as a soft warning line for emerging markets by rating agencies.
But Flow Deficits Are Narrowing
What’s notable is that even as the debt stock grows, the primary fiscal balance is projected to improve from -0.50% (2026) to -0.16% (2029), and the nominal deficit is seen narrowing from -8.74% to -7.20% over the same window. This suggests (Level B reasoning) a structural pattern common to heavily indebted sovereigns: the flow deficit shrinks even as the debt stock keeps growing, largely due to compounding interest costs on the existing debt pile.
External Accounts Remain Resilient
The trade balance held at a robust 76.20 billion dollars for 2026 (unchanged for 8 weeks), and foreign direct investment was revised upward to 77.20 billion dollars from 76.00 billion. The current account held steady near -60.00 billion dollars. Together, these suggest capital continues to flow into Brazil despite fiscal concerns.
Whether continued inflows can be sustained as the debt ratio keeps rising toward 79% of GDP cannot be determined from this single week’s report alone.
BRL/JPYキャリートレード:金利差の魅力は健在も財政リスクに注意
The Carry Trade Math — and Its Blind Spots
For Japanese retail investors, the central question is whether Brazil’s enormous rate differential is actually capturable in practice.
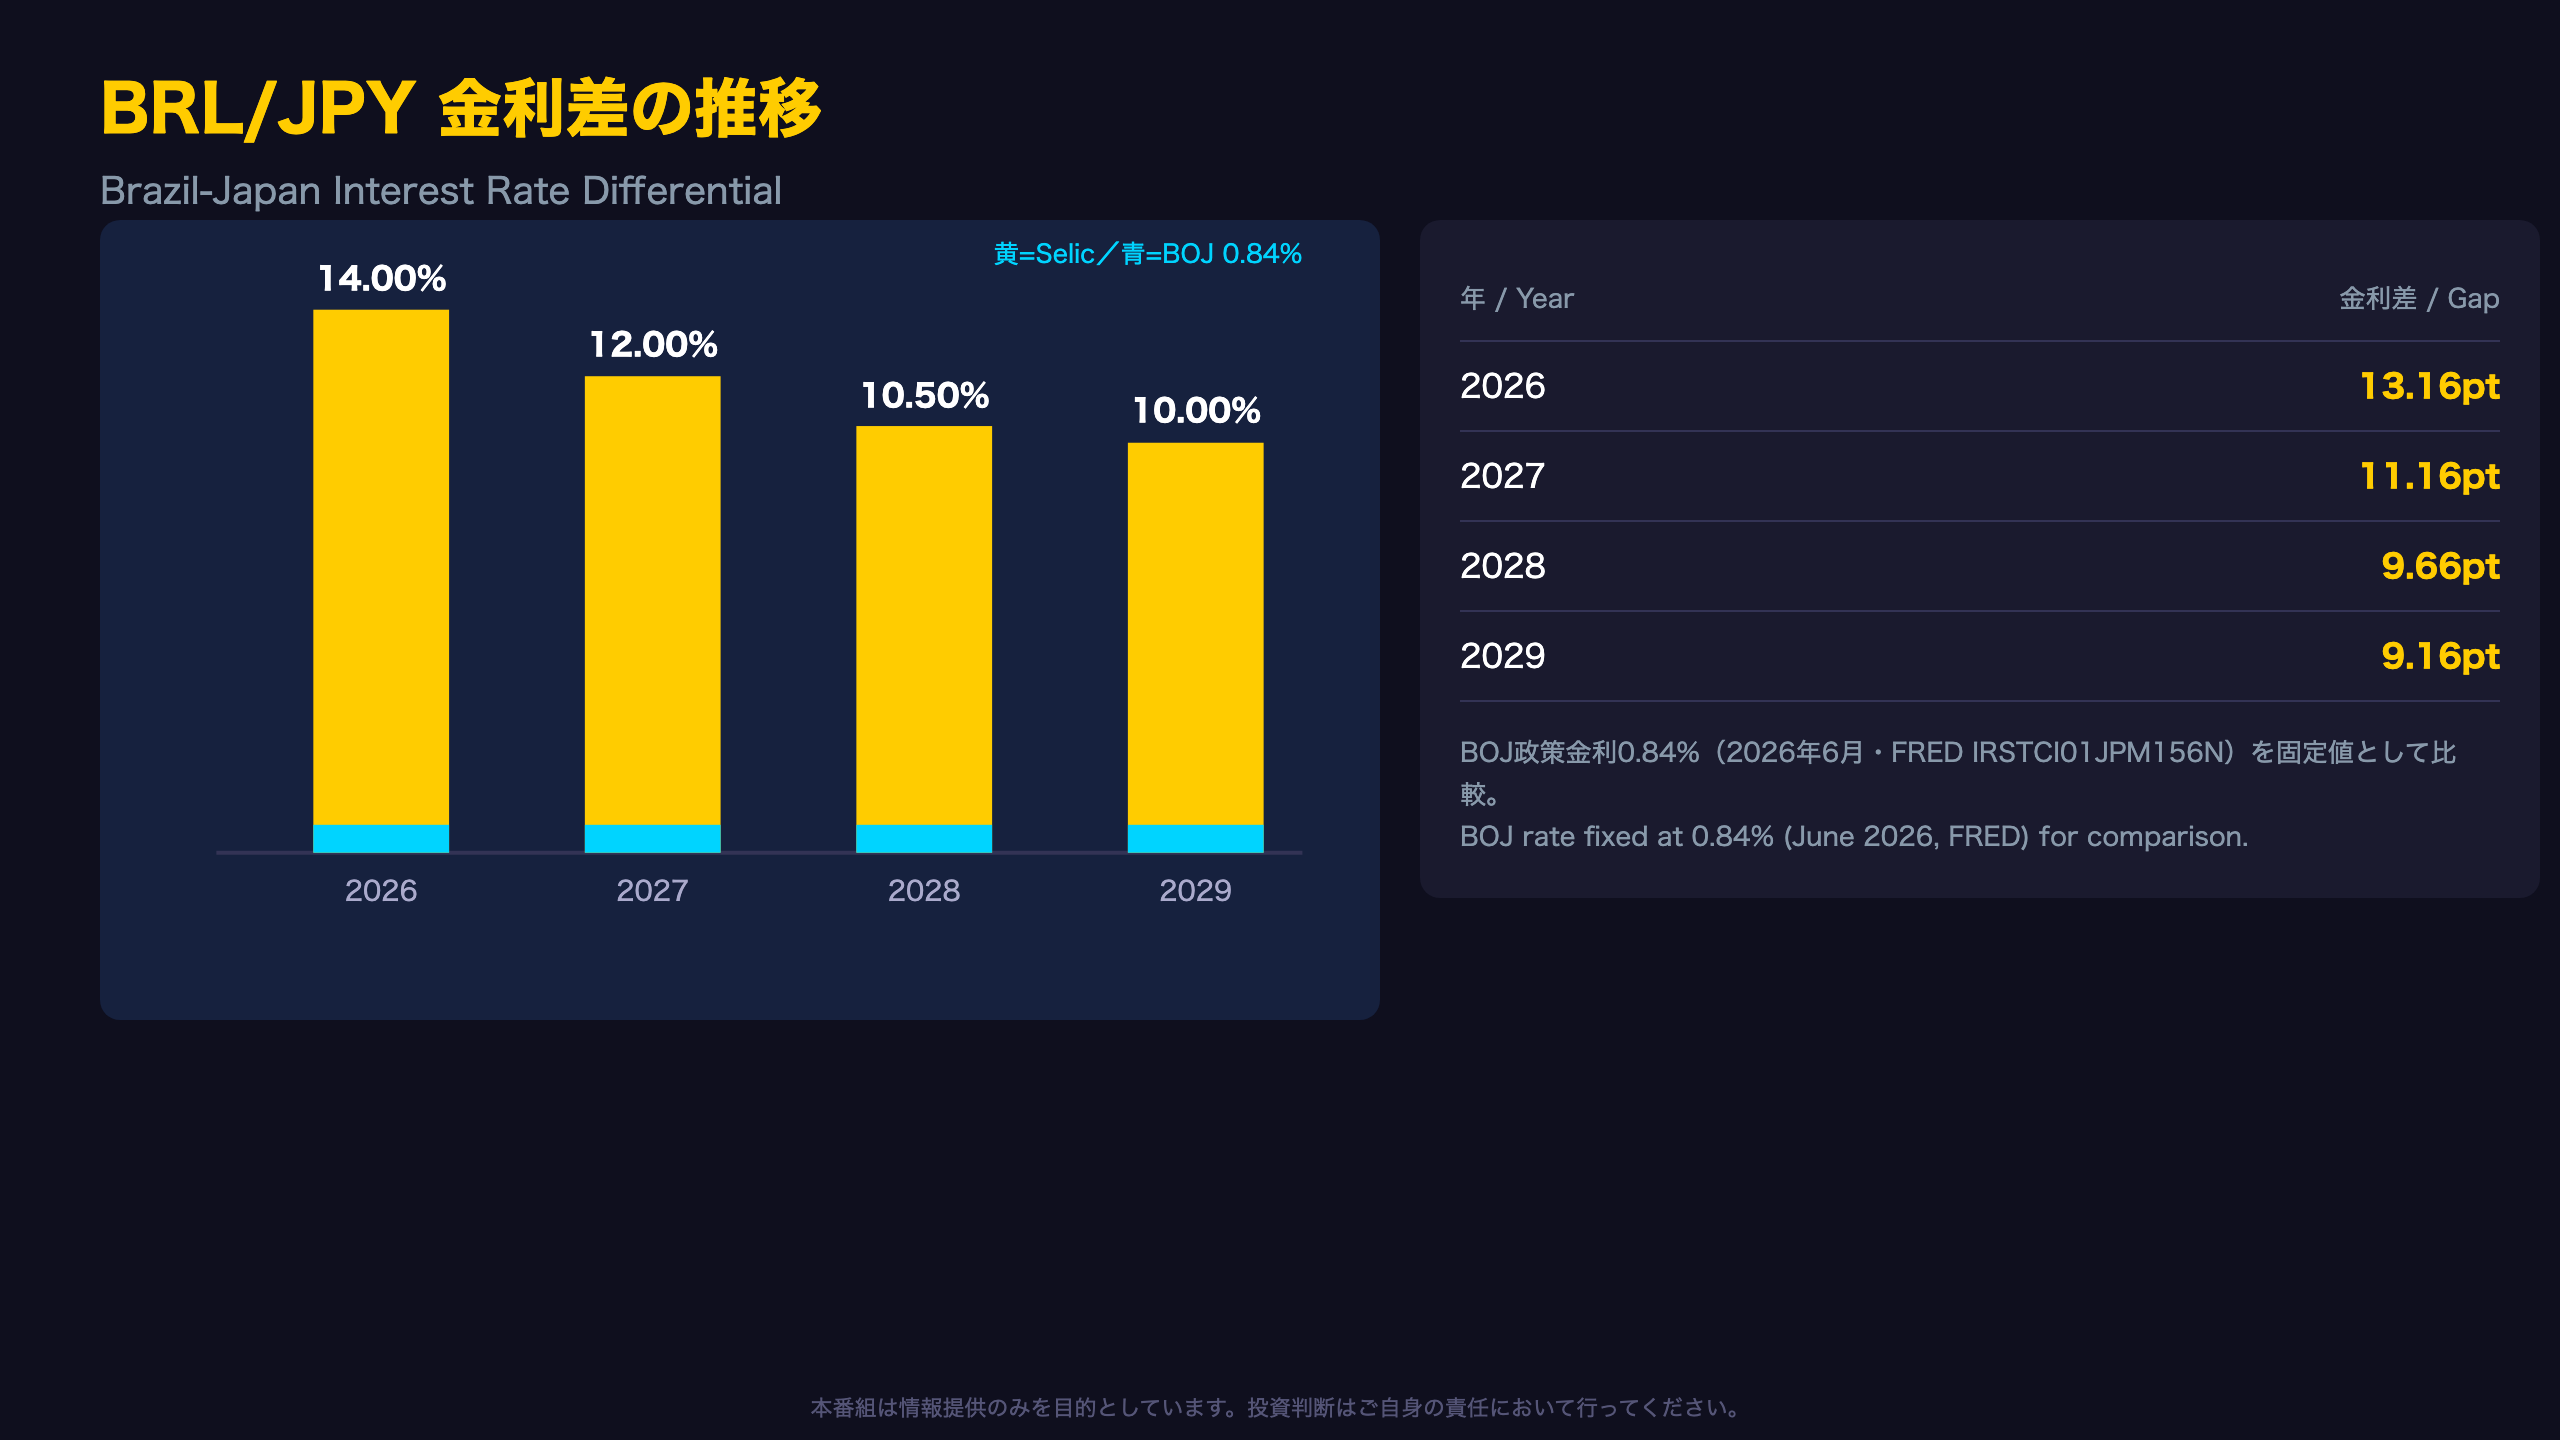
The Rate Gap Over Time
| Year | Selic Forecast | BOJ Policy Rate | Differential |
|---|---|---|---|
| 2026 | 14.00% | 0.84% | 13.16pt |
| 2027 | 12.00% | 0.84% | 11.16pt |
| 2028 | 10.50% | 0.84% | 9.66pt |
| 2029 | 10.00% | 0.84% | 9.16pt |
Note: Japan’s 0.84% rate (FRED series IRSTCI01JPM156N, June 2026) is held fixed for comparison purposes across years; the actual BOJ rate may change.
Currency Depreciation Priced In Is Modest
The Focus Report’s exchange rate path shows only a gradual move from 5.20 (2026) to 5.40 (2029) — roughly 3.8% depreciation over three years. On paper, this is dwarfed by the 9-13 percentage point annual rate differential, which is the core logic behind BRL/JPY carry trades that have drawn Japanese retail investors (via Nikkei-listed uridashi bonds and FX margin trading) for years, similar in concept to historical AUD/JPY or TRY/JPY carry strategies.
The Risk Side of the Ledger
Net public debt is projected to reach 79.05% of GDP by 2029. It is generally understood that rising sovereign debt ratios can widen credit spreads and pressure a currency — though this single report cannot confirm whether that risk will materialize. For Japanese investors holding Brazilian sovereign bonds or BRL-denominated assets, the rate differential is only one variable; currency volatility, credit risk, and liquidity risk all warrant equal weighting in any allocation decision.
市場インプリケーション:短期のディスインフレと長期の高止まりリスク
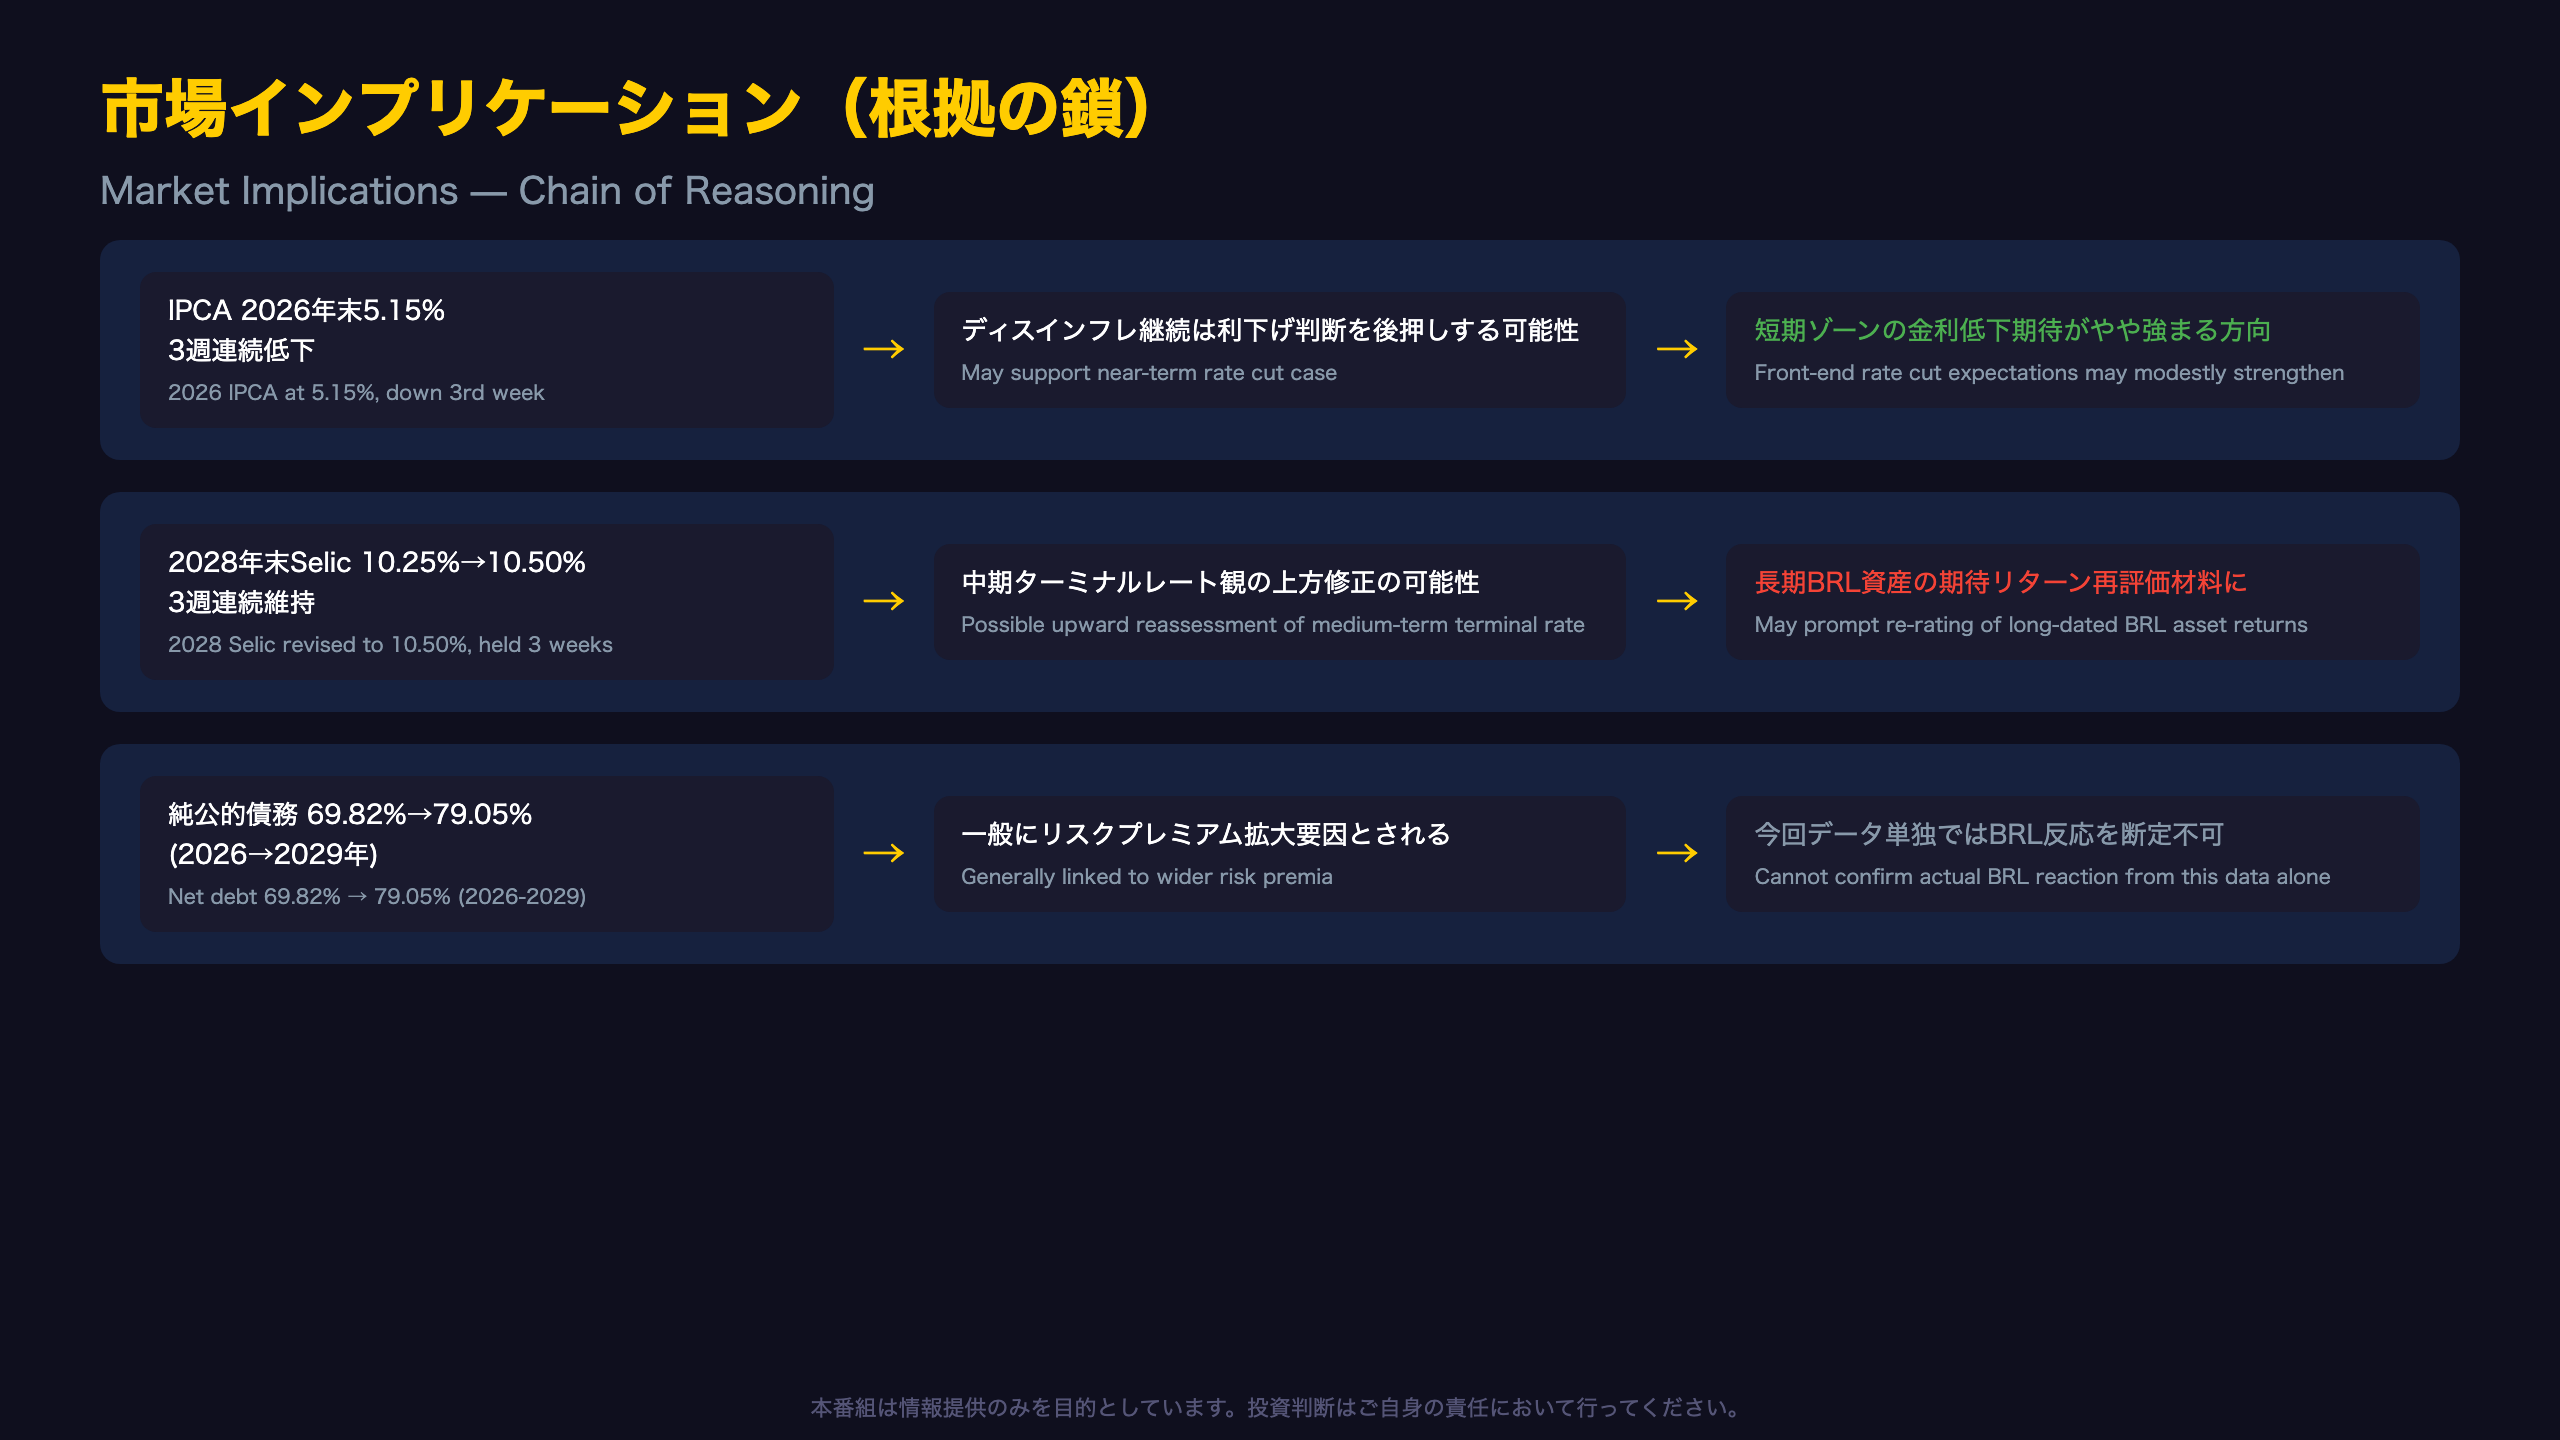
The Chain of Reasoning: What This Data Implies
Chain 1: Inflation and COPOM
[2026 year-end IPCA at 5.15%, down for a third straight week] → [Continued disinflation is generally understood to support the case for COPOM to resume or continue rate cuts] → [This may modestly reinforce near-term rate-cut expectations at the front end of Brazil’s yield curve]
Chain 2: The Terminal Rate Repricing
[2028 year-end Selic forecast revised from 10.25% to 10.50%, held for three weeks] → [Markets may be reassessing Brazil’s medium-term neutral rate higher] → [This could prompt a re-rating of expected returns on longer-dated BRL assets, though this remains a tentative signal from a single data series]
Chain 3: Fiscal Deterioration and Risk Premia
[Net public debt projected to rise from 69.82% (2026) to 79.05% (2029) of GDP] → [Rising debt-to-GDP ratios are generally associated with wider sovereign risk premia] → [This report alone cannot confirm the actual market reaction in BRL or Brazilian bond spreads]
The Focus Report is strictly a survey median of market participants — it does not represent BCB’s own policy stance. The next release on July 24 will be key to watching whether this week’s upward revisions and divergences persist.
For Japanese retail investors, the takeaway isn’t just the size of the rate differential, but understanding which time horizon each structural shift actually applies to when sizing any BRL allocation.
Disclaimer: This article is for informational purposes only. All investment decisions are made solely at your own risk.