📺 Watch the Full Video Analysis
This article was automatically generated by the NFC Market Live AI analysis system. (Updated: 2026-10-28 09:45 JST)
📄 Primary Source
Australian Bureau of Statistics
https://www.abs.gov.au/statistics/economy/price-indexes-and-inflation/consumer-price-index-australia/sep-2026
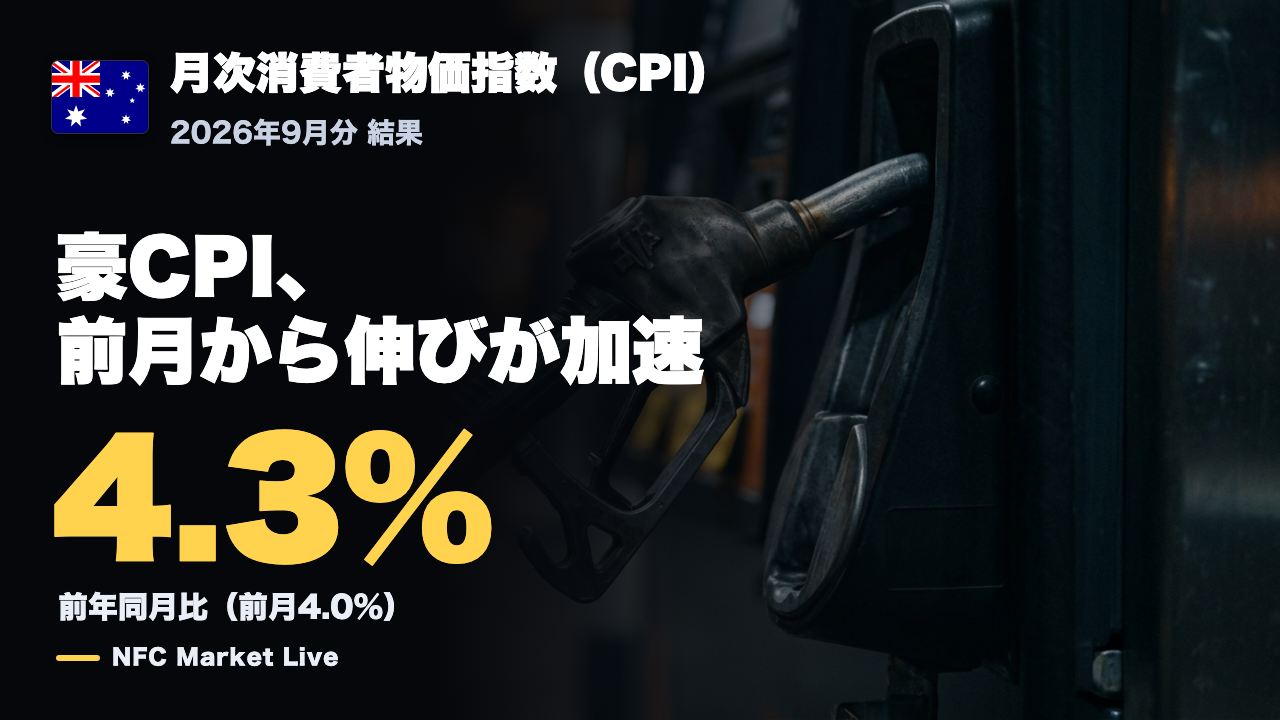
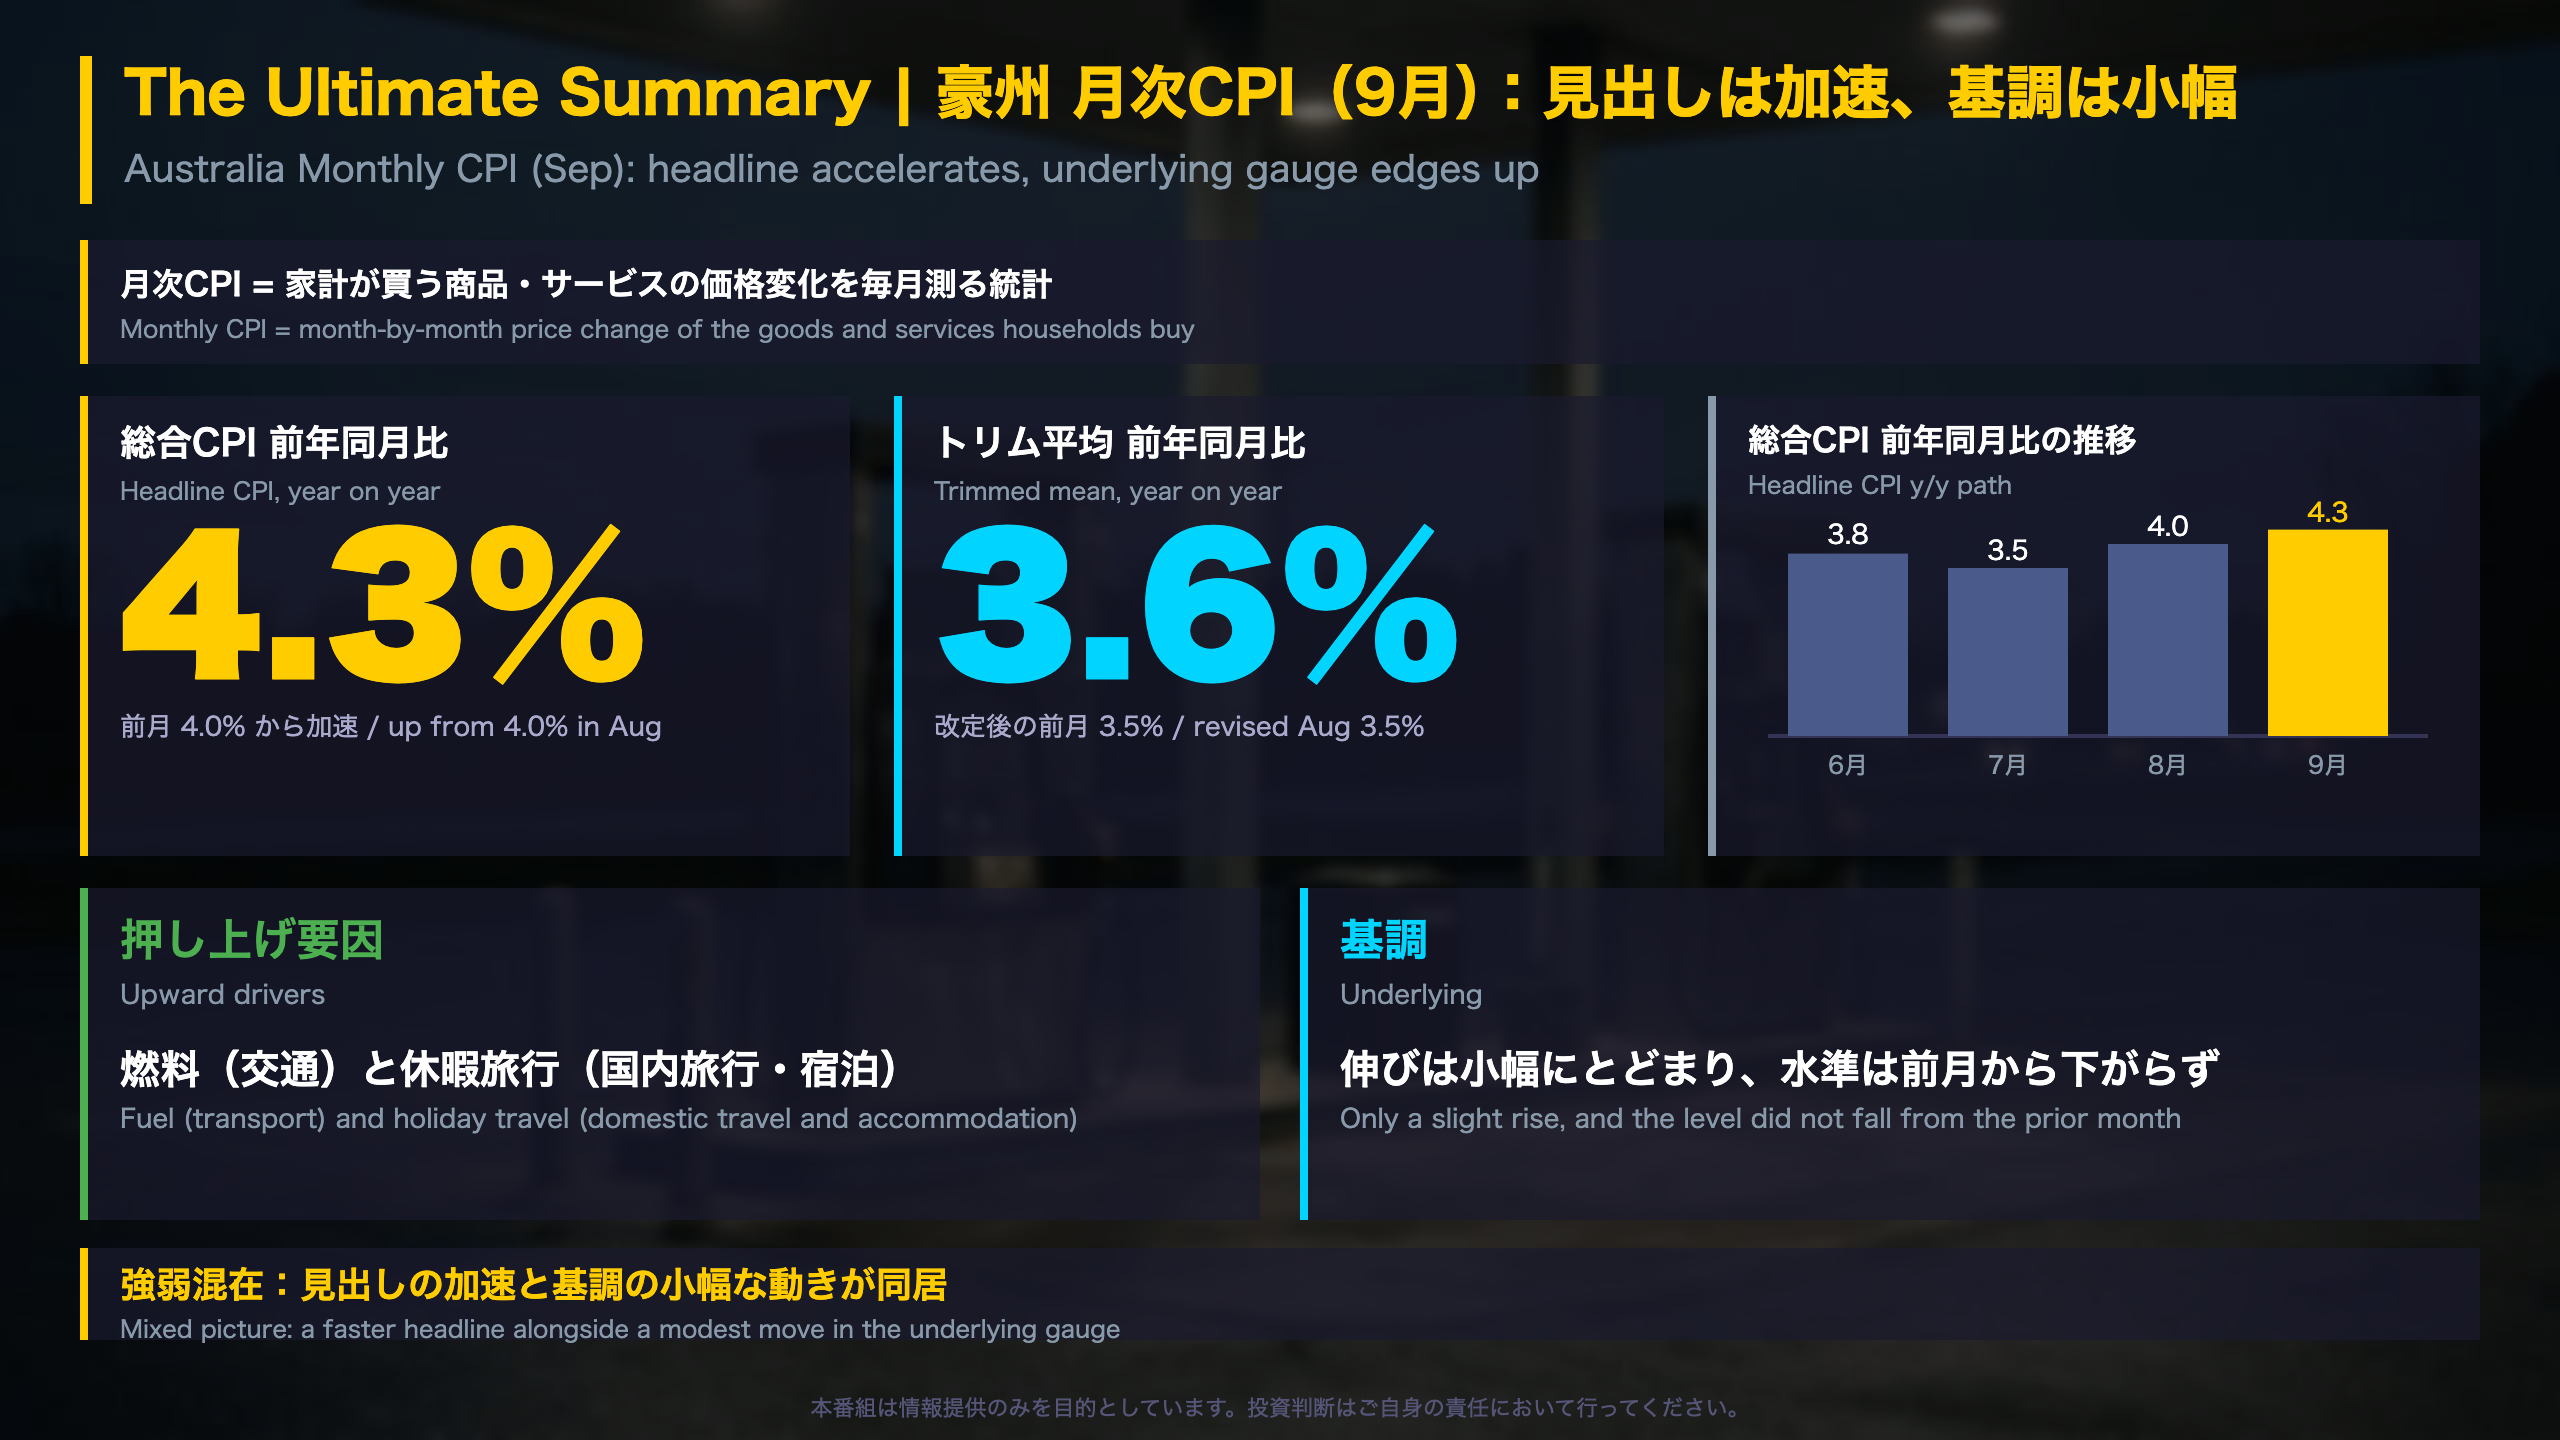
📊 Australia’s September monthly CPI rose 4.3% y/y, up from 4.0% in August.
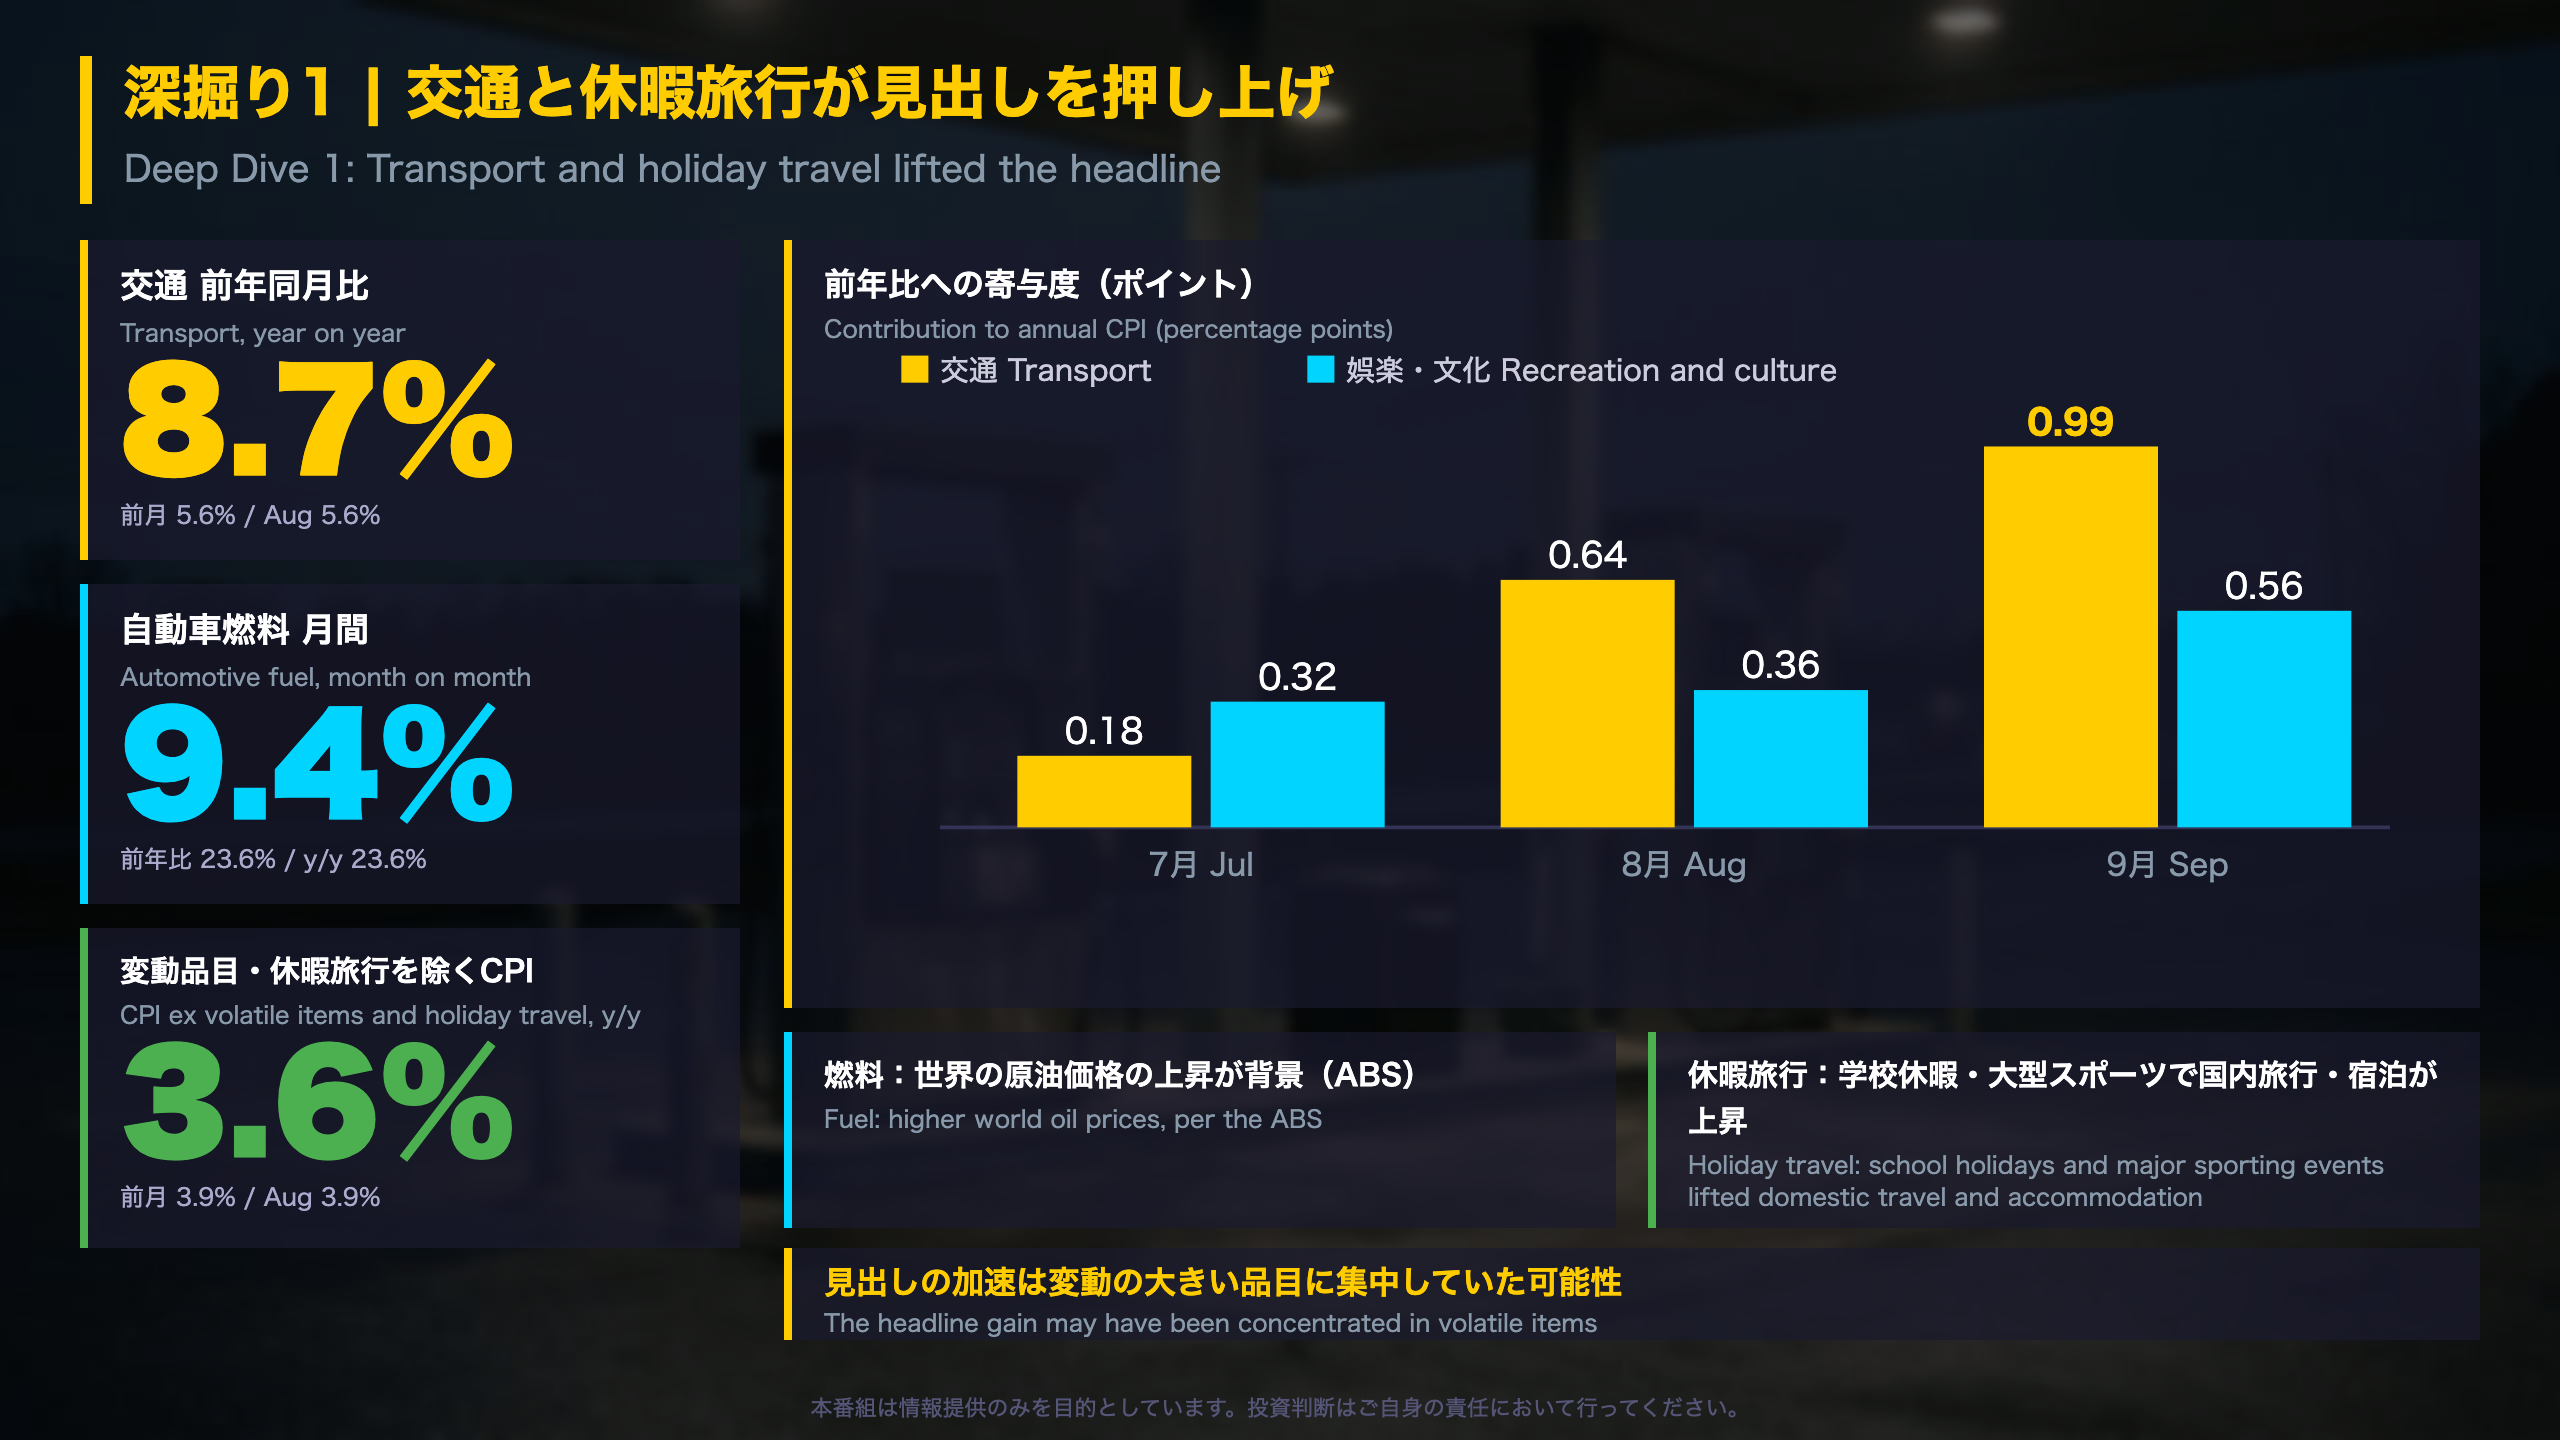
⛽ Transport was up 8.7% y/y and automotive fuel rose 9.4% in the month. Holiday travel also added to the gain.
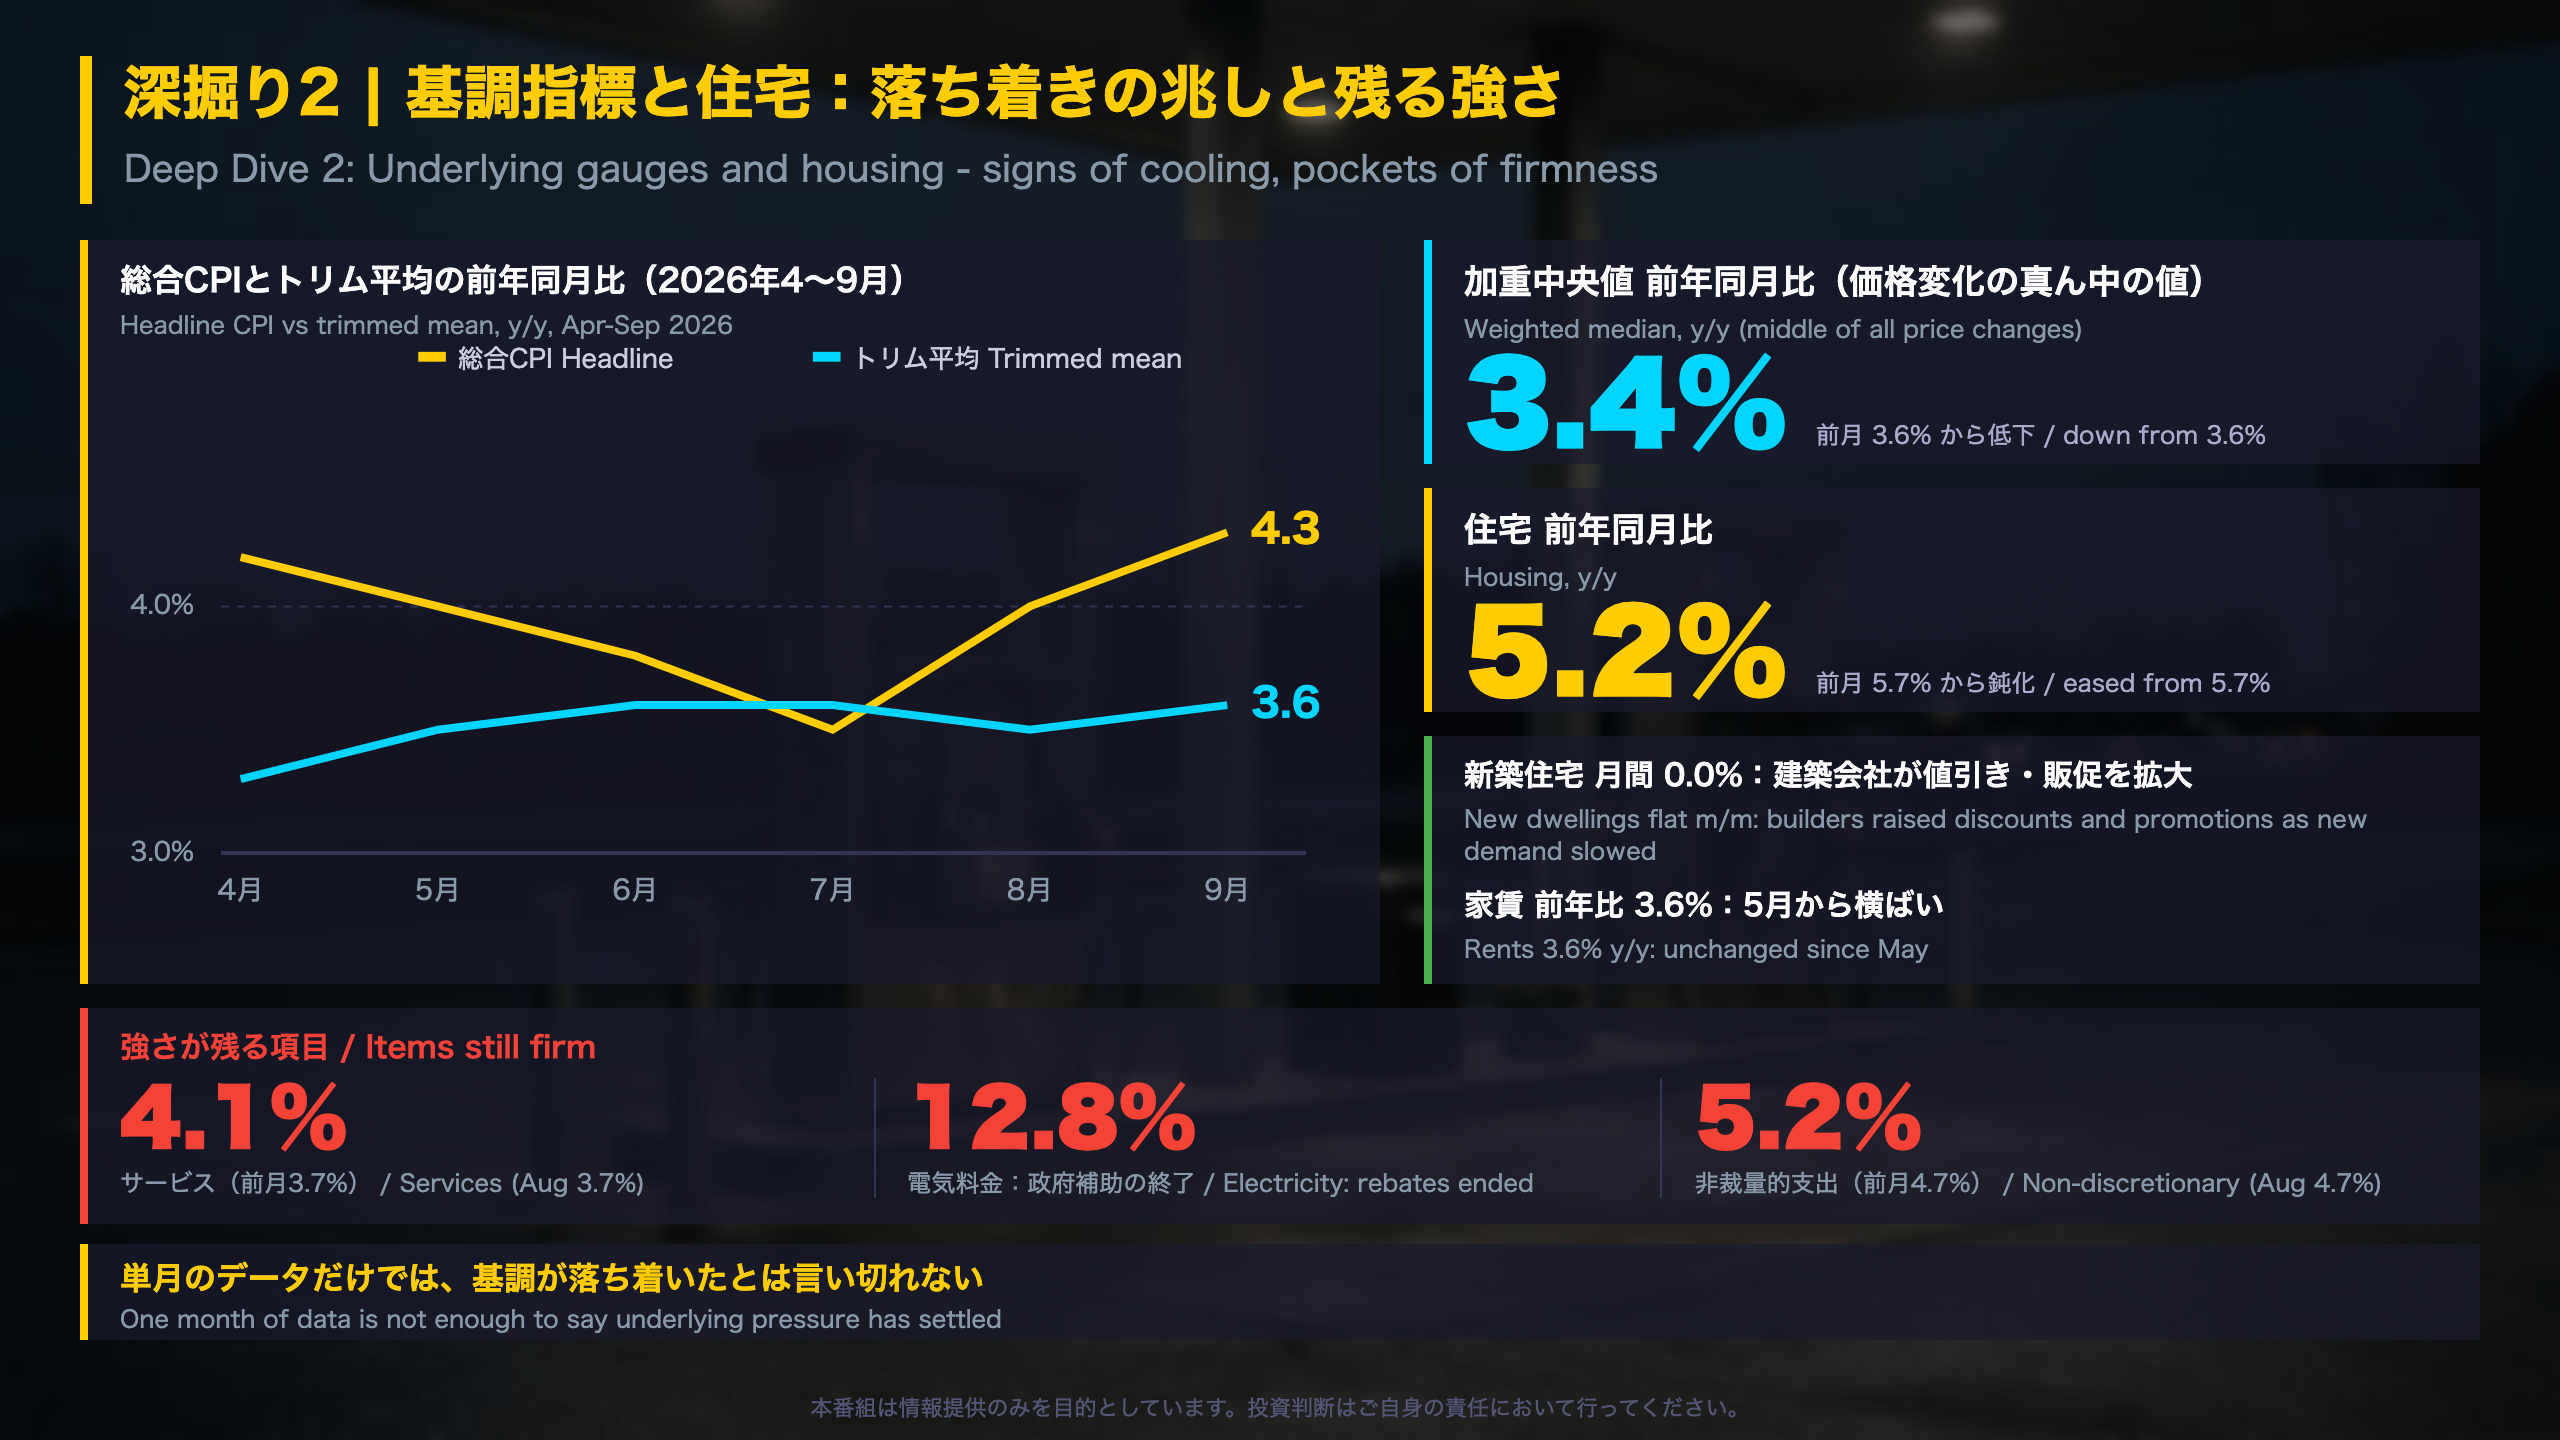
📉 The trimmed mean was 3.6% (August revised to 3.5%) and the weighted median was 3.4%, so the underlying pace rose only slightly.
💡 Still, services (4.1%) and non-discretionary spending (5.2%) remain firm.
⚠️ One month cannot settle the underlying trend. The October CPI is due on November 25.
The Ultimate Summary|豪州 月次CPI(9月)
Australia’s September CPI: Headline Up, Underlying Little Changed
The Australian Bureau of Statistics (ABS) published monthly CPI for September on October 28. The ABS has issued a complete monthly CPI since October 2025, so each print is noisier than the quarterly figures many investors are used to.
Key numbers
- Headline CPI: 4.3% y/y (4.0% in August); +0.8% m/m unadjusted, +0.6% seasonally adjusted
- Trimmed mean: 3.6% y/y (August was revised down to 3.5% from 3.6% on a change in seasonal factors)
- Weighted median: 3.4% y/y (3.6% previously)
Why the two gauges diverge
The trimmed mean discards the largest price rises and falls, which makes it a common cross-check on underlying inflation; the Reserve Bank of Australia (RBA) is among the policymakers who watch such measures. Fuel and holiday travel, both volatile, drove the headline move in September. CPI excluding volatile items and holiday travel eased to 3.6% from 3.9%.
International comparison
The US CPI is also monthly and is usually paired with a core series that excludes food and energy. Australia’s trimmed mean works differently, by statistically trimming the tails of the price-change distribution, so the two are not directly comparable.
What this article does not do
It does not forecast policy rates or the Australian dollar. The practical question for readers is whether underlying measures confirm the headline in coming releases. The October CPI is due on November 25, 2026.
‘CPI annual inflation was 4.3 per cent in the 12 months to September 2026, up from 4.0 per cent.’ (ABS)
深掘り1|交通と休暇旅行が押し上げた見出し
Transport and Holiday Travel Lifted September: A Breakdown
Contributions to annual CPI (percentage points)
| Month | Transport | Recreation and culture | Housing |
|---|---|---|---|
| Jul 2026 | 0.18 | 0.32 | 1.10 |
| Aug 2026 | 0.64 | 0.36 | 1.24 |
| Sep 2026 | 0.99 | 0.56 | 1.14 |
Housing’s contribution slipped while transport added about 0.35 points and recreation about 0.20 points (arithmetic from the ABS table).
Fuel is moving in big steps
Automotive fuel was up 23.6% y/y, with a 9.4% monthly gain in September following 14.8% in August, when the last of the federal fuel excise relief also unwound. The ABS cites ‘higher world oil prices’. Two big months in a row means this is not a one-off, but fuel is classed by the ABS as a volatile item, so single-month contributions should be read with care.
Holiday travel swings
Recreation and culture rose 3.8% m/m, led by domestic holiday travel and accommodation (+8.0%) on school holidays and major sporting events. In August that line had fallen 4.9%, so the swing across two months is large. Games, toys and hobbies were up 15.5% y/y as higher memory and storage component costs were passed on.
Other moves
Clothing and footwear fell 2.7% m/m, and accessories slowed to 5.3% y/y from 12.7% as gold prices fell. Tobacco eased to 8.3% y/y from 11.5% after an extra 5% excise that had applied in the previous three Septembers ended.
International context
Energy-driven swings in headline inflation are familiar elsewhere too, for example in the US, where core measures exist partly to see through them. This article makes no forecast for rates or the currency.
‘Automotive fuel rose 9.4%, driven by higher world oil prices.’ (ABS)
深掘り2|基調指標と住宅の動き
Underlying Gauges and Housing: Signs of Cooling, Pockets of Firmness
Underlying measures
| Measure | m/m | y/y |
|---|---|---|
| Trimmed mean | 0.3% | 3.6% |
| Weighted median | 0.2% | 3.4% |
| CPI ex volatile items | 0.5% | 3.7% |
| CPI ex volatile items and holiday travel | 0.0% | 3.6% |
Because August’s trimmed mean was revised down to 3.5% on a change in seasonal factors, September’s 3.6% is a small rise rather than a flat reading. The weighted median, by contrast, slipped from 3.6%.
Housing detail
Housing was 5.2% y/y (5.7% in August).
– New dwellings 4.7% y/y (5.4% prior); flat m/m as some builders raised discounts and promotions in response to slowing new demand
– Electricity 12.8% y/y, largely reflecting the end of Commonwealth electricity rebates
– Rents 3.6% y/y, unchanged since May; excluding the 20 September indexation of Commonwealth Rent Assistance, monthly rent growth would have been 0.3% rather than 0.2%
Where firmness remains
Tradables rose to 4.0% from 2.9%, driven in part by fuel, while non-tradables held at 4.5%, a domestic-price reading that has not eased. Services were 4.1% and non-discretionary items 5.2%.
Comparison and caution
The split between a domestic (non-tradables) series and an imported-price (tradables) series is a useful feature of the Australian CPI that the US CPI does not publish in the same form. Mixed signals across series argue for judging the trend over several months. This article does not forecast policy or the currency.
質疑で深める|残る強さと次の確認点
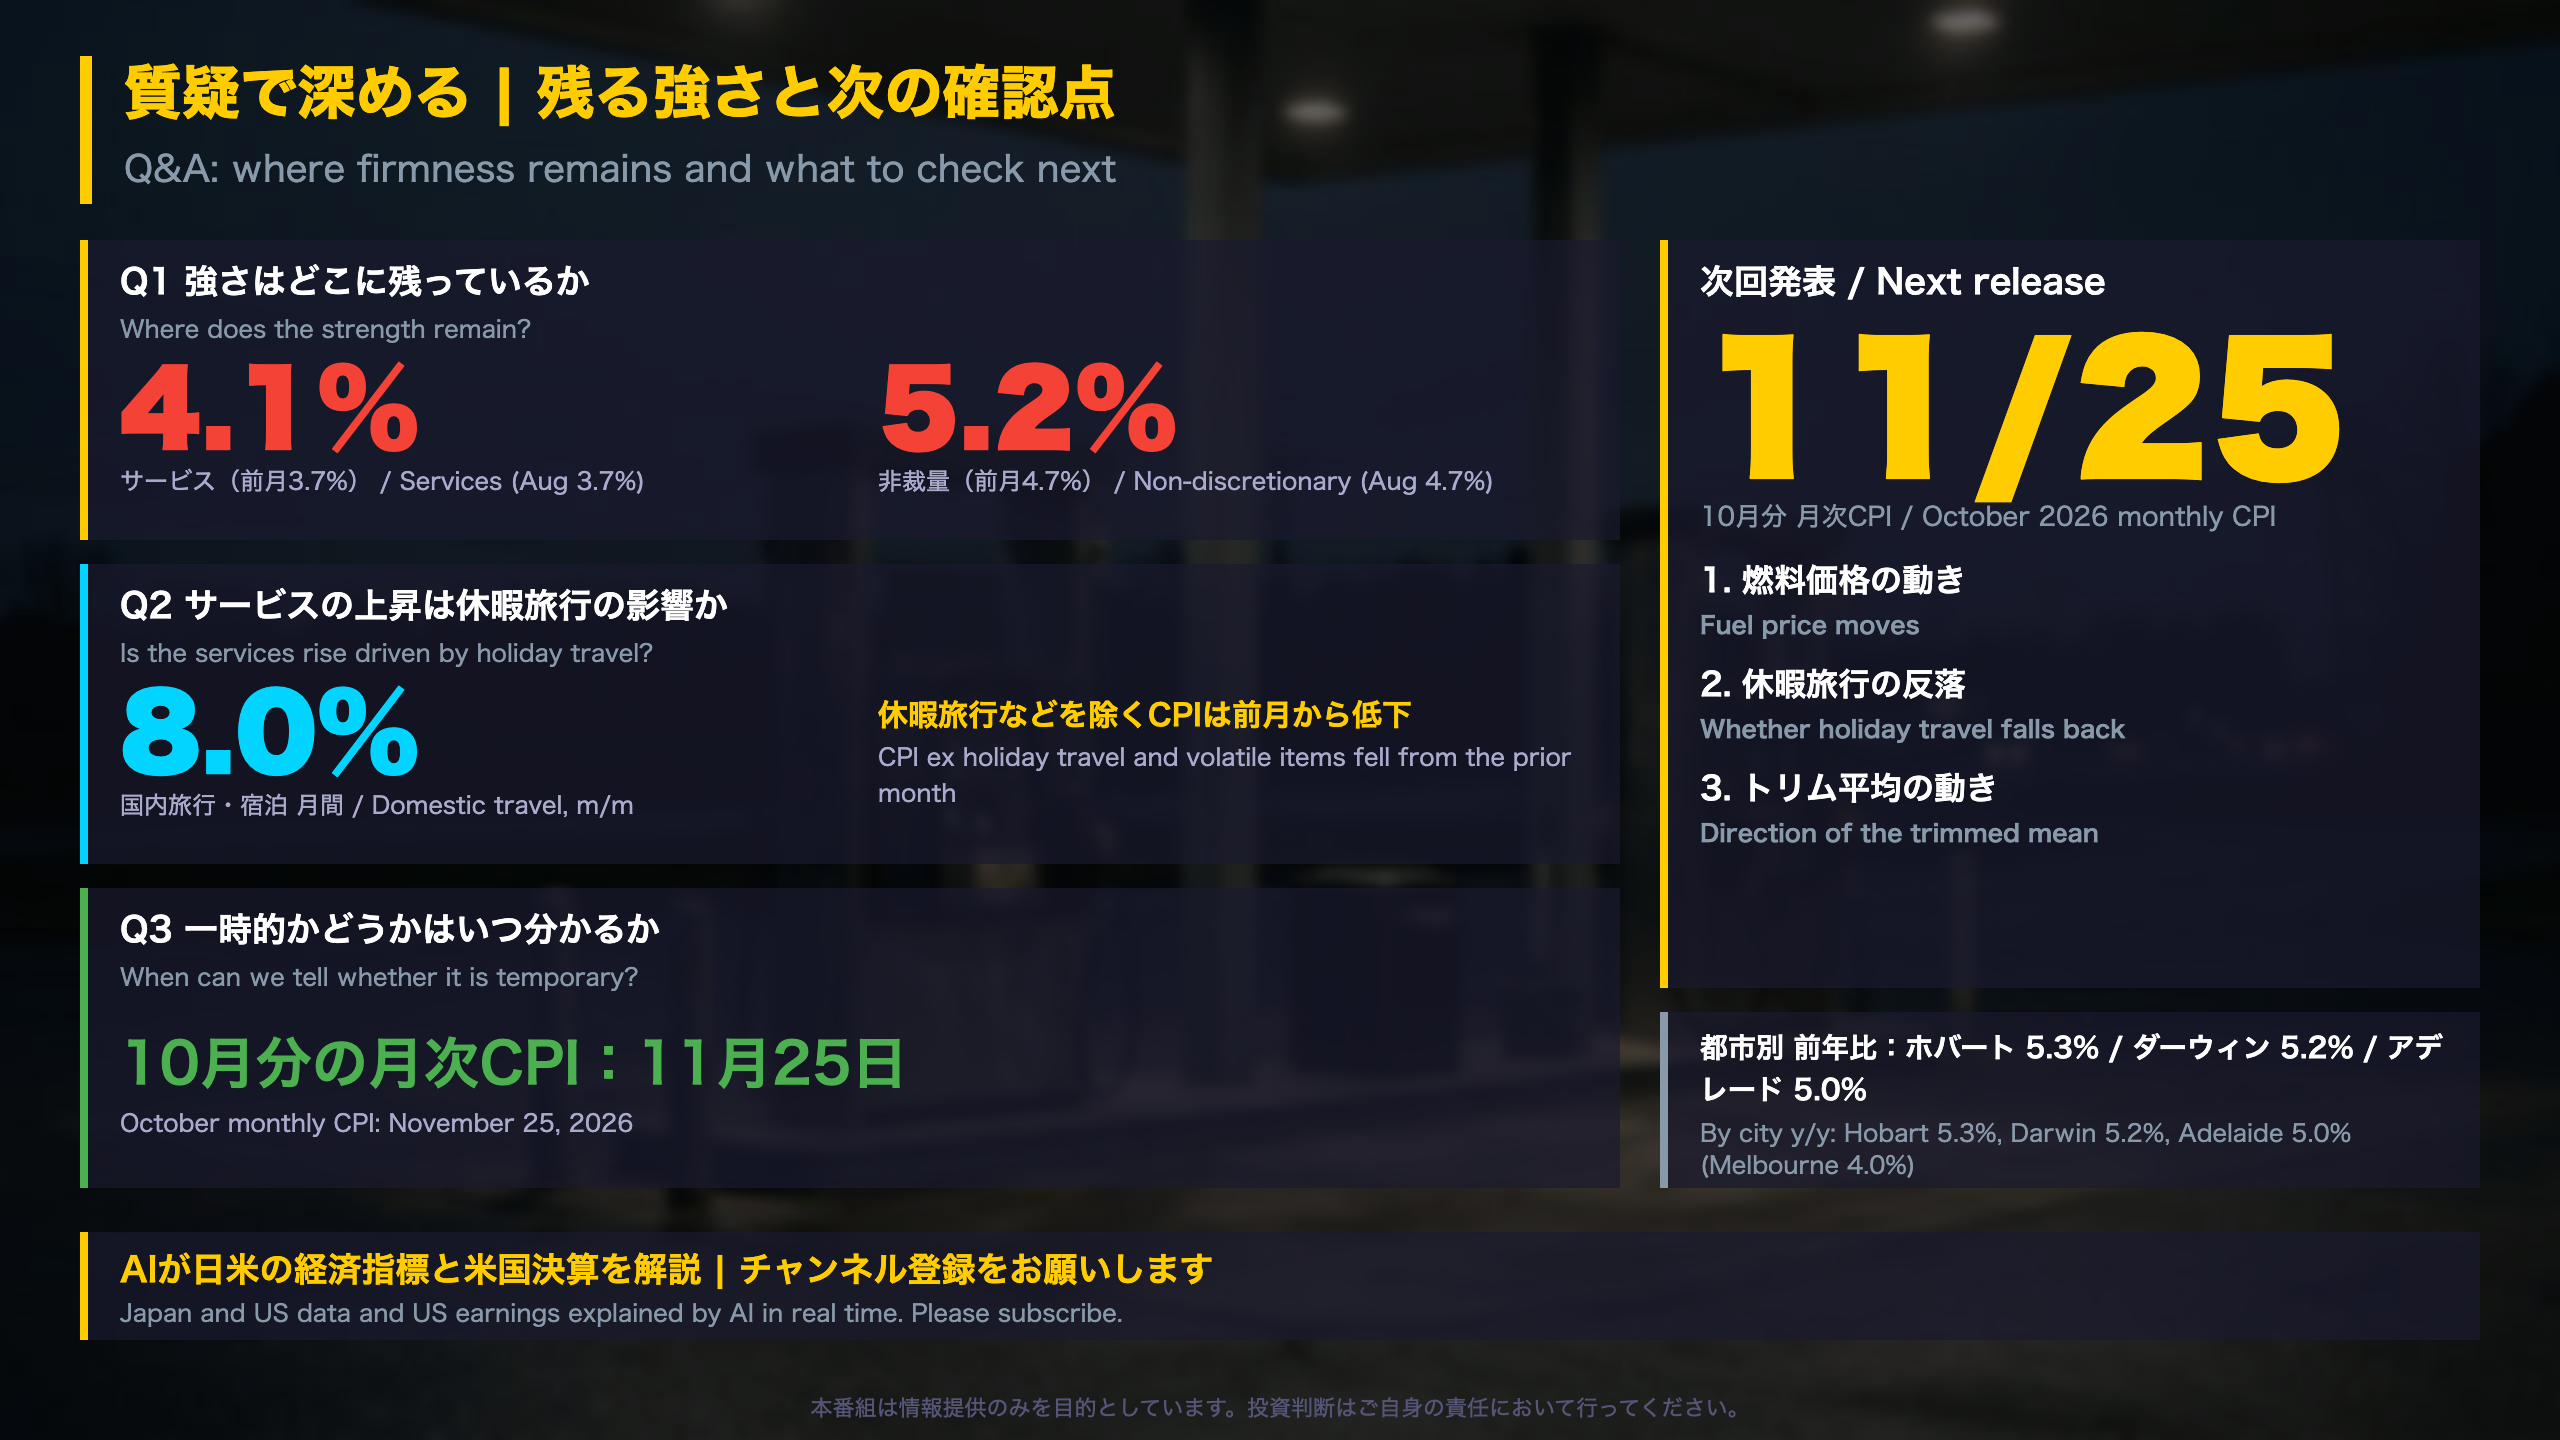
Q&A Notes: City Gaps and the Release Calendar
September y/y by capital city
| City | All groups | Housing | Transport |
|---|---|---|---|
| Hobart | 5.3% | 6.9% | 10.4% |
| Darwin | 5.2% | 7.6% | 10.6% |
| Adelaide | 5.0% | 7.3% | 10.6% |
| Canberra | 4.7% | 5.1% | 10.4% |
| Perth | 4.5% | 5.0% | 10.4% |
| Brisbane | 4.4% | 5.4% | 8.3% |
| Sydney | 4.3% | 5.8% | 8.3% |
| Melbourne | 4.0% | 3.8% | 8.0% |
The gap between the highest (Hobart) and lowest (Melbourne) city is 1.3 percentage points. Five cities show transport inflation above 10%, which is consistent with fuel’s weight in that group.
Is the services rise just holiday travel?
Services inflation rose to 4.1% from 3.7%. Domestic holiday travel and accommodation rose 8.0% m/m, so it is a plausible contributor. However, CPI excluding volatile items and holiday travel fell to 3.6% from 3.9%, and the data here cannot prove that holiday travel explains all of the services move.
Child care
Child care inflation slowed to 4.4% y/y from 10.3% a year earlier. The ABS points to the replacement of the activity test by the ‘3 day guarantee’, indexation of income thresholds and hourly rate caps, and fee growth.
Calendar
- Nov 25, 2026: October CPI
- Jan 6, 2027: November CPI
- Jan 27, 2027: December CPI
- From February 2027 the CPI moves to the fourth Wednesday of each month
- CPI weights update with January 2027 data, published February 24, 2027
Why the base matters
Monthly CPI in October 2025 was 0.0%, so the October 2026 annual rate will move almost one-for-one with this October’s monthly change. That is arithmetic, not a forecast. Readers tracking rates or the Australian dollar should note this article does not make market calls.
Disclaimer: This article is for informational purposes only. All investment decisions are made solely at your own risk.