📺 Watch the Full Video Analysis
This article was automatically generated by the NFC Market Live AI analysis system. (Updated: 2026-09-30 10:42 JST)
📄 Primary Source
Reserve Bank of Australia
https://www.rba.gov.au/statistics/frequency/fin-agg/2026/fin-agg-0826.html
🇦🇺 A deep dive into the RBA’s latest monetary aggregates (Table D3) release.
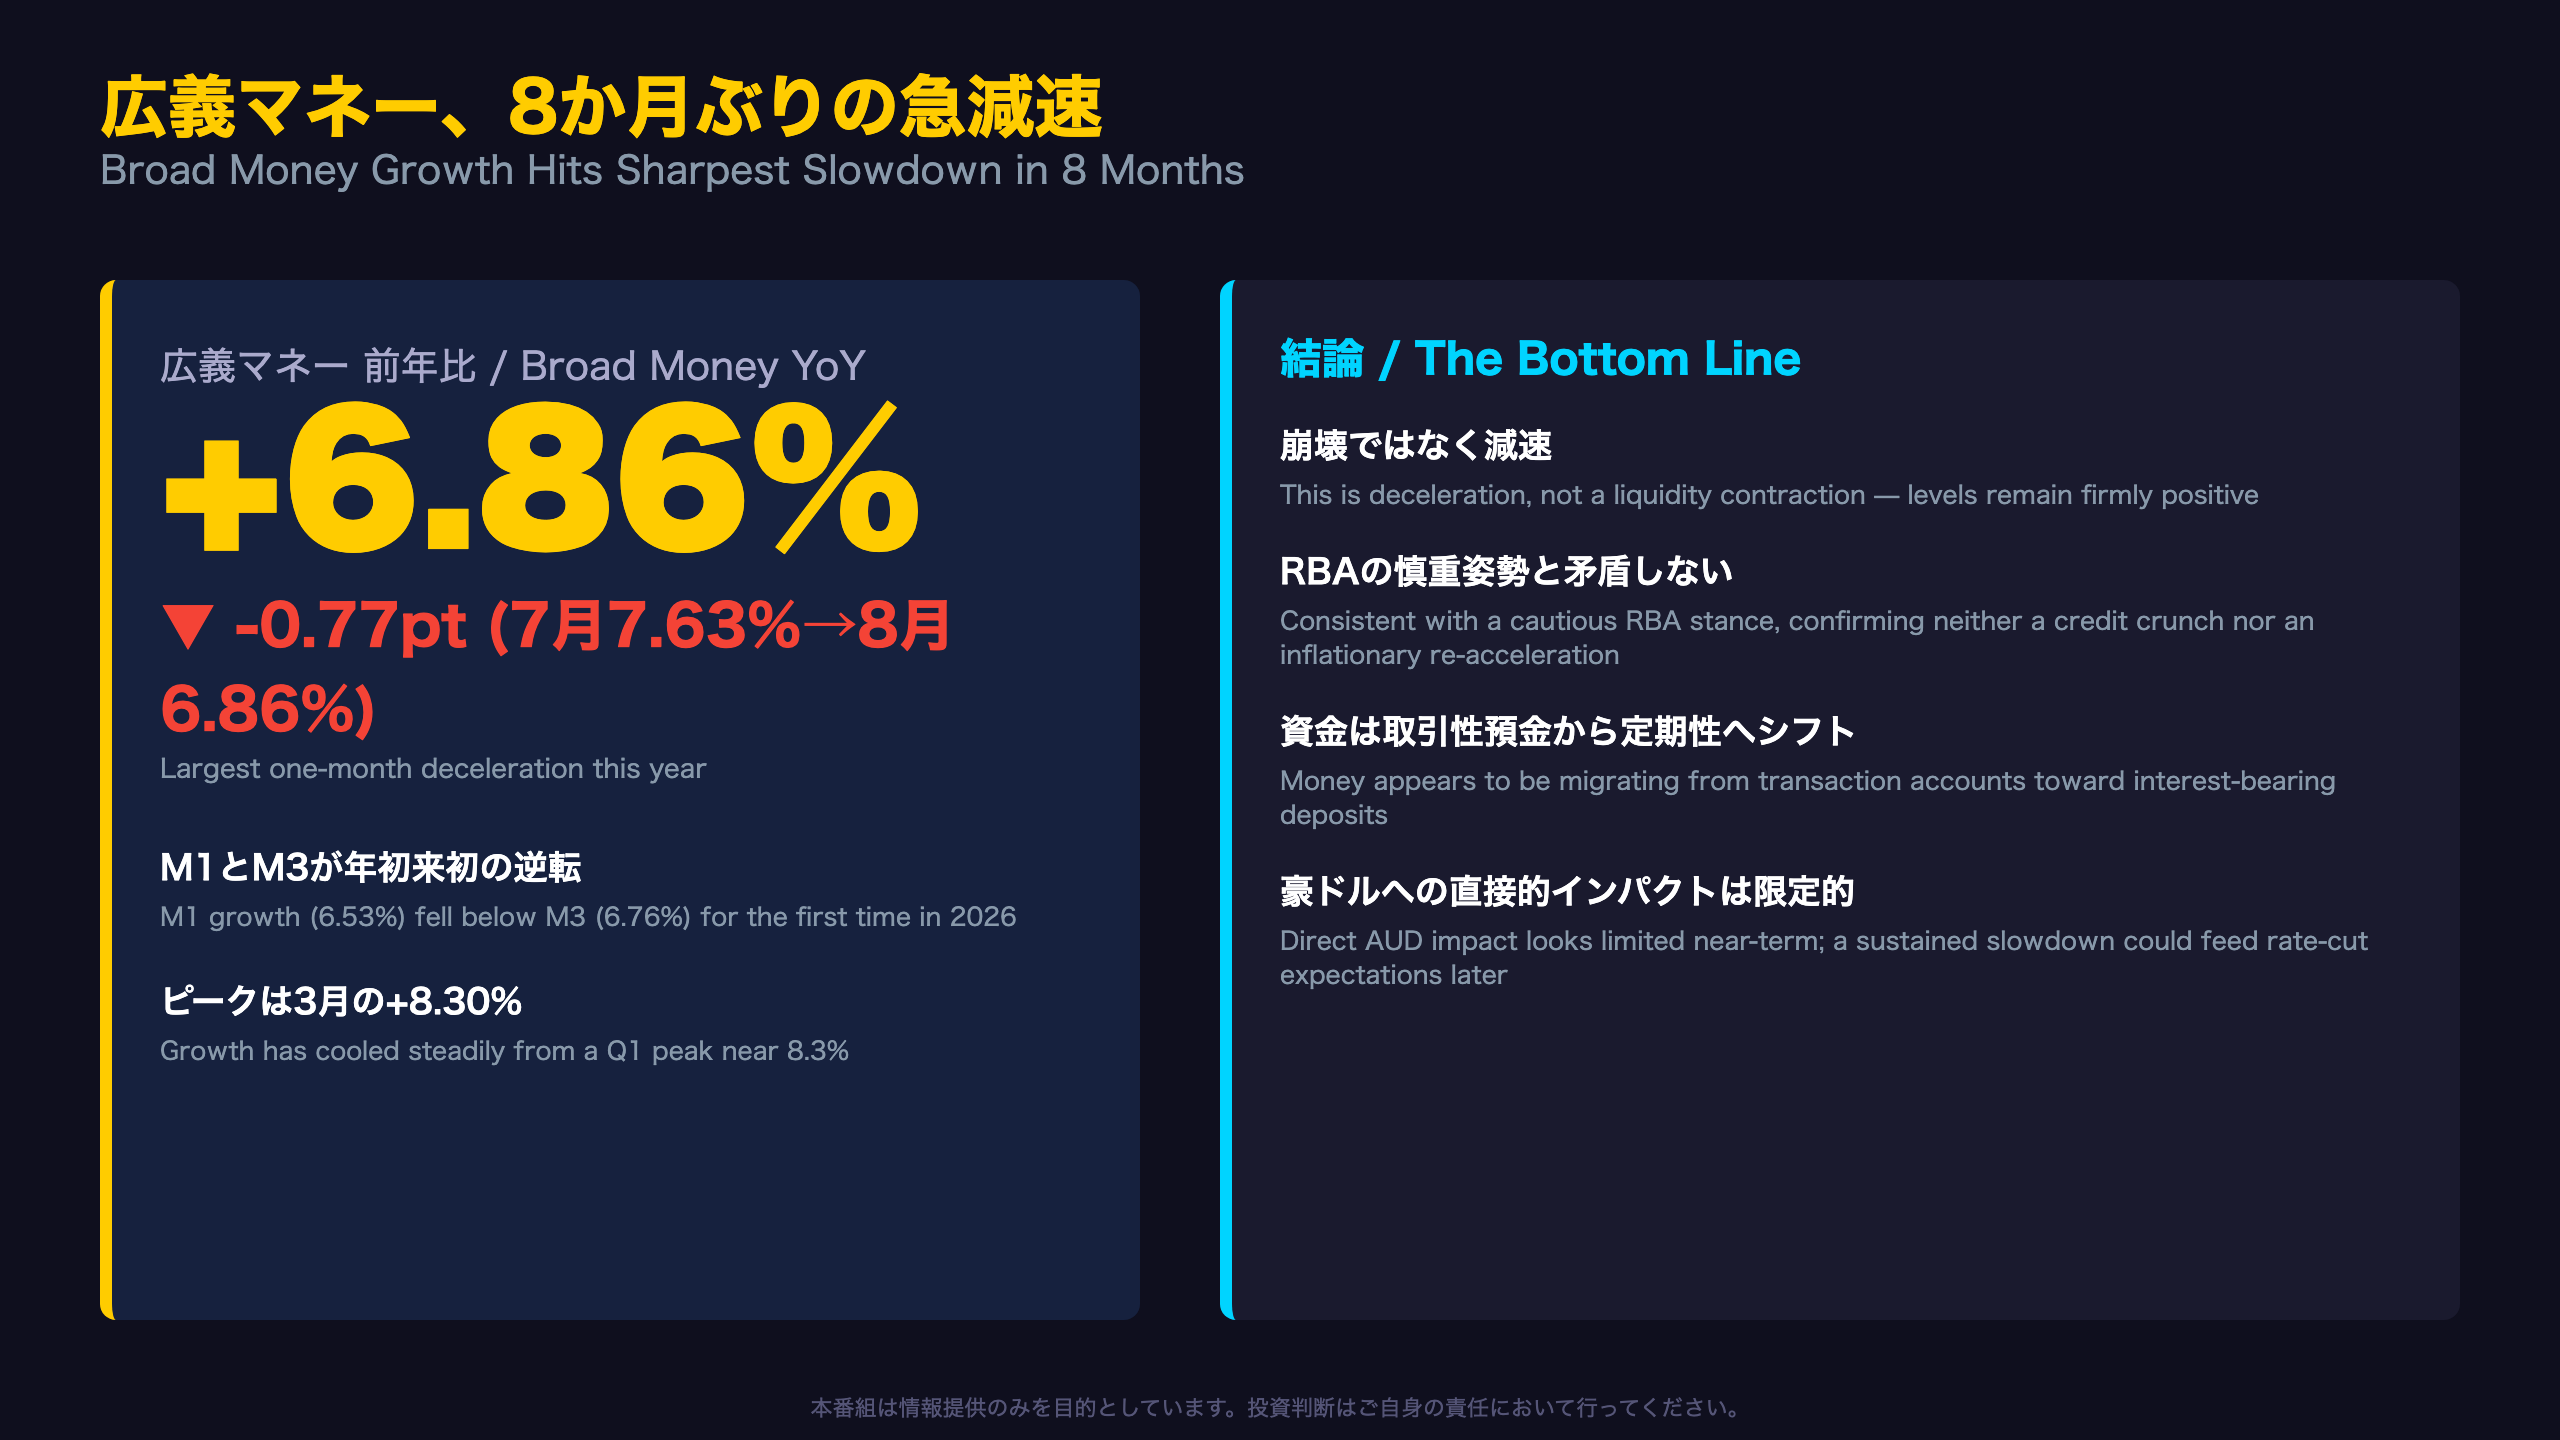
📊 Broad Money growth slowed from 7.63% YoY in July to 6.86% in August — the sharpest one-month deceleration this year.
📉 M1 (narrow money) growth also fell below M3 growth for the first time in 2026, a notable crossover.
⚠️ Seasonally-adjusted figures, however, all remained positive — this is deceleration, not collapse.
💡 We break down what this liquidity shift means for RBA policy and the Australian dollar.
The Ultimate Summary:広義マネー、8か月ぶりの急減速
What Is Broad Money?
Broad Money is the RBA’s headline measure of total currency and deposits circulating in Australia’s financial system, published monthly in Statistical Table D3. As of August 2026, seasonally-adjusted Broad Money stood at A$3,510.14 billion, up 6.86% year-on-year.
Context for International Readers
Unlike the US Fed’s M2 or the ECB’s M3, which are watched primarily as inflation-transmission gauges, the RBA does not target money supply growth directly — but analysts use it as a real-time cross-check on credit and liquidity conditions alongside the RBA’s cash rate decisions.
Historical Comparison
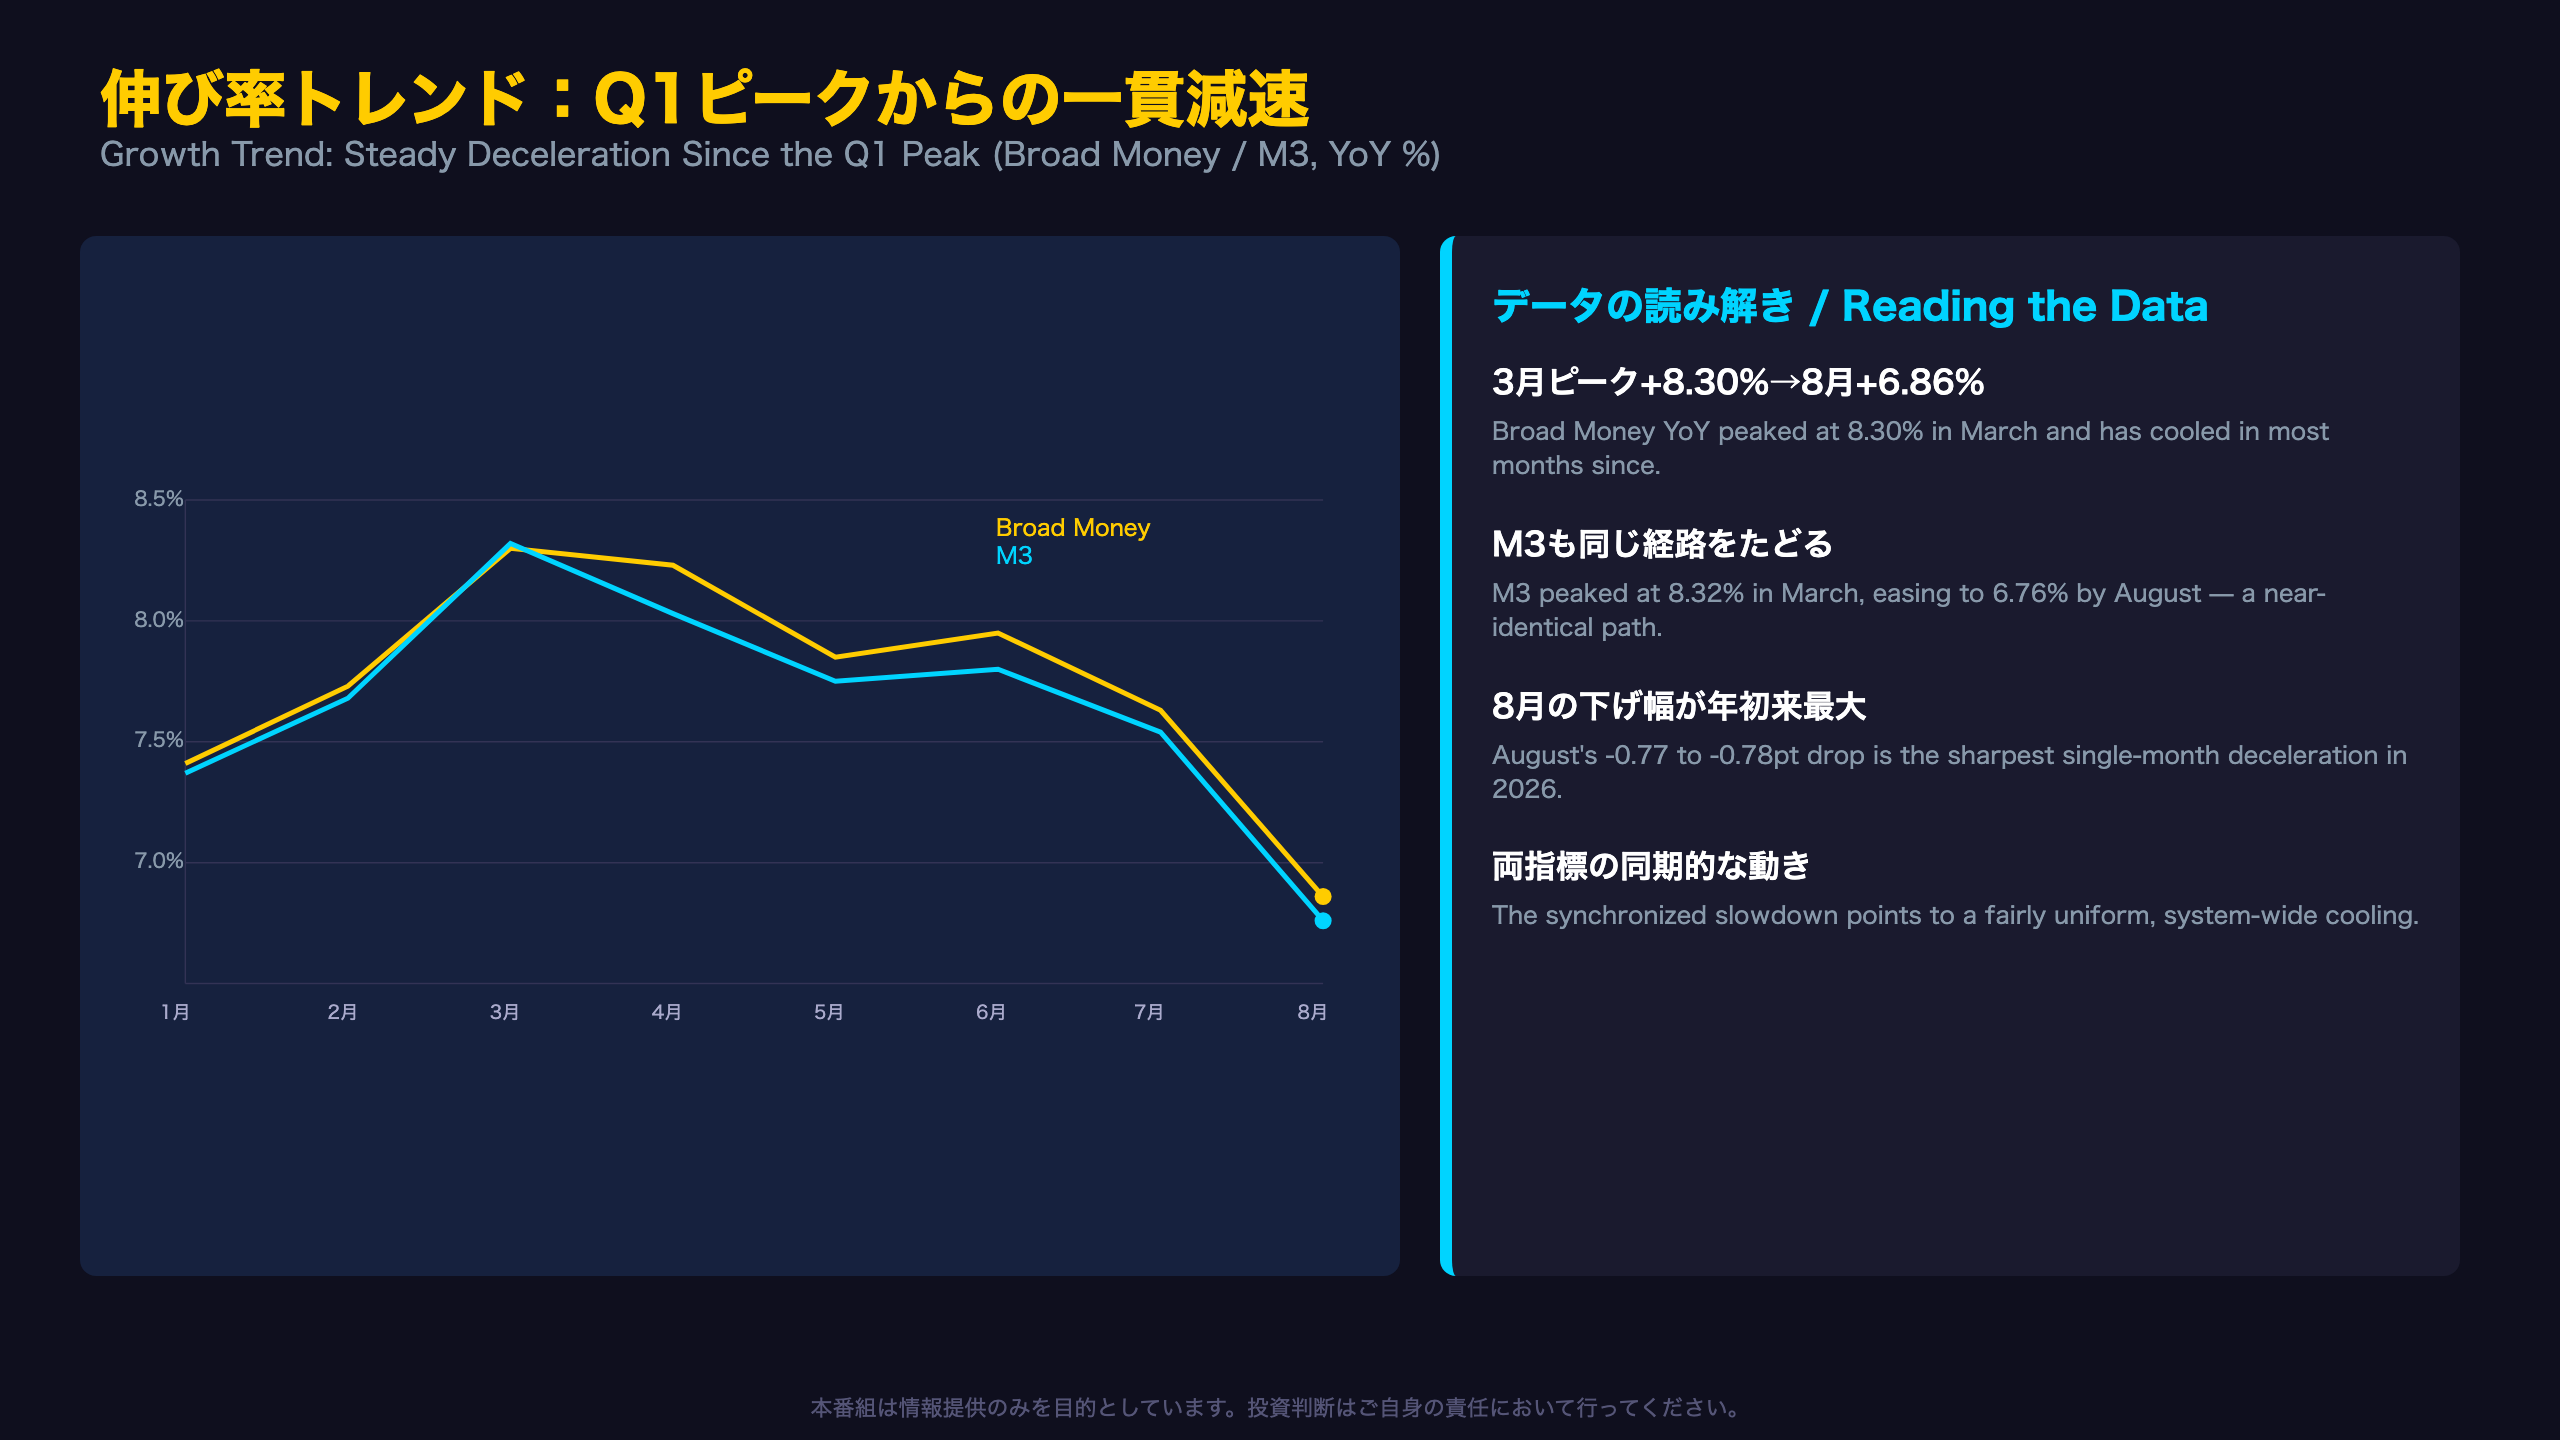
Growth peaked at 8.30% in March 2026 and has since decelerated, with August’s -0.77 percentage-point drop the sharpest single-month slowdown this year. Pre-pandemic era (2015-2019) Broad Money growth in Australia typically ran near 5-6%, meaning the current pace remains only modestly above that longer-run norm.
Two Readings
A hawkish-leaning read: a rapid slide from 8%-plus in Q1 suggests policy tightening is transmitting faster than expected. A more sanguine read: growth remaining near 6.9% shows the system is far from a genuine liquidity squeeze.
What’s Next
September data will show whether this deceleration streak extends to six months, and whether the M1-M3 growth crossover persists.
伸び率トレンド:Q1ピークからの一貫減速
The Full Monthly Picture
Plotting year-on-year growth from January through August reveals a clear hump shape, with Broad Money and M3 tracking almost in lockstep.
| Month | Broad Money | M3 |
|---|---|---|
| Jan | 7.41% | 7.37% |
| Mar (peak) | 8.30% | 8.32% |
| Jun | 7.95% | 7.80% |
| Jul | 7.63% | 7.54% |
| Aug | 6.86% | 6.76% |
A Sub-Indicator Worth Watching: The Monetary Base
The Monetary Base (a separate RBA series tracking currency plus Exchange Settlement balances) swung between roughly A$278bn and A$322bn through 2026 — far more volatile than Broad Money, since it is heavily influenced by RBA market operations and bank reserve management rather than underlying credit growth. This is comparable to how the US monetary base can diverge sharply from M2 due to Fed balance-sheet operations.
Bull vs. Bear Read
A constructive reading: growth near 7% remains healthy even after five months of cooling from the March peak. A more cautious reading: the pace of deceleration is itself accelerating — from -0.32 points in June-to-July to -0.77 points in July-to-August — raising the question of whether the slowdown compounds further.
September’s release will show whether this deceleration trend extends or stabilizes.
見かけの急落:NSAとSAの乖離を読み解く
Why NSA and SA Diverge So Sharply
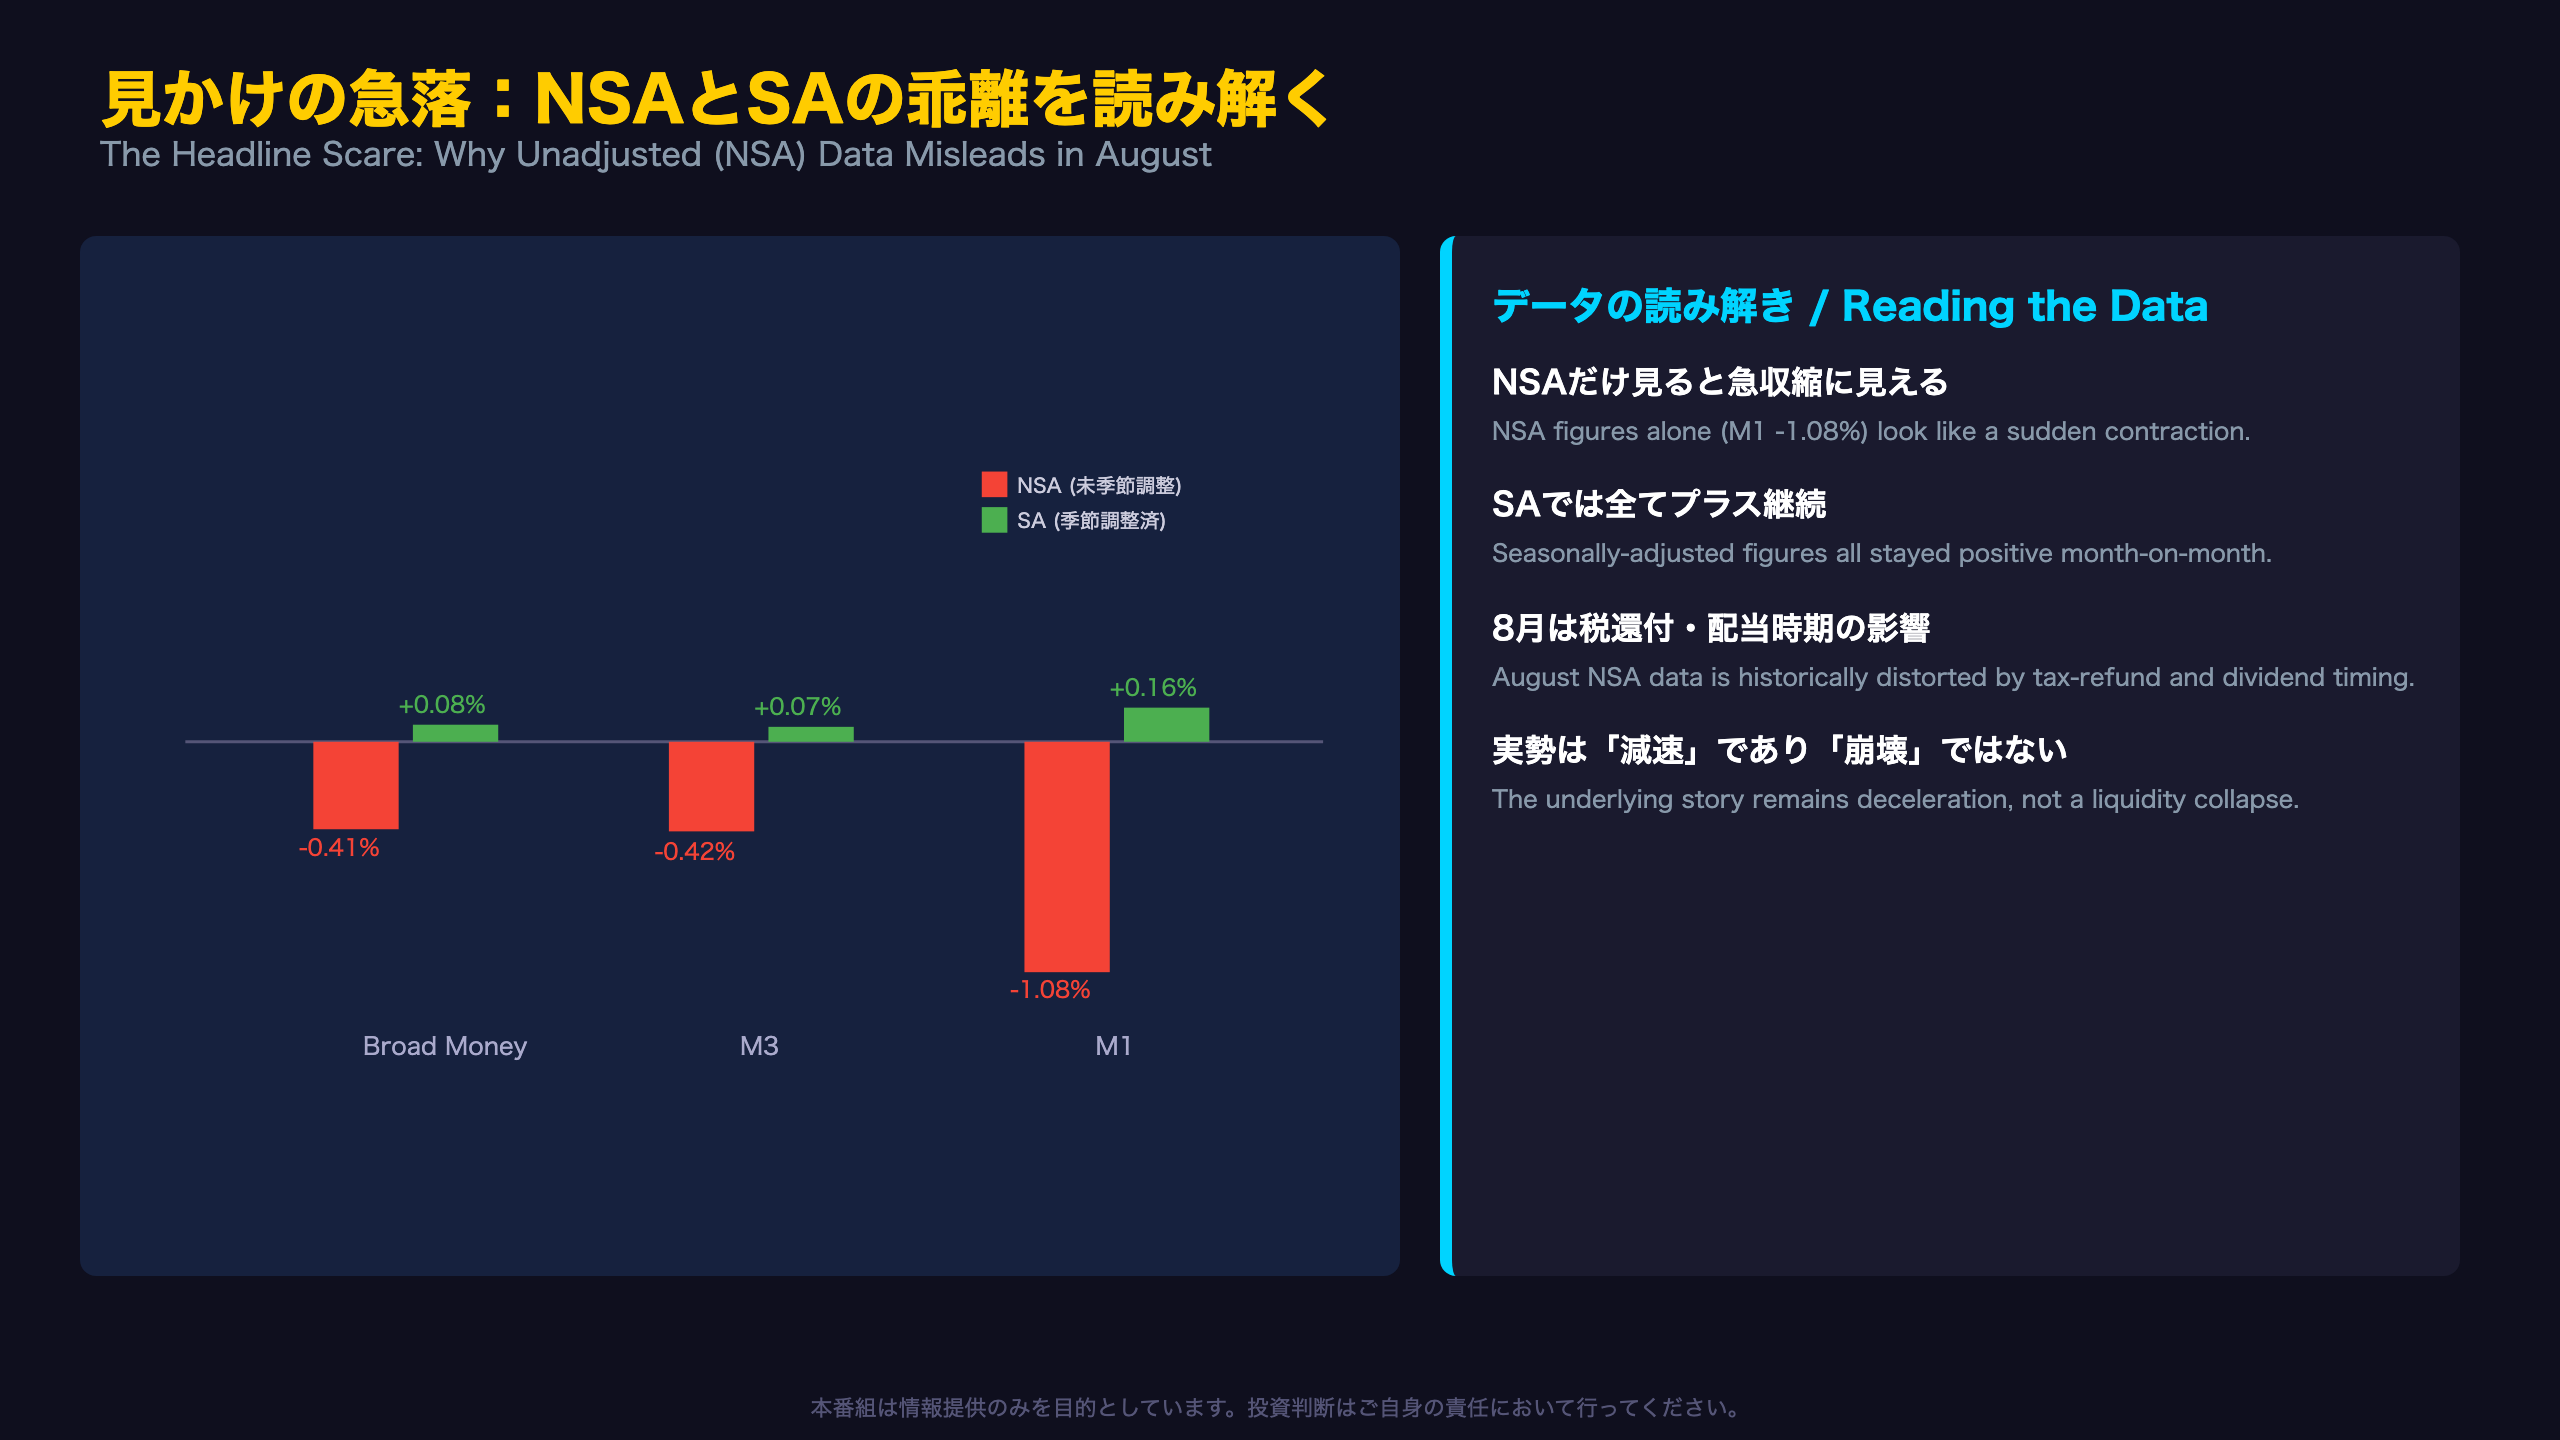
The RBA’s Table D3 publishes both non-seasonally-adjusted (NSA) and seasonally-adjusted (SA) series every month. August 2026 shows an unusually wide gap between the two.
| Metric | NSA MoM | SA MoM |
|---|---|---|
| Broad Money | -0.41% | +0.08% |
| M3 | -0.42% | +0.07% |
| M1 | -1.08% | +0.16% |
Why Seasonality Matters Here
M1’s NSA swing is the largest of the three because transaction deposits (currency plus current accounts) are especially sensitive to recurring calendar effects such as Australian tax-refund season and corporate dividend payment cycles — a pattern similar to how US M1 can wobble around April tax season.
Two Ways to Read It
A more cautious reading: an NSA drop this large (-1.08% for M1) may partly reflect genuine softening in transactional demand that seasonal adjustment cannot fully strip out. A more constructive reading: since all three SA series stayed positive, the official statistics show no confirmed liquidity contraction this month.
Watching whether NSA figures rebound in September will help confirm whether this month’s drop was purely seasonal noise.
M1とM3の逆転:資金シフトのシグナル
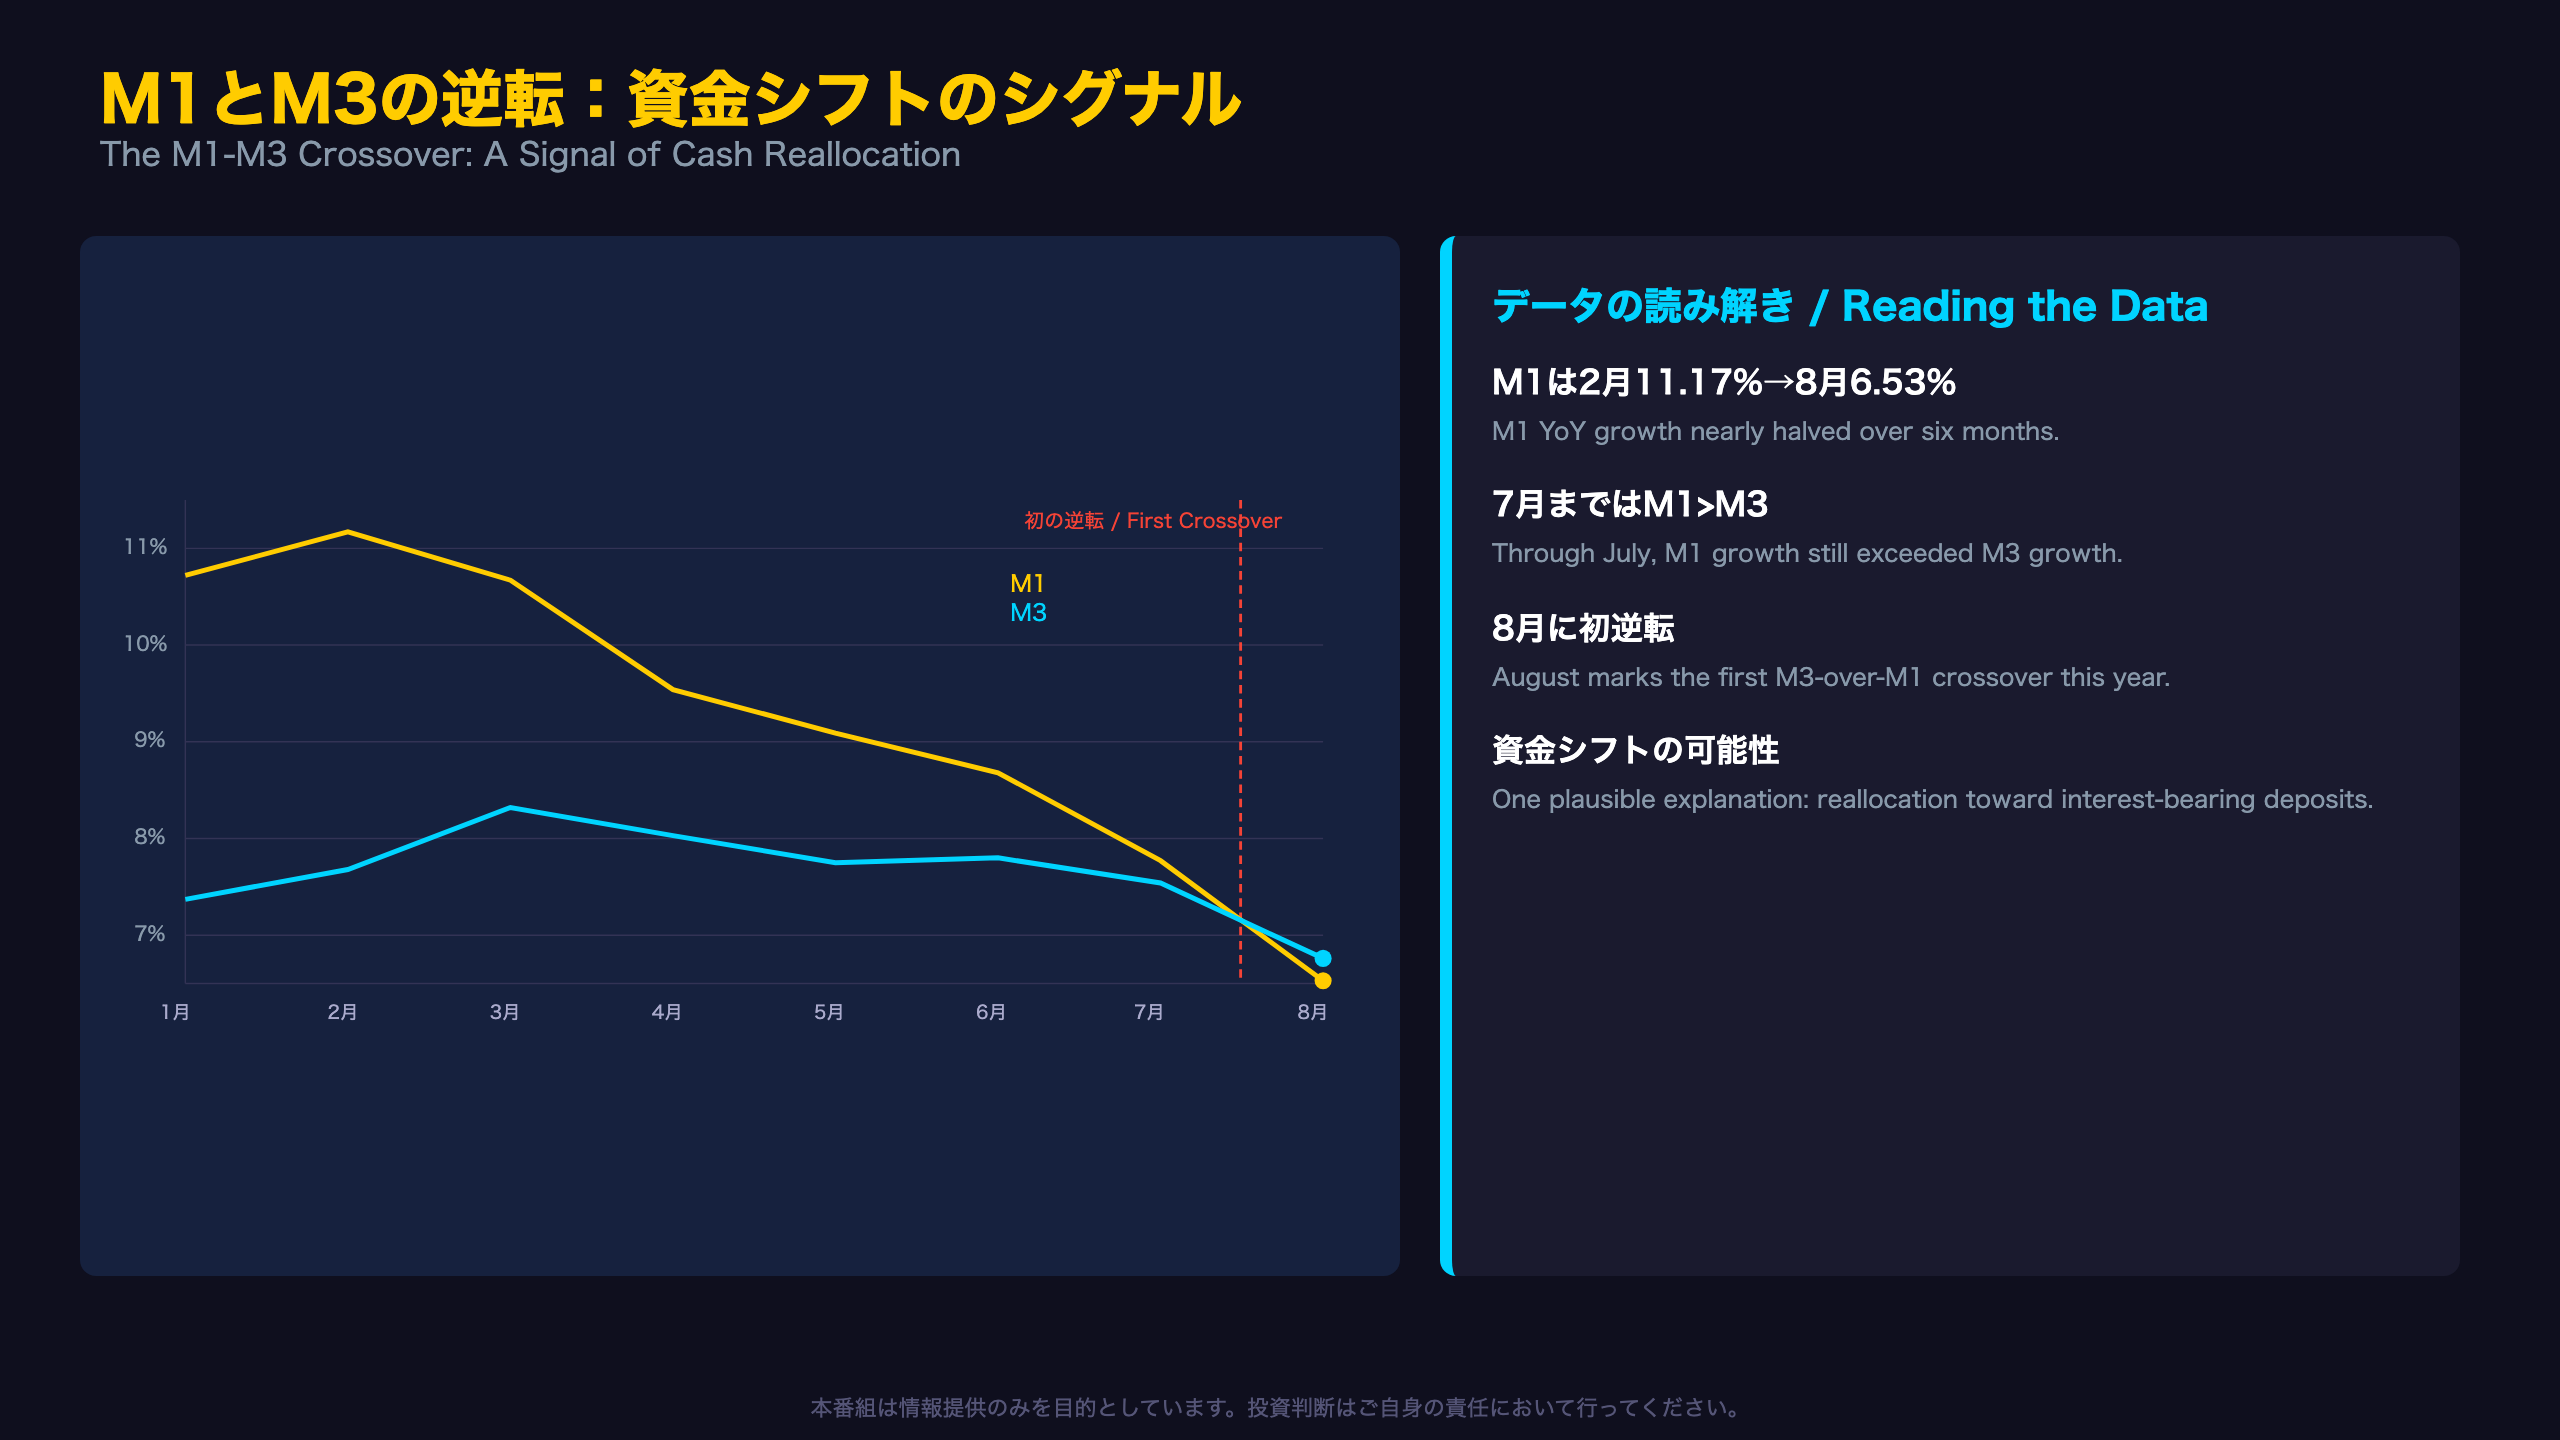
What the Crossover Means
M1 captures the most liquid transaction balances — currency and current/checking deposits — while M3 is a broader aggregate that also includes term deposits, certificates of deposit, and other interest-bearing instruments held with banks and non-bank financial institutions.
Historical Context
M1’s year-on-year growth peaked at a double-digit 11.17% in February 2026 and has fallen almost every month since. Over just six months, M1 growth roughly halved, from 11.17% to 6.53% — a materially faster deceleration than M3’s, which slid from 8.32% to 6.76% over the same window.
A Sub-Indicator Worth Noting
Non-transaction deposits (a component not separately highlighted in the video) grew from A$1,213.78bn in August 2025 to A$1,298.36bn in August 2026, a 6.97% year-on-year increase — a pace broadly in line with headline M3 growth, lending some support to the idea that funds are rotating toward this category.
Competing Interpretations
One reading: households and firms are moving cash from zero/low-interest transaction accounts into higher-yielding deposit products as rates remain elevated — a pattern familiar to US and UK investors who saw similar money-market and term-deposit inflows during 2023-2024 tightening cycles. A more cautious reading: a single month’s crossover, on its own, cannot confirm a durable behavioral shift; seasonal consumer spending patterns could also be a contributing factor.
Confirming whether this crossover persists in the September release will be key to validating the reallocation thesis.
総括:RBAスタンスと豪ドルへの含意
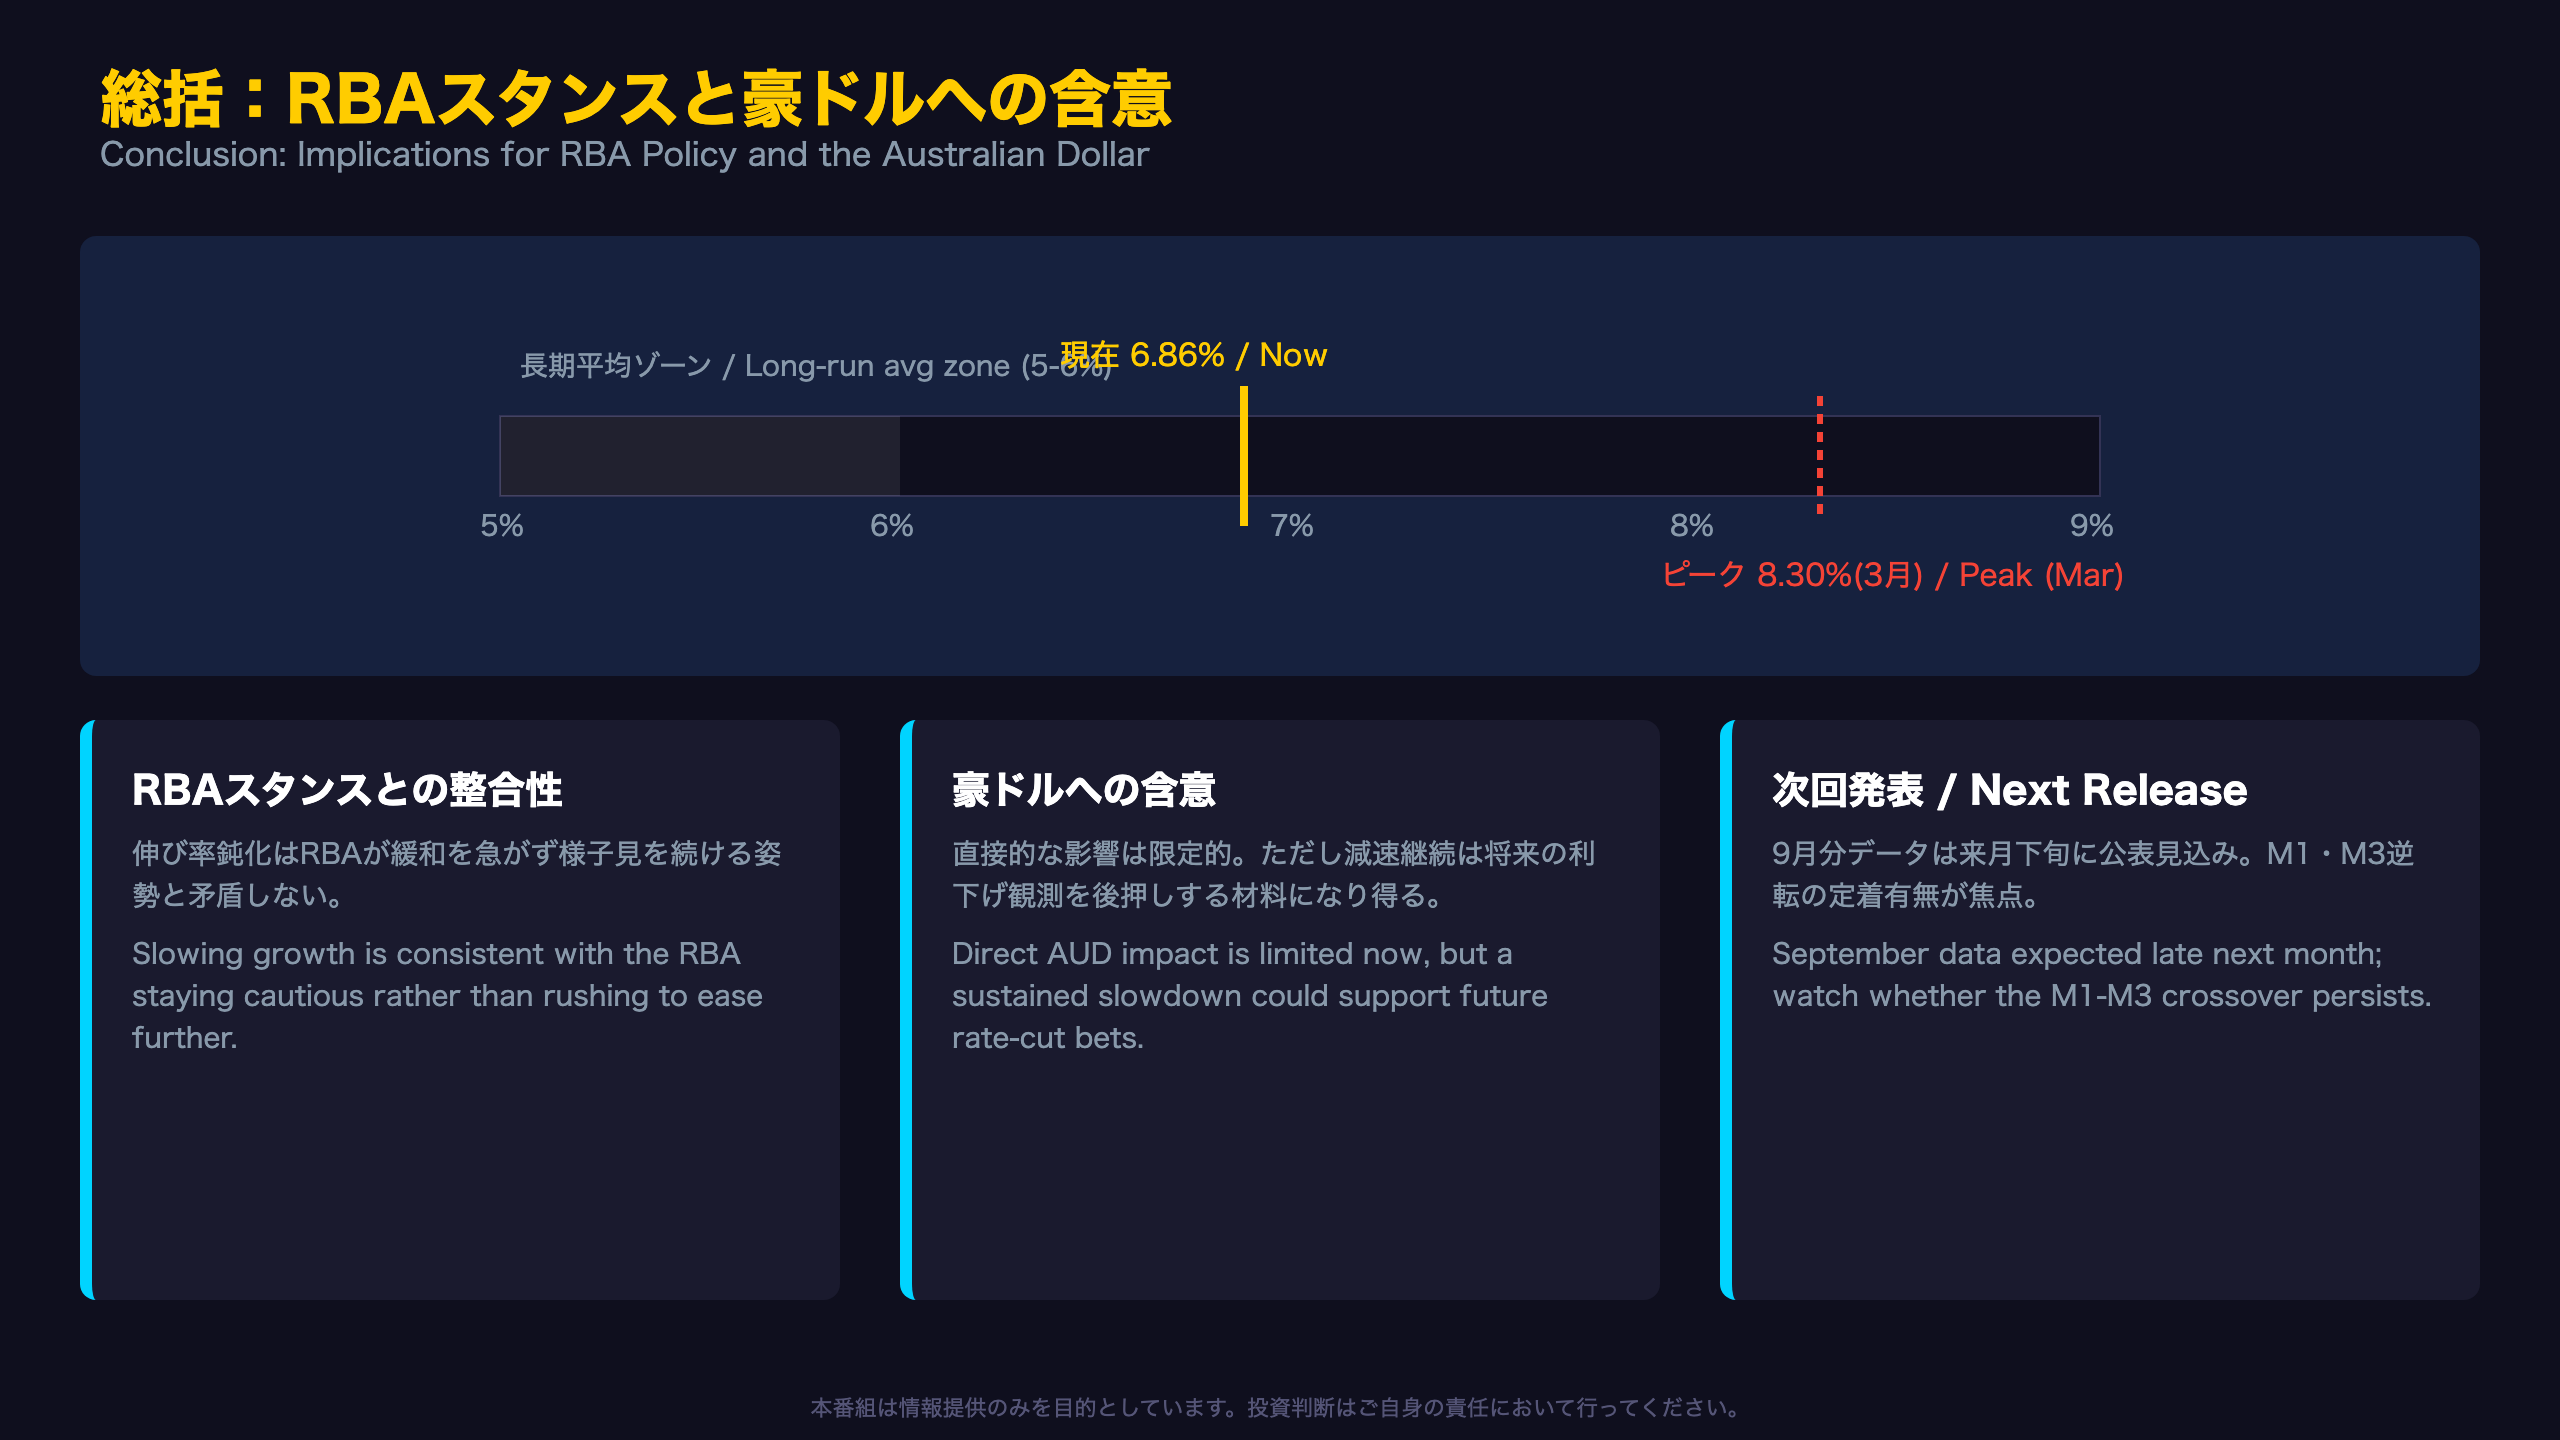
Weighing Strength Against Weakness
This release cannot be reduced to a single-direction story. On the strength side, both Broad Money and M1 remain in positive growth territory, and seasonally-adjusted month-on-month figures stayed positive across the board. On the weakness side, three signals emerged together: a consistent deceleration from the Q1 peak, August’s unusually sharp single-month slowdown, and the first M1-M3 growth crossover of the year.
Consistency with RBA Policy
This dataset alone cannot confirm the RBA’s specific policy intentions, but a growth rate that remains modestly above the long-run trend while clearly decelerating is broadly consistent with a neutral-to-cautious environment — neither screaming for urgent additional easing, nor demanding further tightening. Investors accustomed to reading the Fed’s M2 or the ECB’s M3 as loose proxies for financial conditions will recognize a similar dynamic here: money supply growth serves as a supporting data point, not a standalone policy trigger.
Implications for the Australian Dollar
Money supply data alone rarely moves AUD directly. However, if this liquidity deceleration is corroborated by softer inflation prints or a cooling labor market in coming releases, it could reinforce market pricing for future RBA rate cuts — typically an AUD headwind versus higher-yielding peers.
What to Watch Next
The September release, expected around late next month, will be pivotal on three fronts: whether the deceleration trend extends, whether the M1-M3 crossover persists, and whether NSA figures show a seasonal rebound that confirms August’s drop was largely calendar-driven.
Disclaimer: This article is for informational purposes only. All investment decisions are made solely at your own risk.