This article was automatically generated by the NFC Market Live AI analysis system. (Updated: 2026-11-19 22:36 JST)
📄 Primary Source
NFC Market Live
https://www.philadelphiafed.org/surveys-and-data/regional-economic-analysis/mbos-2026-11
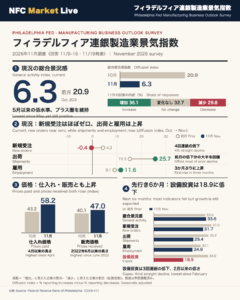
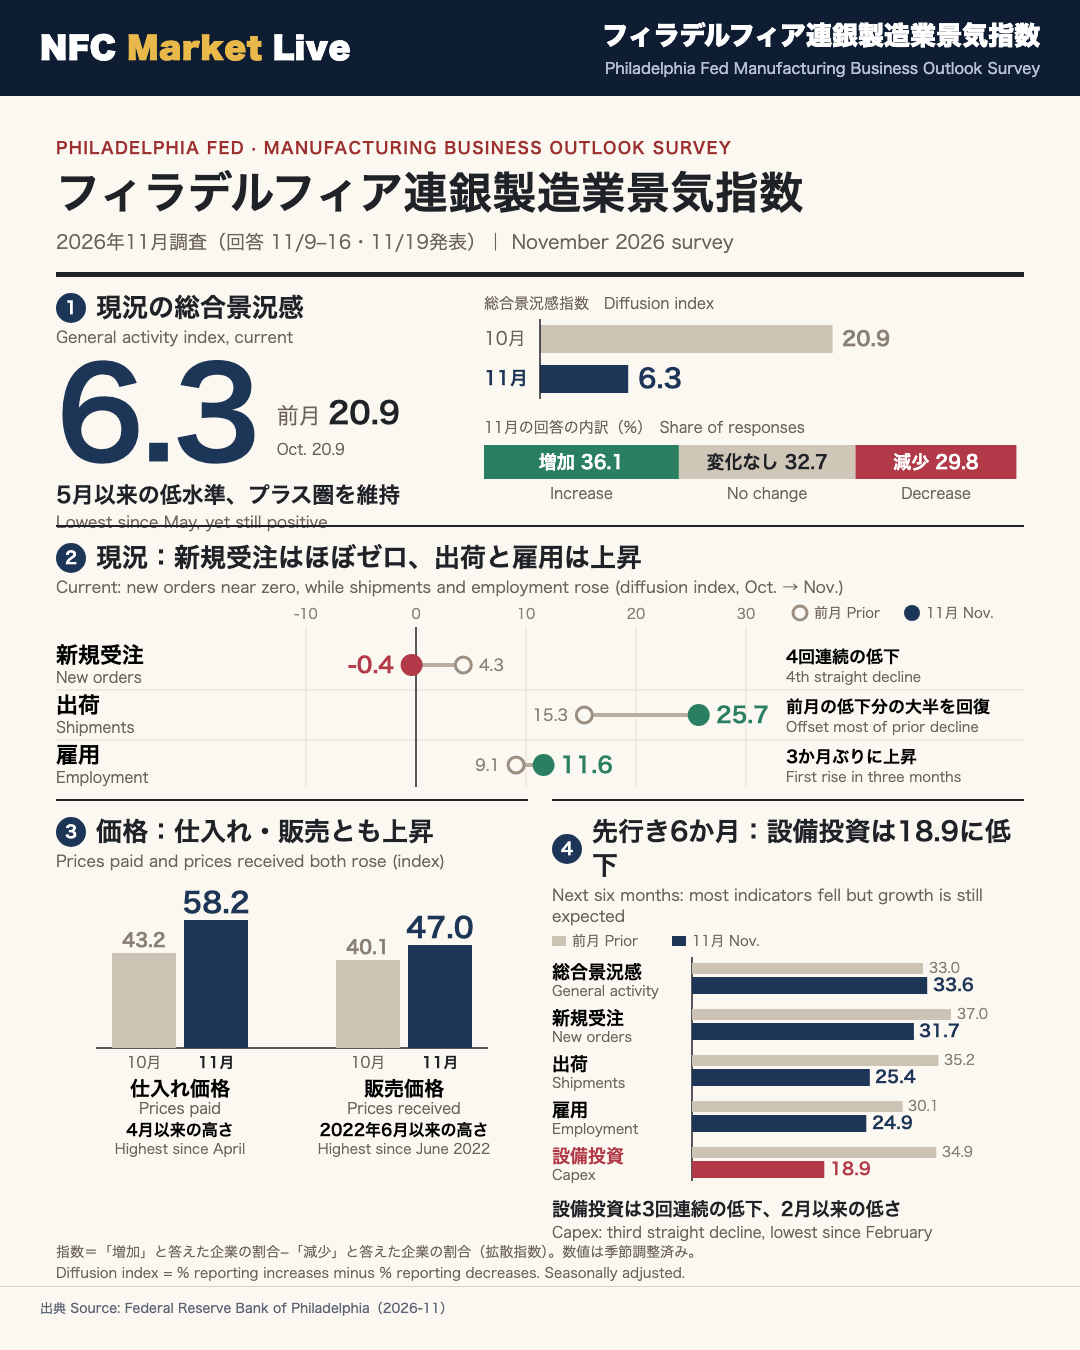
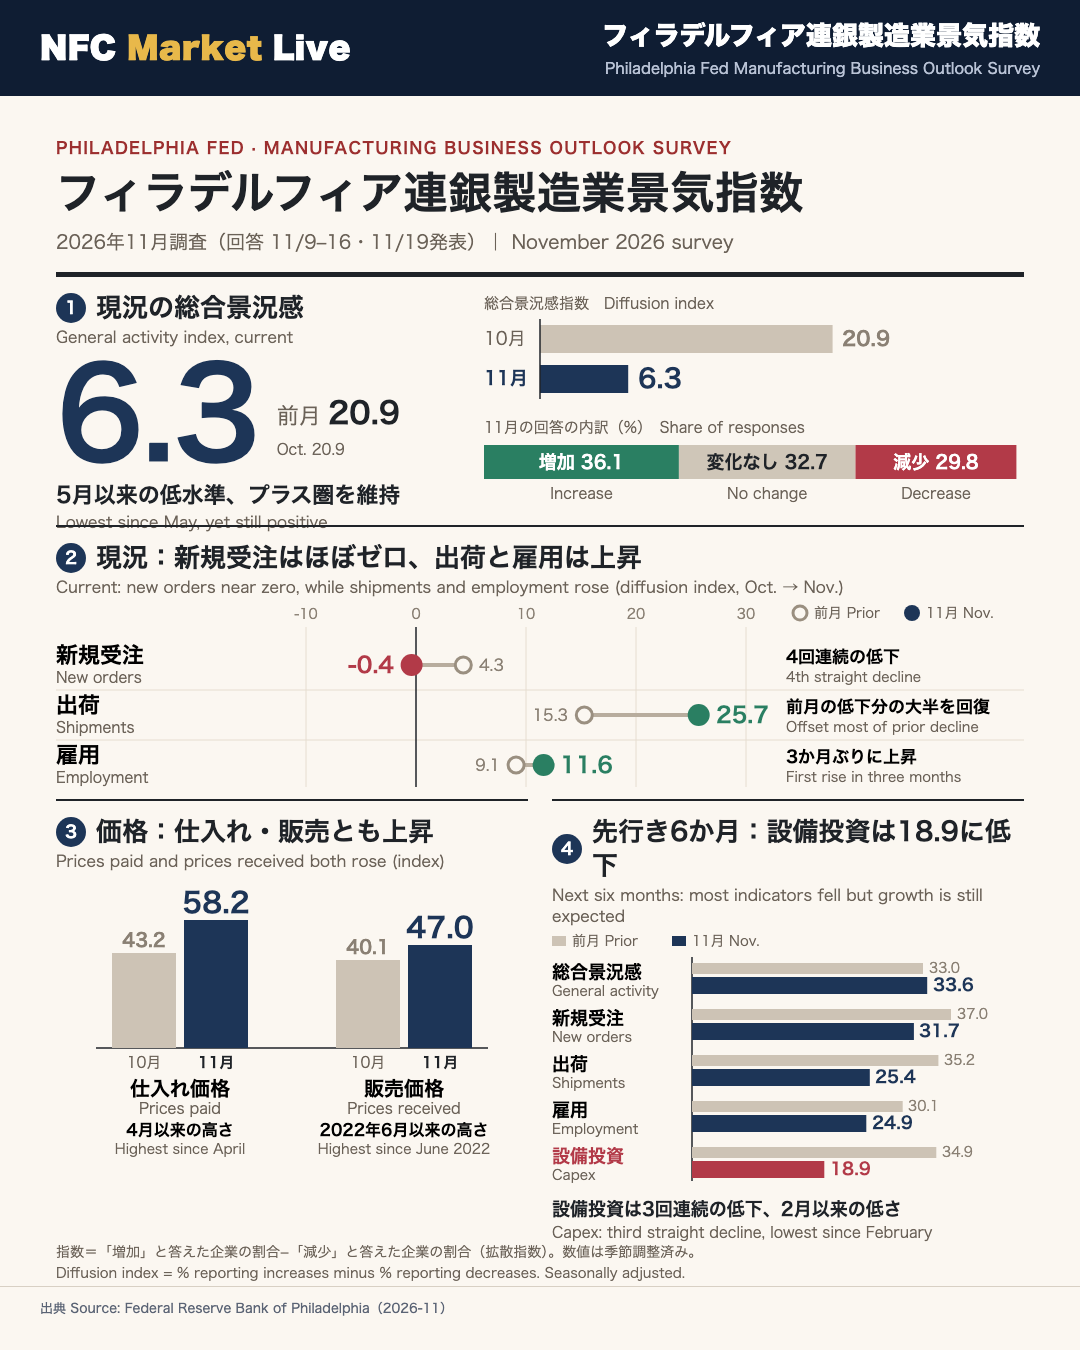
The Philadelphia Fed’s November Manufacturing Business Outlook Survey, released November 19, 2026, showed current general activity falling to 6.3 from 20.9 in October, its lowest reading since May but still positive. The report says manufacturing activity was less widespread but continued to expand overall.
Current indicators: New orders slipped to -0.4 (prior 4.3), a fourth consecutive decline. Shipments rose 10 points to 25.7. Employment rose to 11.6, its first increase in three months.
Prices: Prices paid rose 15 points to 58.2, the highest since April. Prices received rose 7 points to 47.0, the highest since June 2022.
Six-month outlook: Future general activity was little changed at 33.6. Future new orders (31.7), shipments (25.4), employment (24.9) and capital expenditures (18.9) declined but still suggest expected growth. Capital expenditures fell 16 points, a third straight decline.
Special questions: 42.3% of firms said customers have become more price sensitive. 56% anticipate changes in industry costs (up from 44% last quarter), and 79% of those expect competitors to raise prices, with a median timing of 3 months (down from 4).
現況:総合景況感は6.3に低下、出荷と雇用は上昇
Philly Fed Manufacturing Survey, November 2026: Expansion Continues but Is Less Widespread
What is this survey? The Manufacturing Business Outlook Survey (MBOS) is a monthly poll run by the Federal Reserve Bank of Philadelphia, one of the 12 regional Reserve Banks. Each index is a diffusion index: the percentage of firms reporting an increase minus the percentage reporting a decrease, seasonally adjusted. Unlike PMI-style readings centered on 50, these indexes are centered on zero. Responses were collected November 9-16 and the report was released on November 19, 2026, at 8:30 a.m. ET.
Headline reading
Current general activity fell to 6.3 from 20.9, the lowest since May but still positive. Of the firms surveyed, 36.1% reported higher activity, 29.8% lower, and 32.7% no change.
Sub-indexes
- New orders: -0.4 (prior 4.3), the fourth consecutive decline and the lowest since May.
- Shipments: 25.7 (prior 15.3), up 10 points, offsetting most of October’s drop.
- Unfilled orders / delivery times / inventories: -4.4 (2.4) / 3.5 (8.5) / 5.3 (-12.8).
- Employment: 11.6 (prior 9.1), the first increase in three months. The average workweek index rose from 7.5 to 11.2.
Two ways to read it
- Constructive: The index is still positive, shipments and employment improved, and 69.4% of firms reported steady headcount while 21.1% added staff and 9.5% cut.
- Cautious: Both general activity and new orders sit at six-month lows, and new orders have now declined four months in a row.
Context
The report describes current indicators as mixed and says nothing about monetary policy. This is a single-month reading from one regional survey, so the sustainability of the order weakness will only be visible in coming surveys.
価格指数:仕入れ58.2・販売47.0、ともに上昇
Price Indexes: Both Rise From Already Elevated Levels
Why prices matter in this survey: The MBOS asks firms whether the prices they pay for inputs and the prices they receive for their own goods are higher, lower or unchanged. Because the index is zero-centered, a reading near 58 means that far more firms report increases than decreases.
The numbers
| Index | Nov | Oct | Firms reporting increases | No change | Decreases |
|---|---|---|---|---|---|
| Prices paid | 58.2 | 43.2 | 58.2% | 38.9% | 0.0% |
| Prices received | 47.0 | 40.1 | 48.1% | 50.8% | 1.1% |
- Prices paid rose 15 points to its highest since April. The share of firms reporting higher input prices jumped from 43% to more than 58%, while none reported decreases.
- Prices received rose 7 points to its highest since June 2022.
Looking six months ahead
The future prices paid index edged up to 63.3 and future prices received ticked up to 62.9. The report calls both ‘well above their long-run averages.’
Balanced reading
- Firm price pressure: Both indexes moved further above their long-run nonrecession averages, and almost no firms reported falling input prices.
- Mixed demand backdrop: Over the same month, new orders were near zero (-0.4) while shipments were firm (25.7). The report does not link the price readings to demand or give reasons for the price increases.
Context
This is one month of data from a single regional survey. Whether the high readings persist will show up in the next releases.
先行き:成長期待は維持、設備投資は18.9に低下
Six-Month Outlook: Most Indicators Weaken, but Growth Is Still Expected
How to read the future indexes: These ask firms whether they expect activity, orders, hiring and other measures to be higher or lower six months from now. They reflect expectations, not realized results.
Headline
Future general activity was little changed at 33.6 (prior 33.0). More than 50% of firms expect an increase, 17% a decrease, and 23% no change. The report says most future indicators declined but ‘continued to suggest expectations for overall growth.’
Biggest moves
| Index | Nov | Oct | Change | Note |
|---|---|---|---|---|
| Future new orders | 31.7 | 37.0 | about -5 | Lowest in more than a year |
| Future shipments | 25.4 | 35.2 | about -10 | Lowest in more than a year |
| Future employment | 24.9 | 30.1 | about -5 | Lowest since February |
| Future capital expenditures | 18.9 | 34.9 | about -16 | Third straight decline; lowest since February |
Other sub-indexes
Future unfilled orders were 9.1 (prior -1.6), future delivery times 14.5 (-7.5), future inventories 18.4 (23.4), and the future average workweek 29.9 (10.1).
Two readings
- Cautious: Capital spending plans showed the sharpest drop, and order and shipment expectations hit one-year lows.
- Constructive: Every future index remains positive, headline expectations were steady, and 32.4% of firms expect to add staff versus 7.5% expecting cuts.
Context
As a zero-centered diffusion measure, a reading of 18.9 for capital spending still means more firms plan increases than decreases. The survey does not give reasons for the changes in expectations.
特別質問:顧客の価格感応度と競合の価格対応
Special Questions: How Manufacturers See Pricing
About the special questions: Each month the Philadelphia Fed adds a few questions beyond the standard indexes. In November, firms were asked about customer price sensitivity since last quarter, expected changes in industry costs, and how competitors would respond.
Results
| Question | Answer | Share |
|---|---|---|
| Customers’ price sensitivity since last quarter | More sensitive | 42.3% |
| About the same | 53.8% | |
| Less sensitive | 3.8% | |
| Can you clearly anticipate changes in industry costs over the next six months or so? | Yes | 56.0% |
| No | 44.0% | |
| Competitors’ response (firms answering ‘yes’ only) | Raise prices | 78.6% |
| Hold prices steady | 14.3% | |
| Lower prices | 7.1% |
The median expected timing of competitors’ price changes was 3.0 months. According to the report, the share of firms anticipating cost changes rose from 44% last quarter, and the median timing shortened from four months.
Balanced reading
- Pricing pressure appears widespread: More firms expect cost changes, most expect rivals to raise prices, and the timing is seen as nearer. This is in the same direction as the month’s price indexes (prices paid 58.2, prices received 47.0).
- But not uniform: A majority (53.8%) said customer price sensitivity was unchanged, only 3.8% saw it falling, and the competitor question covers only firms that answered ‘yes’ to the cost question.
Context
These are opinions and expectations, not realized price changes. Actual price behavior will be reflected in the prices paid and prices received indexes in coming surveys.
Disclaimer: This article is for informational purposes only. All investment decisions are made solely at your own risk.