This article was automatically generated by the NFC Market Live AI analysis system. (Updated: 2026-11-19 22:13 JST)
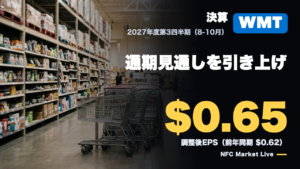
📊 Walmart (WMT) reported Q3 FY27: revenue $188.8B (+5.2% YoY) and adjusted EPS $0.65 (+4.8%).
💡 Operating income rose 16.0%, but adjusted and excluding currency it was +5.5%, as last year’s ~$0.7B PhonePe share-based compensation charge dropped out. GAAP EPS fell to $0.62 on investment losses.
📈 U.S. eCommerce +23% and advertising +37%, while comp sales slowed to +2.9% and Sam’s Club operating income fell 15.8%.
⚠️ FY27 adjusted EPS outlook raised to $2.84-2.89. Key check: whether the India sales-event timing shift reverses in Q4.
ウォルマート第3四半期決算:全体像
Walmart Q3 FY27: the big picture
Walmart Inc. (NASDAQ: WMT) reported fiscal third-quarter results for the period ended October 31, 2026. Note that Walmart’s fiscal year ends in January, so ‘FY27’ runs from February 2026 to January 2027.
Key numbers
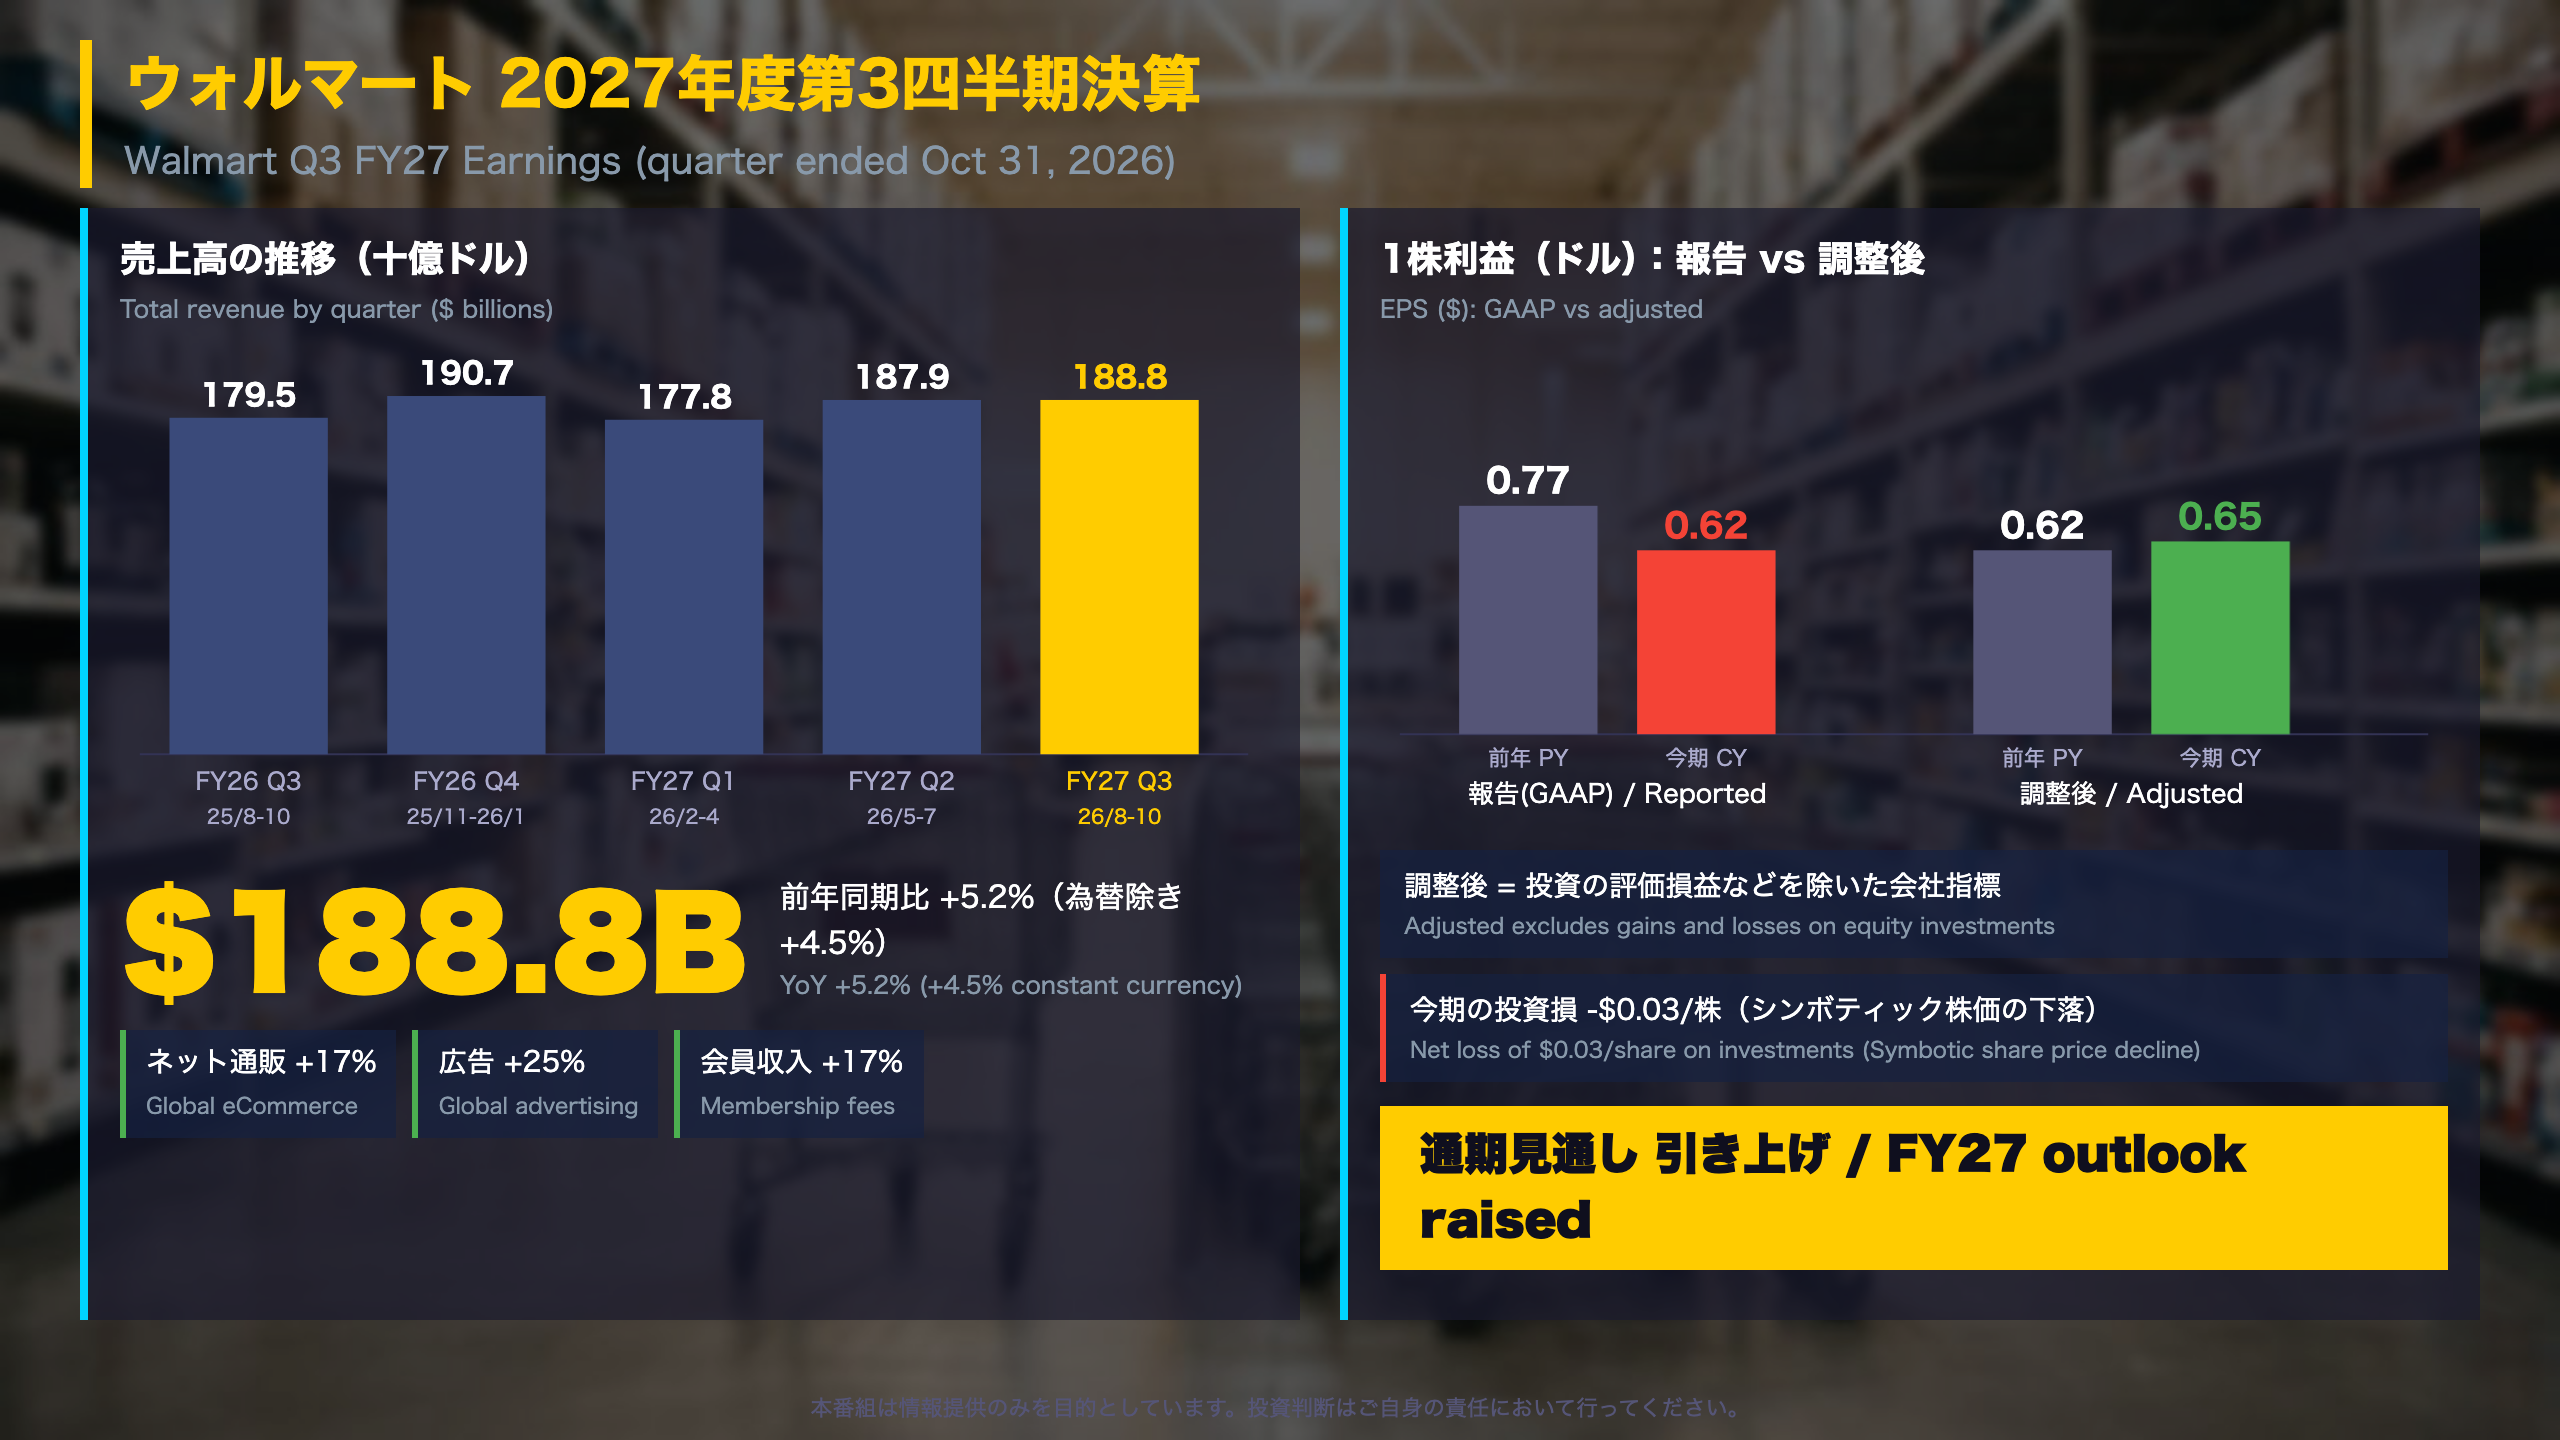
- Total revenue: $188.8 billion, +5.2% year over year (+4.5% in constant currency)
- Adjusted EPS: $0.65 vs $0.62 a year earlier (+4.8%)
- GAAP EPS: $0.62 vs $0.77 (-19.5%)
- Outlook: raised for FY27
Why two EPS figures?
Adjusted EPS strips out realized and unrealized gains and losses on equity investments. This quarter the release points to a decline in the share price of an investee (Symbotic) as the main driver of the loss, whereas the year-earlier quarter included a gain. This is a company-defined, non-GAAP measure, so readers should compare it carefully with GAAP.
Context for global readers
Similar to U.S. large-cap retailers that report adjusted figures, Walmart also discloses constant-currency growth to separate foreign-exchange effects. Japanese investors often compare this with the way Japanese retailers present results before and after currency translation.
What to watch
The balance of evidence is mixed rather than one-sided: sales and underlying profit grew, while constant-currency sales growth has eased from 6.0% a year ago to 4.5%. The release does not state the date of the next earnings report.
営業利益:報告16.0%増、調整後5.5%増
Operating income: headline versus underlying
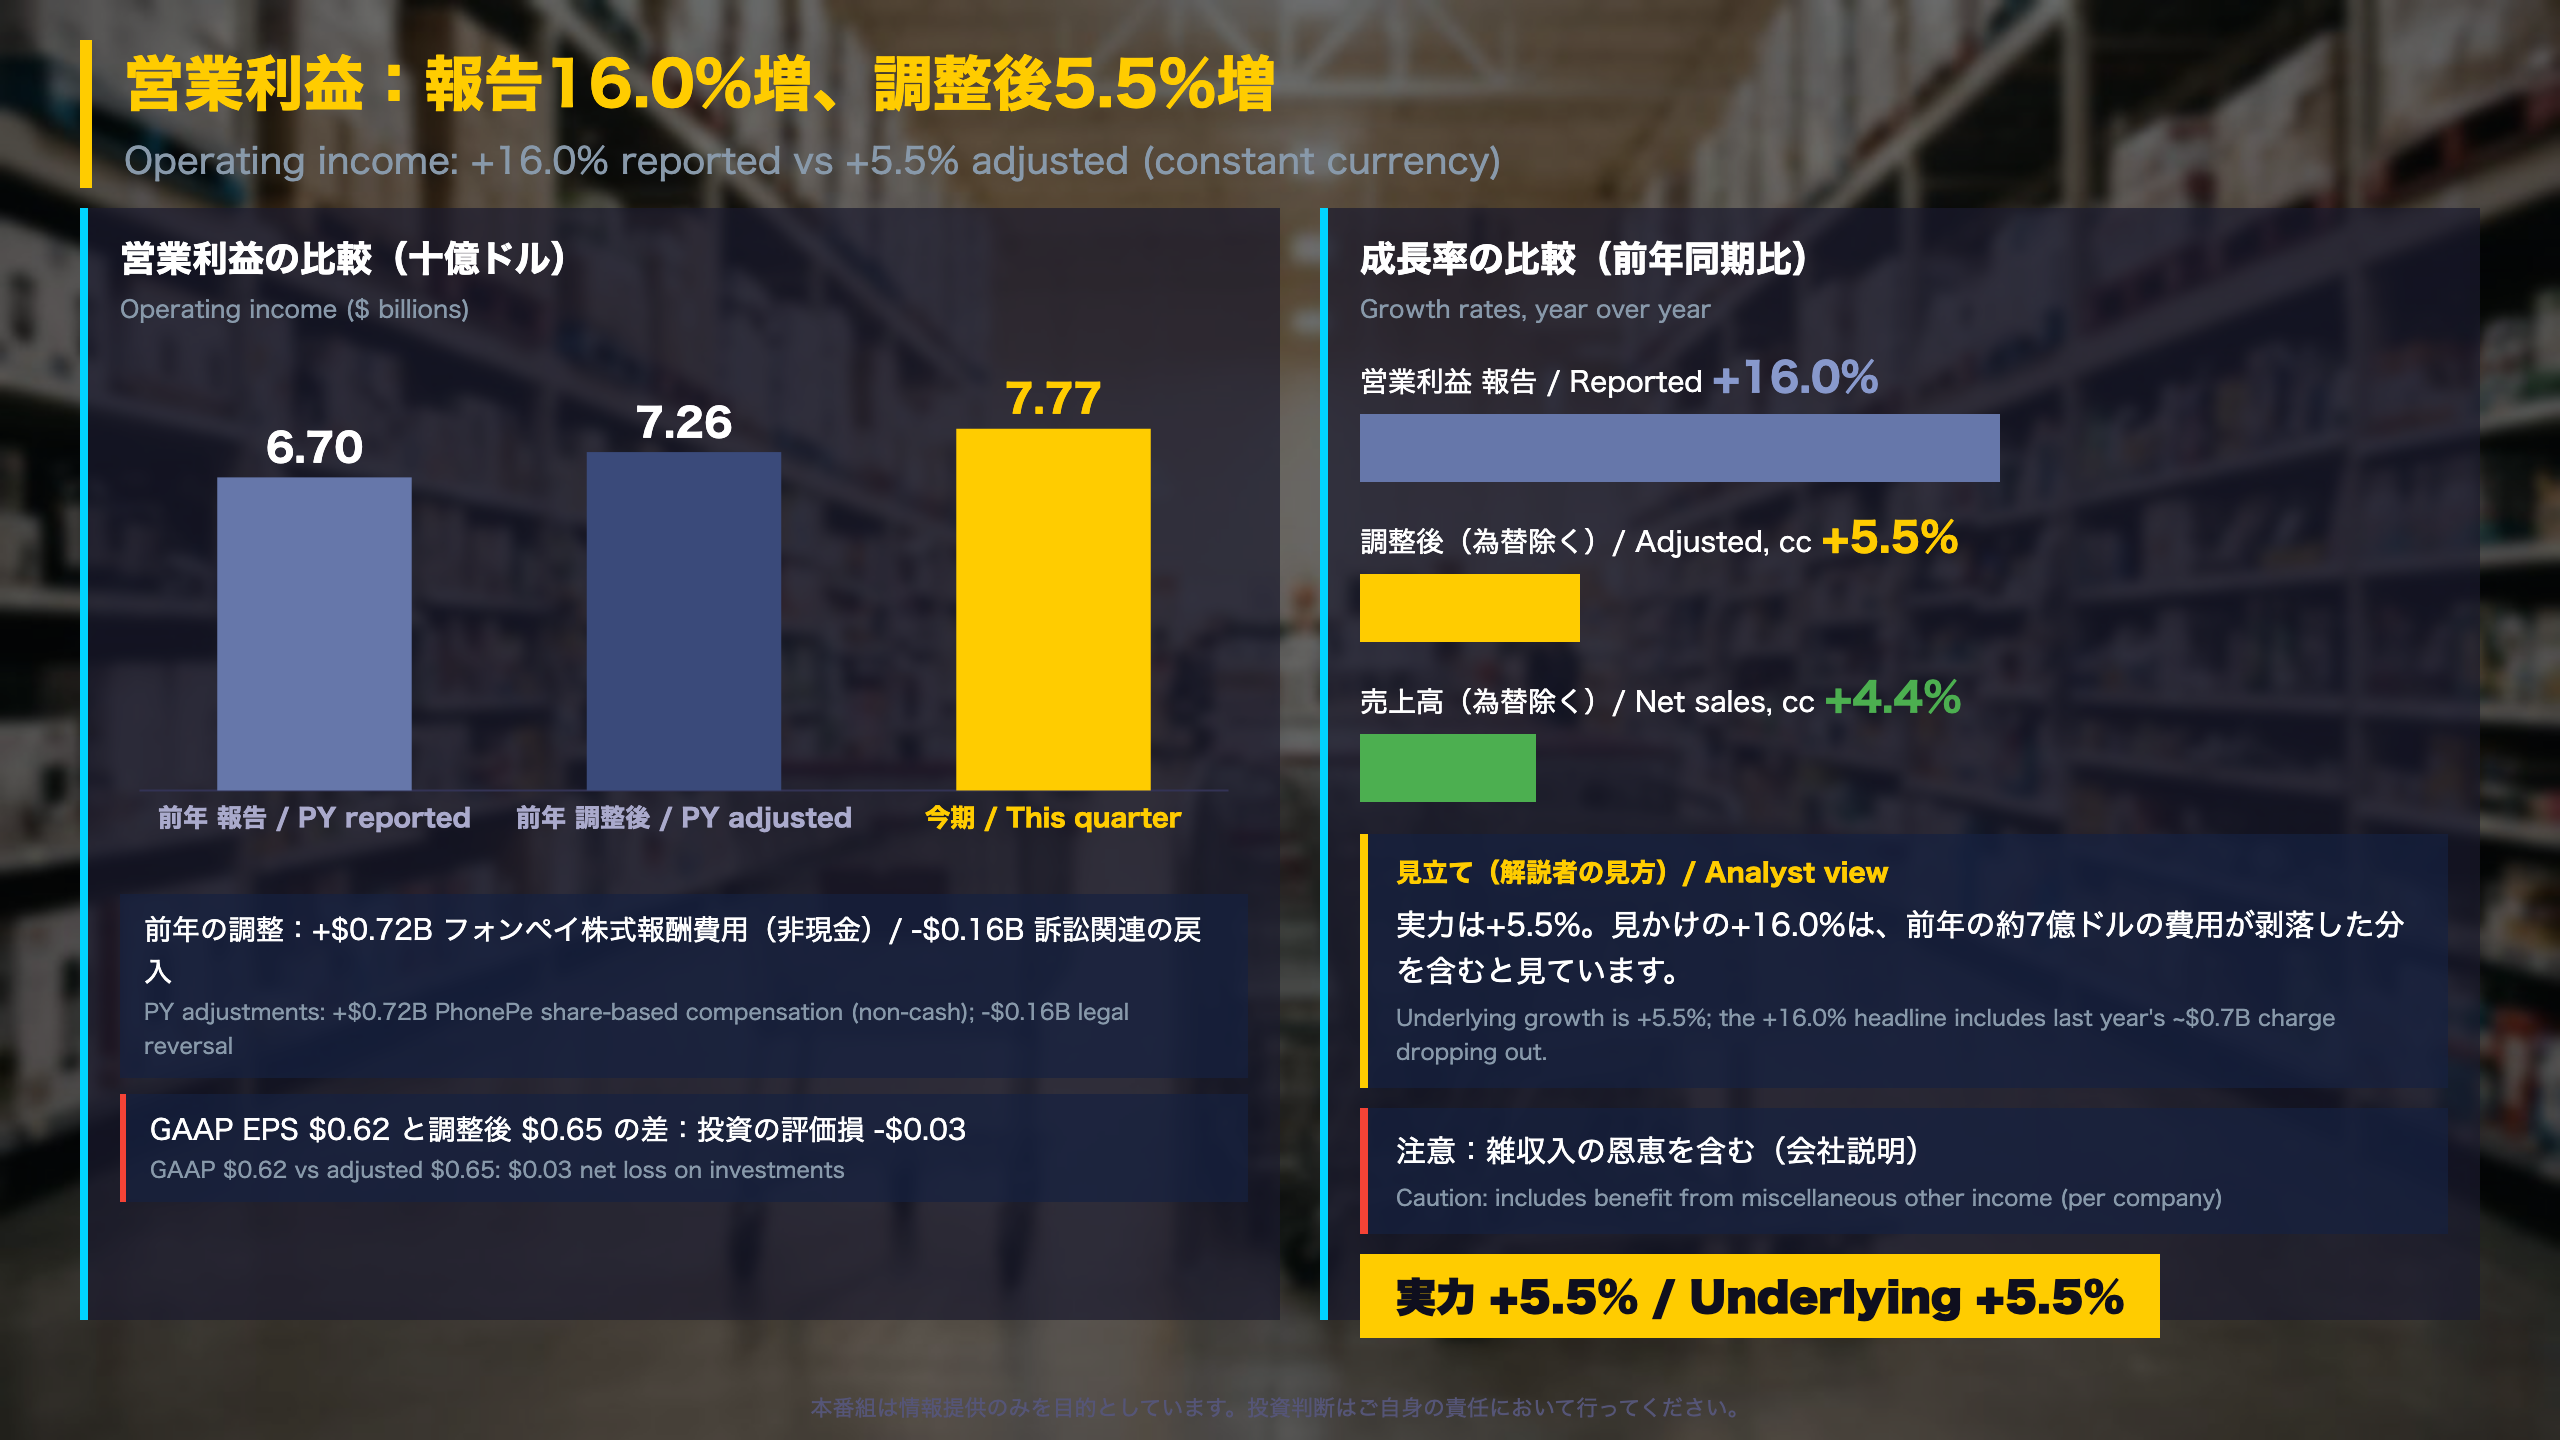
Walmart’s reported operating income was $7.77 billion, up 16.0% year over year. The comparison base is distorted: in Q3 FY26, the International segment booked a $722 million non-cash share-based compensation charge at PhonePe, its payments subsidiary, in anticipation of a potential IPO, partly offset by a $155 million legal reversal. Adjusted for those, last year’s operating income was $7.26 billion.
Constant-currency view
Adjusted operating income in constant currency rose 5.5%, versus net sales growth of 4.4% in constant currency. Over the past five quarters, the adjusted constant-currency growth rates were +8.0%, +10.5%, +5.1%, +17.4% and +5.5%, so this quarter sits at the lower end of the range.
Supporting metrics
- Adjusted EBITDA margin: 6.3% vs 6.1%
- Net income margin: 2.6% vs 3.5%, reflecting investment losses
- Adjusted operating expense ratio: 21.5%, up 34 bps, due to depreciation and U.S. self-insured claims costs
Why it matters for non-Japanese readers
U.S. companies commonly report non-GAAP adjusted figures, similar in spirit to the ‘core operating profit’ some Japanese firms present. The key discipline is to check what is excluded. Here, the exclusions are specific and disclosed, and the company notes that miscellaneous other income also helped.
Balanced reading
The constant-currency gain outpacing sales is a genuine positive. But rising expense ratios mean that growth quality depends on gross margin mix and membership income continuing. The next checkpoint is Q4.
米国事業:成長の源泉とコスト
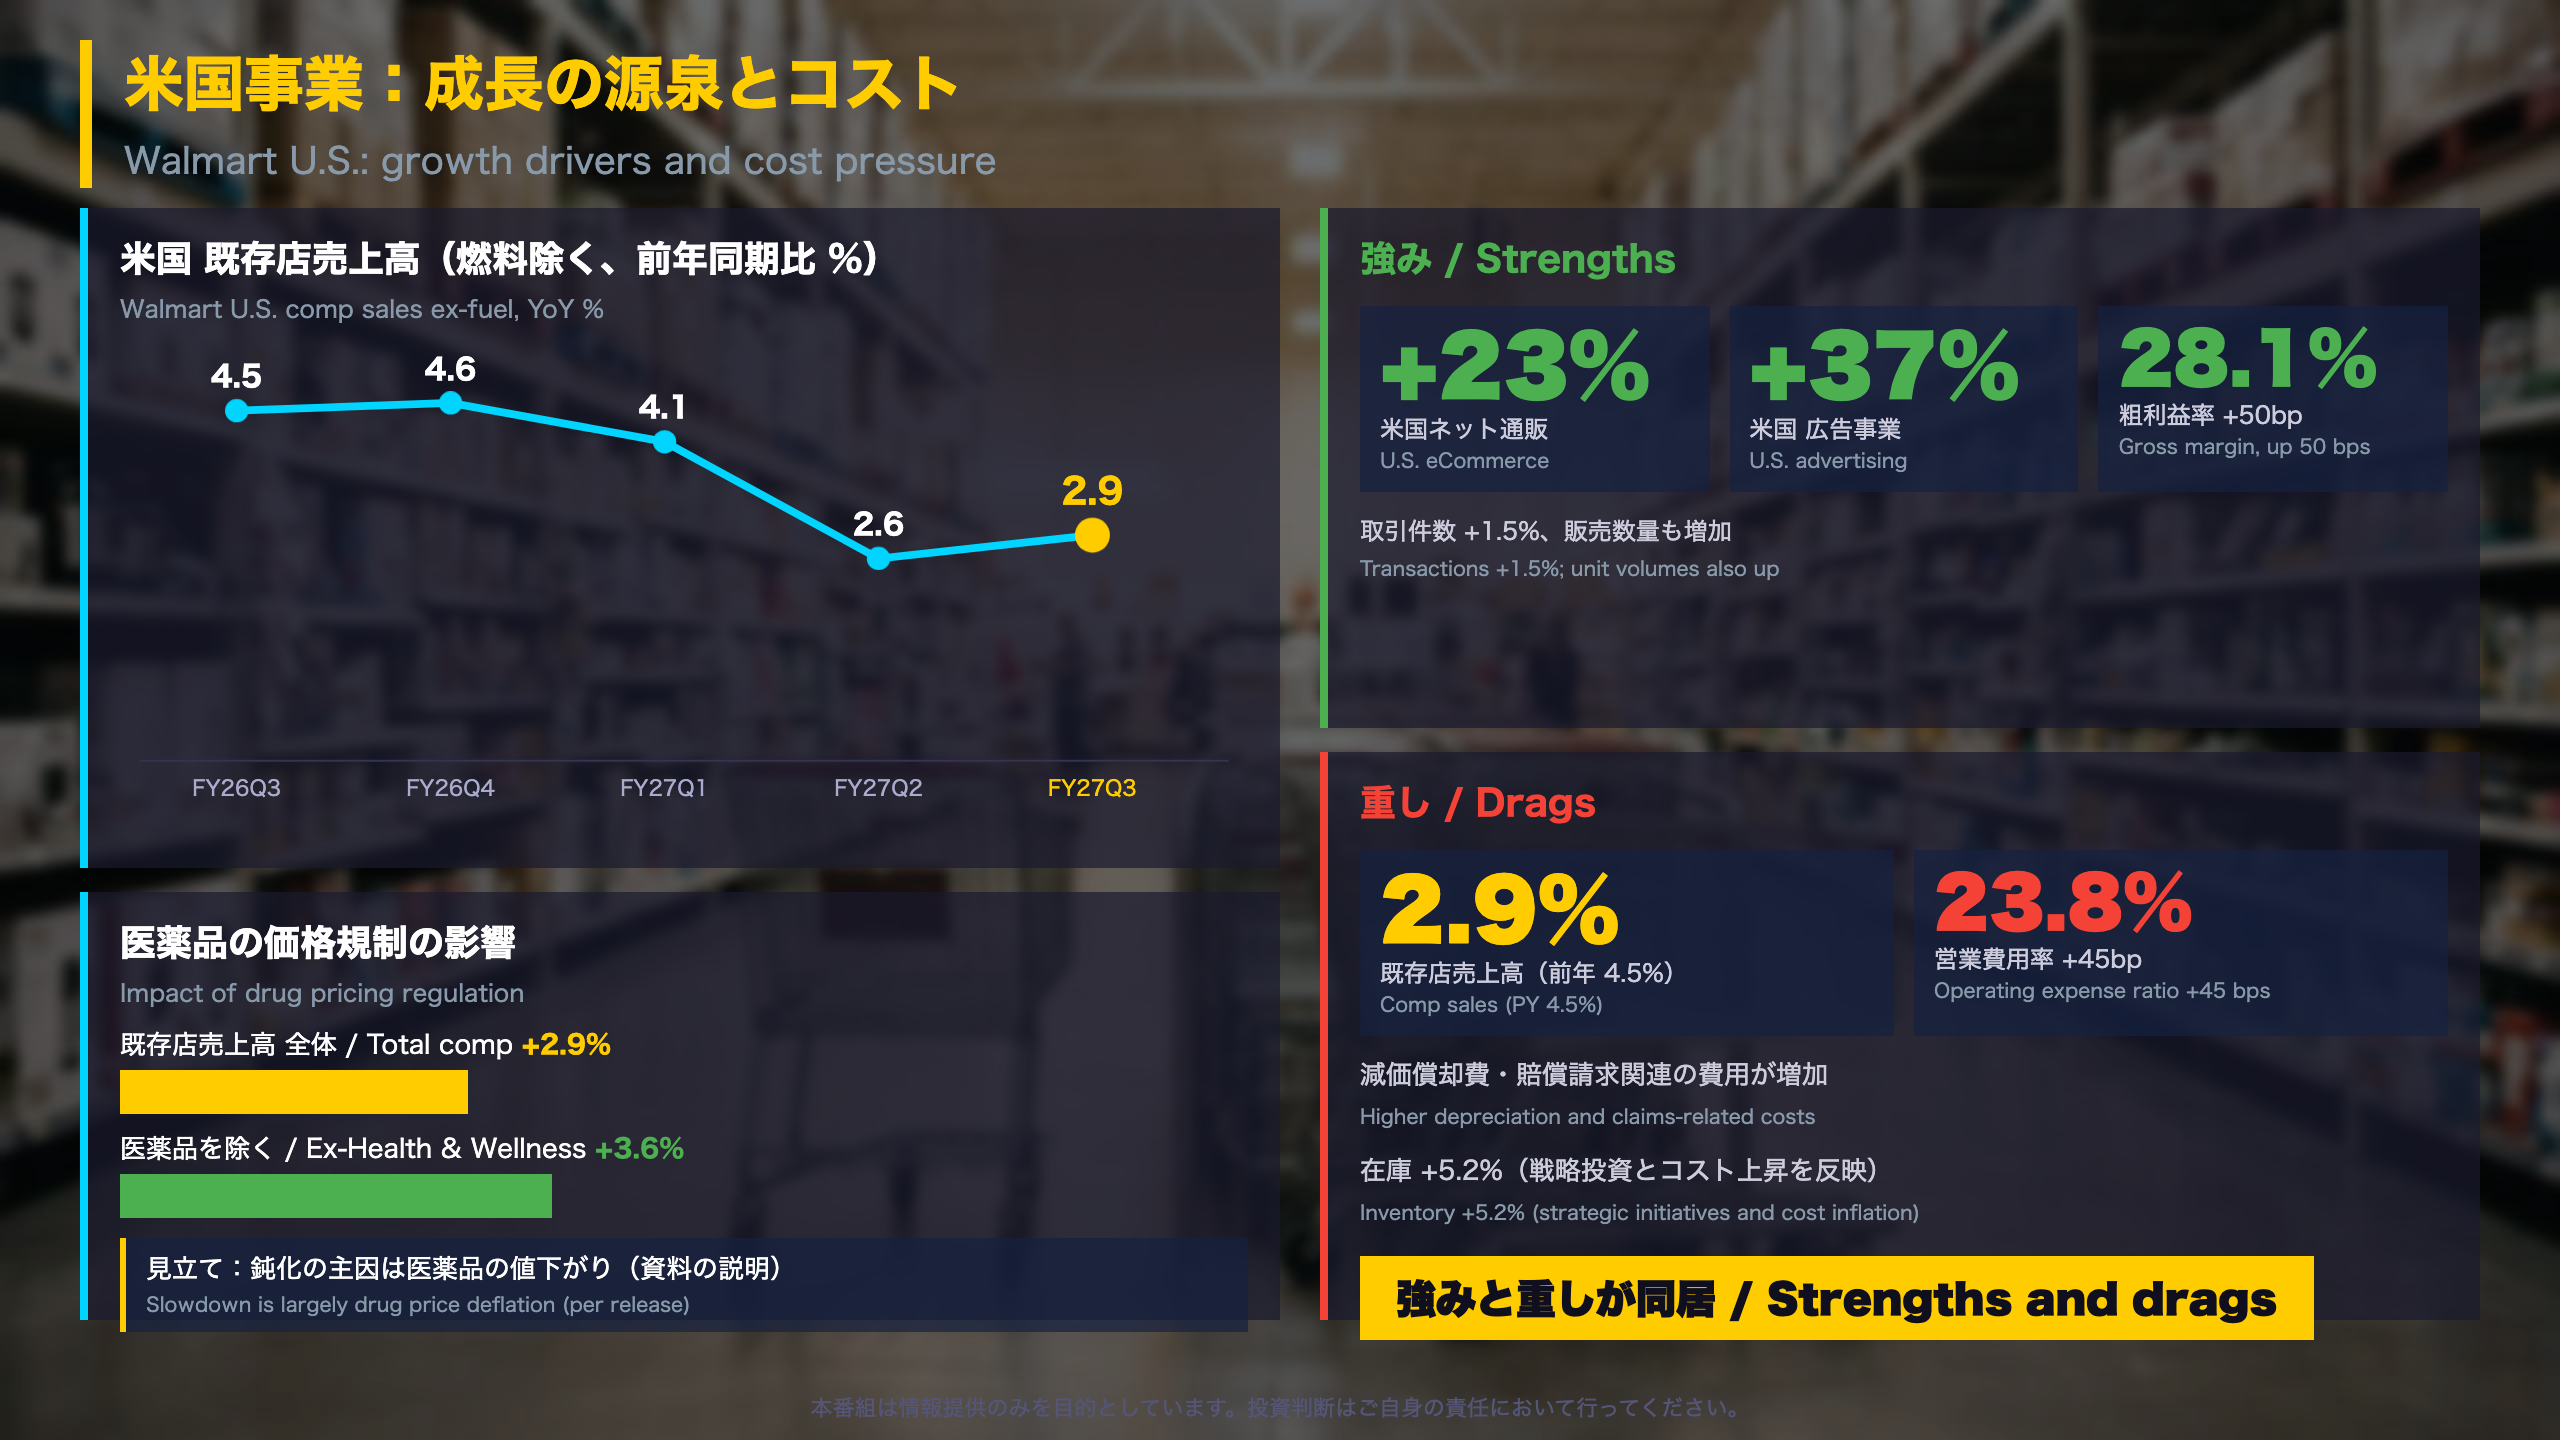
Walmart U.S.: growth engine and cost pressure
Walmart U.S. net sales were $125.0 billion (+3.6%), operating income $6.3 billion (+9.0%) and operating margin 5.1% (+25 bps).
Comp sales trend (ex-fuel)
The past five quarters read +4.5%, +4.6%, +4.1%, +2.6% and +2.9%. Growth has settled in the 2% range from the 4% range a year ago, with a slight improvement from last quarter.
Under the hood
- Transactions +1.5%, average ticket +1.4%
- eCommerce contributed about 530 bps to comps (about 440 bps a year ago)
- Excluding Health & Wellness, comps were +3.6%. Drug pricing regulation and brand-to-generic shifts cost about 125 bps, while GLP-1 drugs added about 60 bps
- Grocery grew mid-single digits; general merchandise low-single digits
- Membership and other income rose 43%
Margin mix
Gross margin rose 50 bps to 28.1%, which the company attributes to business mix, mainly digital advertising. The operating expense ratio rose 45 bps on depreciation and self-insured claims costs. Operating margin still rose 25 bps with help from membership and other income.
Context
The ‘maximum fair price’ regulation refers to U.S. Medicare drug price negotiation, which lowers reported pharmacy sales even when script volumes rise. Compared with U.S. peers, readers should note that Walmart includes eCommerce in comp sales.
Balanced reading
Share gains and advertising are structural positives, while higher inventory (+5.2%) and expense deleverage warrant monitoring.
質疑:見通し引き上げと、残る確認点
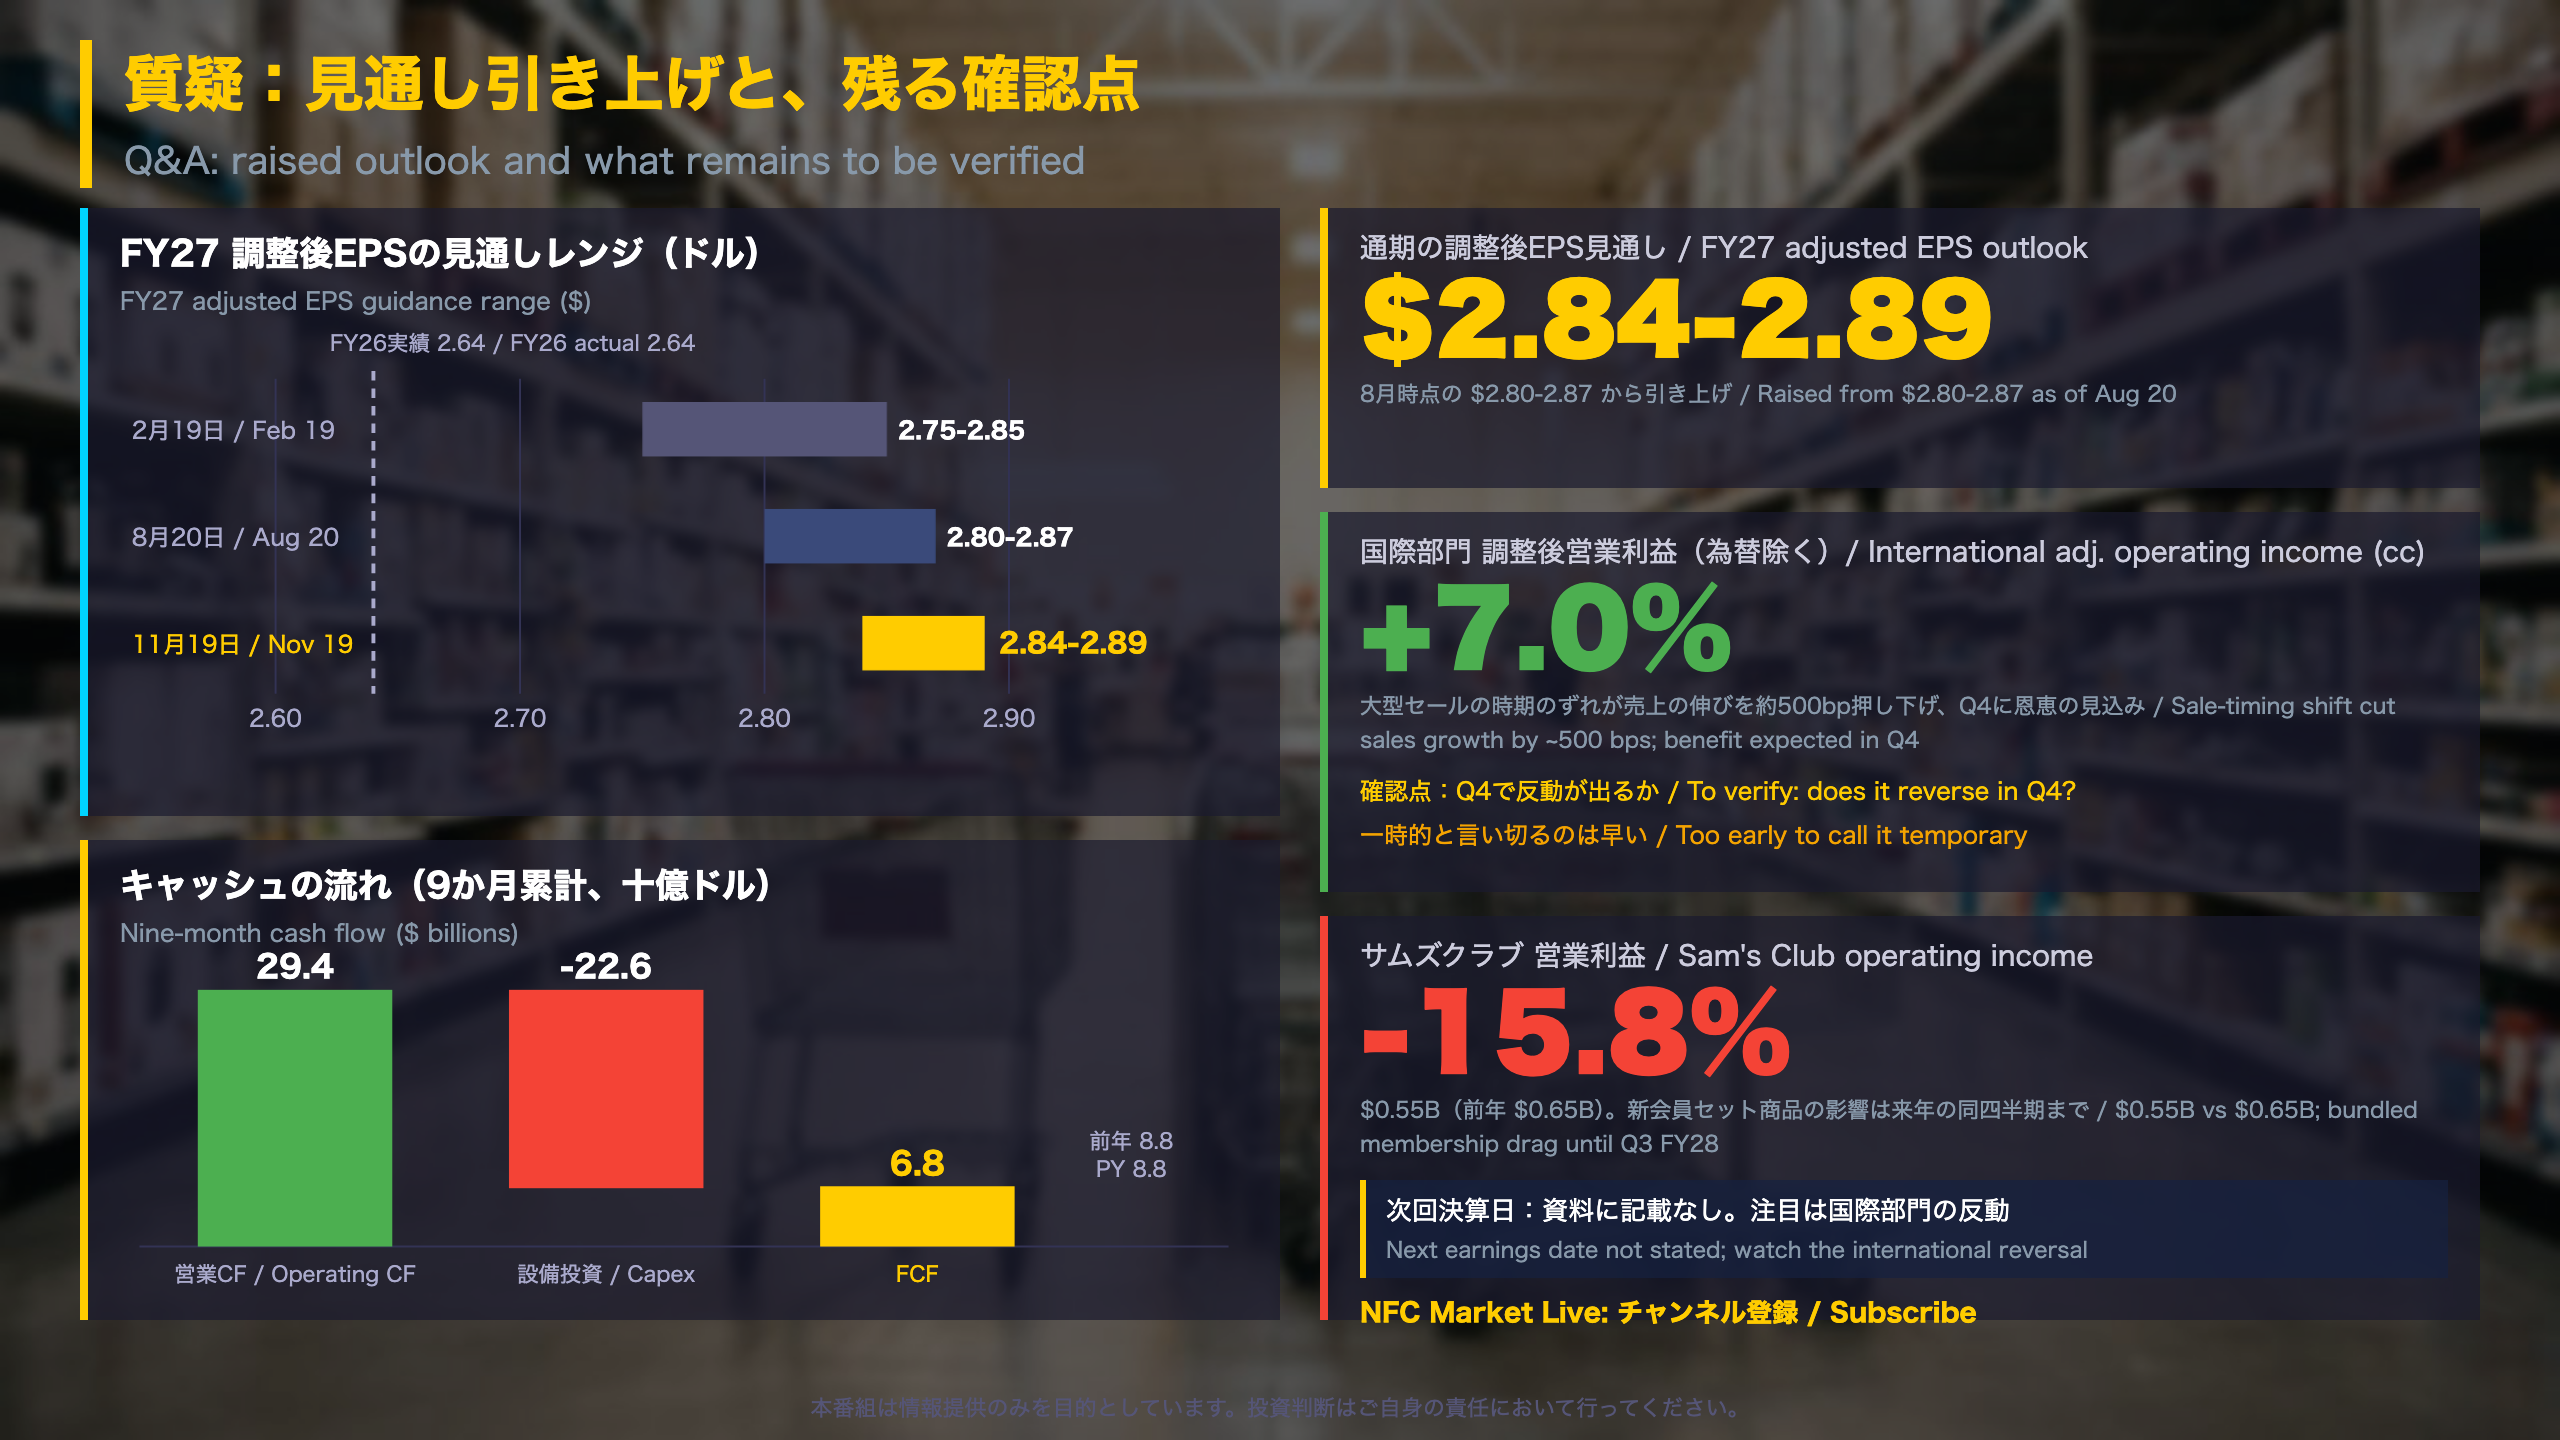
Outlook, cash flow and what remains to be verified
Guidance evolution for FY27
Adjusted EPS guidance moved from $2.75-2.85 (Feb 19) to $2.80-2.87 (Aug 20) and now $2.84-2.89, on a prior-year base of $2.64. Net sales growth in constant currency is now guided at 4.9-5.2% and adjusted operating income growth at 8.0-8.6%. Capital expenditure remains at roughly 4.0% of net sales, up from the original 3.5%.
International timing effect
Walmart International net sales grew 3.3% in constant currency, with adjusted operating income up 7.0%. Flipkart’s Big Billion Days, India’s annual online sales festival, fell outside the quarter and cut sales growth by about 500 bps, with a corresponding benefit expected in Q4. China net sales grew 28.5% and Canada 6.2% (constant currency), while operating income fell in Mexico and Canada due to investments.
Cash and balance sheet
Nine-month operating cash flow was $29.4 billion (+$2.0B). After $22.6 billion of capex, free cash flow was $6.8 billion versus $8.8 billion a year earlier. Inventory rose 8.1%; excluding Flipkart’s pre-event build and fuel at Sam’s Club, inventory is growing in line with or slower than sales, per the company. Walmart issued $6.5 billion of long-term debt and repurchased $2.7 billion of shares in the quarter.
Sam’s Club
Operating income fell 15.8% to $547 million, hit by lapping last year’s breakage income, a LIFO charge and the allocation of fees from the new bundled membership, which the company says will weigh until it is lapped in Q3 FY28.
Balanced reading
Two straight guidance increases signal confidence, but investors should verify the Q4 reversal and the capex-driven cash flow decline. The release gives no date for the next report.
Disclaimer: This article is for informational purposes only. All investment decisions are made solely at your own risk.