This article was automatically generated by the NFC Market Live AI analysis system. (Updated: 2026-11-16 22:35 JST)
📄 Primary Source
Statistics Canada
https://www150.statcan.gc.ca/n1/daily-quotidien/261116/dq261116a-eng.htm
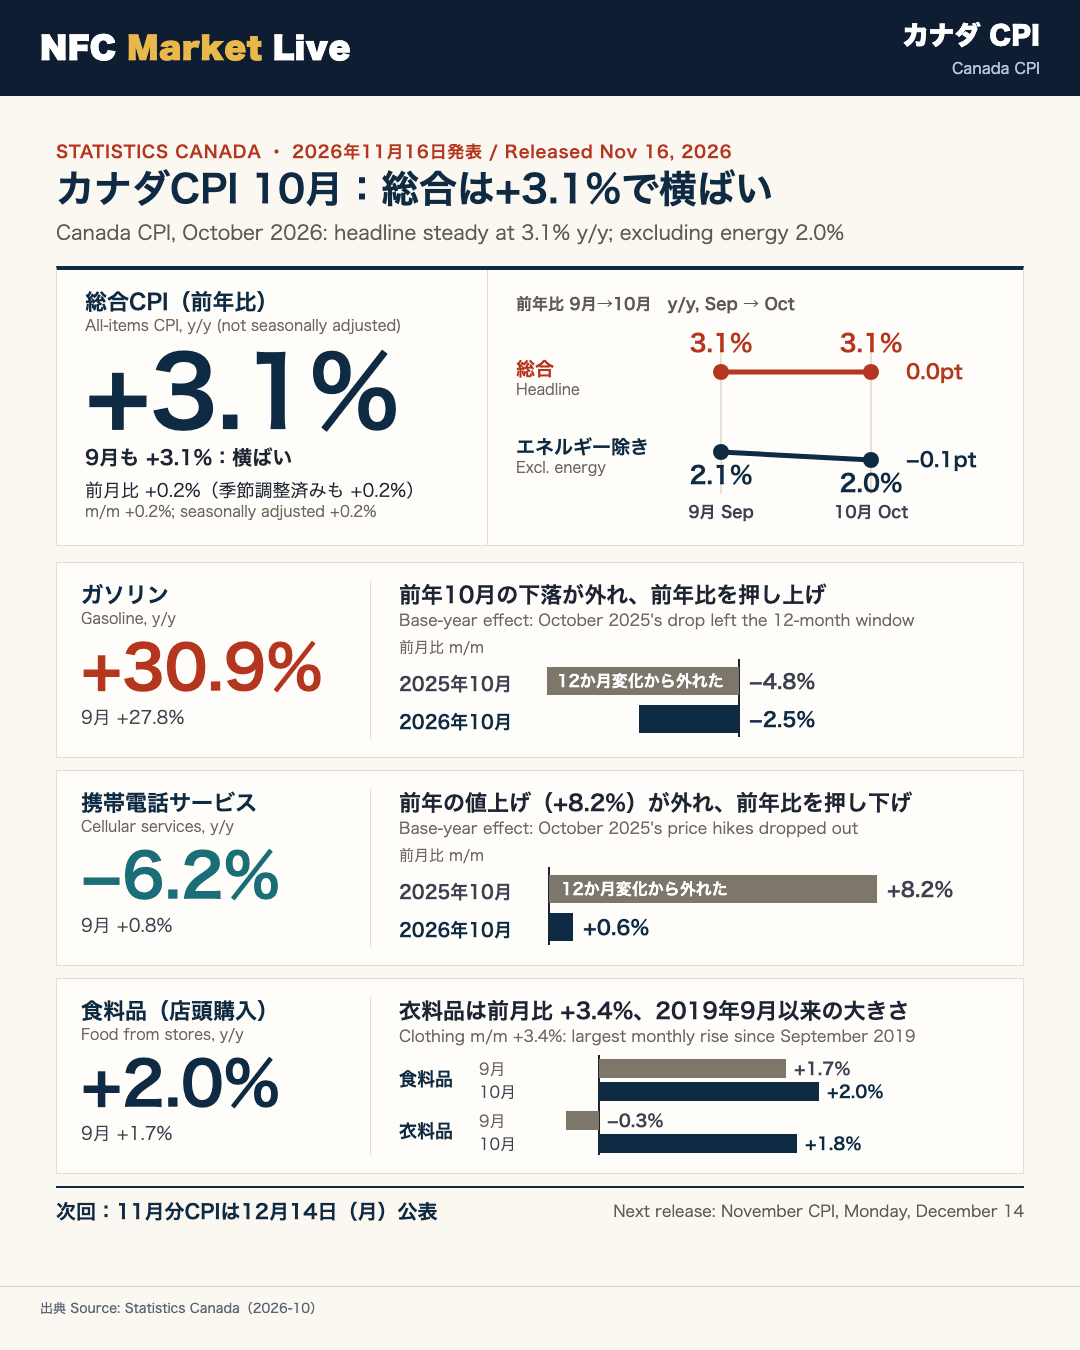
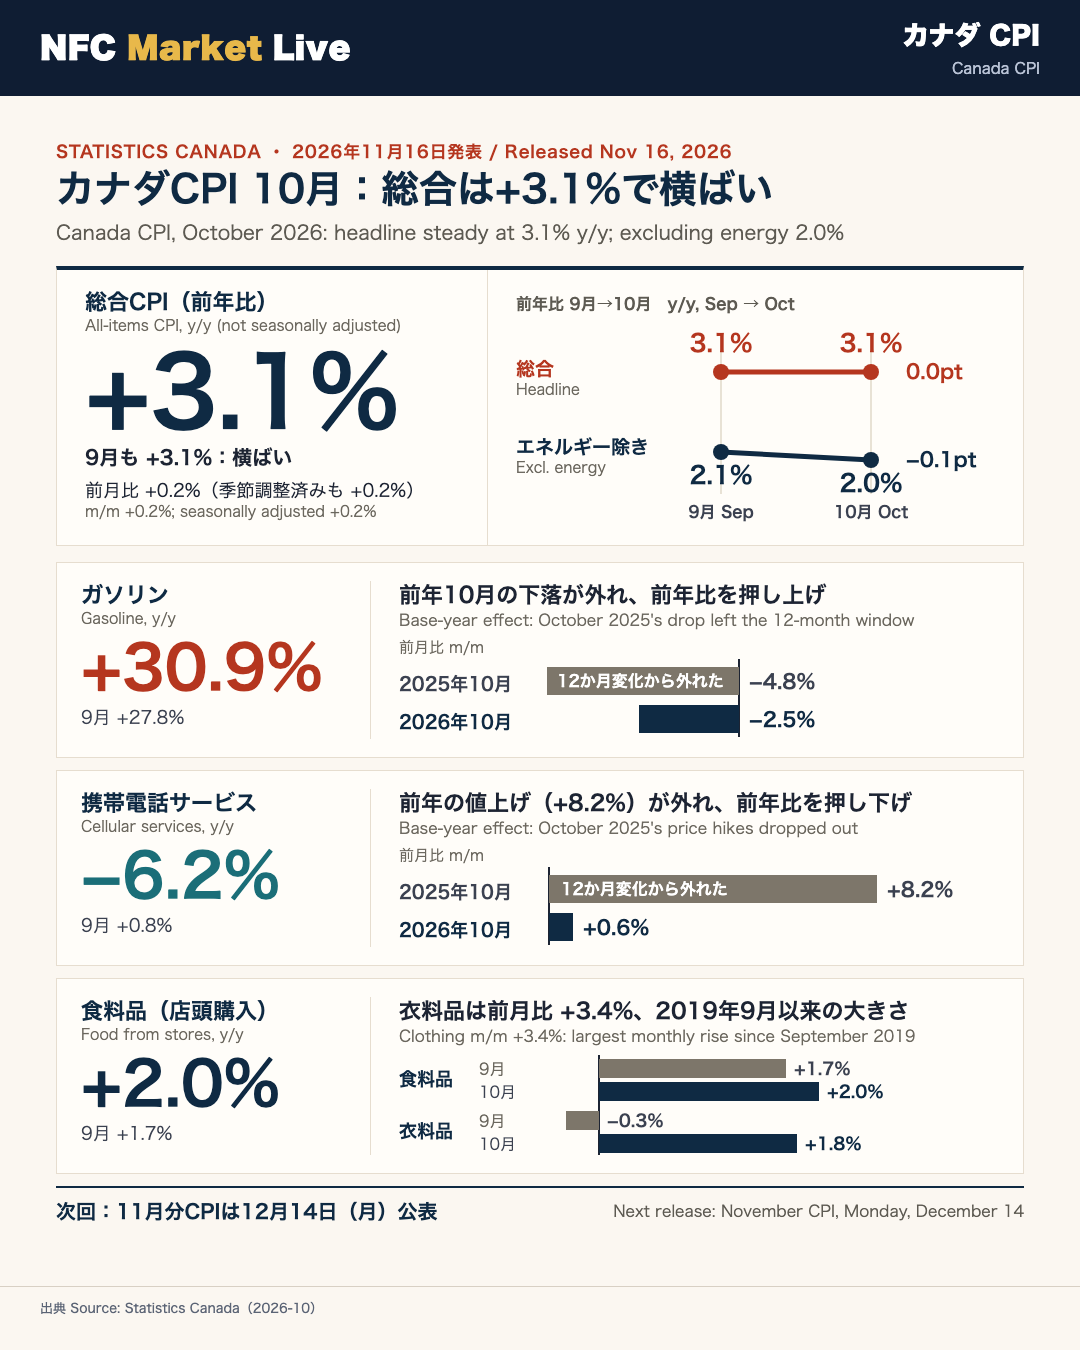
Statistics Canada released the October 2026 Consumer Price Index on November 16. The CPI rose 3.1% year over year, the same pace as in September. It increased 0.2% month over month, and 0.2% on a seasonally adjusted monthly basis. Excluding energy, the CPI rose 2.0%, after 2.1% in September.
Upward pressure was broad-based, coming from natural gas, gasoline, groceries and clothing. Cell phone plans and slower rent growth pulled the other way.
Gasoline prices rose 30.9% year over year, up from 27.8% in September, partly because the 4.8% monthly drop in October 2025 no longer affects the 12-month change. Gasoline fell 2.5% month over month. Grocery prices rose 2.0%, up from 1.7%, led by fresh vegetables (+1.4%), though grocery inflation stayed below the all-items CPI for a third month. Clothing rose 1.8% year over year and 3.4% month over month, the largest monthly gain since September 2019. Cellular services fell 6.2% year over year because of a base-year effect from the 8.2% monthly increase in October 2025.
Property taxes rose 3.8% nationally, and prices rose more slowly in five provinces. The November CPI will be released on Monday, December 14.
総括:総合CPIは3.1%で横ばい、エネルギー除きは2.0%
Canada CPI, October 2026: The Big Picture
Statistics Canada reported on November 16 that the Consumer Price Index rose 3.1% year over year in October, matching September. Month over month the CPI rose 0.2%, and also 0.2% on a seasonally adjusted basis. Excluding energy, the CPI rose 2.0%, after 2.1% in September.
Who publishes this and why it matters
Statistics Canada is the national statistical agency. Its monthly CPI is the headline inflation gauge in Canada, and the Bank of Canada (BOC) judges it against its 2% inflation target. The BOC also watches its own core measures (CPI-trim, CPI-median, CPI-common). The text provided for this release does not include their values, so this article does not discuss them.
Strengths and weaknesses in the release
- Upward pressure was described as broad-based: natural gas, gasoline, groceries and clothing.
- Downward pressure came from cell phone plans and slower rent growth.
- The ex-energy rate edged down 0.1 percentage point while the headline held steady. This suggests energy prices are lifting the headline relative to the rest of the basket.
Comparison with the US
The US CPI is published by the Bureau of Labor Statistics and is judged against the Fed’s 2% target, which formally uses the PCE price index. The two countries differ in how housing costs are measured. In this release, Canadian shelter inflation was 1.4% year over year, while transportation was 8.9%.
What to watch next
The November CPI is due on Monday, December 14. Several of the October moves reflect base-year effects (gasoline, cellular services, Ontario natural gas), so the details matter for reading the underlying trend. The next slides cover them one by one.
エネルギー:ガソリン+30.9%とベース効果、オンタリオの天然ガス
Energy: Gasoline Up 30.9% and Base-Year Effects
Gasoline
Gasoline prices rose 30.9% year over year in October, up from 27.8% in September. Statistics Canada says part of this is a base-year effect. In October 2025, crude oil prices were lower on oversupply concerns, and gasoline fell 4.8% month over month. That drop has now dropped out of the 12-month window, which puts upward pressure on the year-over-year rate.
On a monthly basis, however, gasoline fell 2.5% in October 2026. The agency notes that price levels remain elevated amid continued uncertainty over geopolitical conflicts in the Middle East and Ukraine.
What is a base-year effect?
Year-over-year inflation compares today’s price level with the same month a year earlier. If prices dropped sharply a year ago, that drop no longer subtracts from the current 12-month change, and the annual rate jumps even if prices are flat or falling month to month. This is why the 30.9% annual figure and the -2.5% monthly figure can both be true.
Transportation and natural gas
The transportation component rose 8.9% year over year. The release does not give a full breakdown here, but the size of the gasoline move is consistent with it.
In Ontario, natural gas prices rose 3.0% year over year after falling 18.7% in September. A one-time rate increase in July 2025 was reversed in October 2025, with prices down 22.4% month over month, and that decline has now left the 12-month calculation. Slower growth in Ontario property taxes (+3.3%) and rent (+1.1%) offset this.
International comparison
In the US CPI, energy is also a key swing factor in headline readings. Canada’s ex-energy CPI of 2.0% against a headline of 3.1% shows how much energy matters in this release. Whether the base effects continue is a question for the November data due December 14.
食料品と衣料品:伸びが加速した2つの品目
Groceries and Clothing: Two Categories That Accelerated
Groceries
Prices for food purchased from stores rose 2.0% year over year in October, up from 1.7% in September, after four consecutive months of slower price growth. The acceleration was led by fresh vegetables (+1.4% after -2.9% in September), with sugar and confectionery (+0.4%) and condiments, spices and vinegars (+2.6%) also contributing.
Still, this was the third consecutive month in which grocery inflation ran below the all-items CPI. Compared with October 2020, grocery prices are up 31.9%, a reminder that slower inflation does not mean lower prices.
Clothing
Clothing prices rose 1.8% year over year after falling 0.3% in September. Women’s clothing was up 2.2% and men’s clothing 1.4%. Month over month, clothing rose 3.4%, the largest monthly increase since September 2019 (+5.3%). Statistics Canada notes the increase coincided with higher shipping costs. A single month of data cannot show whether this persists.
Balanced read
- Softer side: grocery inflation remains below headline, and the acceleration is modest.
- Firmer side: the clothing jump is the largest monthly rise in seven years.
Our view (analyst’s interpretation, not stated in the release): the fresh vegetable swing from -2.9% to +1.4% may be a one-month move, so the November data will be useful to check.
Context for global readers
In the US CPI, food at home is tracked in a similar way. Canadian grocery prices attract political attention, and Statistics Canada has even produced a podcast on why food inflation is hard to crack. The comparison with 2020 (+31.9%) shows the cumulative price level effect that sits behind the monthly rates.
携帯料金・地域別・固定資産税:ベース効果と地域差
Cellular Services, Regional Highlights and Property Taxes
Cellular services: a base-year effect in reverse
Cellular service prices fell 6.2% year over year in October after rising 0.8% in September. Several wireless providers raised plan prices in October 2025, when prices rose 8.2% month over month. That jump has dropped out of the 12-month comparison, pulling the annual rate down. On a monthly basis, cellular prices actually rose 0.6% in October 2026. The annual decline therefore reflects a high comparison base, not a fall in prices this month.
Regional picture
Year over year, prices rose at a slower pace in five provinces in October than in September. In British Columbia, the slowdown was mainly due to slower rent growth.
Property taxes
Property taxes and other special charges are priced annually in October. Nationally they rose 3.8%, compared with 5.6% in October 2025.
- Manitoba: +4.5% in 2026 versus +19.5% in 2025, when higher sewer and garbage fees in Winnipeg contributed.
- Newfoundland and Labrador: +5.9% in 2026 versus +2.6% in 2025, the sharpest acceleration.
Statistics Canada lists four drivers: assessed value of homes and land, municipal and provincial tax rates, charges for specific services such as wastewater and garbage, and homeowner tax rebates.
Why this matters for interpretation
Gasoline, cellular services and Ontario natural gas all show the same pattern: a large move a year ago falls out of the 12-month window. When several components behave this way, the headline year-over-year rate can swing for mechanical reasons. This is a statistical point, and it explains why economists often look at monthly changes and core measures alongside the headline.
まとめと次回:何が確認でき、何が未確認か
Wrap-Up: What the Release Shows and What It Does Not
Confirmed facts
- Headline CPI: +3.1% year over year, unchanged from September; +0.2% month over month.
- CPI excluding energy: +2.0%, down from 2.1%.
- Groceries (+2.0%) and clothing (+1.8%) accelerated from September.
- Cellular services (-6.2%) and property taxes (+3.8%, versus +5.6% a year earlier) showed slower growth.
Two readings, side by side
| View | Supporting data |
|---|---|
| Price pressure remains | Gasoline +30.9%, transportation +8.9%, groceries accelerating |
| Underlying trend is calmer | Ex-energy +2.0%, shelter +1.4%, slower growth in five provinces |
A single month cannot settle which reading dominates.
Bank of Canada perspective (regime-model note)
The BOC sets policy against a 2% inflation target and focuses on its core measures: CPI-trim, CPI-median and CPI-common. The text of this release as provided does not contain their values, so their distance from 2% cannot be assessed here. The headline held at 3.1% and the ex-energy rate eased by 0.1 point. This is a small change in direction and, by itself, not enough to call a regime shift among hawkish, neutral or dovish states. That judgment needs the core measures in Table 4 (analyst’s view, not a statement from the release).
Market context
For international readers, the Canadian dollar is often sensitive to BOC expectations, and the core measures are the data that matter most for that. We do not forecast market moves here.
Next release
The November CPI will be published on Monday, December 14. Watch gasoline, cellular services and Ontario natural gas as the base effects roll off, and whether the grocery acceleration persists.
Disclaimer: This article is for informational purposes only. All investment decisions are made solely at your own risk.