This article was automatically generated by the NFC Market Live AI analysis system. (Updated: 2026-11-05 22:37 JST)
📄 Primary Source
Bank of England
https://www.bankofengland.co.uk/monetary-policy-report/2026/november-2026
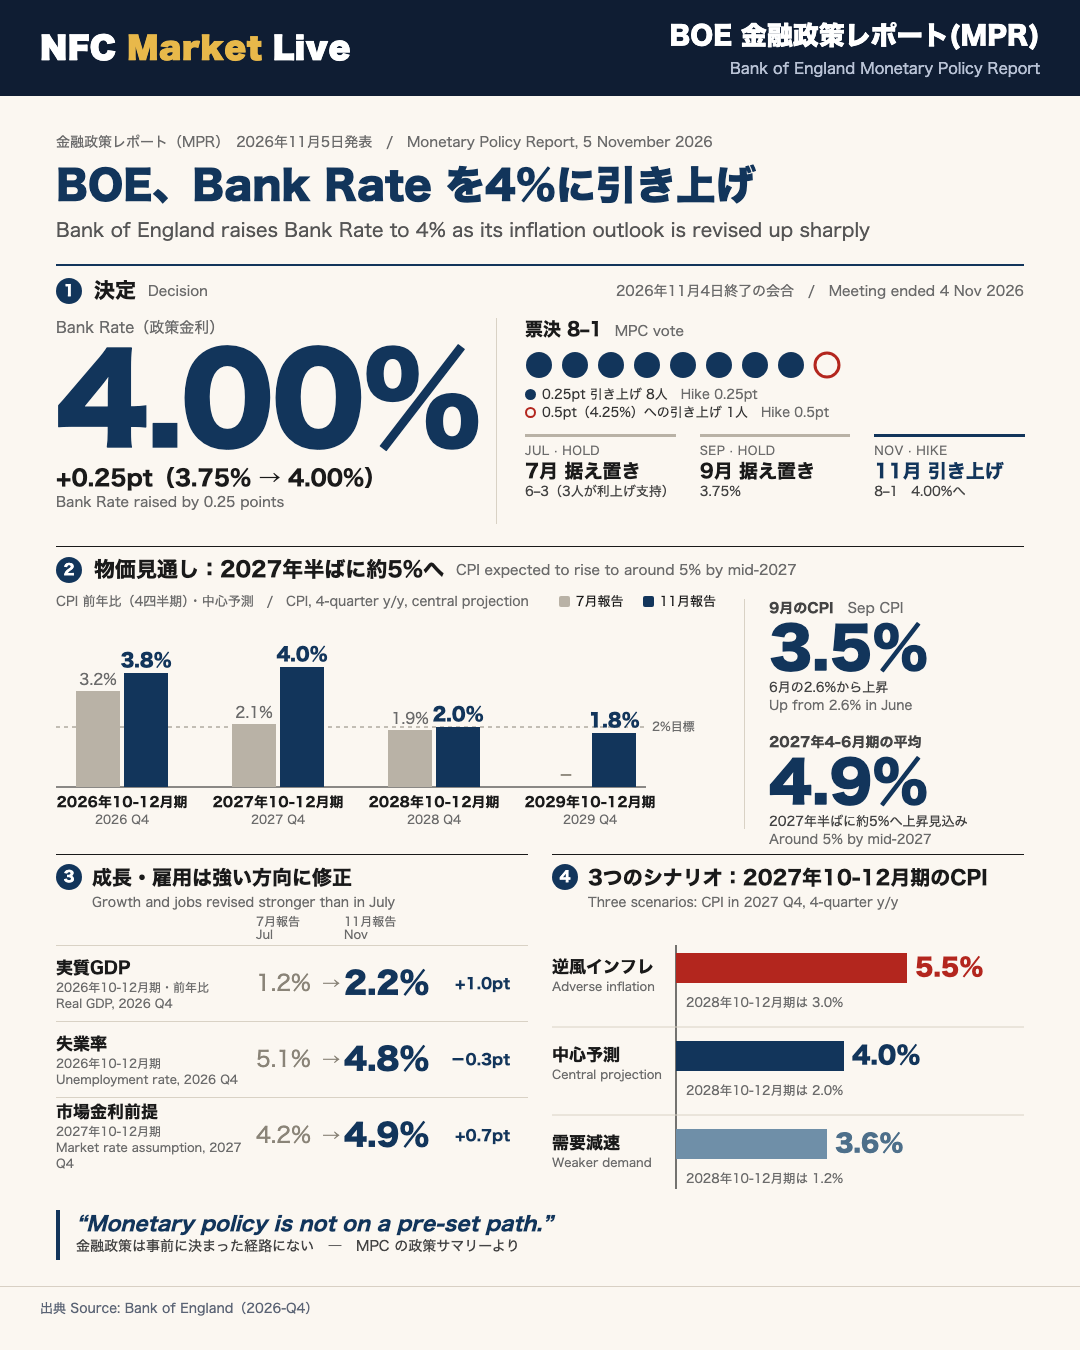
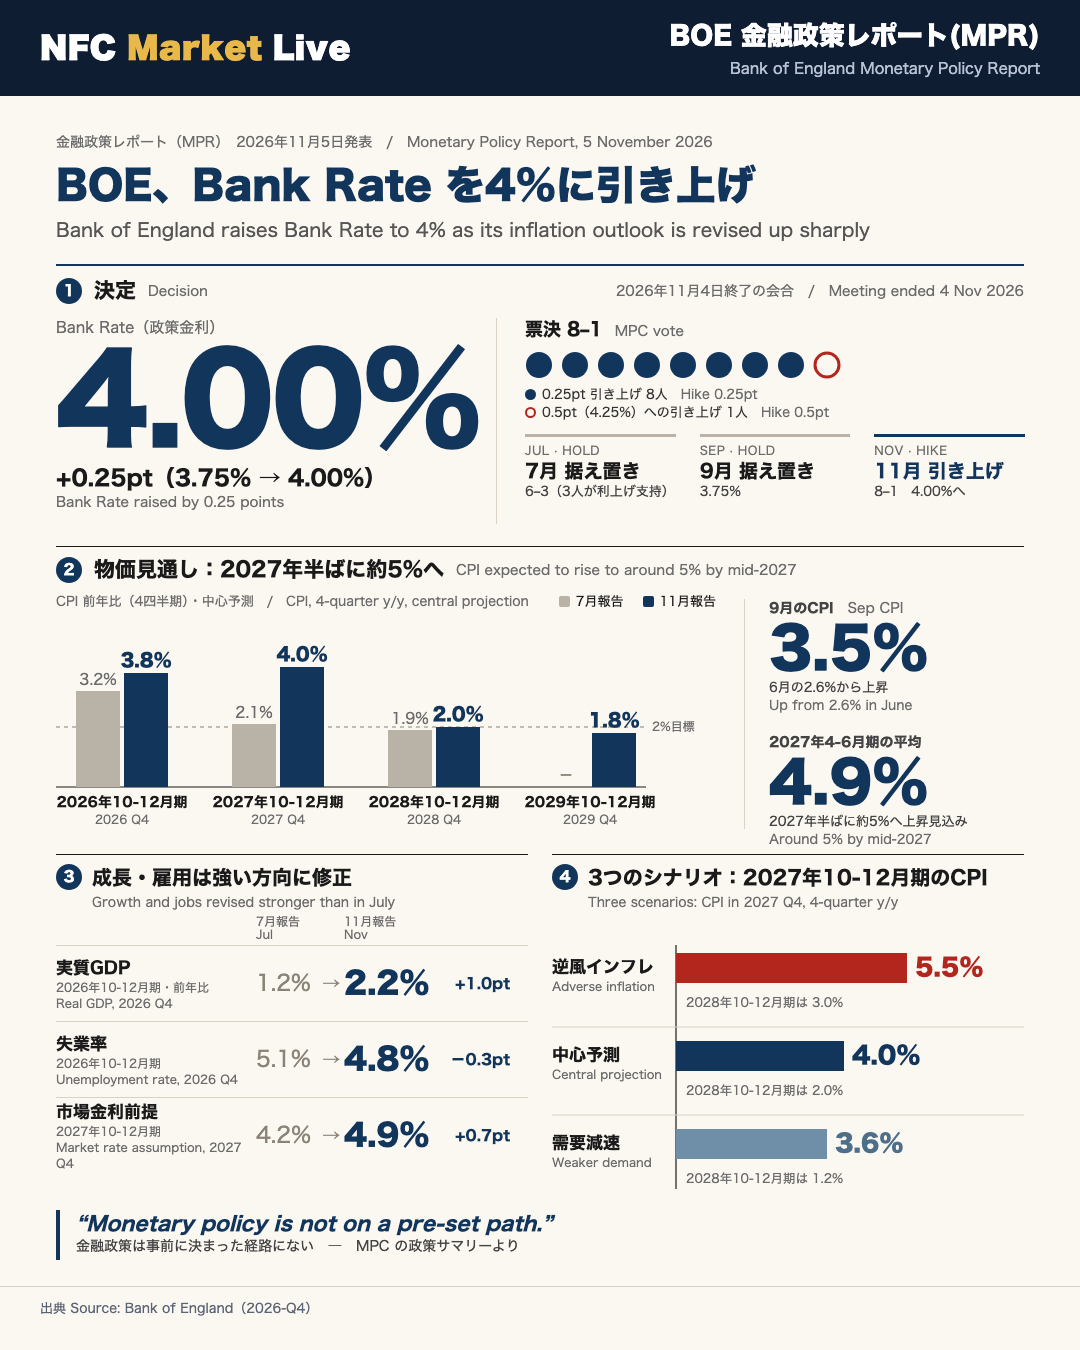
The Bank of England published its November 2026 Monetary Policy Report on November 5. The Monetary Policy Committee voted 8-1 to raise Bank Rate by 0.25 percentage points to 4%; one member preferred a 0.5-point rise to 4.25%. The Bank says the Middle East conflict is in its ninth month and global energy prices have kept rising from an already elevated level. CPI inflation was 3.5% in September and is expected to rise to around 5% by mid-2027 before falling as energy effects fade and restrictive policy bears down on prices. In the central projection, CPI is 3.8% in 2026 Q4 (3.2% in July) and 4.0% in 2027 Q4 (2.1%). Four-quarter GDP growth is 2.2% in 2026 Q4 (1.2%) and 1.0% in 2027 Q4 (1.4%), while unemployment is 4.8% in 2026 Q4 (5.1%). The Committee notes that activity has been stronger than expected and the labour market is stabilising, but evidence of knock-on effects on other prices and wages remains limited. It judges the inflationary pressure in the pipeline sufficient to warrant a rise. Policy is not on a pre-set path. In the adverse inflation scenario CPI reaches 5.5% in 2027 Q4; in the weaker demand scenario it is 3.6%. The ONS is due to publish quarterly productivity estimates on November 17.
サマリー:Bank Rate 4%へ、物価見通しは大幅上方修正
What the Bank of England decided
The Monetary Policy Committee (MPC), the nine-member body that sets UK interest rates, voted 8-1 on November 4 to raise Bank Rate by 25 basis points to 4%. One member voted for a 50-basis-point rise to 4.25%. In July the Committee had held at 3.75% by 6-3, with three members already favouring a hike, and it held again in September.
How the central projection shifted
| Four-quarter rate | July Report | November Report |
|---|---|---|
| CPI, 2026 Q4 | 3.2% | 3.8% |
| CPI, 2027 Q4 | 2.1% | 4.0% |
| GDP, 2026 Q4 | 1.2% | 2.2% |
| Unemployment, 2026 Q4 | 5.1% | 4.8% |
| Market-implied Bank Rate, 2027 Q4 | 4.2% | 4.9% |
Reading the balance
The upgrade to inflation is driven mainly by energy. The Bank says the conflict in the Middle East is now in its ninth month and global energy prices have risen further. Yet the report also contains clearly positive news: activity has been stronger than expected, the labour market is stabilising, and there is still limited evidence of knock-on effects on wages and other prices. On the other side, real household incomes are projected to fall and housing activity has weakened.
Why it matters for non-UK readers
The Monetary Policy Report is the Bank’s quarterly document that sets out the economic analysis behind the rate decision. Unlike the Fed’s Summary of Economic Projections, it publishes a full central projection, two scenarios and illustrative policy rules. The report notes that the Federal Reserve raised its target range to 3.75%-4.00% and the ECB raised its deposit rate to 2.50% in September. The Bank’s own 2% CPI target is unchanged.
Stance on the path ahead
The Committee stresses that policy is not on a pre-set path and that it will adjust Bank Rate as necessary to return CPI inflation to 2% in the medium term. This summary does not forecast asset prices; it sticks to what the report states.
インフレ:エネルギー主導で2027年半ばに約5%へ
Where inflation stands
UK CPI inflation rose from 2.6% in June to 3.5% in September, 0.4 percentage points above the Bank’s July projection. The Office for National Statistics (ONS) publishes the CPI; the Bank targets 2%. Motor fuel prices rose instead of easing as had been projected. Diesel and petrol pump prices are roughly 40% and 30% above pre-conflict levels.
The projection path
The central projection has CPI at 3.8% in 2026 Q4 (July: 3.2%), 4.0% in 2027 Q4 (2.1%), 2.0% in 2028 Q4 (1.9%) and 1.8% in 2029 Q4. Inflation averages 4.9% in 2027 Q2. Direct energy effects contribute around 1.4 percentage points in 2027 Q1, with indirect effects of about 0.5 points.
Energy inputs
- Brent futures averaged $108 per barrel over the 15 working days to October 27, about 70% above the run-up to the February Report.
- UK wholesale gas futures were around 65% above the July Report level.
- The Ofgem household price cap rose to £1,723 in Q4 and is expected to reach about £2,150 in 2027 Q1.
Why the pass-through looks muted so far
The Bank’s Agents report greater use of fixed-price contracts and hedging than before the 2022 shock, and the Decision Maker Panel (DMP) survey shows firms absorbing part of the costs through lower margins. Food inflation was just 1.3% in September, yet is projected to reach about 4¾% by mid-2027 as hedges expire. The report itself flags that the near-term outlook is highly uncertain.
International context
The report highlights AI-related demand for chips pushing up Asian export prices, which also nudges UK core goods inflation toward above 2½% in 2027 Q2. Budget 2026 measures are estimated to reduce CPI by about a quarter of a point in that quarter before unwinding the following year. This section sticks to the report’s own figures and does not forecast market prices.
成長・内需:想定を上回る底堅さと、今後の減速見通し
Stronger than the Bank expected
Quarterly GDP growth was 0.5% in Q2 and is estimated at 0.7% for Q3, well above July’s projections of 0.3% and 0.1%. Annual data revisions (Blue Book 2026) also raised the level of GDP in Q2 by 0.5%. Annual growth for 2026 is now 1.6% (July: 1.1%), but 2028 was cut to 1.2% from 1.7%.
What drove the resilience
- Business-to-business services: contributed 0.6 points of the 0.7% three-month growth to August.
- Business investment: up 1.8% in Q2 after 3% in Q1, the fastest two-quarter growth since 2022. The 2026 annual figure moved to 4.3% from -1.5%.
- AI-related activity: Bank staff estimate that novel AI-related activity accounts for just under a fifth of GDP growth since the start of 2026.
- Global demand: UK-weighted world growth of 2.3% in Q2 was 0.4 points above the July expectation.
Headwinds in the pipeline
Real post-tax household income is projected to fall by 0.1% in 2026 and 0.6% in 2027. The household saving ratio is expected at 8.0% in 2026 (July: 8.8%), suggesting households are smoothing consumption by saving less. Mortgage approvals fell 8% in the three months to September, the lowest since 2023, and the GfK consumer confidence index fell sharply in October. The Office for Budget Responsibility sees public borrowing falling from 4.2% of GDP in 2026-27 to 1.8% in 2031-32, which the Bank judges will weigh on the output gap.
Interpretation
The Bank says some of the support, including the waning drag from earlier tightening, is unlikely to continue given the recent tightening in financial conditions. Its drag estimate from higher energy prices on the level of GDP is around a quarter of a per cent by mid-2027. Comparable US dynamics: the July Report noted that AI-related investment accounted for as much as a fifth of US GDP growth, showing a similar theme across economies. The report does not forecast asset prices, and neither does this summary.
労働市場・賃金:失業率は低下、賃金は高止まり気味
Labour market: steadier than expected
The LFS unemployment rate fell to 4.7% in the three months to August from 4.9% in the July Report’s data, lower than the Bank projected. The report cautions that the latest single-month estimate has been notably volatile and that the Labour Force Survey suffers from low response rates. Employment growth rose to 0.3% on the three-month measure, and Bank staff’s survey-based underlying measure improved to 0.2%. HMRC payroll data, however, still show some weakness in private sector payrolled employees.
The margin of spare capacity is judged stable at around 1% of potential GDP.
Unemployment path
Annual average unemployment is projected at 4.8% in 2026 (July: 5.0%), 4.9% in 2027 (5.3%), 5.1% in 2028 (5.2%) and 5.0% in 2029. Lower projected population growth owing to lower net migration is one reason a modest employment recovery is now consistent with stable unemployment.
Wages
Private sector regular average weekly earnings (AWE) grew 3.0% in August. The projection is 3.2% in 2026 Q4 (July: 3.0%) and 3.5% in 2027 Q4 (3.1%). Other gauges run higher: the Decision Maker Panel (DMP) and Indeed Wage Tracker point to around 4%, though part of the gap with AWE reflects compositional shifts toward lower-paid industries. Firms expect wage growth to fall from 3.9% to 3.4% in a year, while the Bank’s Agents report 2027 pay settlements stable at 3.6%. The National Living Wage will rise 3.9% in April 2027, versus 4.1% in April 2026.
The second-round question
Box A concludes that price- and wage-setting indicators are not currently signalling large second-round effects, but warns this does not rule them out and that the risk has increased. Inflation is increasingly cited as a driver of wage expectations, though less than in 2023. An Agents’ pay survey estimate for 2027 settlements should be available before the December MPC meeting.
Productivity note
The ONS’s new component approach lifts estimated output-per-hour growth over 2009-24 to close to 1% a year from about 0.5%. The Bank judges recent strength mostly cyclical; firms estimate AI has added about 0.1-0.2 points a year to productivity growth since early 2024. This is analysis of the report’s contents, not a market forecast.
政策金利・金融環境とシナリオ:中心予測と2つの分岐
Financial conditions
Based on the 15 working days to October 27, the UK forward OIS curve, which the Bank calls the market curve, was around 60 basis points higher than at the July Report on average over the next three years and about 120 basis points above pre-conflict levels. It rises to around 4.9% by end-2027 before falling to about 4.7% by late 2029. The Bank’s Market Participants Survey median expects Bank Rate at 4% in November, 4.25% in February and 3.5% two and three years ahead; the gap versus the curve suggests risk premia are contributing to its upward slope.
Overseas, the ECB raised its deposit rate to 2.50% and the Fed raised its target range to 3.75%-4.00% in September, according to the report.
Scenarios at 2027 Q4 (four-quarter rates)
| Central | Adverse inflation | Weaker demand | |
|---|---|---|---|
| CPI | 4.0% | 5.5% | 3.6% |
| GDP | 1.0% | 0.8% | 0.3% |
| Unemployment | 5.0% | 5.1% | 5.3% |
| Private AWE | 4.0%-class: 3.5% | 4.5% | 2.8% |
By 2028 Q4 CPI is 2.0%, 3.0% and 1.2% respectively.
What differs between them
The adverse scenario assumes oil around 30% higher and gas a little over 50% higher than the central path, with stronger second-round effects. The weaker demand scenario keeps the same energy path but assumes households and firms run out of buffers, so spare capacity prevents second-round effects. All three are conditioned on the same market curve for Bank Rate.
Illustrative policy rules
These rules inform but do not dictate decisions. In the central projection they are broadly similar to the market curve near term and somewhat lower later; they have risen 0.6-0.9 points on average over 2027-29 since July. In the adverse scenario the model-based path is 0.7 points higher and the Taylor-type rule 0.3 higher than central; in the weaker demand scenario they are 0.5 and 0.2 lower. The fan charts reflect only historical forecast errors and no longer include a skew.
Note on scope
This is a description of the Bank’s published analysis. It does not extend to asset-price forecasts, which the report does not provide.
次に確認すべき点:資料が示す分岐のサイン
Scope of this section
This section does not forecast market moves. It lists the indicators through which the report’s scenarios can be tracked, using only facts stated in the report.
1. Energy prices and pass-through
The central projection is conditioned on futures curves. The report says prices could rise if the conflict worsens or fall faster than futures imply if there is a durable resolution. Lower global inventories (European gas storage below its 2018-25 average, and the US Strategic Petroleum Reserve at its lowest in decades) leave a smaller buffer against new supply shocks. As fixed-price contracts and hedges expire, firms’ costs are expected to be affected more widely. Food CPI is projected near 4¾% by mid-2027, and El Niño plus European droughts could add about 2 percentage points to food inflation at its 2028 H2 peak, though the Bank calls the estimate highly uncertain and not additive to the central projection.
2. Second-round indicators
Table A.1 in Box A tracks initial conditions, price-setting and wage-setting. Today most indicators are only slightly higher or stable, but the MPC judges the risk of larger effects has risen. Upcoming evidence includes:
– The Agents’ pay survey: an initial estimate of 2027 settlements should be available for the December MPC meeting.
– DMP survey readings: own-price expectations 4.0% and realised wage growth 3.9% in the latest data.
– Household and business inflation expectations.
3. Durability of demand
The weaker demand scenario hinges on households and firms running out of buffers. Watch real incomes, which are projected to fall, consumer confidence after October’s sharp fall, and mortgage approvals.
4. Scheduled releases
The ONS will publish quarterly productivity estimates under its new component approach, up to 2026 Q3, on November 17, with industry-level data due in February. The report gives no date for the next MPC meeting.
Takeaway
The central projection has CPI at 4.0% in 2027 Q4, returning to 2.0% in 2028 Q4. The Committee states that the path of Bank Rate depends on how the likely strength of inflationary pressures evolves.
Disclaimer: This article is for informational purposes only. All investment decisions are made solely at your own risk.