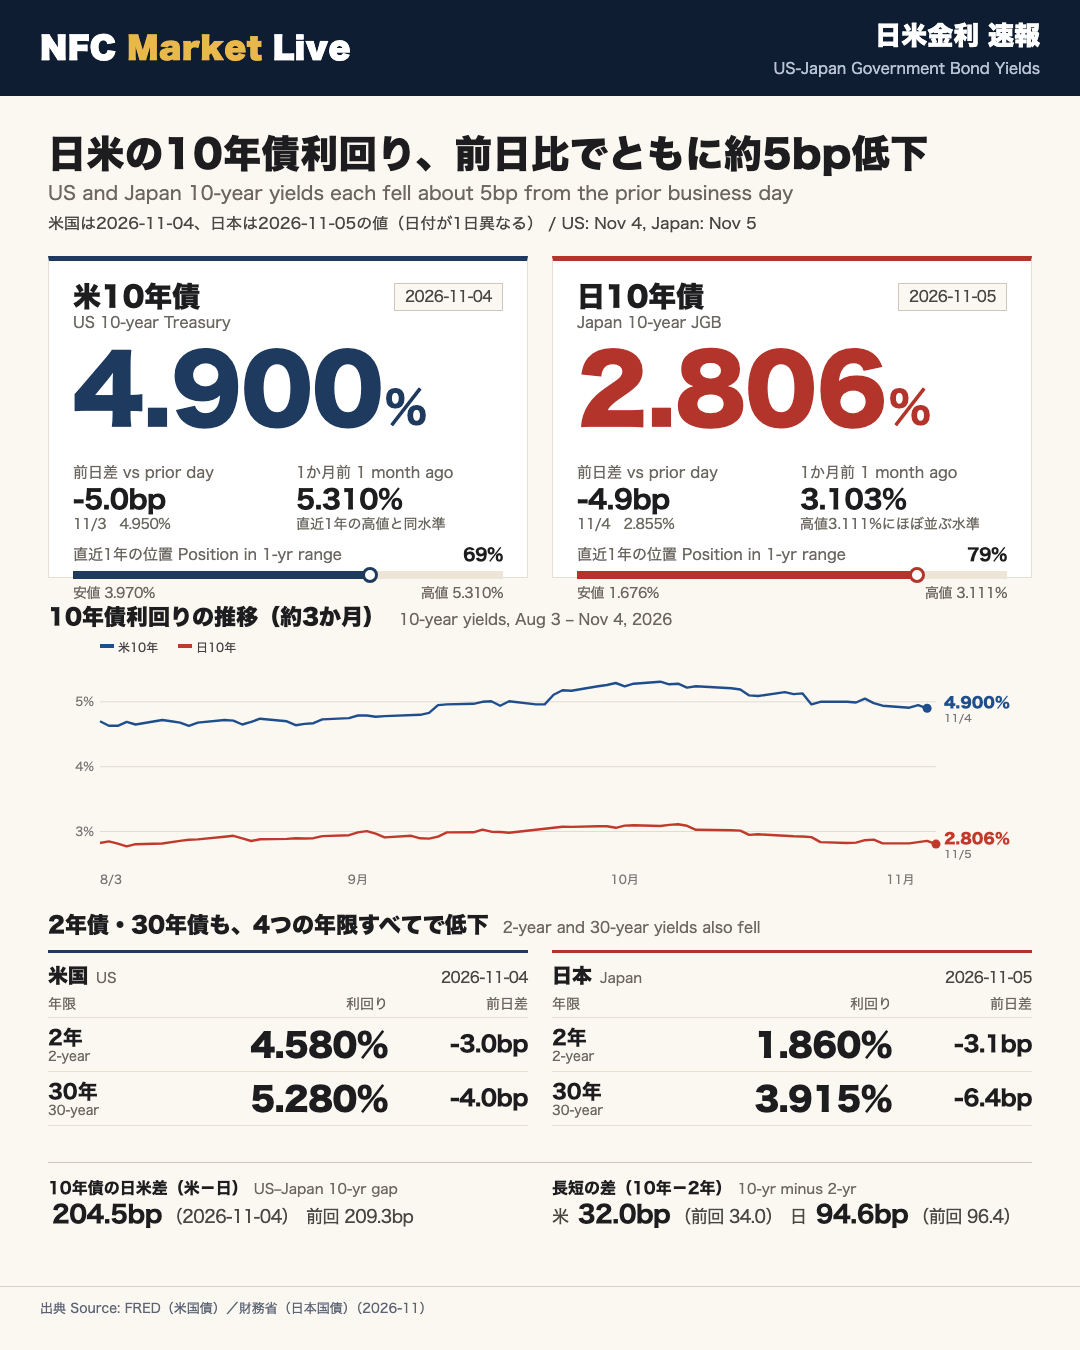
This article was automatically generated by the NFC Market Live AI analysis system. (Updated: 2026-11-06 11:34 JST)
US-Japan Government Bond Yields (Nov 5, 2026 update)
US yields are for Nov 4, 2026. Japan yields are Ministry of Finance figures for Nov 5.
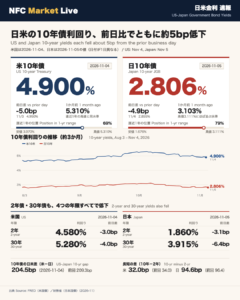
The 10-year yields are the focus. The US 10-year stood at 4.900% on Nov 4, down 5.0bp from 4.950% on Nov 3. It sits at 69% of its past-year range (0% = low, 100% = high). The Japan 10-year was 2.806% on Nov 5, down 4.9bp from 2.855% on Nov 4. It sits at 79% of its past-year range.
2-year and 30-year: US 2-year 4.580% (-3.0bp) and US 30-year 5.280% (-4.0bp), both Nov 4. Japan 2-year 1.860% (-3.1bp) and Japan 30-year 3.915% (-6.4bp), both Nov 5.
Also noted: the US-minus-Japan 10-year gap was 204.5bp on Nov 4, from 209.3bp on Nov 2. The 10-year minus 2-year gap was 32.0bp in the US (Nov 4) and 94.6bp in Japan (Nov 5).
Sources: FRED (originally US Treasury data) and Japan’s Ministry of Finance.
日米の10年債利回り(米4.900%・日2.806%)
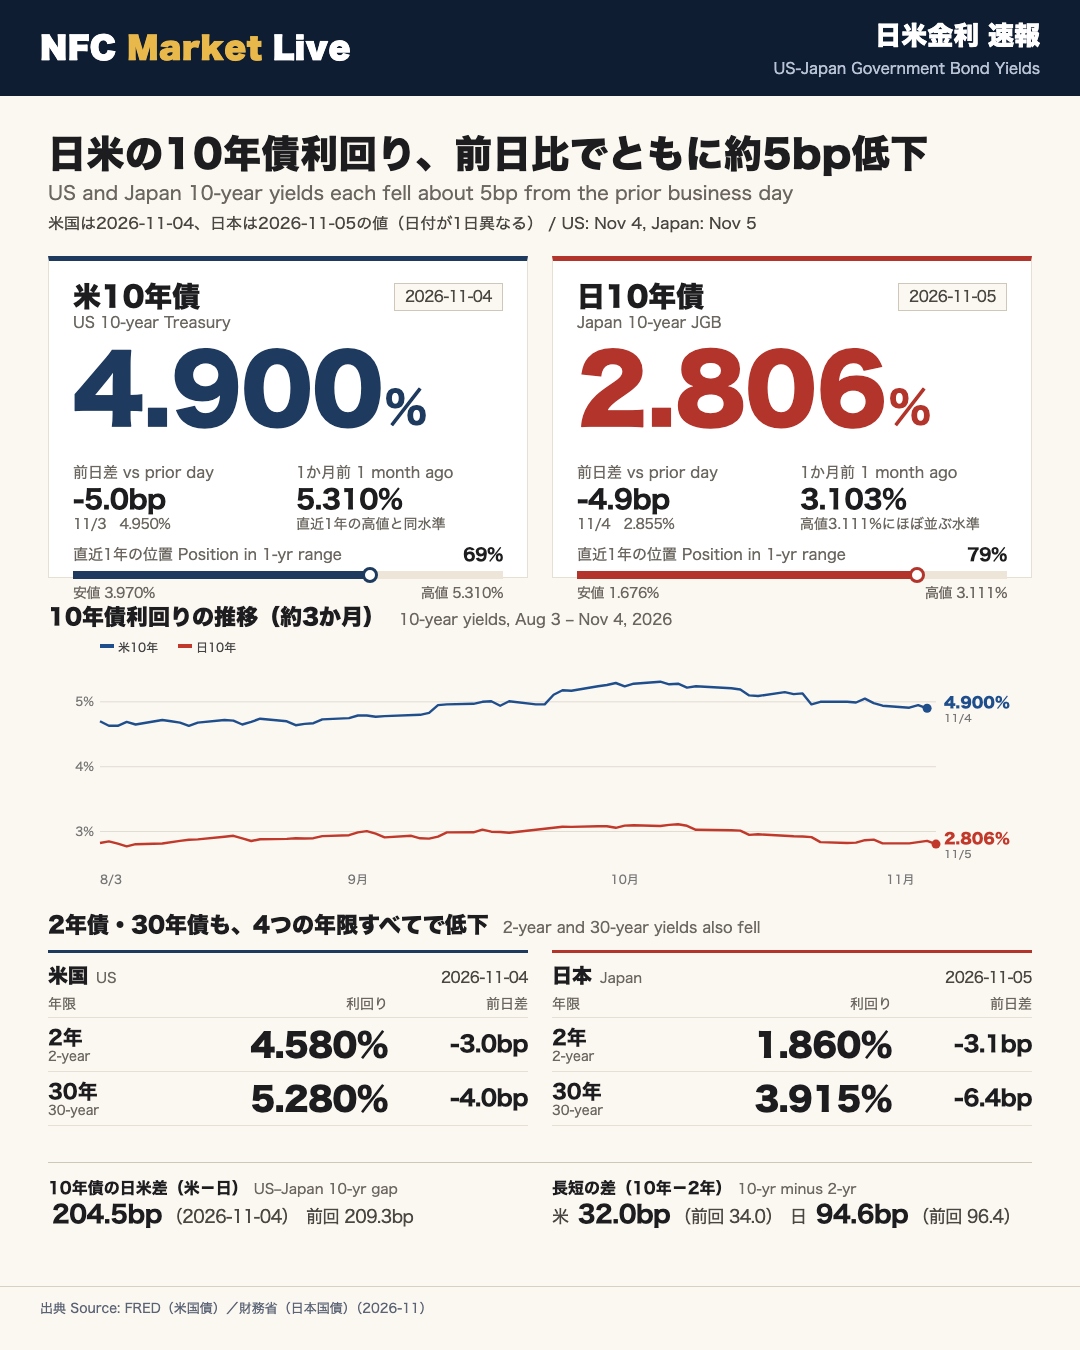
Latest 10-Year Yields in the US and Japan
US yields are for Nov 4, 2026. Japan yields are Ministry of Finance (MOF) figures for Nov 5, 2026. The dates differ by one day, so each number carries its own date.
US 10-year (Nov 4, 2026)
- Yield: 4.900%
- Previous business day (Nov 3): 4.950% (-5.0bp)
- One month ago: 5.310%
- Past-year high: 5.310% (Oct 5, 2026); low: 3.970% (Feb 27, 2026)
- Position within the past-year range: 69% (0% = low, 100% = high)
Japan 10-year (Nov 5, 2026)
- Yield: 2.806%
- Previous business day (Nov 4): 2.855% (-4.9bp)
- One month ago: 3.103%
- Past-year high: 3.111% (Oct 7, 2026); low: 1.676% (Nov 5, 2025)
- Position within the past-year range: 79%
What the data show
| US 10Y | Japan 10Y | |
|---|---|---|
| Latest | 4.900% (Nov 4) | 2.806% (Nov 5) |
| Daily change | -5.0bp | -4.9bp |
| One month ago | 5.310% | 3.103% |
| Range position | 69% | 79% |
- Both 10-year yields declined on the day, by almost the same amount.
- The US 10-year level one month ago equals its past-year high. Japan’s level one month ago (3.103%) is close to its high of 3.111%.
- Japan’s 10-year sits higher within its past-year range (79%) than the US 10-year (69%).
Sources and terms
US data come from FRED, the St. Louis Fed database, which republishes US Treasury figures. Japan data come from the MOF JGB yield page. One basis point (bp) is 0.01 percentage point.
2年債・30年債の水準と前日差
2-Year and 30-Year Yields
These are the shorter and longer maturities that sit beneath the 10-year headline. US figures are for Nov 4, 2026. Japan figures are for Nov 5, 2026.
United States (Nov 4, 2026)
| Maturity | Yield | Change vs Nov 3 | One month ago | Range position |
|---|---|---|---|---|
| 2-year | 4.580% | -3.0bp | 4.840% | 78% |
| 30-year | 5.280% | -4.0bp | 5.660% | 62% |
- US 2-year: past-year high 4.920% (Sep 28, 2026); low 3.380% (Feb 27, 2026).
- US 30-year: past-year high 5.670% (Oct 7, 2026); low 4.640% (Nov 26, 2025).
Japan (Nov 5, 2026)
| Maturity | Yield | Change vs Nov 4 | One month ago | Range position |
|---|---|---|---|---|
| 2-year | 1.860% | -3.1bp | 1.930% | 89% |
| 30-year | 3.915% | -6.4bp | 4.168% | 76% |
- Japan 2-year: past-year high 1.981% (Sep 28, 2026); low 0.928% (Nov 18, 2025).
- Japan 30-year: past-year high 4.168% (Oct 6, 2026); low 3.101% (Nov 5, 2025).
What the data show
- All four yields fell on the day. Japan’s 30-year showed the largest drop (-6.4bp), while the US and Japan 2-year yields each fell by about 3bp.
- Japan’s 2-year is highest within its past-year range (89%). The US 30-year is lowest (62%).
- Japan’s 30-year level one month ago (4.168%) equals its past-year high.
Range position: 0% is the past-year low and 100% is the high. Sources: FRED and Japan’s Ministry of Finance.
補足:10年債の日米差と長短の差
Supplementary Measures
The headline is the level of each country’s 10-year yield. Below are the two supplementary figures in the data: the US-Japan gap and the term spreads.
US-minus-Japan 10-year gap (on days when both are available)
- Nov 4, 2026: 204.5bp
- Previous (Nov 2, 2026): 209.3bp (-4.8bp)
- One month ago: 222.5bp
Japan’s Ministry of Finance publishes JGB yields each business day. Holidays differ between the two countries, so dates sometimes do not line up. The gap is therefore measured on days when both values exist.
Term spread (10-year minus 2-year)
| Latest | Previous | |
|---|---|---|
| US (Nov 4, 2026) | 32.0bp | 34.0bp |
| Japan (Nov 5, 2026) | 94.6bp | 96.4bp |
- The term spread was narrower than the previous reading in both countries.
- Japan’s term spread is larger than the US one.
Date check
- US yields: Nov 4, 2026 (previous business day’s values)
- Japan yields: Nov 5, 2026 (MOF)
- US-Japan gap: Nov 4, 2026 (latest day with both values)
Sources: FRED (originally US Treasury data) and Japan’s Ministry of Finance. The derived figures are this program’s calculations from those sources.
Disclaimer: This article is for informational purposes only. All investment decisions are made solely at your own risk.